AMS – Victorian Electricity Transmission Network Transmission Line Structures (PUBLIC VERSION) Document number AMS 10-77 Issue number 2 Status Approved Approver J. Dyer Date of approval 28/08/2015
Transcript
AMS – Victorian Electricity Transmission Network
Transmission Line Structures
(PUBLIC VERSION)
Document number AMS 10-77
Issue number 2
Status Approved
Approver J. Dyer
Date of approval 28/08/2015
AusNet Services AMS 10-77
Transmission Line Structures
ISSUE 2 28/08/2015 2 / 29
UNCONTROLLED WHEN PRINTED
ISSUE/AMENDMENT STATUS
Issue Date Description Author Approved
0 11/11/11 Draft F. Lirios S. De Silva
0.1 18/06/12 Review and update C. Rabbitte
F. Lirios
1 18/01/13 Review and update C. Rabbitte
F. Lirios
D. Postlethwaite
2 28/08/15 Review and update M. Tan J. Dyer
Disclaimer
This document belongs to AusNet Services and may or may not contain all available information on the subject matter this document purports to address. The information contained in this document is subject to review and AusNet Services may amend this document at any time. Amendments will be indicated in the Amendment Table, but AusNet Services does not undertake to keep this document up to date.
To the maximum extent permitted by law, AusNet Services makes no representation or warranty (express or implied) as to the accuracy, reliability, or completeness of the information contained in this document, or its suitability for any intended purpose. AusNet Services (which, for the purposes of this disclaimer, includes all of its related bodies corporate, its officers, employees, contractors, agents and consultants, and those of its related bodies corporate) shall have no liability for any loss or damage (be it direct or indirect, including liability by reason of negligence or negligent misstatement) for any statements, opinions, information or matter (expressed or implied) arising out of, contained in, or derived from, or for any omissions from, the information in this document.
Contact
This document is the responsibility of the Asset Management division of AusNet Services. Please contact the undersigned or author with any inquiries.
1.1 New Assets:................................................................................................................................................. 4
3.1 Population .................................................................................................................................................... 7
3.2 Age Profile ................................................................................................................................................. 12
3.5 Corrosion Mitigation Program ................................................................................................................... 23
3.6 Fall Arrests Systems ................................................................................................................................. 24
4.1 Failure Probability ...................................................................................................................................... 25
5.1 New Assets................................................................................................................................................ 27
6 Appendix A – Corrosivity Zones on the Victorian Transmission Network .......................... 28
7 Appendix B – Bushfire Consequences on the Victorian Transmission Network ............... 29
AusNet Services AMS 10-77
Transmission Line Structures
ISSUE 2 28/08/2015 4 / 29
UNCONTROLLED WHEN PRINTED
1 Executive Summary
This document defines the asset management strategies for the Victorian electricity transmission network’s population of transmission line structures to maintain the safety and security of supply.
There have been 38 structure functional failures associated with ten extreme wind events affecting this transmission network since 1959. All failed structures were built to historical design standards with inadequate strength to withstand convective downdraft winds occurring during extreme storm events. Modern design standards produced in 2010 ensure sufficient structural capacity to withstand extreme wind events; however, structures designed to old standards still exist on the network.
The mean time between failures (MTBF) of transmission line structures has declined since 1992 due to failures of low-strength towers in extreme winds. Eleven structures along the Bendigo to Kerang line were replaced in January 2013. AusNet Services is undertaking the reinforcement of 108 towers from the Dederang to South Morang 330 kV lines. Risk assessments reveal that 48 structures on the Murray switching station to Dederang 330 kV lines present health and safety risks due to their proximity to road ways and will be upgraded before 2022.
The average age of structures is 45 years as the majority of the fleet were erected prior to 1965. Primary inspection techniques indicate that the structures are generally in good condition. The structure corrosion management program is extending the life of targeted structures where replacements are impracticable due to high cost and prolonged circuit outages. Typical corrosion mitigation works include structure painting and replacement of bolts and members.
The continuing installation of Fall Arrest Systems (FAS) will ensure the Occupational Health and Safety Regulations are met.
High level strategies to be adopted for prudent and efficient management of the transmission structure fleet are:
1.1 New Assets:
All new structures are designed and constructed in accordance with current industry guidelines and standards
1.
1.2 Inspection:
Continue to assess the condition of transmission line structures during structure routine inspections which are conducted at a maximum interval of every 37 months.
Implement the use of Field Mobile Inspection (FMI) technologies for the collation of condition assessment data which facilitate automatic updates of Asset Management databases.
1.3 Maintenance:
Continue to replace corroded or damaged steel members and bolts as part of corrective and scheduled maintenance programs.
Continue to perform corrosion mitigation works on damaged or corroded towers.
Perform fleet wide risk assessment to identify corrosion mitigation works based on the structural strength, corrositivity zone and failure effects.
Use the emergency restoration structures (ERS) to temporarily reinstate a line impacted by high intensity winds.
1 AS/NZS 7000:2010 Overhead Line Design – Detailed Procedures.
AusNet Services AMS 10-77
Transmission Line Structures
ISSUE 2 28/08/2015 5 / 29
UNCONTROLLED WHEN PRINTED
1.4 Refurbishment:
Continue to install Fall Arrest Systems (FAS) on remaining structures; approximately 78 per cent of the tower fleet will be retrofitted with FAS by 2022.
Complete the installation of FAS on all rack structures and ground wire masts in terminal stations by 2022.
Perform structural modelling of existing structures as part of tower upgrades and other lines projects, e.g. conductor and ground wire replacement projects.
Approved project (XC78) to upgrade the strength and serviceability of 108 towers for the Dederang to South Morang 330 kV No.1 and No.2 circuits to the current design standard for overhead lines
2 will be
completed in 2016.
Upgrade the physical strength of an additional 48 structures demonstrating high risk of functional failure due to inadequate design on the Murray switching station to Dederang No.1 and No. 2 circuits by 2022.
2 AS/NZS 7000:2010 Overhead Line Design – Detailed Procedures.
AusNet Services AMS 10-77
Transmission Line Structures
ISSUE 2 28/08/2015 6 / 29
UNCONTROLLED WHEN PRINTED
2 Introduction
2.1 Purpose
The purpose of this document is to define the asset management strategies for the Victorian electricity transmission network’s population of transmission line structures.
2.2 Scope
This asset management strategy applies to all transmission line structures associated with the AusNet Services’ electricity transmission network that operate at voltages of 66 kV and above in the state of Victoria. The strategy applies to structures situated on lines easements, as well as towers and termination structures within stations.
The strategy excludes structure footings3, structures supporting stations assets, and those forming the electricity
distribution network.
3 AMS 10-78 Transmission Line Structure Footings.
AusNet Services AMS 10-77
Transmission Line Structures
ISSUE 2 28/08/2015 7 / 29
UNCONTROLLED WHEN PRINTED
3 Asset Summary
3.1 Population
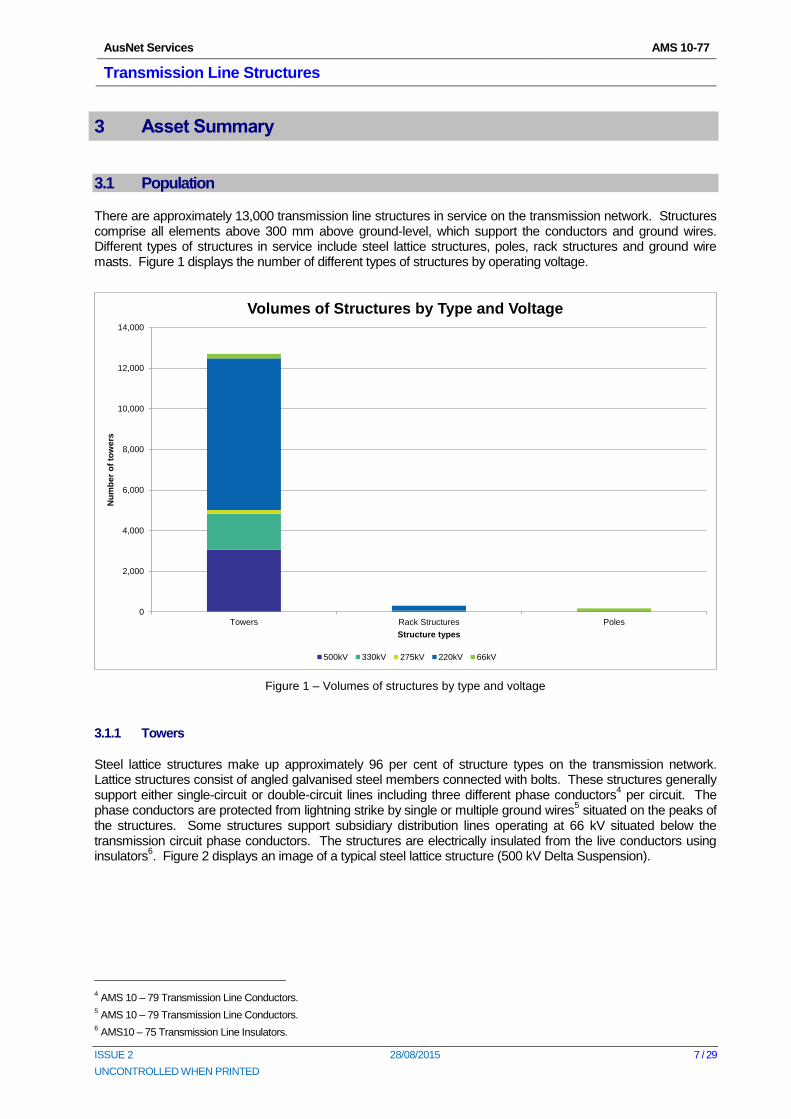
There are approximately 13,000 transmission line structures in service on the transmission network. Structures comprise all elements above 300 mm above ground-level, which support the conductors and ground wires. Different types of structures in service include steel lattice structures, poles, rack structures and ground wire masts. Figure 1 displays the number of different types of structures by operating voltage.
Figure 1 – Volumes of structures by type and voltage
3.1.1 Towers
Steel lattice structures make up approximately 96 per cent of structure types on the transmission network. Lattice structures consist of angled galvanised steel members connected with bolts. These structures generally support either single-circuit or double-circuit lines including three different phase conductors
4 per circuit. The
phase conductors are protected from lightning strike by single or multiple ground wires5 situated on the peaks of
the structures. Some structures support subsidiary distribution lines operating at 66 kV situated below the transmission circuit phase conductors. The structures are electrically insulated from the live conductors using insulators
6. Figure 2 displays an image of a typical steel lattice structure (500 kV Delta Suspension).
4 AMS 10 – 79 Transmission Line Conductors.
5 AMS 10 – 79 Transmission Line Conductors.
6 AMS10 – 75 Transmission Line Insulators.
0
2,000
4,000
6,000
8,000
10,000
12,000
14,000
Towers Rack Structures Poles
Nu
mb
er
of
tow
ers
Structure types
Volumes of Structures by Type and Voltage
500kV 330kV 275kV 220kV 66kV
AusNet Services AMS 10-77
Transmission Line Structures
ISSUE 2 28/08/2015 8 / 29
UNCONTROLLED WHEN PRINTED
Figure 2 – Transmission Line Structure
3.1.2 Rack Structures
The primary function of rack structures is to facilitate the transition of phase conductors from line easement structures to electrical plant situated in terminal stations. Rack structures consist of steel lattice members connected by fasteners or tubular hollow sections bolted or welded together. The vast majority of rack structures are situated within terminal stations; however, there are a number of rack structures known as portal structures which are situated on line easements. Portal structures are designed to accommodate acute changes in line easement alignment such as 90 degree tee offs. Rack and portal structures make up two percent of the total structure population. Figure 3 displays a transmission line rack structure at Dederang Terminal Station (DDTS).
AusNet Services AMS 10-77
Transmission Line Structures
ISSUE 2 28/08/2015 9 / 29
UNCONTROLLED WHEN PRINTED
Figure 3 – Transmission Line Rack Structure
3.1.3 Poles and groundwire masts
Steel and concrete poles are used on the transmission network usually to support phase conductors over short distances. Transmission line poles are generally situated in close proximity to terminal or power stations in the La Trobe Valley. Seventy-nine percent of transmission line poles support circuits operating at 66 kV.
There are approximately 60 ground wire masts located within terminal stations, these are steel lattice structures designed to protect electrical plant and infrastructure from lightning strike.
3.1.4 Design Characteristics
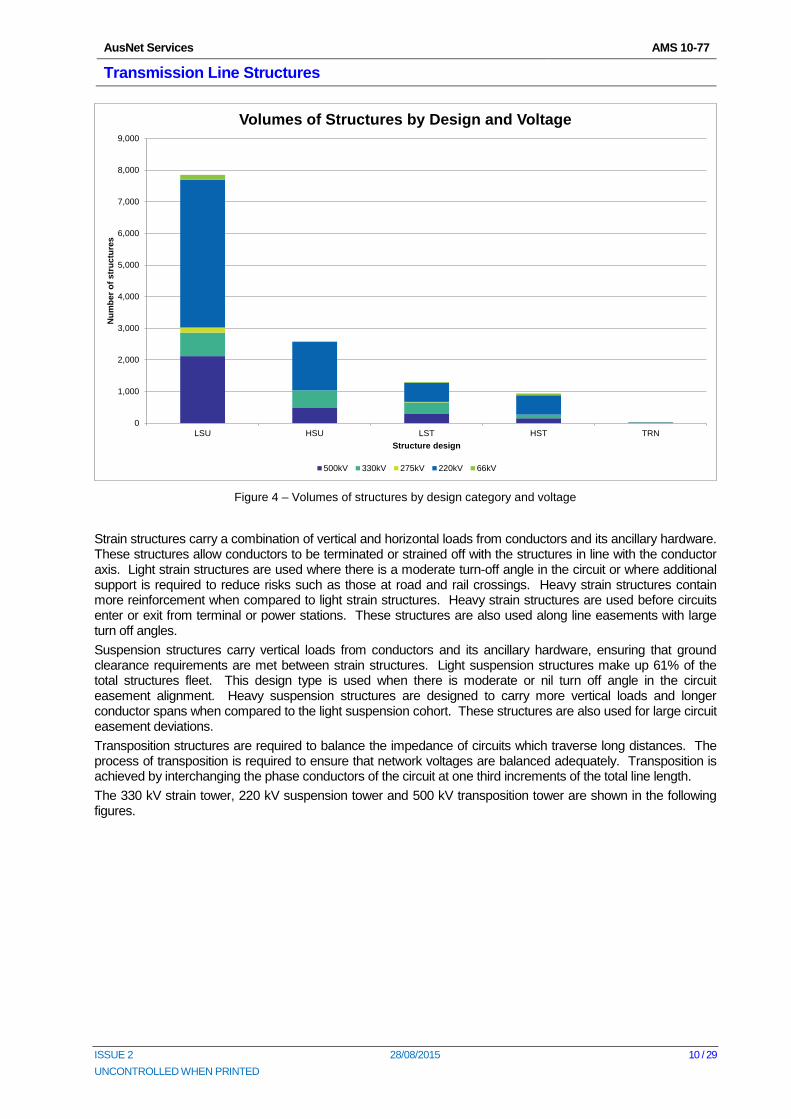
Transmission structures are further categorised based on design characteristics. The design characteristics determine what mechanical load the structure can support. There are five design categories including heavy strain (HST), light strain (LST), heavy suspension (HSU), light suspension (LSU) and transposition (TRN). Figure 4 displays the proportion of the structure fleet within each design category by operating voltage.
AusNet Services AMS 10-77
Transmission Line Structures
ISSUE 2 28/08/2015 10 / 29
UNCONTROLLED WHEN PRINTED
Figure 4 – Volumes of structures by design category and voltage
Strain structures carry a combination of vertical and horizontal loads from conductors and its ancillary hardware. These structures allow conductors to be terminated or strained off with the structures in line with the conductor axis. Light strain structures are used where there is a moderate turn-off angle in the circuit or where additional support is required to reduce risks such as those at road and rail crossings. Heavy strain structures contain more reinforcement when compared to light strain structures. Heavy strain structures are used before circuits enter or exit from terminal or power stations. These structures are also used along line easements with large turn off angles.
Suspension structures carry vertical loads from conductors and its ancillary hardware, ensuring that ground clearance requirements are met between strain structures. Light suspension structures make up 61% of the total structures fleet. This design type is used when there is moderate or nil turn off angle in the circuit easement alignment. Heavy suspension structures are designed to carry more vertical loads and longer conductor spans when compared to the light suspension cohort. These structures are also used for large circuit easement deviations.
Transposition structures are required to balance the impedance of circuits which traverse long distances. The process of transposition is required to ensure that network voltages are balanced adequately. Transposition is achieved by interchanging the phase conductors of the circuit at one third increments of the total line length.
The 330 kV strain tower, 220 kV suspension tower and 500 kV transposition tower are shown in the following figures.
0
1,000
2,000
3,000
4,000
5,000
6,000
7,000
8,000
9,000
LSU HSU LST HST TRN
Nu
mb
er
of
str
uctu
res
Structure design
Volumes of Structures by Design and Voltage
500kV 330kV 275kV 220kV 66kV
AusNet Services AMS 10-77
Transmission Line Structures
ISSUE 2 28/08/2015 11 / 29
UNCONTROLLED WHEN PRINTED
Figure 5 – DDTS-SMTS No. 1 330 kV strain tower
Figure 6 – ROTS-SVTS 220 kV suspension tower
Figure 7 – HWTS-CBTS No. 4 500 kV transposition
tower
3.1.5 Environmental Factors
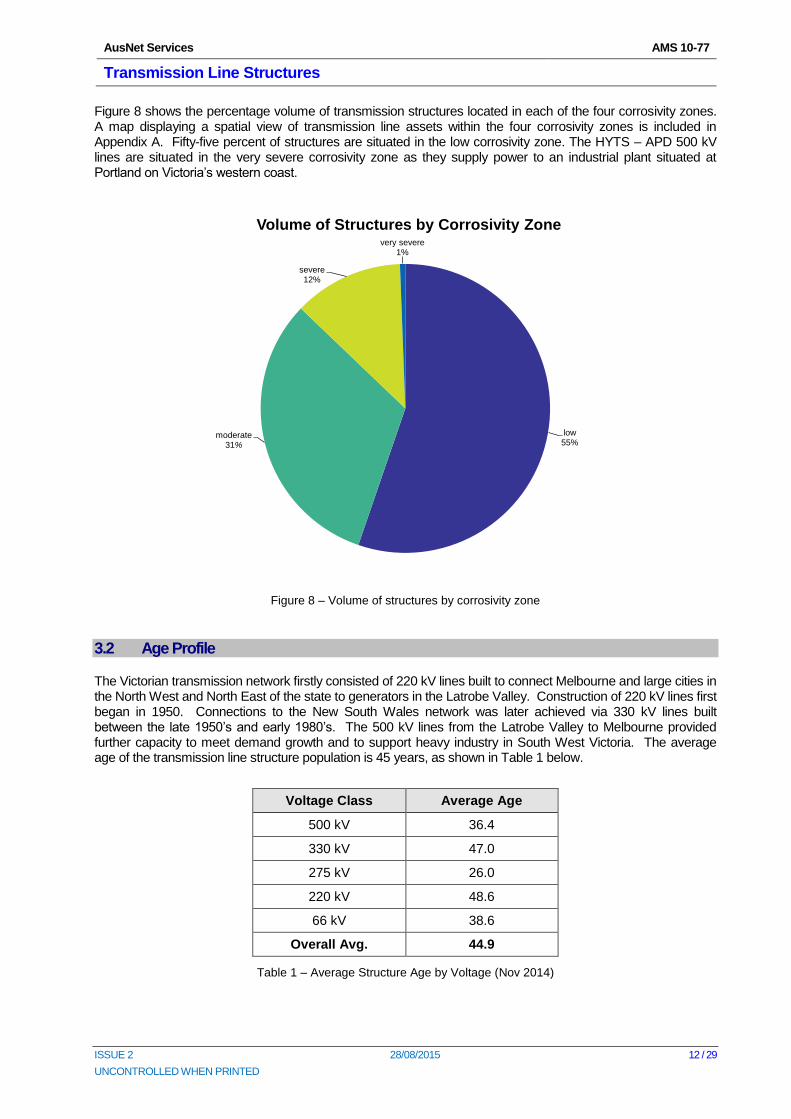
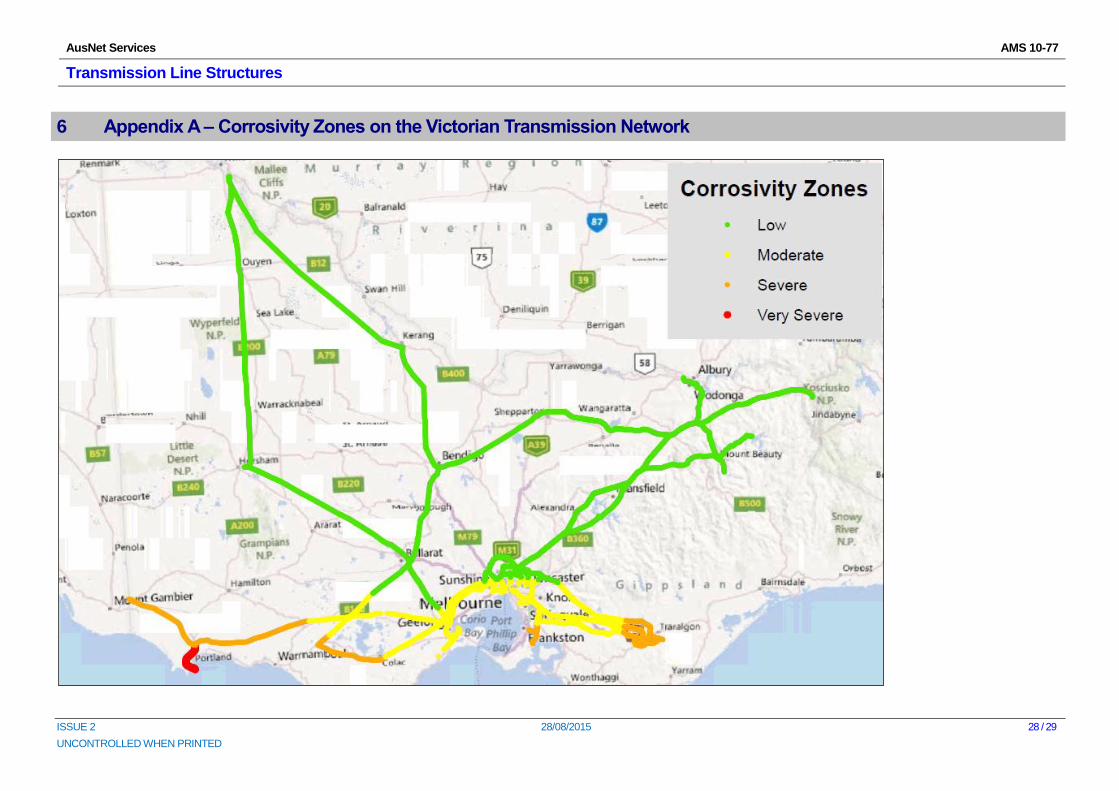
The transmission line network is exposed to varying levels of corrosivity depending on environmental factors. The two factors which have the greatest impact on levels of corrosivity include salt deposition experienced in coastal regions and air pollution caused by emissions from heavy industry. In order to manage the effects of corrosion in a prudent manner, corrosivity classifications are assigned to transmission line assets. There are a total of four corrosivity zones including low, moderate, severe and very severe.
AusNet Services AMS 10-77
Transmission Line Structures
ISSUE 2 28/08/2015 12 / 29
UNCONTROLLED WHEN PRINTED
Figure 8 shows the percentage volume of transmission structures located in each of the four corrosivity zones. A map displaying a spatial view of transmission line assets within the four corrosivity zones is included in Appendix A. Fifty-five percent of structures are situated in the low corrosivity zone. The HYTS – APD 500 kV lines are situated in the very severe corrosivity zone as they supply power to an industrial plant situated at Portland on Victoria’s western coast.
Figure 8 – Volume of structures by corrosivity zone
3.2 Age Profile
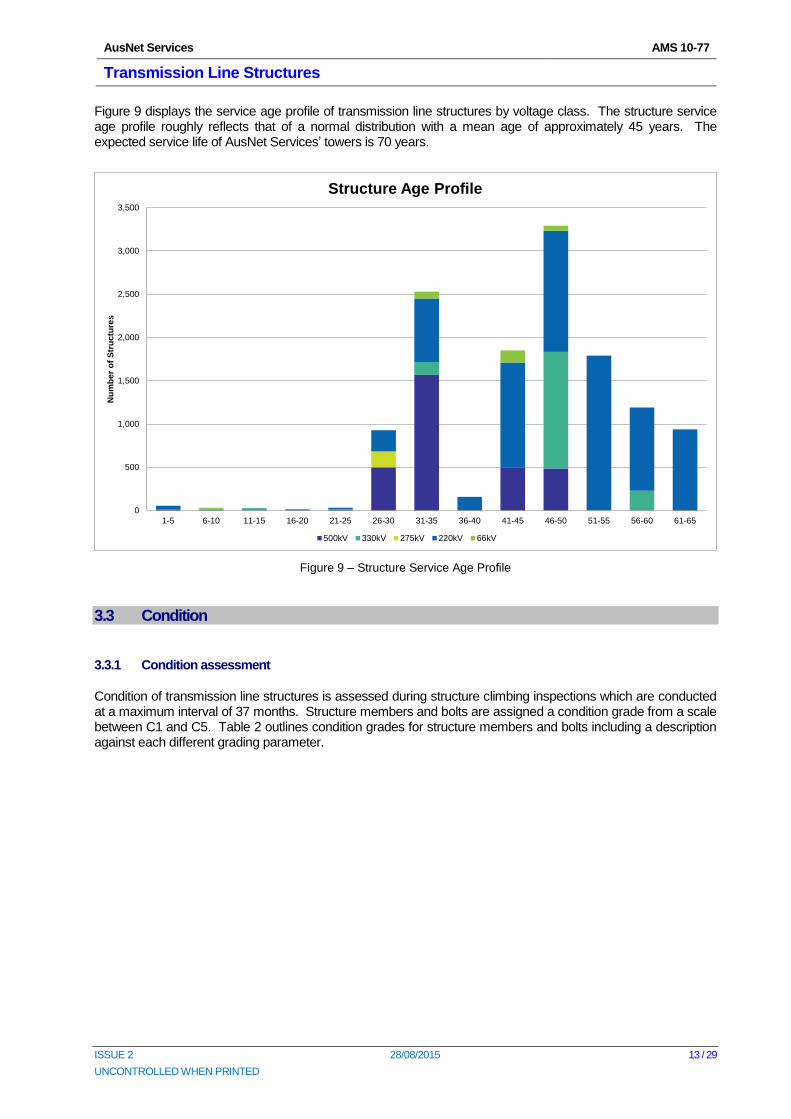
The Victorian transmission network firstly consisted of 220 kV lines built to connect Melbourne and large cities in the North West and North East of the state to generators in the Latrobe Valley. Construction of 220 kV lines first began in 1950. Connections to the New South Wales network was later achieved via 330 kV lines built between the late 1950’s and early 1980’s. The 500 kV lines from the Latrobe Valley to Melbourne provided further capacity to meet demand growth and to support heavy industry in South West Victoria. The average age of the transmission line structure population is 45 years, as shown in Table 1 below.
Voltage Class Average Age
500 kV 36.4
330 kV 47.0
275 kV 26.0
220 kV 48.6
66 kV 38.6
Overall Avg. 44.9
Table 1 – Average Structure Age by Voltage (Nov 2014)
low55%
moderate31%
severe12%
very severe1%
Volume of Structures by Corrosivity Zone
AusNet Services AMS 10-77
Transmission Line Structures
ISSUE 2 28/08/2015 13 / 29
UNCONTROLLED WHEN PRINTED
Figure 9 displays the service age profile of transmission line structures by voltage class. The structure service age profile roughly reflects that of a normal distribution with a mean age of approximately 45 years. The expected service life of AusNet Services’ towers is 70 years.
Figure 9 – Structure Service Age Profile
3.3 Condition
3.3.1 Condition assessment
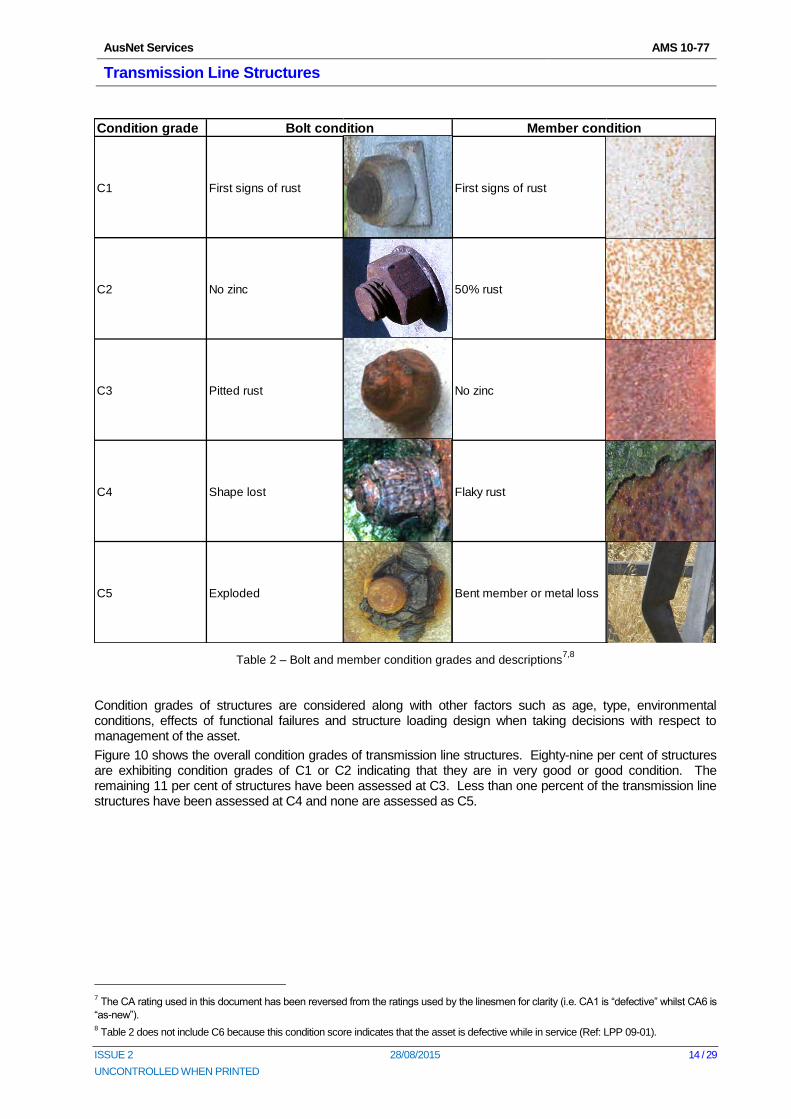
Condition of transmission line structures is assessed during structure climbing inspections which are conducted at a maximum interval of 37 months. Structure members and bolts are assigned a condition grade from a scale between C1 and C5. Table 2 outlines condition grades for structure members and bolts including a description against each different grading parameter.
Table 2 – Bolt and member condition grades and descriptions7,8
Condition grades of structures are considered along with other factors such as age, type, environmental conditions, effects of functional failures and structure loading design when taking decisions with respect to management of the asset.
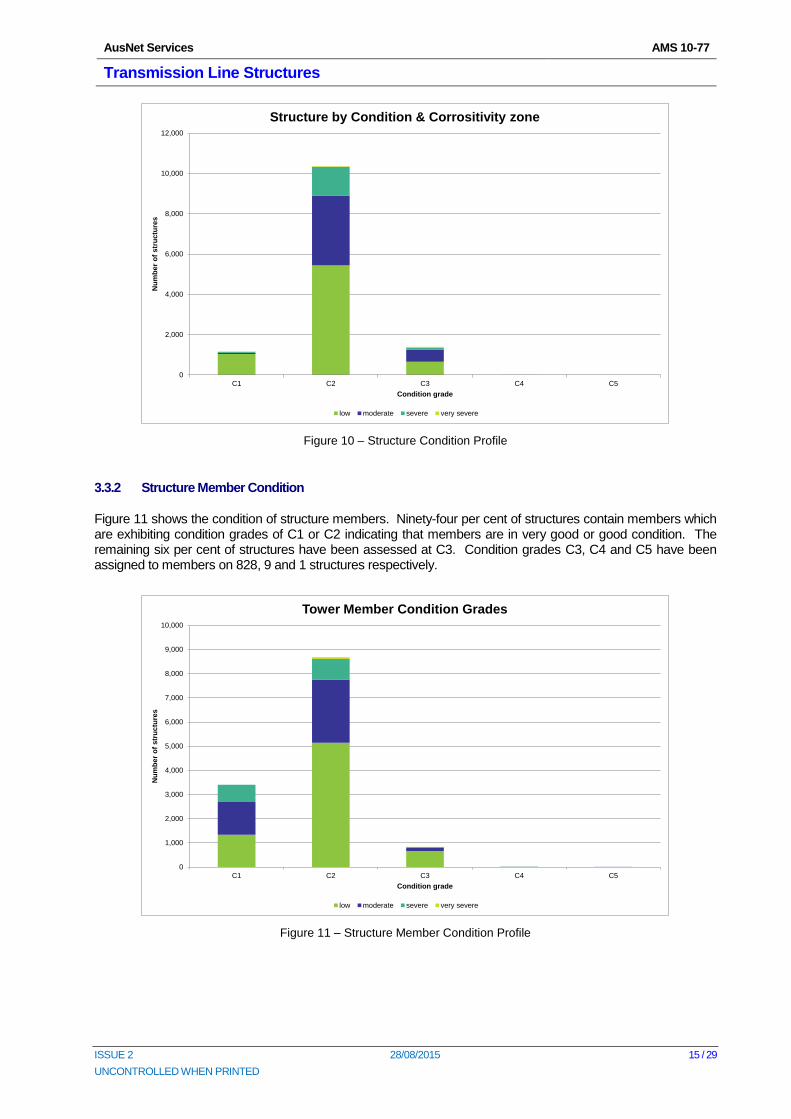
Figure 10 shows the overall condition grades of transmission line structures. Eighty-nine per cent of structures are exhibiting condition grades of C1 or C2 indicating that they are in very good or good condition. The remaining 11 per cent of structures have been assessed at C3. Less than one percent of the transmission line structures have been assessed at C4 and none are assessed as C5.
7 The CA rating used in this document has been reversed from the ratings used by the linesmen for clarity (i.e. CA1 is “defective” whilst CA6 is
“as-new”). 8 Table 2 does not include C6 because this condition score indicates that the asset is defective while in service (Ref: LPP 09-01).
Condition grade
C1 First signs of rust First signs of rust
C2 No zinc 50% rust
C3 Pitted rust No zinc
C4 Shape lost Flaky rust
C5 Exploded Bent member or metal loss
Bolt condition Member condition
AusNet Services AMS 10-77
Transmission Line Structures
ISSUE 2 28/08/2015 15 / 29
UNCONTROLLED WHEN PRINTED
Figure 10 – Structure Condition Profile
3.3.2 Structure Member Condition
Figure 11 shows the condition of structure members. Ninety-four per cent of structures contain members which are exhibiting condition grades of C1 or C2 indicating that members are in very good or good condition. The remaining six per cent of structures have been assessed at C3. Condition grades C3, C4 and C5 have been assigned to members on 828, 9 and 1 structures respectively.
Figure 11 – Structure Member Condition Profile
0
2,000
4,000
6,000
8,000
10,000
12,000
C1 C2 C3 C4 C5
Nu
mb
er
of
str
uctu
res
Condition grade
Structure by Condition & Corrositivity zone
low moderate severe very severe
0
1,000
2,000
3,000
4,000
5,000
6,000
7,000
8,000
9,000
10,000
C1 C2 C3 C4 C5
Nu
mb
er
of
str
uctu
res
Condition grade
Tower Member Condition Grades
low moderate severe very severe
AusNet Services AMS 10-77
Transmission Line Structures
ISSUE 2 28/08/2015 16 / 29
UNCONTROLLED WHEN PRINTED
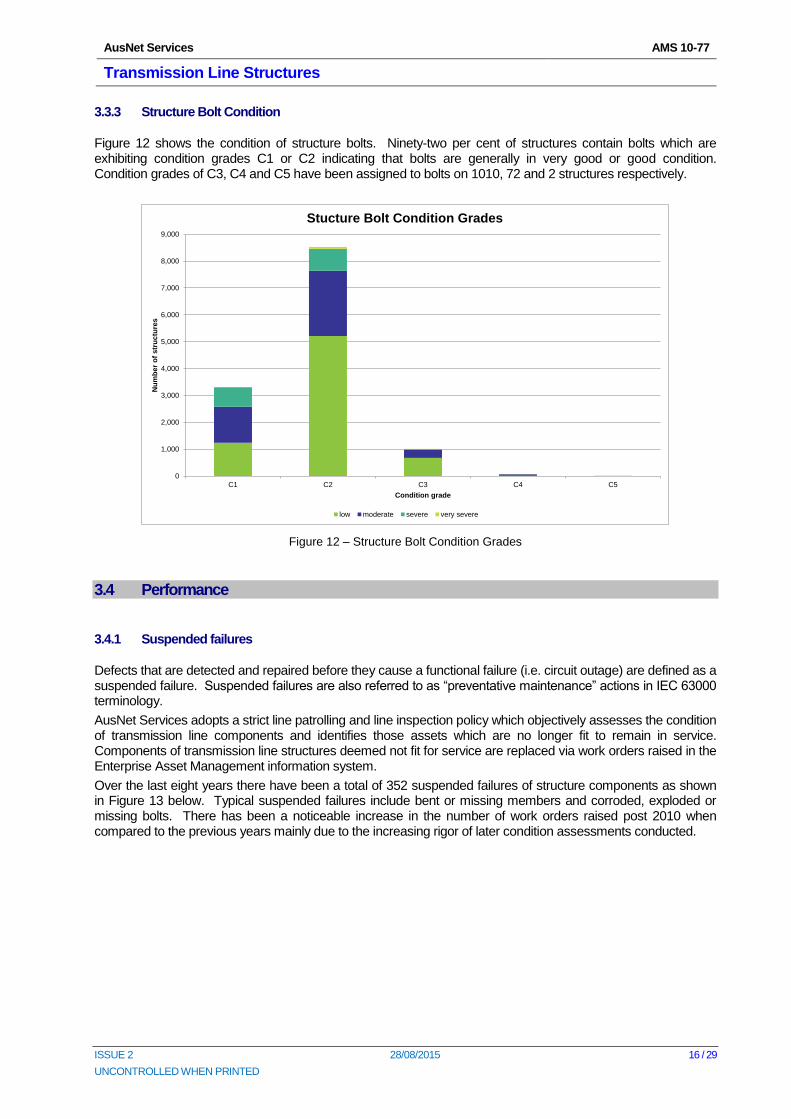
3.3.3 Structure Bolt Condition
Figure 12 shows the condition of structure bolts. Ninety-two per cent of structures contain bolts which are exhibiting condition grades C1 or C2 indicating that bolts are generally in very good or good condition. Condition grades of C3, C4 and C5 have been assigned to bolts on 1010, 72 and 2 structures respectively.
Figure 12 – Structure Bolt Condition Grades
3.4 Performance
3.4.1 Suspended failures
Defects that are detected and repaired before they cause a functional failure (i.e. circuit outage) are defined as a suspended failure. Suspended failures are also referred to as “preventative maintenance” actions in IEC 63000 terminology.
AusNet Services adopts a strict line patrolling and line inspection policy which objectively assesses the condition of transmission line components and identifies those assets which are no longer fit to remain in service. Components of transmission line structures deemed not fit for service are replaced via work orders raised in the Enterprise Asset Management information system.
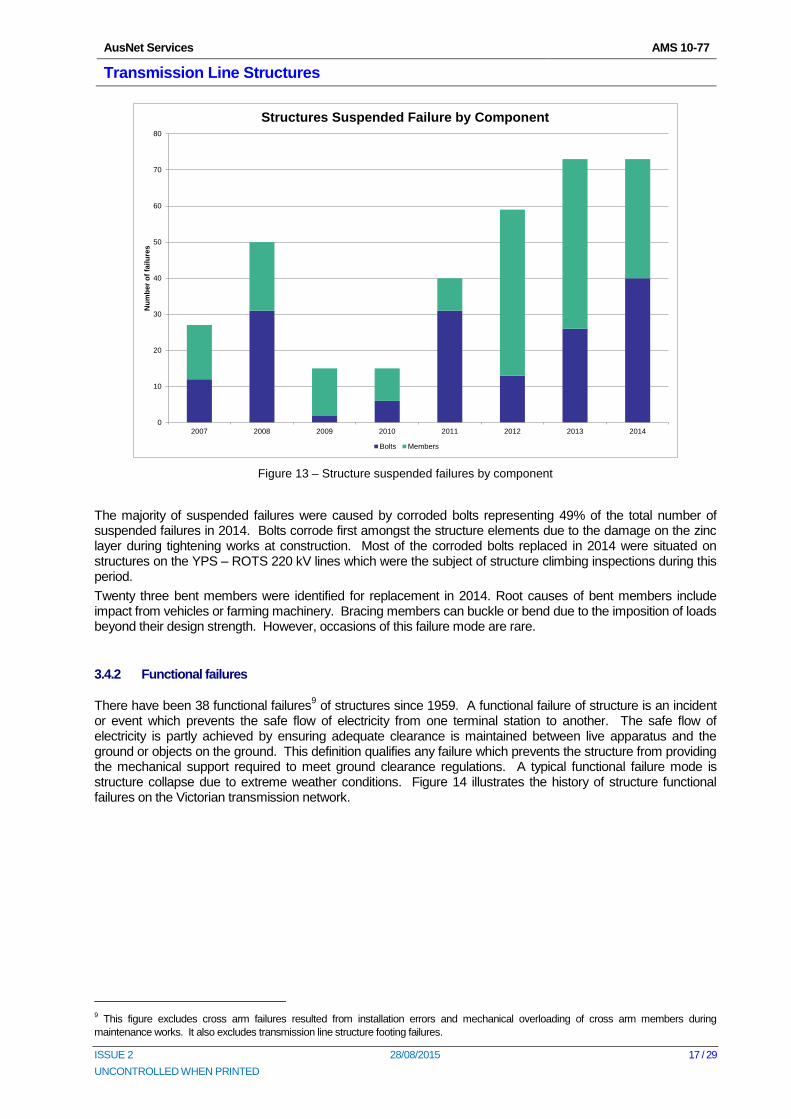
Over the last eight years there have been a total of 352 suspended failures of structure components as shown in Figure 13 below. Typical suspended failures include bent or missing members and corroded, exploded or missing bolts. There has been a noticeable increase in the number of work orders raised post 2010 when compared to the previous years mainly due to the increasing rigor of later condition assessments conducted.
0
1,000
2,000
3,000
4,000
5,000
6,000
7,000
8,000
9,000
C1 C2 C3 C4 C5
Nu
mb
er
of
str
uctu
res
Condition grade
Stucture Bolt Condition Grades
low moderate severe very severe
AusNet Services AMS 10-77
Transmission Line Structures
ISSUE 2 28/08/2015 17 / 29
UNCONTROLLED WHEN PRINTED
Figure 13 – Structure suspended failures by component
The majority of suspended failures were caused by corroded bolts representing 49% of the total number of suspended failures in 2014. Bolts corrode first amongst the structure elements due to the damage on the zinc layer during tightening works at construction. Most of the corroded bolts replaced in 2014 were situated on structures on the YPS – ROTS 220 kV lines which were the subject of structure climbing inspections during this period.
Twenty three bent members were identified for replacement in 2014. Root causes of bent members include impact from vehicles or farming machinery. Bracing members can buckle or bend due to the imposition of loads beyond their design strength. However, occasions of this failure mode are rare.
3.4.2 Functional failures
There have been 38 functional failures9 of structures since 1959. A functional failure of structure is an incident
or event which prevents the safe flow of electricity from one terminal station to another. The safe flow of electricity is partly achieved by ensuring adequate clearance is maintained between live apparatus and the ground or objects on the ground. This definition qualifies any failure which prevents the structure from providing the mechanical support required to meet ground clearance regulations. A typical functional failure mode is structure collapse due to extreme weather conditions. Figure 14 illustrates the history of structure functional failures on the Victorian transmission network.
9 This figure excludes cross arm failures resulted from installation errors and mechanical overloading of cross arm members during
maintenance works. It also excludes transmission line structure footing failures.
0
10
20
30
40
50
60
70
80
2007 2008 2009 2010 2011 2012 2013 2014
Nu
mb
er
of
failu
res
Structures Suspended Failure by Component
Bolts Members
AusNet Services AMS 10-77
Transmission Line Structures
ISSUE 2 28/08/2015 18 / 29
UNCONTROLLED WHEN PRINTED
Figure 14 – Structure functional failure history
Ten separate events have led to the collapse or failure of 38 structures in 56 years as shown in Table 3 below. In most cases the collapse of one structure caused several other structures to fail with the worst multiple-failure event taking place in 1959 on the Geelong – Colac 220 kV line when a total of eight structures failed. The Bendigo to Kerang 220 kV line has experienced four tower collapse incidents due to the tower design structural inadequacy for high intensity winds since it was constructed in 1961. A total of 18 towers have failed from four separate events in 1979, 1993, 2010 and 2014.
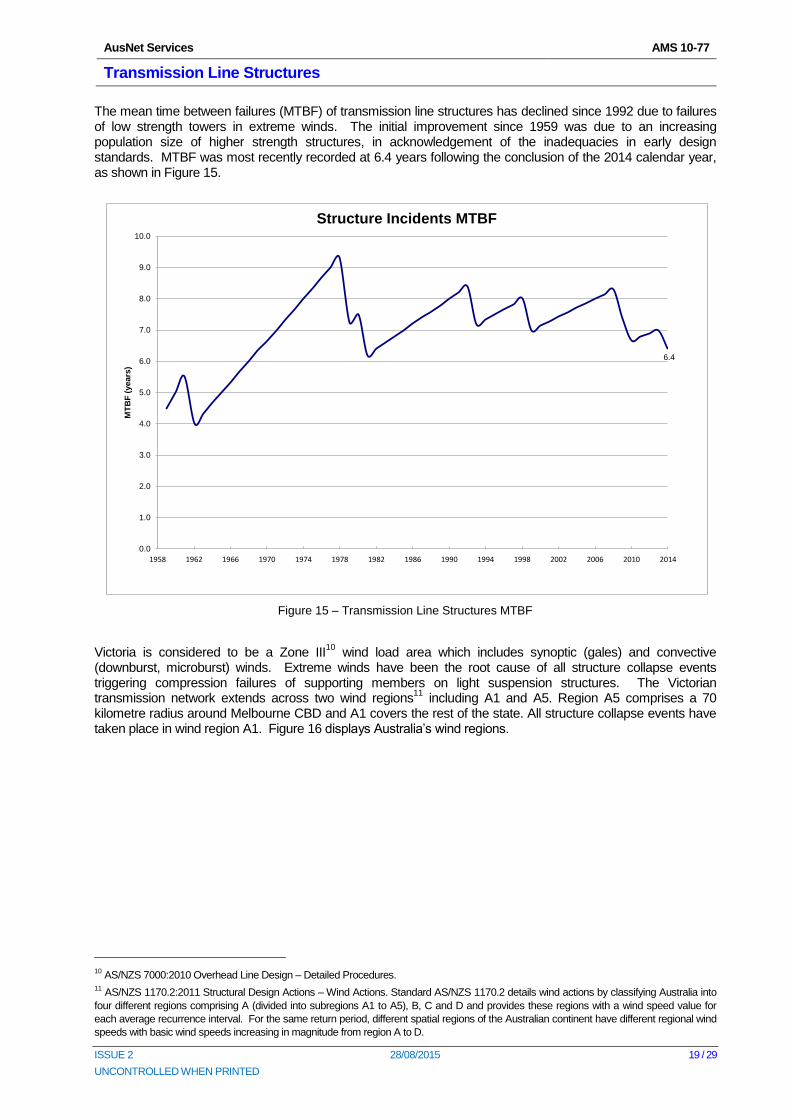
The mean time between failures (MTBF) of transmission line structures has declined since 1992 due to failures of low strength towers in extreme winds. The initial improvement since 1959 was due to an increasing population size of higher strength structures, in acknowledgement of the inadequacies in early design standards. MTBF was most recently recorded at 6.4 years following the conclusion of the 2014 calendar year, as shown in Figure 15.
Figure 15 – Transmission Line Structures MTBF
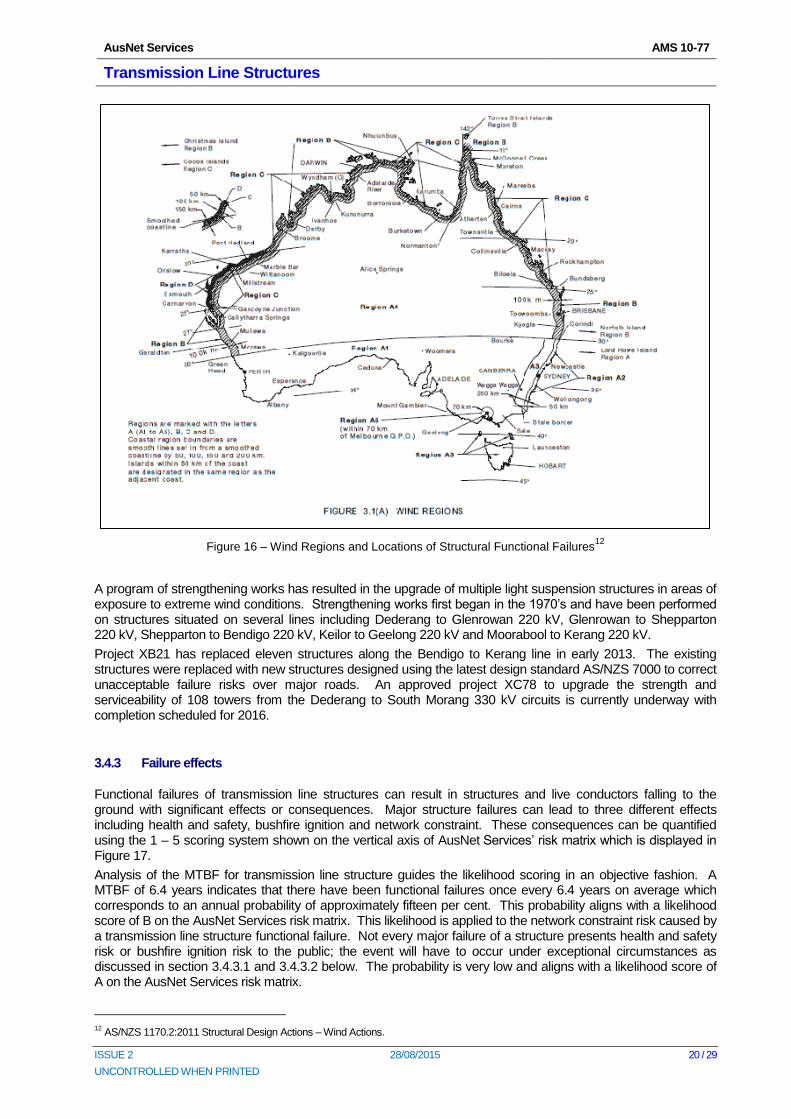
Victoria is considered to be a Zone III10
wind load area which includes synoptic (gales) and convective (downburst, microburst) winds. Extreme winds have been the root cause of all structure collapse events triggering compression failures of supporting members on light suspension structures. The Victorian transmission network extends across two wind regions
11 including A1 and A5. Region A5 comprises a 70
kilometre radius around Melbourne CBD and A1 covers the rest of the state. All structure collapse events have taken place in wind region A1. Figure 16 displays Australia’s wind regions.
10
AS/NZS 7000:2010 Overhead Line Design – Detailed Procedures. 11
AS/NZS 1170.2:2011 Structural Design Actions – Wind Actions. Standard AS/NZS 1170.2 details wind actions by classifying Australia into
four different regions comprising A (divided into subregions A1 to A5), B, C and D and provides these regions with a wind speed value for
each average recurrence interval. For the same return period, different spatial regions of the Australian continent have different regional wind
speeds with basic wind speeds increasing in magnitude from region A to D.
Figure 16 – Wind Regions and Locations of Structural Functional Failures12
A program of strengthening works has resulted in the upgrade of multiple light suspension structures in areas of exposure to extreme wind conditions. Strengthening works first began in the 1970’s and have been performed on structures situated on several lines including Dederang to Glenrowan 220 kV, Glenrowan to Shepparton 220 kV, Shepparton to Bendigo 220 kV, Keilor to Geelong 220 kV and Moorabool to Kerang 220 kV.
Project XB21 has replaced eleven structures along the Bendigo to Kerang line in early 2013. The existing structures were replaced with new structures designed using the latest design standard AS/NZS 7000 to correct unacceptable failure risks over major roads. An approved project XC78 to upgrade the strength and serviceability of 108 towers from the Dederang to South Morang 330 kV circuits is currently underway with completion scheduled for 2016.
3.4.3 Failure effects
Functional failures of transmission line structures can result in structures and live conductors falling to the ground with significant effects or consequences. Major structure failures can lead to three different effects including health and safety, bushfire ignition and network constraint. These consequences can be quantified using the 1 – 5 scoring system shown on the vertical axis of AusNet Services’ risk matrix which is displayed in Figure 17.
Analysis of the MTBF for transmission line structure guides the likelihood scoring in an objective fashion. A MTBF of 6.4 years indicates that there have been functional failures once every 6.4 years on average which corresponds to an annual probability of approximately fifteen per cent. This probability aligns with a likelihood score of B on the AusNet Services risk matrix. This likelihood is applied to the network constraint risk caused by a transmission line structure functional failure. Not every major failure of a structure presents health and safety risk or bushfire ignition risk to the public; the event will have to occur under exceptional circumstances as discussed in section 3.4.3.1 and 3.4.3.2 below. The probability is very low and aligns with a likelihood score of A on the AusNet Services risk matrix.
Transmission line easements traverse both public and private land where public access is restricted. In many instances easements are shared or located next to other infrastructure such as roads, railway lines, pipes and fences. Functional failures of structures can present health and safety risks to members of the public, AusNet Services’ employees or AusNet Services’ contractors accessing the transmission line easements.
Line workers performing structure climbing activities are exposed to risks associated with working at heights and electrical clearances which are heightened under failure conditions. Structural failures may also present risks to members of the public, particularly with structures adjacent to roadways, railway lines and public areas such as car parks, parks and gardens.
Using the results of a study performed by Vic Roads14
in 1994, a quantitative consequence assessment of transmission structures adjacent to roads and railways has been completed. The assessment has revealed that a structural failure could cause a health and safety incident with a maximum risk rating score of II as per the AusNet Services risk matrix.
There have been no instances of major structure failures adjacent to roads or railways. The existing tower upgrade project (XC78) has targeted structures in proximity to road ways that have inadequate strength to withstand high intensity winds.
3.4.3.2 Bushfire ignition
Faults on transmission line assets can result in discharges of energy which are capable of igniting ground fires. Some transmission lines are situated in easement through high density fuel loads in grasslands and forests. In extreme weather conditions ground fires started close to such fuel loads can quickly develop into widespread bushfires.
Bushfire loss consequence modelling performed by Dr. Kevin Tolhurst15
of Melbourne University has enabled the establishment of quantitative bushfire consequence values for transmission line assets. The bushfire loss consequence model demonstrates that functional failure of a transmission line structure could trigger a bushfire incident with a risk ranking score of II as per the AusNet Services risk matrix. A map displaying the bushfire consequences associated with transmission line assets is included in Appendix B.
Bureau of Transport and Communications Economics (1994) The Costs of Road Accidents in Victoria – 1988. 15
A Bushfire Risk Assessment for the SP-AusNet HV Network in Victoria 2011.
Health & Safety Risk
Bushfire Risk
Network constraint risk
AusNet Services AMS 10-77
Transmission Line Structures
ISSUE 2 28/08/2015 22 / 29
UNCONTROLLED WHEN PRINTED
There has been one incident where a structure failure has triggered a small ground fire. In 1981, a ground fire ignited following a structure collapse on the Murray switching station to Dederang 330 kV No.2 line caused by extreme winds during a storm event. The fire was small in size and was extinguished by rainfall during the storm event.
3.4.3.3 Network performance
The electricity transmission lines forming the National Electricity Market have high levels of redundancy under average loading conditions. However, during peak loading periods; transmission line failures can constrain generator connections causing a re-scheduling of generators in other states and load shedding may be required to provide network security for a subsequent un-related failure.
AusNet Services participates in a number of system performance based incentive schemes which are designed to ensure that Victorian electricity consumers and National Electricity Market (NEM) participants are provided with appropriate levels of service. The schemes provide financial rewards for improving network availability and service standards and impose financial penalties for declining network availability and service standards.
Functional failures of transmission line structures can result in circuit outages which negatively impact on performance levels within the incentive schemes. Impacts on the schemes are compounded when major structure failures take place on radial lines or cause constraints on electricity generation. Financial penalties likely to be imposed can be calculated using guidelines set out by the Australian Energy Regulator (AER). These calculations indicate that a structure failure would result in a maximum financial penalty corresponding to a risk ranking score of IV as per the AusNet Services’ risk matrix.
3.4.4 Performance benchmarking
AusNet Services participated in the 2013 ITOMS performance benchmarking study. The survey enables a participating Transmission Network Service Provider (TNSP) to compare its performance relative to others based on service and cost levels.
AusNet Services ranked above the average performance of other Australian and New Zealand transmission utilities in terms of service level (measured in fault/forced outages per circuit km) and cost level (measured in equivalent maintenance costs per circuit km) for 200 kV+ transmission voltage categories. However, the cost level for the 60-99 kV category is slightly higher than the average performance of other Australian and New Zealand transmission utilities.
The survey indicates that the maintenance strategies and costs are appropriate for our network. Figure 18 and Figure 19 displays results in the 60-99 kV and 200 kV+ categories respectively.
The structure corrosion mitigation program is required to extend the life of targeted structures where replacements are not feasible due to high cost and prolonged outages. Typical corrosion mitigation works include structure painting and replacement of small volumes of cross arms or members which are excessively corroded.
Structure painting is a maintenance program that seeks to arrest the deterioration of the structure by introducing a barrier system to prevent moisture from coming into contact with the steel members and bolts. Optimal timing of initial structure painting followed by patch work painting every ten years will extend the service life of the structure beyond its original expected life.
Condition assessment surveys which are conducted every three years assess the degree of corrosion steel members and bolts have experienced. A condition rating which corresponds with the level of deterioration is assigned as discussed in section 3.3. Structures with condition grade C3, C2 or C1 are considered for structure painting to prevent further sectional loss which will ultimately lead to premature replacement of structures or functional failures of structure.
Structure painting simply preserves the existing structural strength of steel members and so the timing of painting activities is critical. Members that have experienced section loss consistent with grades C4 and C5 generally have experienced considerable reductions in material strength disqualifying them as suitable candidates for painting. Painting members in poor condition may inadvertently preserve unacceptable probabilities of failures.
Seventeen structures identified for corrosion management are situated on the Rowville to Springvale 220 kV lines and the Springvale to Heatherton 220 kV lines. Another seventeen 66 kV poles on Morwell to Loy Yang Power Station line are also showing signs of corrosion and require painting program to extend their asset lives.
AusNet Services AMS 10-77
Transmission Line Structures
ISSUE 2 28/08/2015 24 / 29
UNCONTROLLED WHEN PRINTED
3.6 Fall Arrests Systems
AusNet Services has approximately 13,000 towers and more than 650 rack and ancillary structures such as ground wire masts and termination masts, which are climbed at least every three years for inspection purposes. Whilst the electricity industry has an excellent record with no recorded fall from a tower by a worker in the course of their duty, the general construction industry in Victoria has a very poor record. A fall from an elevated position on a tower could result in severe injuries or possible fatality to a worker.
The Occupational Health and Safety Regulations 2007, No. 54 – Part 3.3 prompted AusNet Services to initiate the installation of permanent fall arrest systems (FAS). In 2010, after a comprehensive study which compared several different types of FAS in the industry and several trial installations at the South Morang Training centre, the most effective FAS was deemed to be a cable FAS from the manufacturer Latchways, branded the ManSafe system.
There is an approved project (XC79) to install permanent cable FAS on 3,387 extra high voltage towers on the AusNet Services transmission network
16. The completion of this project will result in 65 per cent of the tower
fleet retrofitted with FAS by end of 2019.
AusNet Services is also undertaking project XC81 to install permanent FAS on the line rack structures and ground wire structures at 48 terminal stations. This project will install FAS on 62 % of rack structures by 2017.
3.7 Key Issues
The key issues associated with the transmission line structure fleet are as follows:
Functional failures of structures which are non-compliant with the current design standards and adjacent to roads, rail crossings or public areas present extreme health and safety risks.
Maintenance of structures exposes line workers to risks associated with working at heights and working close to live electrical apparatus.
Corrosion of transmission line structures is accelerated in some areas due to exposure to harsh environmental conditions especially in coastal regions or areas of industrial pollution.
Some structures are costly to replace and so alternative asset management practices such as corrosion mitigation works are required.
Structure members can be damaged following impact from vehicles and farming machinery or can be removed by unauthorised third parties.
16
This project is the second stage of the FAS installation program, following on from project X7G6 which installed FAS on approximately
5,000 transmission towers.
AusNet Services AMS 10-77
Transmission Line Structures
ISSUE 2 28/08/2015 25 / 29
UNCONTROLLED WHEN PRINTED
4 Risk Assessment
In order to manage transmission line structures in a prudent and economic way, AusNet Services has undertaken fleet wide risk assessments. Structure failure risk assessments support asset management planning and ensure that risks associated with transmission line structures are managed appropriately.
4.1 Failure Probability
As discussed in section 3.4.2, the root cause of all 38 structure collapse failure modes has been inadequate design of structures where the design was imported from other countries and did not have the capacity to carry the wind loading in the Victorian environment. The frequency of exposure to extreme winds is regional and depends on the geographical location. In many cases, structure collapse events were caused by wind speeds equal to or lower than 37 meters per second. Current design standards
17 indicate that wind speeds of this
magnitude in wind regions of Victoria have a recurrence interval of once every twenty years which equates to a five per cent annual probability of occurrence. All 38 structures which collapsed during wind events were suspension structures with inadequate strength to withstand convective downdraft winds.
Analysis of existing structure design standards1819
enabled the establishment of failure probabilities for each structure based on structure location, structure design type (i.e. heavy strain, light strain, heavy suspension, light suspension and transposition) and design wind speed. Probabilities were further calibrated based on the history of failures for each specific transmission circuit.
4.2 Risk Assessment Results
Section 3.4.3 discusses the effects of structure failures which include health and safety, bushfire ignition and network performance. Multiplying the probability of failure by failure effect cost results in a quantitative risk score for each structure expressed in monetary terms, this value is used to rank each structure in the fleet.
Risk ranking results revealed the Bendigo to Kerang 220 kV line, Dederang to South Morang No.1 and No.2 330 kV lines, and Murray switching station to Dederang No.1 and No.2 330 kV lines have the highest risks because of their original design limitations and the natural occurrence of high intensity winds in those areas. Functional failures support these findings with multiple failure incidents occurring on these lines in the past.
Bendigo to Kerang 220 kV line
Eleven structures along the Bendigo to Kerang line were replaced in January 2013 (Project XB21) to improve the reliability of this line. These structures were replaced with structures designed using the latest design standard AS/NZS 7000 to correct unacceptable levels of risks across major road crossings. The residual risk after the tower replacement is small.
Dederang to South Morang No.1 and No.2 330 kV lines
Cost benefit analysis of tower replacement versus tower reinforcement was undertaken for the Dederang to South Morang No. 1 and No. 2 330 kV lines. Detailed risk assessment of the towers at each road crossing was undertaken as part of the business case development. The analysis indicated that upgrading three towers on each side of a road to AS/NZS7000 is more economic than replacement of towers adjacent to the road crossing and meets the safety improvement required to mitigate the risks associated with a tower collapse event. The scope of works for project XC78 changed from replacing 48 towers across 12 road crossings to upgrading 108 towers out of 1,100 towers along these two lines. This project is currently underway, completion is expected in 2016.
AS/NZS 7000:2010 Overhead Line Design – Detailed Procedures.
AusNet Services AMS 10-77
Transmission Line Structures
ISSUE 2 28/08/2015 26 / 29
UNCONTROLLED WHEN PRINTED
Murray to Dederang No.1 and No.2 330 kV lines
Analysis of the model outputs reveals that risks are highly concentrated with large proportions of the total fleet risks held by small proportions of the assets. Assessment of the tower fleet have revealed that 0.369% of the entire tower fleet, i.e. 48 structures operating on the Murray switching station to Dederang No.1 and No. 2 330 kV lines should be reinforced
20 to reduce the risk of a tower collapse event to demonstrate management of
safety risks “so far as is practicable”. Health and safety risks are the primary drivers for the upgrade of all 48 structures identified. The risks exist due to the proximity of these structures to road ways. Failure of these structures will also have significant negative impact on market prices which is a secondary driver for their reinforcement. The structures are in relatively good condition but risks here relate to inability of structures to withstand extreme wind events which are probable in the A1 wind region. Risk modelling outputs confirm that the reinforcement of these 48 structures is economic.
20
The MSS-DDTS towers are similar to the DDTS-SMTS towers which were reinforced to comply with AS/NZS 7000.
AusNet Services AMS 10-77
Transmission Line Structures
ISSUE 2 28/08/2015 27 / 29
UNCONTROLLED WHEN PRINTED
5 Strategies
High level strategies to be adopted for prudent and efficient management of the transmission structure fleet are:
5.1 New Assets
New structures are designed and constructed in accordance with current industry guidelines and standards
21.
5.2 Inspection
Continue to assess the condition of transmission line structures during structure routine inspections which are conducted at a maximum interval of every 37 months.
Implement the use of Field Mobile Inspection (FMI) technologies for the collation of condition assessment data which facilitate automatic updates of Asset Management databases.
5.3 Maintenance
Continue to replace corroded or damaged steel members and bolts as part of corrective and scheduled maintenance programs.
Continue to perform corrosion mitigation works on damaged or corroded towers.
Perform fleet wide risk assessment to identify corrosion mitigation works based on the structural strength, corrositivity zone and failure effects.
Use the emergency restoration structures (ERS) to temporarily reinstate a line impacted by high intensity winds.
5.4 Refurbishment
Continue to install Fall Arrest Systems (FAS) on remaining structures; approximately 78 per cent of the tower fleet will be retrofitted with FAS by 2022
Complete the installation of FAS on all rack structures and ground wire masts in terminal stations by 2022.
Perform structural modelling of existing structures as part of tower upgrades and other lines projects, e.g. conductor and ground wire replacement projects.
Approved project (XC78) to upgrade the strength and serviceability of 108 towers for the Dederang to South Morang 330 kV No.1 and No.2 circuits to the current design standard for overhead lines
22 will be
completed in 2016.
Upgrade the physical strength of an additional 48 structures demonstrating high risk of functional failure due to inadequate design on the Murray switching station to Dederang No.1 and No. 2 circuits by 2022.
21
AS/NZS 7000:2010 Overhead Line Design – Detailed Procedures. 22
AS/NZS 7000:2010 Overhead Line Design – Detailed Procedures.
AusNet Services AMS 10-77
Transmission Line Structures
ISSUE 2 28/08/2015 28 / 29
UNCONTROLLED WHEN PRINTED
6 Appendix A – Corrosivity Zones on the Victorian Transmission Network
AusNet Services AMS 10-77
Transmission Line Structures
ISSUE 2 28/08/2015 29 / 29
UNCONTROLLED WHEN PRINTED
7 Appendix B – Bushfire Consequences on the Victorian Transmission Network