51
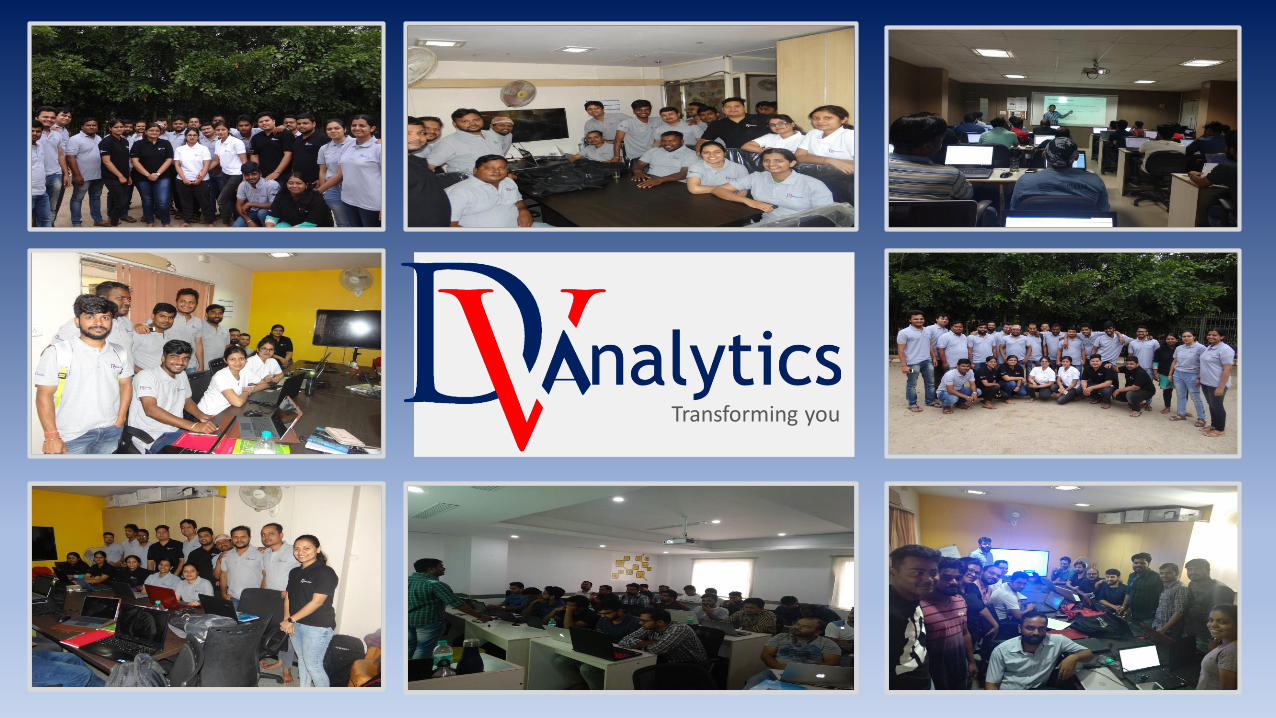
Transforming you Become a Data Scientist An Academy for Data Science Training and Opportunities

Transforming you
Become a
Data Scientist
An Academy for Data Science Training and Opportunities
Transforming you

About usDV Analytics a leading data science training and
consulting firm, led by industry experts. We are aiming to
train and prepare resources to acquire the most in-demand
data science job opportunities in India and abroad
“We not just train, we program you for 100% success”
Quick facts
Our Features
1
2
3
4
5
6
Training: Classroom/Online/Corporate/Crash Courses
Projects: Realtime industry based projects
Proficiency: Classroom video access
Resume: Resume preparation and project support
Support: Mock-interviews, communication and
presentation skill development
Job Referrals: 100% placement support
50+Batched Delivered
1200+Students trained
85%+Students Placed
8.5 Lacs paAverage salary
35+ MNCsReferrals
10+Dedicated Industry
Experts and Faculties
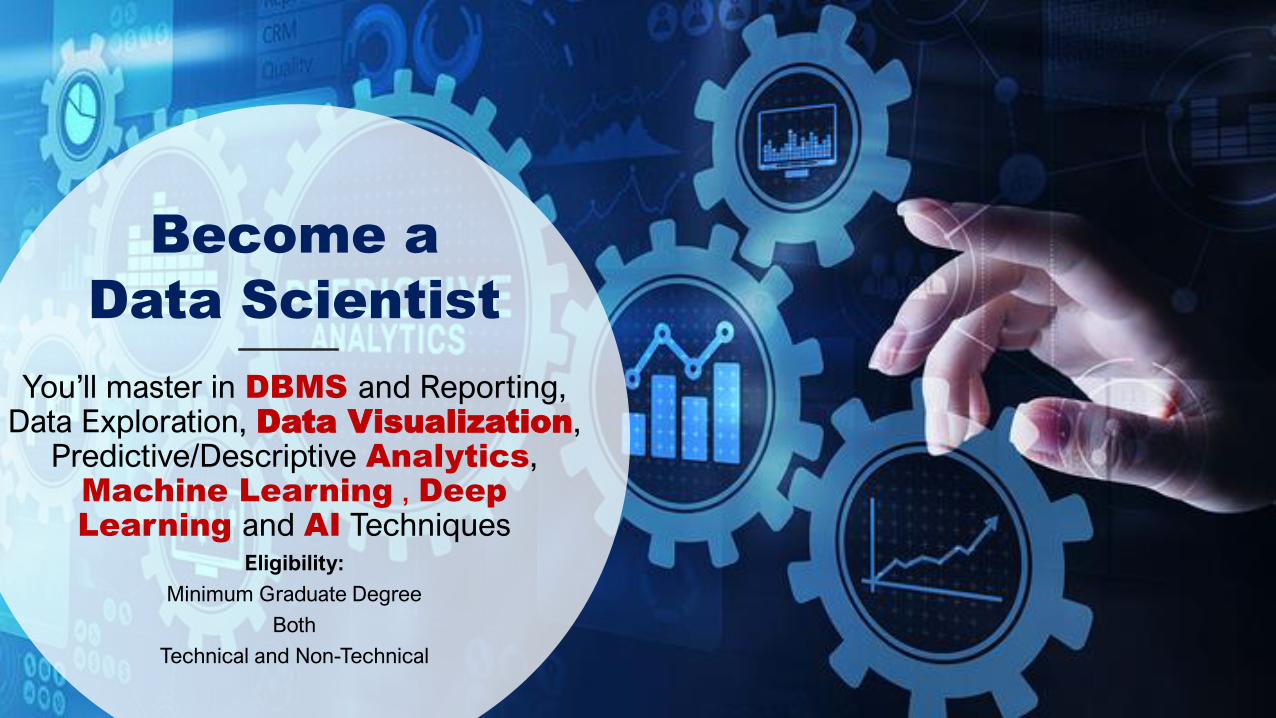
Become a
Data Scientist
You’ll master in DBMS and Reporting, Data Exploration, Data Visualization,
Predictive/Descriptive Analytics, Machine Learning , Deep Learning and AI Techniques
Eligibility:
Minimum Graduate Degree
Both
Technical and Non-Technical
Step-1 Journey to DBMS
and Reporting Skill
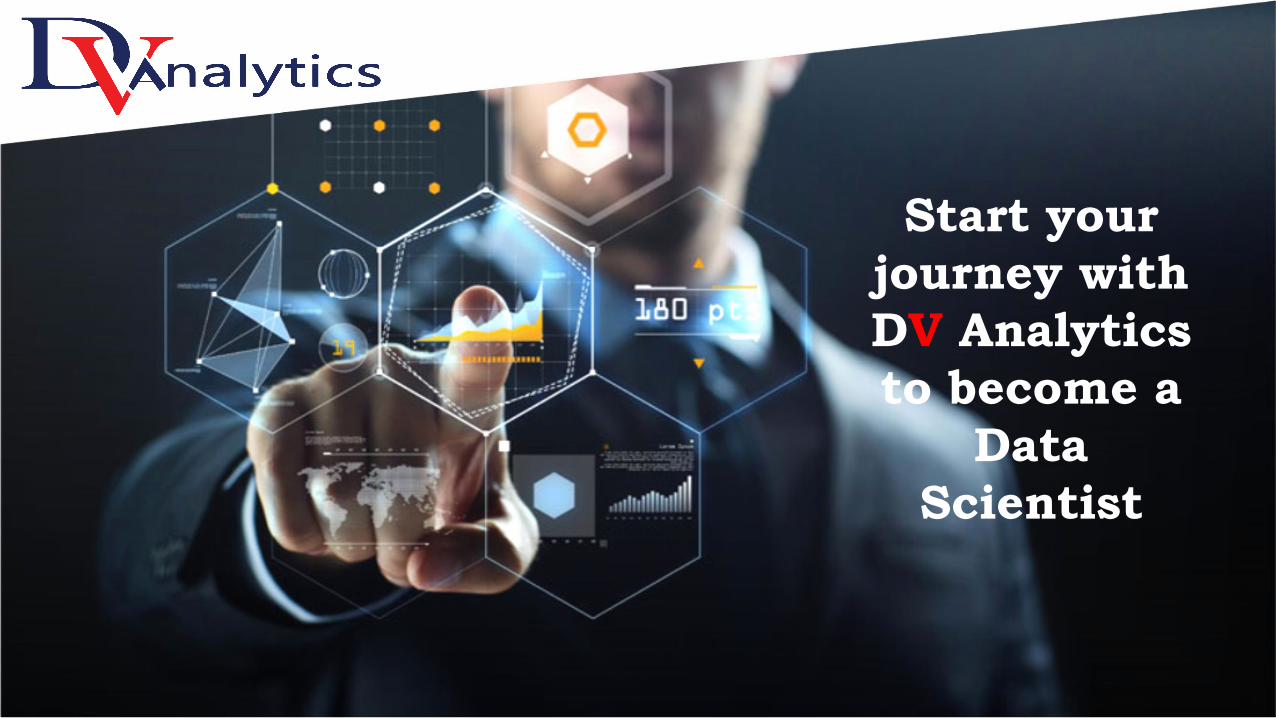
Start your
journey with
DV Analytics
to become a
Data
Scientist

In this program you learn how to read
data from multiple source files. Design
complex data model using joins and
relationship concept along with
manipulation techniques and automation
process
Analytics Type:Managing data to create a summary
view of analysis and reporting of what is
happening?
In this program you learn how to design
associative data model. Designing of KPI
Metrics and prepare drill down and story
telling dashboard using advanced data
visualization applications
Analytics Type:Descriptive and Diagnostic analytics
Describe the insights based on the past
information what is happening? And
examine the cause of past results as
why did it happen?
In this program you learn Statistics and its
business applications in terms predicting
the future outcomes from the history
pattern of the data and creating an action
to achieve the optimization technique
using Machine Learning, Deep Learning
and Artificial Intelligence
Analytics Type:Predictive and Prescriptive analytics
What will happen? When and why ? What
should we do?Step-1 Learn DBMS
and Reporting Skill
Step-2 Learn Data Analysis, Insights
Generation and Presentation Skill
Step-3 Learn Predictive Modeling that leads actions using Machine Learning, Deep Learning and AI
Learning Path
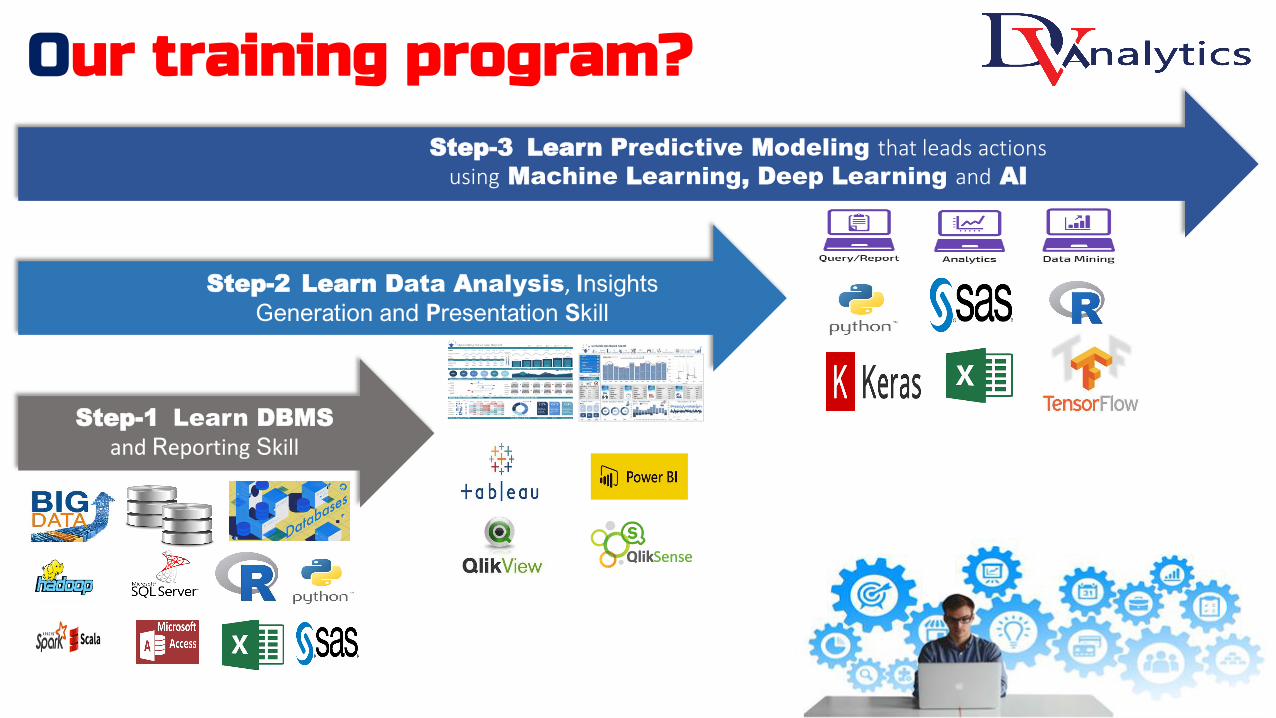
Step-1 Learn DBMS
and Reporting Skill
Step-2 Learn Data Analysis, Insights
Generation and Presentation Skill
Step-3 Learn Predictive Modeling that leads actions using Machine Learning, Deep Learning and AI
Our training program?
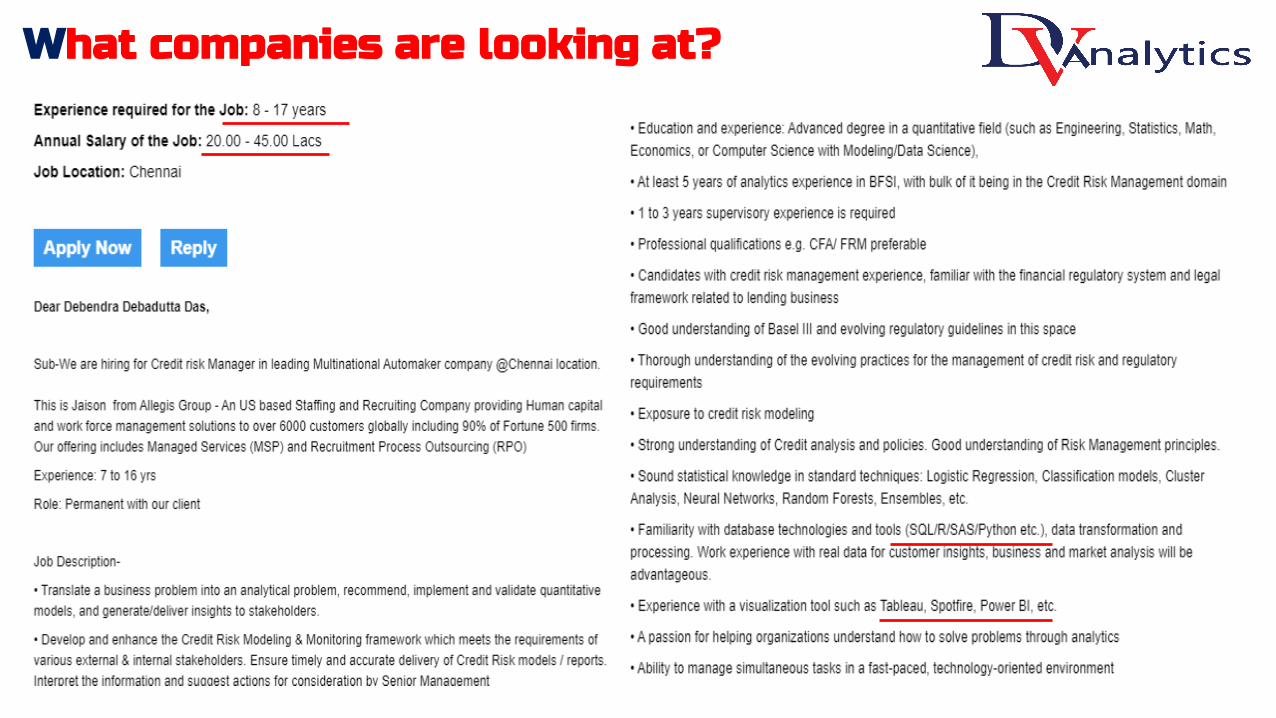
What companies are looking at?

What companies are looking at?
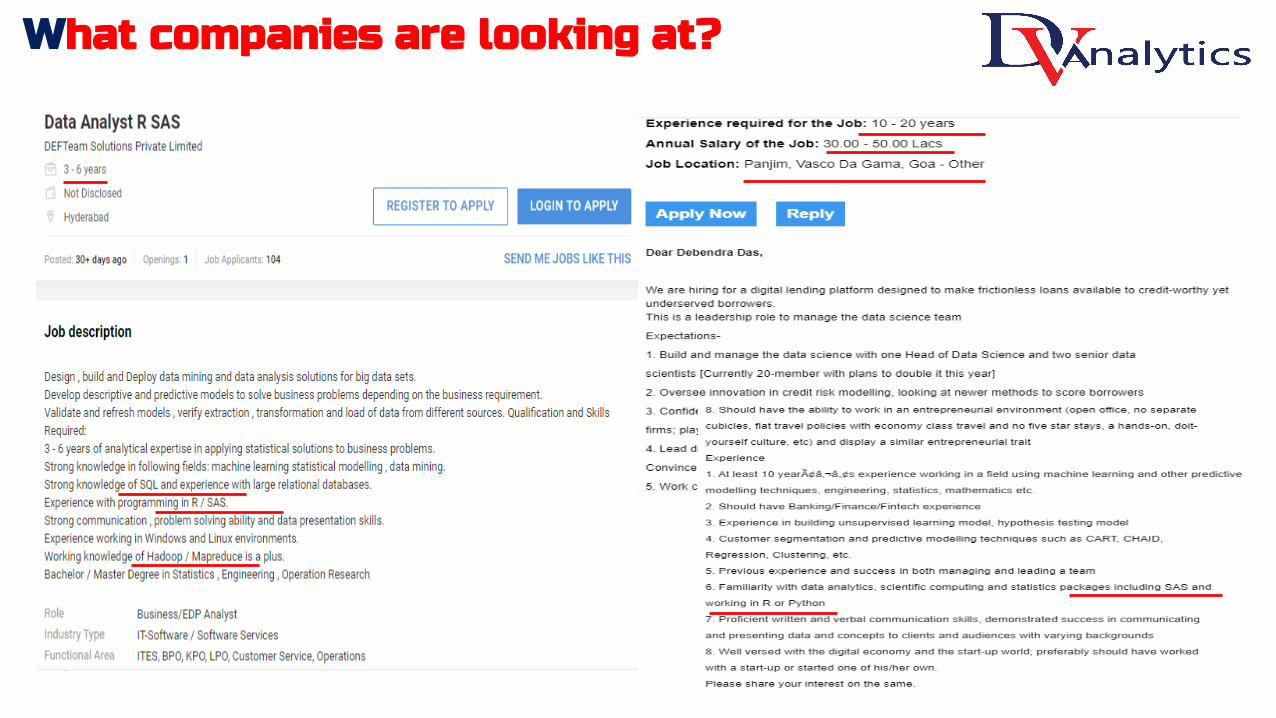
What companies are looking at?


Data Extraction and Processing
Data Wrangling and Exploration
Machine Learning
Deep Learning
Bigdata Processing Framework
Data Visualization
Statistics
Programming Language
Our Training ProgramDBMS and Reporting Skill
• Excel Base and Advanced• Excel VBA• Access (RDBMS)• SQL Server• SAS Base and Advanced• R Programming• Python Programming• Bigdata Hadoop Framework, SPARK Bigdata Eco-system• Spark SQL programming
Data Visualization Skill
• Tableau Base and Advanced• Power BI Base and Advanced• Qlikview Base and Advanced• Qliksense Base and Advanced
Data Mining Skill
• Statistics (Theory)/Business Analytics Applications• Predictive Modeling in SAS/R/Python• Machine Learning in SAS/R/Python• Deep Learning in R/Python/TensorFlow/Keras• Artificial Intelligence in R/Python

Our Training Modules
DBMS Reporting + Data Visualization + Data
Mining
DBMS Reporting + Data Visualization + Data
Mining
DBMS Reporting + Data Visualization +
Data Mining
DB
MS
Prog
ram
DBMS Programming SkillsExcel Base and Advanced
Excel VBA
MS Access
Excel Base and Advanced
Excel VBA
MS Access
SQL Server
SAS Base and Advanced
Module-1 Module-2 Module-3 Module-4
DBMS Reporting + Data
Visualization
Tableau Base and Advanced
R Programming
Python Programming
Bigdata and Hadoop Framework
Spark/Scala Programming
Machine Learning SAS/R/Python
Deep Learning R/Python/Tensorflow/Keras
Artificial Intelligence R/Python
DM
Statistics and Business Analytics
Predictive Modeling SAS/Python
Deep Learning Python/Tensorflow/Keras
Excel Base and Advanced
Excel VBA
MS Access
SQL Server
SAS Base and Advanced
R Programming
SQL Server
SAS Base and Advanced
Python Programming
Tableau Base and Advanced
Data Mining SkillsStatistics and Business Analytics
Predictive Modeling SAS/R/Python
Any One from Power BI / Qlikview / Qliksense Any One from Power BI / Qlikview / Qliksense
Statistics and Business Analytics
Predictive Modeling SAS/R
Machine Learning SAS/RMachine Learning SAS/Python
Excel Base and Advanced
Excel VBA
MS Access
SQL Server
SAS Base and Advanced
R Programming
Python Programming
Bigdata and Hadoop Framework
Spark/Scala Programming
Data Visualization SkillsTableau Base and Advanced
Power BI Base and Advanced
Qlikview Base and Advanced
Qliksense Base and Advanced
DV
Tableau Base and Advanced
Power BI Base and Advanced
Qlikview Base and Advanced
Qliksense Base and Advanced
ontents

DBMSand
Programming
SkillsUsing Excel, VBA, Access,
SQL, SAS, R, Python, Hadoop, Spark/Scala
Data Extraction and Processing
Data Wrangling and Exploration
Machine Learning
Deep Learning
Bigdata Processing Framework
Data Visualization
Statistics
Programming Language
EX
C
EL
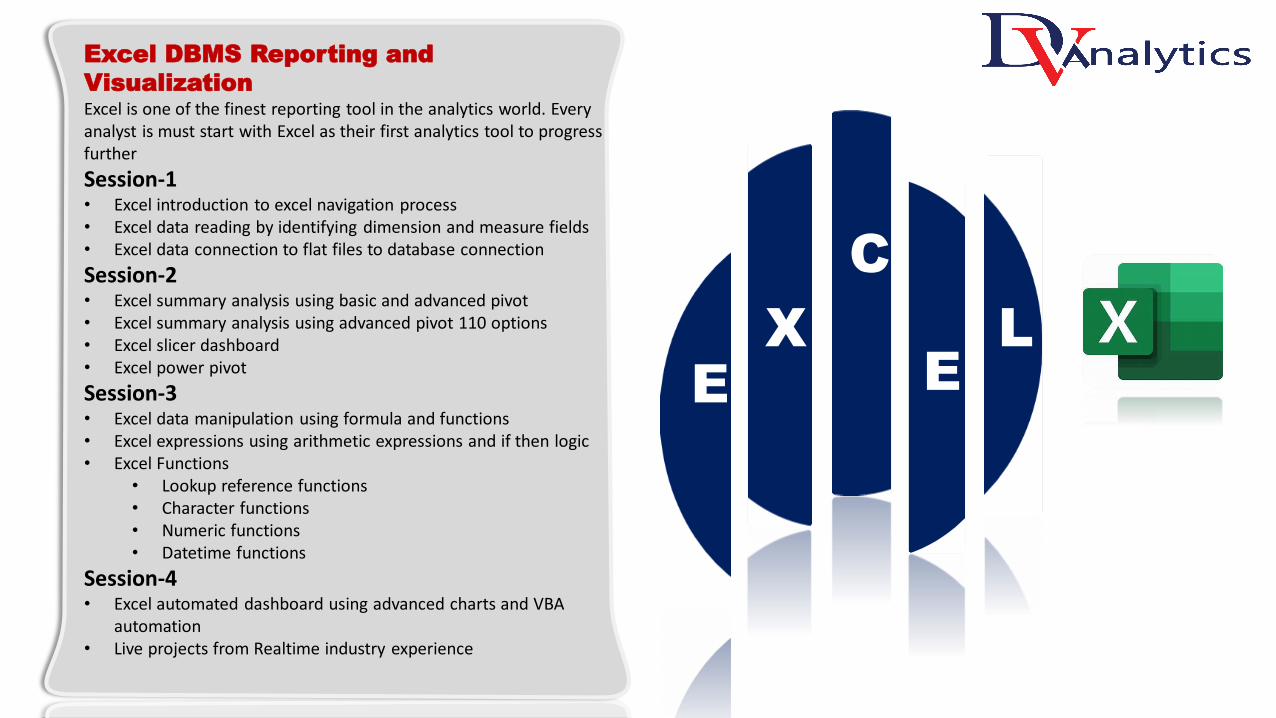
Excel DBMS Reporting and
VisualizationExcel is one of the finest reporting tool in the analytics world. Every analyst is must start with Excel as their first analytics tool to progress further
Session-1• Excel introduction to excel navigation process• Excel data reading by identifying dimension and measure fields• Excel data connection to flat files to database connection
Session-2• Excel summary analysis using basic and advanced pivot• Excel summary analysis using advanced pivot 110 options• Excel slicer dashboard• Excel power pivot
Session-3• Excel data manipulation using formula and functions• Excel expressions using arithmetic expressions and if then logic• Excel Functions
• Lookup reference functions• Character functions • Numeric functions• Datetime functions
Session-4• Excel automated dashboard using advanced charts and VBA
automation• Live projects from Realtime industry experience
Excel VBAVisual Basic for Applications. It's a programming language that enables you to control just about everything in Excel. You'll learn how to create Macros that can be run from things like a button on a spreadsheet.
Session-1• Excel navigation through developer tab• Record the first macro using manual process• Get through excel vba .notation• Do the first macro programming• Vba programming variables
Session-2• VBA conditional logic using If then Else if• Conditional and logical operators• Programming Loops and Arrays• String Functions
Session-3• Subs and Functions• VBA code for data importing and connection to db• Advanced VBA queries for sheet navigation and filters
Session-4• Excel VBA user forms• Excel VBA Charts, Embedded Charts, Charts and User Forms etc
V
A
isual
asic
pplication

C
MS Access (RDBMS)Get the first step into Relational Database Management SystemKnowing access we can get an understanding of query writing, joining and relationship data model designing. It is good to have access knowledge before entering in SQL,SAS,R and Python
Session-1• What is Database• What is table and data types in designing columns• Concept of RDBMS• Data Importing and Exporting in Access
Session-2• Access Queries (select, maketable, append, update, delete,
crosstab, union and union all)
Session-3• Joining tables ( Inner Join, Left Join, Right Join, Left Null, Right
Null, Full join, Un-Matched Join)• Relationship (one to many, many to one, one to one, many to
many). Data Model designing using fact and dimension tables• Keys (Primary Key, Foreign Keys, Composite/Candidate Keys)• Referential Integrity
Session-4• Access Functions and Expression
• If Then Logic, Character/Numeric/Date time functions• Projects with industry real time data analysis experience
SQL ServerMicrosoft SQL Server is a relational database management system. Primary objective is to store data and retrieve data by other software. SQL uses queries to manipulate , design complex data models
Session-1• Introduction SQL server and installation procedure• Creating database and database objects• Dropping and using database• SQL command over DDL,DML,DCL and DQL• SQL create table and data types in designing table along with constraints.• Table objects and alteration of table by adding/dropping/renaming columns• Data importing and exporting using wizard• Dropping/Deleting and Truncating table
Session-2• Select Queries , SQL clauses, SQL summary query • Advanced SQL queries using case and when, pivot and unpivot, update with case and when
sub queries
Session-3• SQL Joins and Relationship
• Vertical Join- Appending• Horizontal Join- Merging
• Inner Join• Outer Join
• Full outer join• Un-matched join
• Left outer join• Left null join
• Right outer join• Right null join
• Keys and Relationships• SQL data model designing using fact and dimension table concept for start schema and
snowflakes• SQL sub-queries• Sub-queries vs partition by vs with clause• Rank () over, Dense_rank () over, Row() over etc
Session-4• SQL Functions
• Character• Numeric• Datetime
Session-5• SQL Views• SQL Store Procedure• SQL Live projects with designing data model from complex data

SAS ProgrammingSAS (Statistical Analysis System). SAS is a business application software which is used for DBMS and reporting, visualization and data mining purpose. To begin with sas we must start with sas data manipulation using sas programming
Session-1• SAS Jargons and navigation though SAS PC ad SAS EG windows• Create first dataset using cards and Datalines• SAS programming step. SAS libraries/datasets and variables followed by criteria• Get familiar to sas data types and reading sas into sas using proc import and
export, infile and file statement. Connecting to database using proc sql connect
Session-2• SAS Library and Datasets descriptions• SAS options and statements using keep,drop,rename and where etc• If then and then do statement• Sas user defined formats. Data transposing using sas
Session-3• SAS vertical join- appending tables and scenarios• SAS joins and relationship. SAS merging vs SAS SQL join• SAS fact and dimension table data model designing• SAS relationship concept
Session-4• SAS loops and arrays• SAS first. And last. • SAS functions (Character, Numeric and Datetime)
Session-5• SAS Summary report (Proc means, summary, univariate, freq, report and tabulate)
Session-6 (Advanced SAS)• Introduction to SAS SQL• Retrieving data using
• Select, statement and clauses Where, Group by, Order by, Having clause
• SAS SQL Options• How to create a new table from an existing table• Altering table, creating index and views• Use of case and when statement• Update query, Updating a Table with Values from Another Table• Delete query• Appending Table• SAS SQL Join, Except and Intersect• SAS SQL advanced sub-queries by examples• Creating macro variable using sas sql
• SAS MaIntroduction to Macro Facility• Creating my first macro using parameters• Understand the concept of macro statement, options and functions• Creating Macro Variable using %Let, Keyword and Positional parameters,
Call symput • Macro debugging options• Conditional macro statement
• %if %then • %do %end
• Macro Expressions• Macro Quoting• Macro Functions • Storing and using of Macros
Programming Base and Advanced
R ProgrammingR is a statistical programming language. However, R programming can be used for data manipulation and analysis. Hence, we must get familiar to the programming langue in R
Session-1• What is R• Installation guide to R• Basic features of R• R resources• Limitation of R• R Nuts and Bolts
• Entering Input , Evaluation, R Objects, Numbers, Attributes, Creating Vectors, Mixing Objects, Explicit Coercion, Matrices, Lists, Factors, Missing Values, Data Frames, Names, Summary
Session-2• R data reading importing and exporting
• Reading and Writing Data
• Reading Data Files with read.table()
• Reading in Larger Datasets with read.table• Calculating Memory Requirements for R Objects
Session-3• R packages • Using Textual and Binary Formats for Storing Data• File connections• Reading Lines of a Text File• Reading from a URL Connection• Subsetting R Objects
• Subsetting a Vector, Subsetting a Matrix, Subsetting a Lists, Subsetting Nested Elements of a List, Extracting Multiple Elements of a List, Partial Matching, Removing NA Values
Session-4• R Functions (String, Numeric and Datetime)
• Loop Functions• Looping on the Command Line, lapply(), sapply(), split(), splitting a data
frame, tapply(), apply(), Col/Row sums and means, Other ways to apply,
Mapply(), Vectorizing a function
• Scoping rules of R
Session-5 Managing Data Frames with the dplyr package• Data Frames• Merge Data Frames in R: Full and Partial Match• The dplyr Package• dplyr Grammar• Installing the dplyr Package
Select(), Filter(), Arrange(), Rename(), Mutate(), Group_by(), %>%,
Summary
Session-6 • Control structure
• If Else, For Loops, Nested for Loops, While Loops, Repeat Loops, Next, Break, Summary
• Debugging• R profiling
• Generating Random Numbers, Setting the random number seed,
Simulation a Linear Model, Random Sampling
Programming Base and Advanced

Python ProgrammingPython is a high-level programming language and it is mainly used in the field of mathematics and complex program designing, web development, software development and system scripting. However we will learn Python program uses for data analytics here
Session-1• Python Overview and Installation steps• Introduction to Python Editors & IDE's (Canopy, Pycharm, Jupyter, Rodeo,
Ipython etc…)• Work around Jupiter Notebook and its customized settings• Importing Packages (NumPy, SciPy, scikit-learn, Pandas, Matplotlib, etc)• Installing & loading Packages & Name Spaces• Data Types & Data objects/structures
• Strings• Tuples• Lists• Dictionaries
• Variable Types and Values• Reading and writing data (Importing and Exporting)
• Importing Data from various sources (Csv, txt, excel, access etc)• Database Input (Connecting to database)• Viewing Data objects - subsetting, methods• Exporting Data to various formats• Important python modules: Pandas, beautifulsoup
Session-2• Data Manipulation Steps
• Sorting/ Filtering• Duplicate data handling• Sampling/Subsetting• Derived variable• Data type conversion• Renaming• Formatting
Session-3 Joining• Vertical Join- Appending• Horizontal Join- Merging
• Inner Join• Outer Join
• Full outer join• Un-matched join
• Left outer join• Left null join
• Right outer join• Right null join
• Keys and Relationships
Session-4 Control flow & conditional statements
If-ElseLoops (For and While)
Python FunctionsBuilt-in
Text, Numeric, Date, Utility User defined function
Session-5 • Data Analysis and Visualization steps
• Creating graphs• Bar chart• Pie chart• Line chart• Histogram• Boxplot• Scatter• Density
• Introduction to model building steps• Data exploration and validation• Descriptive statistics, Frequency
Tables and summarization• Univariate Analysis (Distribution of
data & Graphical analysis)• Bivariate Analysis (Cross Tabs,
Distributions & Relationships, Graphical analysis)
Programming Base and Advanced
BIGDATA Hadoop FrameworkWe live in data world and being a data scientist we must understand the data structure to be managed and analyzed. This course help you to understanding complex architectures of hadoop and its components, guide you in the right direction to start with, and quickly start working with Hadoop and its components
Session-1• Understanding data structure and the concept of Bigdata• Introduction to Hadoop• Hadoop Installation process• Hadoop Eco-system• Hadoop Vendors in the market and Hadoop on Cloud• BI and Data warehousing process using ETL vs ELT• Hadoop vendors and HDFS commands
Session-2• Introduction to Hive and Hive architect• Hive data model , file formats in Hive• Hive Query language vs SQL • UDF and UDAF in Hive• Understand modern data architecture: Data Lake• Live project in data model design and data pipeline
Session-3• Introduction to Pig and Pig Architect• Pig data model , file formats in Hive• Hive Query language vs SQL vs Pig • UDF in Pig• Understand how Pig Latin works in Pig• Understand modern data architecture: Data Lake• Live project in data model design and data pipeline

Spark and Scala with Bigdata
FrameworkWe live in data world and being a data scientist we must understand the data structure to be managed and analyzed. This course help you to understanding complex architectures and the skills like Scala and Spark how to manage and analyze bigdata. You will learn here Scala programming and spark2.0 dataframes for reading data and manipulation. Using spark managing bigdata process and spark on AWS and DataBricks
Session-1• Understanding data structure and the concept of Spark Bigdata framework• Scala IDE overview and installation process in OS• My first programming in scala • Scala programming step-1
• Variables and values, data types, Strings and basic regex, operator and expressions, Tuples,
• Scala collections• What is collections, Lists, Arrays, Sets, Maps,
Session-2• Scala Programming step-2
• Flow control (if the else if), Loops, (for and while), Functions• Data reading and accessing various file formats
Session-3• Spark dataframes with Scala step-3
• Introduction to spark dataframes• Dataframe overview• Spark Dataframes operations• Group by and aggregate functions• Missing data treatments• Date and time stamps
• Dataframe projects

DATAVISUALIZATION
and
ReportingSkills
Using Tableau, Power BI, Qlikview and Qliksense
Data Extraction and Processing
Data Wrangling and Exploration
Machine Learning
Deep Learning
Bigdata Processing Framework
Data Visualization
Statistics
Programming Language
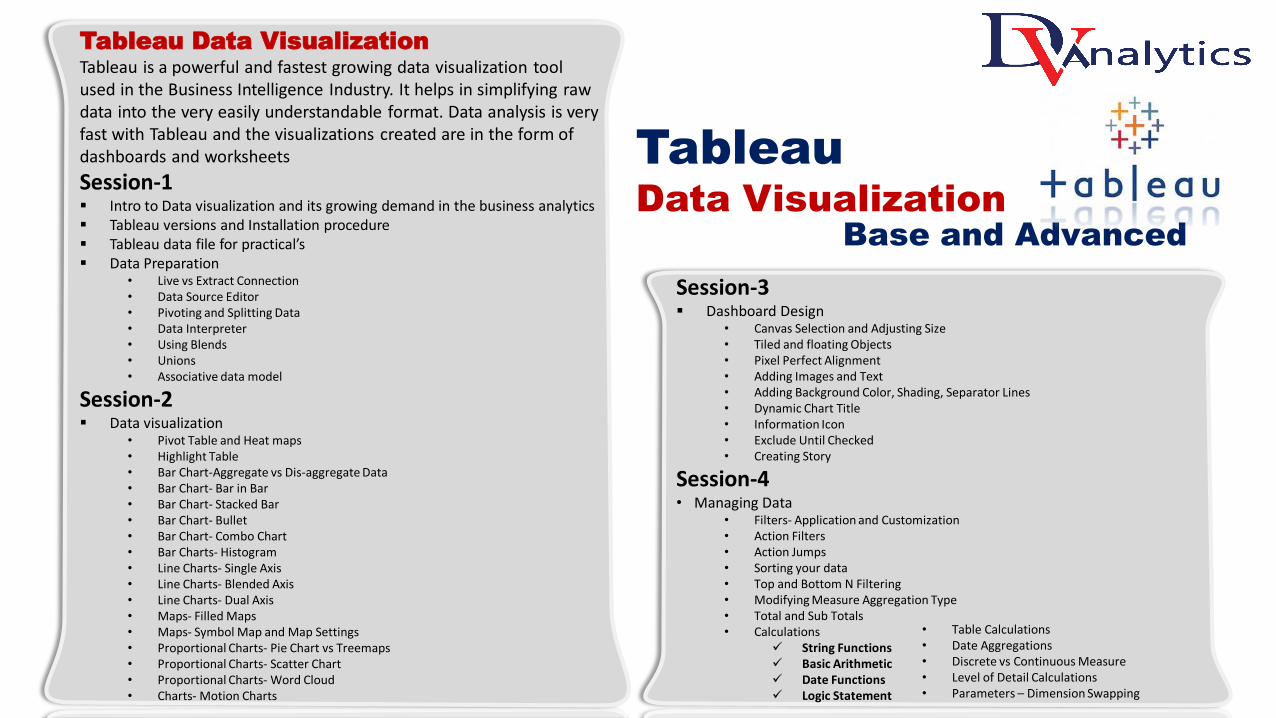
Tableau Data VisualizationTableau is a powerful and fastest growing data visualization tool used in the Business Intelligence Industry. It helps in simplifying raw data into the very easily understandable format. Data analysis is very fast with Tableau and the visualizations created are in the form of dashboards and worksheets
Session-1▪ Intro to Data visualization and its growing demand in the business analytics▪ Tableau versions and Installation procedure▪ Tableau data file for practical’s▪ Data Preparation
• Live vs Extract Connection• Data Source Editor• Pivoting and Splitting Data• Data Interpreter• Using Blends• Unions• Associative data model
Session-2▪ Data visualization
• Pivot Table and Heat maps• Highlight Table• Bar Chart-Aggregate vs Dis-aggregate Data• Bar Chart- Bar in Bar• Bar Chart- Stacked Bar• Bar Chart- Bullet• Bar Chart- Combo Chart• Bar Charts- Histogram• Line Charts- Single Axis• Line Charts- Blended Axis• Line Charts- Dual Axis• Maps- Filled Maps• Maps- Symbol Map and Map Settings• Proportional Charts- Pie Chart vs Treemaps• Proportional Charts- Scatter Chart• Proportional Charts- Word Cloud• Charts- Motion Charts
Session-3▪ Dashboard Design
• Canvas Selection and Adjusting Size• Tiled and floating Objects• Pixel Perfect Alignment• Adding Images and Text• Adding Background Color, Shading, Separator Lines• Dynamic Chart Title• Information Icon• Exclude Until Checked• Creating Story
Session-4 • Managing Data
• Filters- Application and Customization• Action Filters• Action Jumps• Sorting your data• Top and Bottom N Filtering• Modifying Measure Aggregation Type• Total and Sub Totals• Calculations
✓ String Functions✓ Basic Arithmetic✓ Date Functions✓ Logic Statement
TableauData Visualization
Base and Advanced
• Table Calculations• Date Aggregations• Discrete vs Continuous Measure• Level of Detail Calculations• Parameters – Dimension Swapping
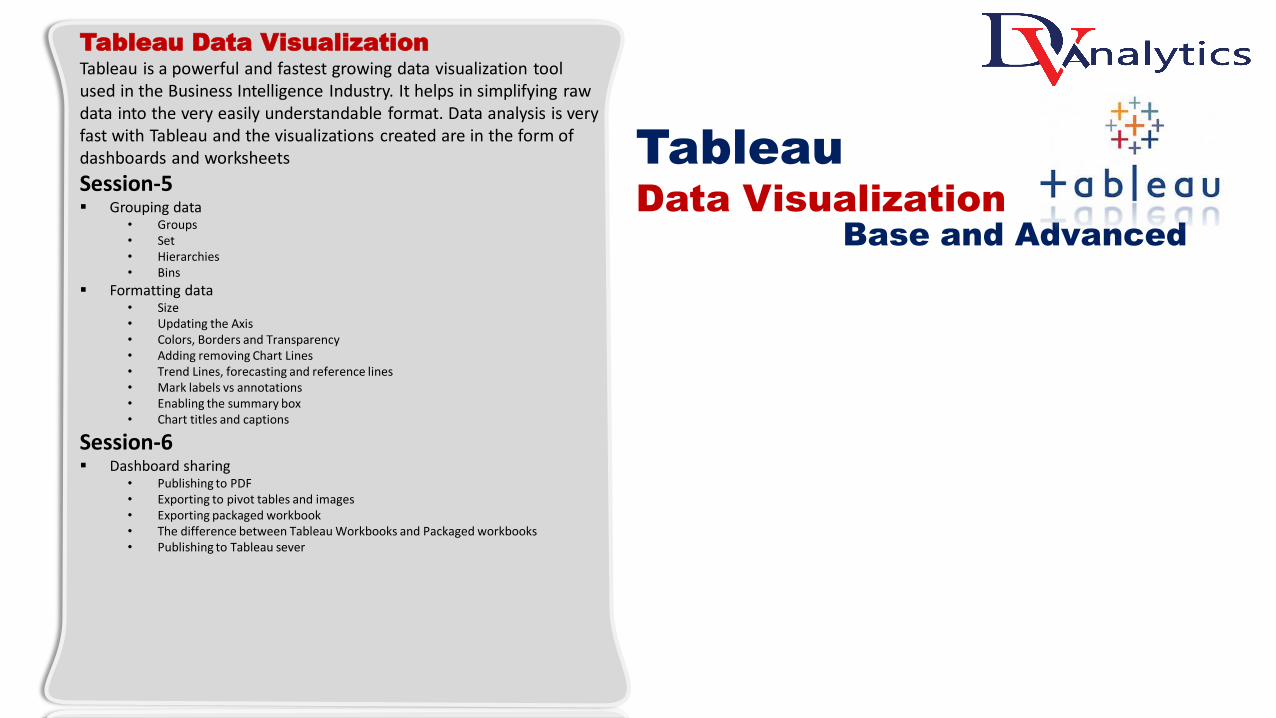
Tableau Data VisualizationTableau is a powerful and fastest growing data visualization tool used in the Business Intelligence Industry. It helps in simplifying raw data into the very easily understandable format. Data analysis is very fast with Tableau and the visualizations created are in the form of dashboards and worksheets
Session-5▪ Grouping data
• Groups • Set• Hierarchies• Bins
▪ Formatting data• Size• Updating the Axis• Colors, Borders and Transparency• Adding removing Chart Lines• Trend Lines, forecasting and reference lines• Mark labels vs annotations• Enabling the summary box• Chart titles and captions
Session-6▪ Dashboard sharing
• Publishing to PDF• Exporting to pivot tables and images• Exporting packaged workbook• The difference between Tableau Workbooks and Packaged workbooks• Publishing to Tableau sever
TableauData Visualization
Base and Advanced

Power BI Data VisualizationPower BI is a business analytics service by Microsoft. It aims to provide interactive visualizations and business intelligence capabilities with an interface simple enough for end users to create their own reports and dashboards
Session-1▪ My first dashboard in power bi and a demo▪ Introduction to POWER BI as a data visualization tools and its objects for
navigation▪ Data importing
▪ From flat file (.csv and .txt)▪ From database file (.xlsx and .accdb)▪ From Database connection ( ODBC and OLEDB)▪ From folders▪ From Web files
▪ Data preparation▪ Cleansing data▪ Formatting data▪ Removing duplicates ▪ Adding columns and creating expression▪ Associative data model designing
▪ Data Visualization- Designing Interactive dashboard▪ Bar chart, Line Chart, Pie Chart, Stacked Bar Chart, Clustered column chart, Area
chart, Combo chart, Scatter chart, Tree map chart, funnel chart, Gauge chart, KPIs, Tables, Slicers and connections, Maps
Session-2▪ Data Model
▪ Joining and relationship▪ Data model designing
▪ Star schema ▪ Snowflakes
▪ OLTP vs OLAP
▪ Introduction to Data Analysis Expression ( DAX )▪ DAX data types, DAX operations and syntaxes, M vs DAX, Columns and
measures (Aggregate functions)▪ DAX time intelligence and master calendar using functions
Session-3• Adding Calculated field with DAX
• Calculated Columns vs. Measures• Row Context vs. Filter Context in Power BI• DAX Syntax & Operators• Common Power BI Functions• Basic Date & Time Formulas• Logical & Conditional Statements• Text, Math & Stats Functions• Joining Data with RELATED• CALCULATE, ALL & FILTER Functions• DAX Iterators (SUMX, AVERAGEX)• Time Intelligence Formulas• DAX & Power BI Best Practices
Session-4• Personal - Enterprise Gateway• Dashboard sharing and collaboration
• Sharing and Collaboration• Sharing Dashboard• Sharing Workspaces• Sharing App• Publish To Web
Power BI Data Visualization
Base and Advanced
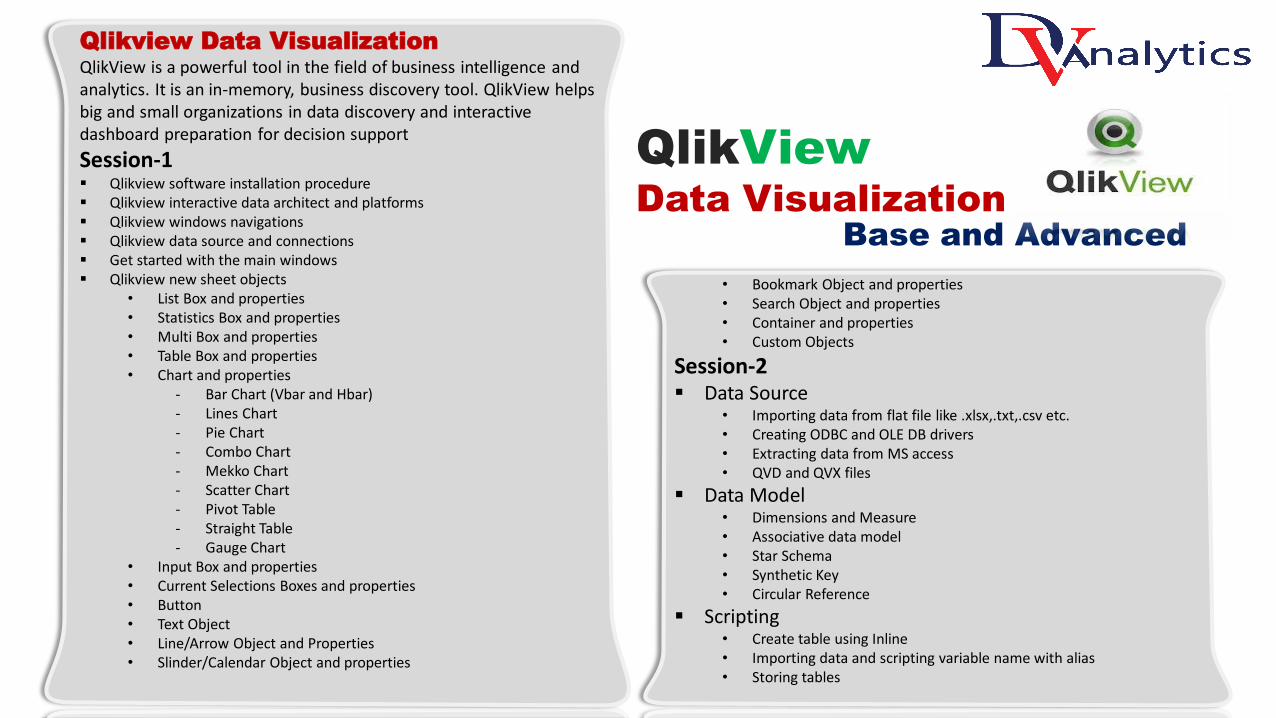
Qlikview Data VisualizationQlikView is a powerful tool in the field of business intelligence and analytics. It is an in-memory, business discovery tool. QlikView helps big and small organizations in data discovery and interactive dashboard preparation for decision support
Session-1▪ Qlikview software installation procedure▪ Qlikview interactive data architect and platforms▪ Qlikview windows navigations▪ Qlikview data source and connections▪ Get started with the main windows▪ Qlikview new sheet objects
• List Box and properties• Statistics Box and properties• Multi Box and properties• Table Box and properties• Chart and properties
- Bar Chart (Vbar and Hbar)- Lines Chart- Pie Chart- Combo Chart- Mekko Chart- Scatter Chart- Pivot Table- Straight Table- Gauge Chart
• Input Box and properties• Current Selections Boxes and properties• Button• Text Object• Line/Arrow Object and Properties• Slinder/Calendar Object and properties
• Bookmark Object and properties• Search Object and properties• Container and properties• Custom Objects
Session-2▪ Data Source
• Importing data from flat file like .xlsx,.txt,.csv etc.• Creating ODBC and OLE DB drivers• Extracting data from MS access• QVD and QVX files
▪ Data Model• Dimensions and Measure• Associative data model• Star Schema• Synthetic Key• Circular Reference
▪ Scripting• Create table using Inline• Importing data and scripting variable name with alias• Storing tables
QlikViewData Visualization
Base and Advanced

Qlikview Data VisualizationQlikView is a powerful tool in the field of business intelligence and analytics. It is an in-memory, business discovery tool. QlikView helps big and small organizations in data discovery and interactive dashboard preparation for decision support
Session-2• Renaming tables and fields• Drop table• Deleting tables and fields• If nested if statement• Join statement• Keep statement• Concatenate and No Concatenate• Using mapping tables
Session-3▪ Functions
• String operators • String functions• Numeric functions• Datetime functions
▪ Chapter9-Advanced Expression• Creating Variables using Set and Let• Using Variables in Expressions and Charts• Calling variables in objects
▪ Chapter10-Conditional Functions• If function• Class function• Pick function
Session-4▪ Security
• Hidden Script• Section Access
- Section access fields- Reduction fields- Initial data reduction- Omitting fields
• Document Level Security• Sheet Level security
QlikViewData Visualization
Base and Advanced

QlikSense Data VisualizationQlik Sense Desktop is a Windows application that gives individuals the opportunity to use Qlik Sense and create personalized, interactive data visualizations, reports, and dashboards from multiple data sources with drag-and-drop ease
Session-1• What is Qlik Sense and how does it works• QlikSense for desktop and installation• Opening QlikSense Desktop• Opening App• Sheet View• Data loading in Qlik Sense• Creating a new app• Data loading from flat files• Adding connections• ODBC data connection• OLEDB data connection• Editing the data load script• Debugging the load scriptCombining tables with Join and Keep• Join |Using Join| Keep| Inner| Left| RightUsing inter-record functions• Peek| Previous| Exists| UsingPeek() and Previous()| UsingExists()Transforming data• Preceding Load | resident Load |Concatenation |Synthetic Key |
Circular Reference• Using Data• Creating a sheet | Adding a chart |Adding dimensions and measures• Creating QVD files
Session-2Visualization in app
• Measures and dimensions
• Visualizations• Filter Panes, Pie Chart, Bar Chart, Combo Chart• Text and Image Chart, Gauge, Line Chart, Treemap
• Making selections• Click Selection• Draw Selection• Range Selection• Lasso Selection• Legend Selection• Label Selection
• Selection States• Green, White and Gray• Making the first selection• Selecting regions and product type• The excluded values• Selected excluded values • Stepping back in the selection history
• Storytelling• Creating simple story and switching between data
storytelling and the app context
QlikSenseData Visualization
Base and Advanced

DATA Mining
&
DATA ScienceSkills
Using SAS, R, Python, TensorFlow and Keras
Data Extraction and Processing
Data Wrangling and Exploration
Machine Learning
Deep Learning
Bigdata Processing Framework
Data Visualization
Statistics
Programming Language
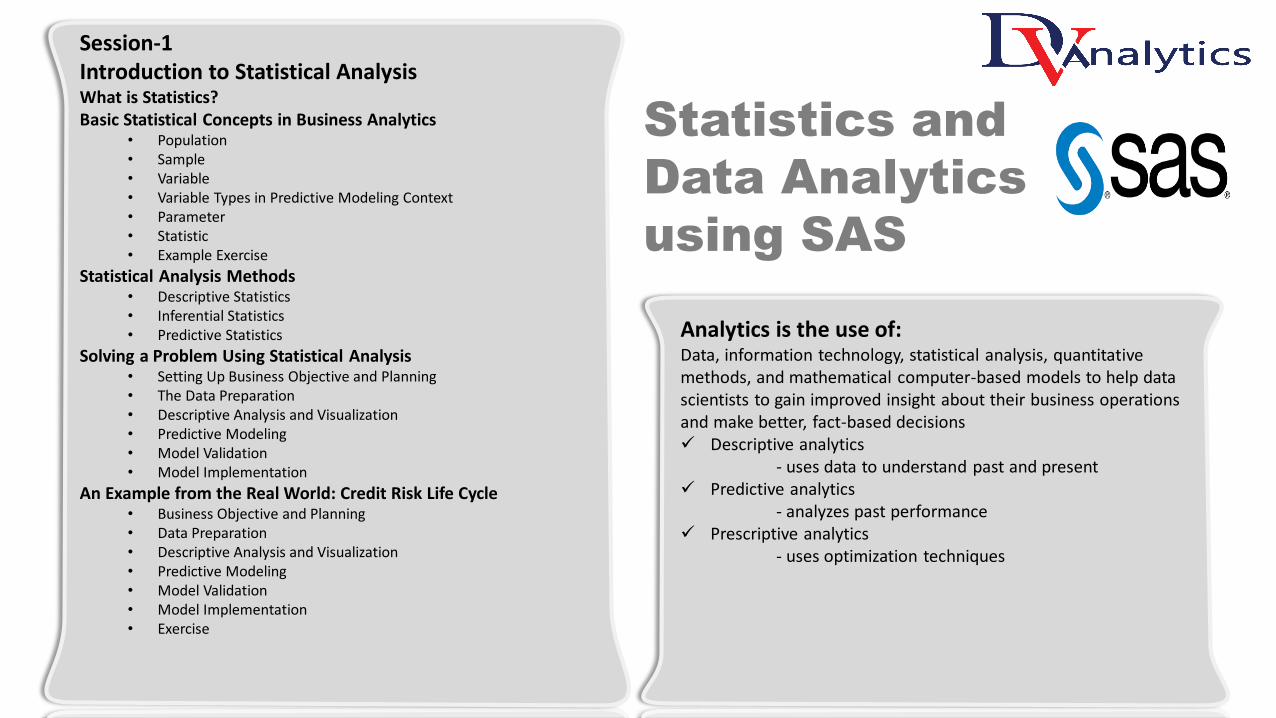
Session-1Introduction to Statistical AnalysisWhat is Statistics?Basic Statistical Concepts in Business Analytics
• Population• Sample• Variable• Variable Types in Predictive Modeling Context• Parameter• Statistic• Example Exercise
Statistical Analysis Methods• Descriptive Statistics• Inferential Statistics• Predictive Statistics
Solving a Problem Using Statistical Analysis• Setting Up Business Objective and Planning• The Data Preparation• Descriptive Analysis and Visualization• Predictive Modeling• Model Validation• Model Implementation
An Example from the Real World: Credit Risk Life Cycle• Business Objective and Planning• Data Preparation• Descriptive Analysis and Visualization• Predictive Modeling• Model Validation• Model Implementation• Exercise
Analytics is the use of:Data, information technology, statistical analysis, quantitative methods, and mathematical computer-based models to help data scientists to gain improved insight about their business operations and make better, fact-based decisions✓ Descriptive analytics
- uses data to understand past and present✓ Predictive analytics
- analyzes past performance✓ Prescriptive analytics
- uses optimization techniques
Statistics and
Data Analytics
using SAS

Session-2Basic Descriptive Statistics and Reporting in SASRudimentary Forms of Data Analysis
• Simply Print the Data• Print and Various Options of Print in SAS
Summary Statistics• Central Tendencies• Calculating Central Tendencies in SAS• What Is Dispersion?• Calculating Dispersion Using SAS• Quantiles• Calculating Quantiles Using SAS• Box Plots• Creating Boxplots Using SAS
Bivariate Analysis
Session-3Data Exploration, Validation, and Data SanitizationData Exploration Steps in a Statistical Data Analysis Life Cycle1. Example: Contact Center Call Volumes
Need for Data Exploration and ValidationIssues with the Real-World Data and How to Solve Them
• Missing Values• The Outliers• Manual Inspection of the Dataset Is Not a Practical Solution• Removing Records Is Not Always the Right Way
Understanding and Preparing the Data• Data Exploration• Data Validation• Data Cleaning
Analytics is the use of:Data, information technology, statistical analysis, quantitative methods, and mathematical computer-based models to help data scientists to gain improved insight about their business operations and make better, fact-based decisions✓ Descriptive analytics
- uses data to understand past and present✓ Predictive analytics
- analyzes past performance✓ Prescriptive analytics
- uses optimization techniques
Statistics and
Data Analytics
using SAS
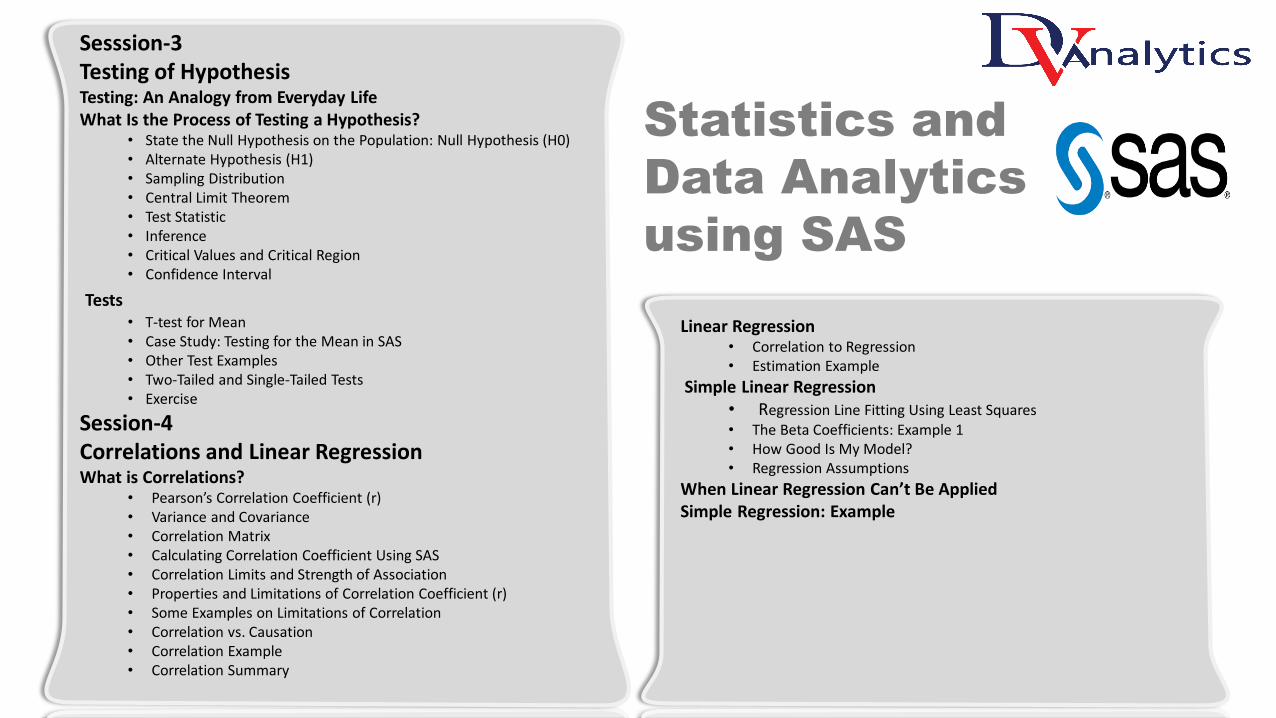
Sesssion-3Testing of HypothesisTesting: An Analogy from Everyday LifeWhat Is the Process of Testing a Hypothesis?
• State the Null Hypothesis on the Population: Null Hypothesis (H0)• Alternate Hypothesis (H1)• Sampling Distribution• Central Limit Theorem• Test Statistic• Inference• Critical Values and Critical Region• Confidence Interval
Tests• T-test for Mean• Case Study: Testing for the Mean in SAS• Other Test Examples• Two-Tailed and Single-Tailed Tests• Exercise
Session-4Correlations and Linear RegressionWhat is Correlations?
• Pearson’s Correlation Coefficient (r)• Variance and Covariance• Correlation Matrix• Calculating Correlation Coefficient Using SAS• Correlation Limits and Strength of Association• Properties and Limitations of Correlation Coefficient (r)• Some Examples on Limitations of Correlation• Correlation vs. Causation• Correlation Example• Correlation Summary
Linear Regression• Correlation to Regression• Estimation Example
Simple Linear Regression• Regression Line Fitting Using Least Squares• The Beta Coefficients: Example 1• How Good Is My Model?• Regression Assumptions
When Linear Regression Can’t Be AppliedSimple Regression: Example
Statistics and
Data Analytics
using SAS
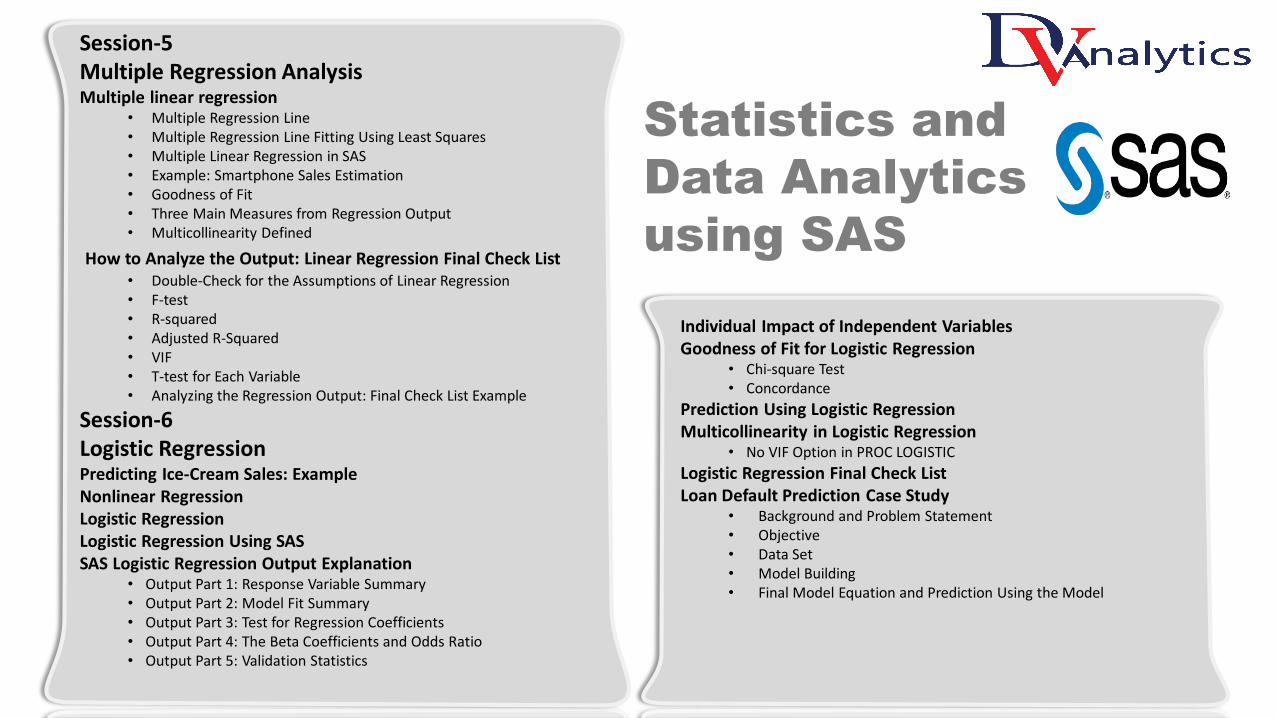
Session-5Multiple Regression AnalysisMultiple linear regression
• Multiple Regression Line• Multiple Regression Line Fitting Using Least Squares• Multiple Linear Regression in SAS• Example: Smartphone Sales Estimation• Goodness of Fit• Three Main Measures from Regression Output• Multicollinearity Defined
How to Analyze the Output: Linear Regression Final Check List• Double-Check for the Assumptions of Linear Regression• F-test• R-squared• Adjusted R-Squared• VIF• T-test for Each Variable• Analyzing the Regression Output: Final Check List Example
Session-6Logistic RegressionPredicting Ice-Cream Sales: ExampleNonlinear RegressionLogistic RegressionLogistic Regression Using SASSAS Logistic Regression Output Explanation
• Output Part 1: Response Variable Summary• Output Part 2: Model Fit Summary• Output Part 3: Test for Regression Coefficients• Output Part 4: The Beta Coefficients and Odds Ratio• Output Part 5: Validation Statistics
Individual Impact of Independent VariablesGoodness of Fit for Logistic Regression
• Chi-square Test• Concordance
Prediction Using Logistic RegressionMulticollinearity in Logistic Regression
• No VIF Option in PROC LOGISTIC
Logistic Regression Final Check ListLoan Default Prediction Case Study
• Background and Problem Statement• Objective• Data Set• Model Building• Final Model Equation and Prediction Using the Model
Statistics and
Data Analytics
using SAS
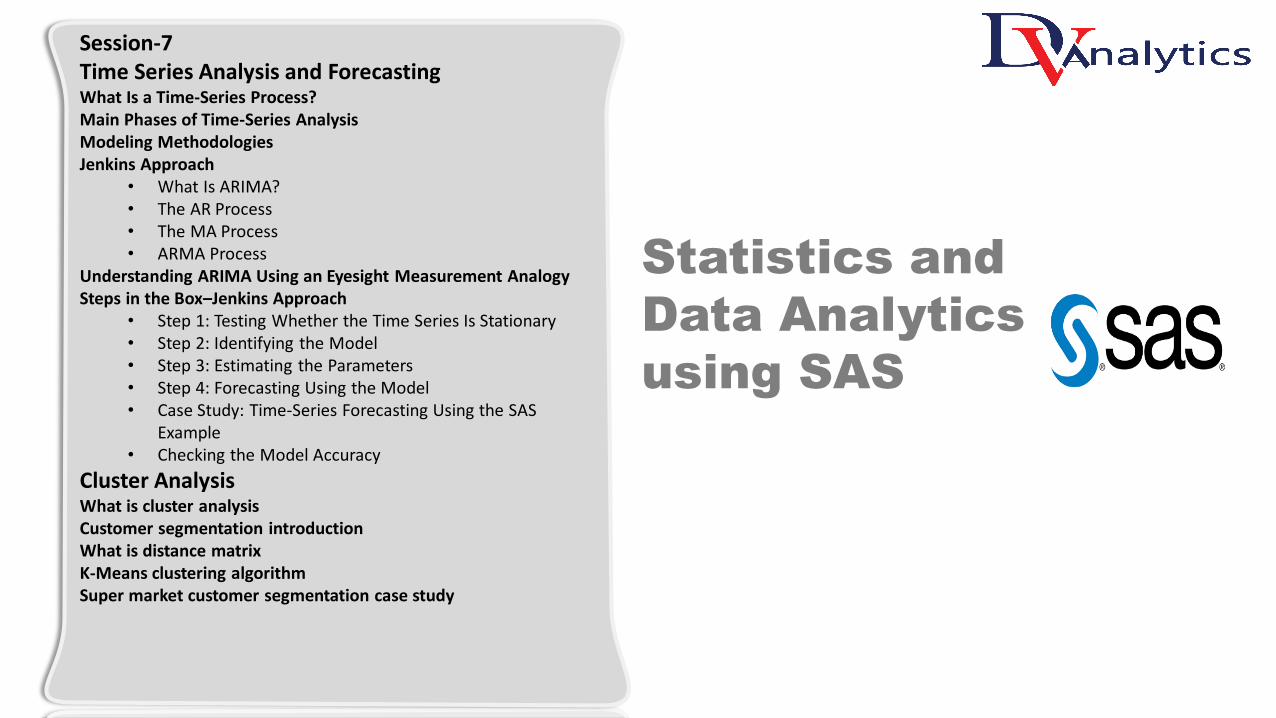
Session-7Time Series Analysis and ForecastingWhat Is a Time-Series Process?Main Phases of Time-Series AnalysisModeling MethodologiesJenkins Approach
• What Is ARIMA?• The AR Process• The MA Process• ARMA Process
Understanding ARIMA Using an Eyesight Measurement AnalogySteps in the Box–Jenkins Approach
• Step 1: Testing Whether the Time Series Is Stationary• Step 2: Identifying the Model• Step 3: Estimating the Parameters• Step 4: Forecasting Using the Model• Case Study: Time-Series Forecasting Using the SAS
Example• Checking the Model Accuracy
Cluster AnalysisWhat is cluster analysisCustomer segmentation introductionWhat is distance matrixK-Means clustering algorithmSuper market customer segmentation case study
Statistics and
Data Analytics
using SAS

Session-1Data Preparation & Regression AnalysisIntroduction to Machine Learning
Introduction to Machine Learning toolsIntroduction to PythonTools comparison The learning paths
Data Exploration, Validation and Sanitization Raw Data - issuesData Exploration for continuous variablesData Exploration for categorical variablesData Validation Data sanitization techniquesMissing value treatmentOutlier treatment Loans data case study and data cleaning
Regression AnalysisCorrelationSimple Regression modelsR-SquareMultiple regressionMulticollinearityIndividual Variable ImpactAir passenger’s data case studySAT score data case study
Machine Learning and
Deep Learning using
Python , TensorFlow and
Keras

Session-2Classification using Logistic Regression and TreesLogistic Regression
Need of logistic RegressionLogistic regression modelsValidation of logistic regression modelsMulticollinearity in logistic regressionIndividual Impact of variablesConfusion MatrixService Provider Attrition data case study
Decision TreesSegmentationEntropyInformation gainBuilding Decision TreesValidation of TreesPruning the treesFine tuning the treesPrediction using TreesCustomer retention case study
Machine Learning and
Deep Learning using
Python , TensorFlow and
Keras
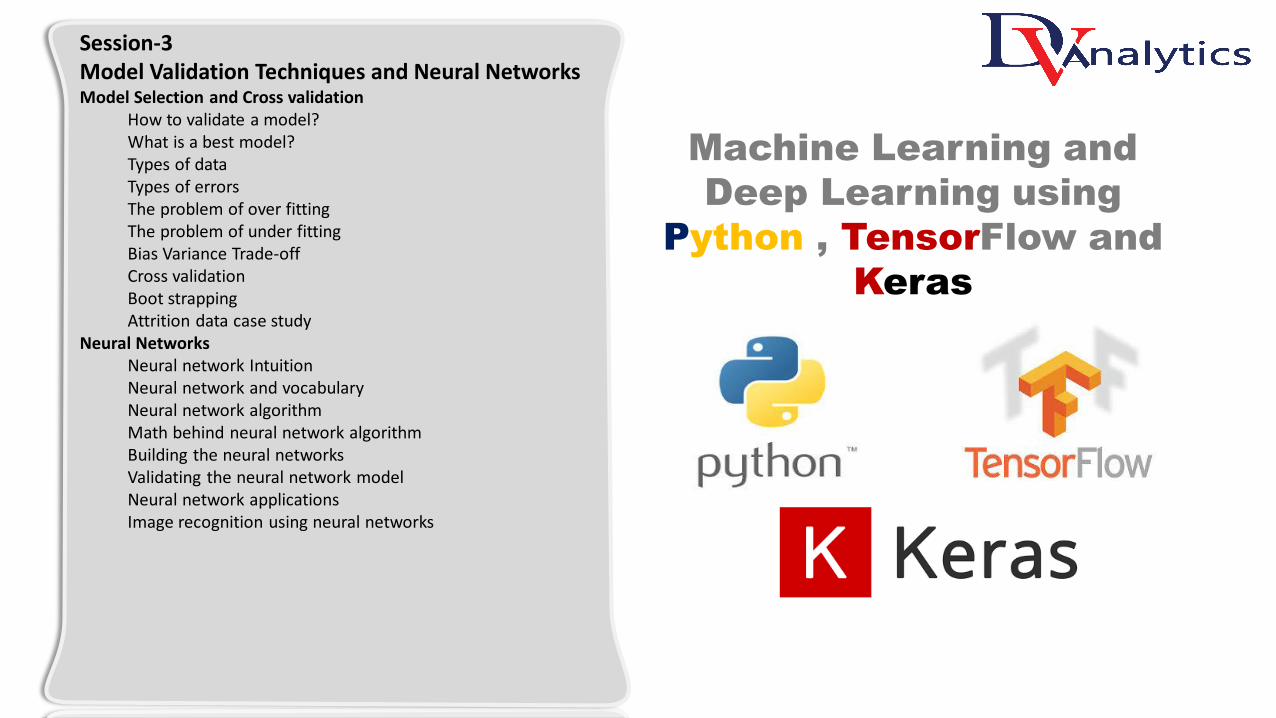
Session-3Model Validation Techniques and Neural NetworksModel Selection and Cross validation
How to validate a model?What is a best model?Types of data Types of errorsThe problem of over fittingThe problem of under fittingBias Variance Trade-offCross validationBoot strappingAttrition data case study
Neural NetworksNeural network IntuitionNeural network and vocabularyNeural network algorithm Math behind neural network algorithm Building the neural networksValidating the neural network modelNeural network applicationsImage recognition using neural networks
Machine Learning and
Deep Learning using
Python , TensorFlow and
Keras
Session-4Random Forest, Boosting and NLP Random Forest and Boosting
IntroductionEnsemble LearningHow ensemble learning worksBagging Building models using BaggingRandom Forest algorithmRandom Forest model buildingFinetuning parameters and model selectionBoosting IntroductionBoosting algorithmGBM Model building and Validating in python
Text Mining and NLPWhat is text miningThe NLTK packagePreparing text for analysisStep by step guide to prepare text dataText summarisationSentiment analysisNaïve bayes technique for sentiment analysisMovie review sentiment analysis
Machine Learning and
Deep Learning using
Python , TensorFlow and
Keras

Session-5Day-5: Introduction to TensorFlow and CNNDeep Learning tool – Tensor Flow and Keras (Wrapper on Tensor Flow)
Deep Learning tool TensorFlowComparison with python libraries Introduction to TensorFlowTensorFlow made easy with Keras Setting up KerasKeras on TensorFlowKeras Basic Commands
CNN CNN IntroductionIssues with Standard ANNKernel filter Convolution layerPooling layerFully connected dense layer Weights and number of parametersBack propagationCNN Model building CNN HyperparametersCNN tips and tricks
Machine Learning and
Deep Learning using
Python , TensorFlow and
Keras
List of Case Studies used in the course1. Bank loans data cleaning – Data exploration and cleaning 2. Air passenger prediction and driver analysis -Regression3. SAT score prediction and driver analysis -Regression 4. E-com Website sales prediction case study -Regression 5. Product sales analysis – Logistic Regression 6. Customer attrition analysis -Logistic Regression 7. Customer Survey Segmentation and Drivers – Decision Trees8. Internet service provider customer segmentation – Decision
Trees9. Customer attrition analysis – Model selection and cross
validation10. Productivity data -Neural networks11. Image recognition -Neural networks12. Car Sensor IOT data -Random forest13. E-com product classification - Boosting14. Movie review data – Sentiment Analysis - NLP15. Restaurants review data analysis – NLP16. News group review text classification – NLP17. Object Recognition problems – CNN18. Digit recognizer – CNN
Machine Learning and
Deep Learning using
Python , TensorFlow and
Keras
Session-1Introduction to R
• Installation procedure• Getting Started in R• R Environment• R Packages• R Data Types Vectors• R Dataframes• List in R• Factor and Matrices• R History and Scripts• R Functions• Errors in R
Data Handling in R• Data handling introduction• Importing the Datasets• Checklist• Subsetting the Data• Subsetting Variable Condition• Calculated Fields _ ifelse• Sorting and Duplicates• Joining and Merging• Exporting the Data
Basic Descriptive Statistics & Reporting• Basic Statistics, Plots and Reporting in R• Introduction and Sampling• Descriptive Statistics• Percentiles and Quartiles• Box Plots• Creating Graphs and Conclusion
Machine Learning and
Deep Learning using

Session-2Data Cleaning and Treatment in R
• Data Cleaning Intro and Model Building Cycle• Model Building Cycle• Data Cleaning Case Study• CS lab Step1 Basic Content of Dataset• Variable Level Exploration Categorical• Reading Data Dictionary• Step2 lab Categorical Variable Exploration• Step3 lab Variable level Exploration – Continuous• Data Cleaning and Treatments• Step 4 Treatment – Scenario 1• Step 4 Treatment – Scenario 2• Data Cleaning – Scenario 3
Machine Learning using R• Regression Analysis• Introduction and Correlation• LAB Correlation Calculation in R• Beyond Pearson Correlation• From Correlation to Regression• Regression Line Fitting in R• R Squared• Multiple Regression• Adjusted R Squared• Issue with Multiple Regression• Multicollinearity• Regression Conclusion
Machine Learning and
Deep Learning using
Session-3Logistic Regression
• Logistic Regression in R• Need of Non-Linear Regression• Logistic Function and Line• Multiple Logistic Regression• Goodness of Fit for a Logistic Regression• Multicollinearity in Logistic Regression in R• Individual Impact of Variables in R• Model Selection in R• Logistic Regression Conclusion
Decision Tree• Handout – Decision Tree in R• Introduction to Decision Tree & Segmentation• The Decision Tree Philosophy & The Decision Tree
Approach• The Splitting criterion &Entropy Calculation• Information Gain & Calculation• The Decision tree Algorithm• Split for Variable & The Decision tree-lab(Part 1)• The Decision tree-lab(Part 2) & Validation• The Decision tree -lab (Part3) & Overfitting• Pruning & Complexity Parameters• Choosing Cp & Cross Validation Error• Two types of Pruning• Tree Building & Model Selection-Lab
Machine Learning and
Deep Learning using

Session-4Model Selection and Cross Validation
• Model Selection and Cross Validation in R• Introduction to Model Selection• Sensitivity Specificity• Sensitivity Specificity Continued• ROC AUC• The Best Model• Errors• Overfitting Underfitting• Bias Variance Treadoff• Holdout Data Validation• Ten Fold CV• Kfold CV
Neural Network• Neural Networks in R• Introduction and LogReg Recap• Decision Boundary• Non Linear Decision Boundary NN• Non Linear Decision Boundary and Solution• Neural Network Intuition• Neural Networks Algorithm• Neural Network Algorithm Demo• Building a Neural Network• Local vs Global Min• Lab Digit Recognizer• Digit Recognizer Second Attempt Part 1• Digit Recognizer Second Attempt Part 2
Machine Learning and
Deep Learning using
Session-5Support Vector Machine – SVM
• Support Vector Machine• Introduction To SVM• The Classifier and Decision Boundary• SVM – The Large Margin Classifier• The SVM Algorithms and Results• SVM on R• Non Linear Boundary• Kernal Tric• Kernal Trick on R• Soft Margin and Validation• SVM Advantages, Disadvantages and Applications• Lab Digit recognize• SVM Conclusion
Random Forest and Boosting• Random Forest and Boosting in R• Introduction to Bagging RF Boosting• Wisdom of Crowd• Ensemble Learning• Ensemble Models• Bagging• Bagging Models LAB• Random Forest• Random Forest LAB• Boosting• Boosting Illustration• Boosting LAB
Machine Learning and
Deep Learning using
Session-6Cluster Analysis
• Handout – Cluster Analysis• Introduction to Clustering via Segmentation• Types of Clusters• Similarities and Dissimilarity• Calculating the Distance• Calculating Distance in R• Clustering Algorithms – Kmeans• Kmeans Clustering on R• More on Kmeans• Data Standardisation and Non-numeric Data
Machine Learning Projects using R• Consumer Loan Default Prediction• Bank Tele Marketing• Automobile Pricing Strategy• Census Income• Direct Mail Marketing• Credit Card Ratings
Machine Learning and
Deep Learning using

50+ 1200+ 85%+ 8.5 Lacs
Our Success in 2019
Batches Delivered Students Our Success Rate Average salary pa (INR)
Transforming you
SravaniBE from Centurion
University, Bhubaneswar
AbinashBTech from KIST,
Bhubaneswar
NeethuMTech from Kerala
LovLinBtech Punjab Technical
University, Punjab
ChandrakantBtech from Trident
Academy, Bhubaneswar
AjayMBA Finance, Bhubaneswar
SoumyaBtech KEC,
Bhubaneswar
GunjanMBA from Madhya
Pradesh
SidharthBE from Madhya
Pradesh
NavneethBtech from Patna
ArchanaBSC from SG Women's
college Rourkela, Odisha
KaushikaBtech from GITA,
Bhubaneswar
SandeepBtech from Trident
Academy, Bhubaneswar
KumalBtech from Trident
Academy, Bhubaneswar
DibyajeetBtech from ITER ,
Bhubaneswar
AshutoshMBA Finance, Puri
RanjanMCA from IISIT ,
Bhubaneswar
SubhashisBtech from Nalanda ,
Bhubaneswar
BiswaBtech from ,
Bhubaneswar
BiswaBtech from Trident
Academy , Bhubaneswar
RupaMCA from ,
Bhubaneswar
MadheshBtech from , Tamilnadu
MadhuriMCA from ,BIT Durg
Chhattisgarh
AbdulBtech from ,
Kerala
More……………….
Become a Data Scientist

Bangalore Branch:Office No-01, L7, 1st Floor, Jeevan Bhima Nagar,Near Water Tank, Above Sagar FoodKarnataka, Bangalore-560075
Bhubaneswar Branch:Govind Tower, 2nd Floor, Raghunathpur, Nandankanan Road, Near HP Petrol Pump, Odisha,Bhubaneswar-754005
Contact: +91 9591793303 / 7483596228


