AN ADAPTIVE APPROACH FOR SEGMENTATION OF 3D LASER POINT CLOUD Z. Lari, A. F. Habib, E. Kwak Department of Geomatics Engineering, University of Calgary, Calgary, Alberta, Canada T2N 1N4 - (zlari, ahabib, [email protected]) Commission V, WG V/3 KEY WORDS: Segmentation, Kd-tree data structure, Adaptive cylinder neighbourhood, Clustering attributes, Octree space partitioning ABSTRACT: Automatic processing and object extraction from 3D laser point cloud is one of the major research topics in the field of photogrammetry. Segmentation is an essential step in the processing of laser point cloud, and the quality of extracted objects from laser data is highly dependent on the validity of the segmentation results. This paper presents a new approach for reliable and efficient segmentation of planar patches from a 3D laser point cloud. In this method, the neighbourhood of each point is firstly established using an adaptive cylinder while considering the local point density and surface trend. This neighbourhood definition has a major effect on the computational accuracy of the segmentation attributes. In order to efficiently cluster planar surfaces and prevent introducing ambiguities, the coordinates of the origin’s projection on each point’s best fitted plane are used as the clustering attributes. Then, an octree space partitioning method is utilized to detect and extract peaks from the attribute space. Each detected peak represents a specific cluster of points which are located on a distinct planar surface in the object space. Experimental results show the potential and feasibility of applying this method for segmentation of both airborne and terrestrial laser data. 1. INTRODUCTION Laser scanning is considered as a leading technology for the acquisition of high density three-dimensional spatial information. Due to the variety of 3D objects and massive amount of points, extraction of valuable spatial information from 3D laser scanning data is difficult and time consuming. Segmentation is the fundamental step in information extraction from 3D laser point clouds. The objective of the segmentation process is to cluster points with similar attributes into homogeneous regions and introduce some level of organization to the data before the extraction of useful information. Many methodologies have been suggested for the segmentation of 3D laser data in the past decade, which are generally categorized in three classes: region growing, model fitting methods, and clustering of attributes. The region growing method proposed by Besl and Jain (1988) includes two steps: identification of the seed points and growing them based on predefined criteria such as proximity of points and planarity of surfaces. Several research efforts proposed improvements to the functionality of the region growing segmentation. Tovari and Pfeifer (2005) introduced a region growing segmentation method for airborne laser data. They used the estimated normal vector for each point and its distance to the growing plane as the similarity criteria for growing the seed point. Rabbani et al. (2006) utilized the surface roughness to group points belonging to the same surface. Pu and Vosselman (2006) proposed a region growing method for terrestrial laser data based on proximity of points and global planarity criteria. These methods are highly dependent on selected seed points and errors in defining these points will affect the segmentation process (Besl and Jain, 1998). The model fitting methods, which are developed based on fitting geometric primitive shapes, can be applied for mathematical representation of planar surfaces. The points which are confirmed by the mathematical representation are grouped as one segment. A well-known algorithm based on the model fitting approach is the RANdom SAmple Consensus (RANSAC) proposed by Fischer and Bolles, (1981). This algorithm was applied for automatic processing of point cloud with the aim of 3D building modeling (Tarsh-Kurdi et al., 2007). The main shortcoming of model fitting approaches is their inefficiency and spurious segmentation results when dealing with different point cloud sources (Filin, 2002). The segmentation method based on clustering of attributes is a robust approach for the identification of homogenous patterns in the data. This method mainly comprises two processes: attribute computation, and clustering the data based on the computed attributes. Since this method is highly dependent on the quality of derived attributes, they should be computed precisely to produce the best separation among different classes. These techniques generate a voting scheme in the attribute space which is constructed using an accumulator array. The dimension of this accumulator array is dependent on the number of the utilized attributes for clustering. Vosselman and Dijkman (2001) used the principal of the Hough transform (Hough, 1962) for segmentation of planar surfaces in a 3D laser point cloud. In this method, each laser point defines a plane in the 3D attribute space. So, the laser points on the same planar surface will intersect at the position in the attribute space that corresponds to the slopes and distance of the planar surface. Filin and Pfeifer (2006) introduced a segmentation method based on the normal vectors derived using a slope adaptive neighbourhood. They used the slopes of the normal vector in the X and Y directions and height difference between the point and its neighbourhood as the clustering attributes. This height difference attribute was also used to guarantee the distinction between parallel planes, which share the same normal vector slopes. Biosca and Lerma (2008) suggested a fuzzy clustering approach in combination with a similarity-based cluster merging for segmentation of a terrestrial laser point cloud. Kim et al. (2007) proposed a method for segmentation of planar
Transcript
AN ADAPTIVE APPROACH FOR SEGMENTATION OF 3D LASER POINT CLOUD
Z. Lari, A. F. Habib, E. Kwak
Department of Geomatics Engineering, University of Calgary, Calgary, Alberta, Canada T2N 1N4 -
KEY WORDS: Segmentation, Kd-tree data structure, Adaptive cylinder neighbourhood, Clustering attributes, Octree space
partitioning
ABSTRACT:
Automatic processing and object extraction from 3D laser point cloud is one of the major research topics in the field of
photogrammetry. Segmentation is an essential step in the processing of laser point cloud, and the quality of extracted objects from
laser data is highly dependent on the validity of the segmentation results. This paper presents a new approach for reliable and
efficient segmentation of planar patches from a 3D laser point cloud. In this method, the neighbourhood of each point is firstly
established using an adaptive cylinder while considering the local point density and surface trend. This neighbourhood definition has
a major effect on the computational accuracy of the segmentation attributes. In order to efficiently cluster planar surfaces and prevent
introducing ambiguities, the coordinates of the origin’s projection on each point’s best fitted plane are used as the clustering
attributes. Then, an octree space partitioning method is utilized to detect and extract peaks from the attribute space. Each detected
peak represents a specific cluster of points which are located on a distinct planar surface in the object space. Experimental results
show the potential and feasibility of applying this method for segmentation of both airborne and terrestrial laser data.
1. INTRODUCTION
Laser scanning is considered as a leading technology for the
acquisition of high density three-dimensional spatial
information. Due to the variety of 3D objects and massive
amount of points, extraction of valuable spatial information
from 3D laser scanning data is difficult and time consuming.
Segmentation is the fundamental step in information extraction
from 3D laser point clouds. The objective of the segmentation
process is to cluster points with similar attributes into
homogeneous regions and introduce some level of organization
to the data before the extraction of useful information. Many
methodologies have been suggested for the segmentation of 3D
laser data in the past decade, which are generally categorized in
three classes: region growing, model fitting methods, and
clustering of attributes.
The region growing method proposed by Besl and Jain (1988)
includes two steps: identification of the seed points and growing
them based on predefined criteria such as proximity of points
and planarity of surfaces. Several research efforts proposed
improvements to the functionality of the region growing
segmentation. Tovari and Pfeifer (2005) introduced a region
growing segmentation method for airborne laser data. They
used the estimated normal vector for each point and its distance
to the growing plane as the similarity criteria for growing the
seed point. Rabbani et al. (2006) utilized the surface roughness
to group points belonging to the same surface. Pu and
Vosselman (2006) proposed a region growing method for
terrestrial laser data based on proximity of points and global
planarity criteria. These methods are highly dependent on
selected seed points and errors in defining these points will
affect the segmentation process (Besl and Jain, 1998).
The model fitting methods, which are developed based on
fitting geometric primitive shapes, can be applied for
mathematical representation of planar surfaces. The points
which are confirmed by the mathematical representation are
grouped as one segment. A well-known algorithm based on the
model fitting approach is the RANdom SAmple Consensus
(RANSAC) proposed by Fischer and Bolles, (1981). This
algorithm was applied for automatic processing of point cloud
with the aim of 3D building modeling (Tarsh-Kurdi et al.,
2007). The main shortcoming of model fitting approaches is
their inefficiency and spurious segmentation results when
dealing with different point cloud sources (Filin, 2002).
The segmentation method based on clustering of attributes is a
robust approach for the identification of homogenous patterns
in the data. This method mainly comprises two processes:
attribute computation, and clustering the data based on the
computed attributes. Since this method is highly dependent on
the quality of derived attributes, they should be computed
precisely to produce the best separation among different classes.
These techniques generate a voting scheme in the attribute
space which is constructed using an accumulator array. The
dimension of this accumulator array is dependent on the number
of the utilized attributes for clustering. Vosselman and Dijkman
(2001) used the principal of the Hough transform (Hough,
1962) for segmentation of planar surfaces in a 3D laser point
cloud. In this method, each laser point defines a plane in the 3D
attribute space. So, the laser points on the same planar surface
will intersect at the position in the attribute space that
corresponds to the slopes and distance of the planar surface.
Filin and Pfeifer (2006) introduced a segmentation method
based on the normal vectors derived using a slope adaptive
neighbourhood. They used the slopes of the normal vector in
the X and Y directions and height difference between the point
and its neighbourhood as the clustering attributes. This height
difference attribute was also used to guarantee the distinction
between parallel planes, which share the same normal vector
slopes. Biosca and Lerma (2008) suggested a fuzzy clustering
approach in combination with a similarity-based cluster
merging for segmentation of a terrestrial laser point cloud. Kim
et al. (2007) proposed a method for segmentation of planar
International Archives of the Photogrammetry, Remote Sensing and Spatial Information Sciences, Volume XXXVIII-5/W12, 2011ISPRS Calgary 2011 Workshop, 29-31 August 2011, Calgary, Canada
103
patches in 3D laser data. They used the magnitudes of surface
normals derived from two defined origins as the clustering
attributes. The two origins should be located in a way that
minimizes the risk of ambiguity. The segmentation methods
based on clustering attributes are efficient and flexible for the
identification of homogeneous regions in the data. The major
drawbacks of these methods are lack of computational
efficiency when dealing with multidimensional attributes for a
massive amount of points and their dependency on the
neighbourhood definition and the local point density.
Extraction of man-made structures is of great importance in 3D
laser data processing. These structures usually comprise
multiple planar surfaces which should be segmented within data
before feature extraction. So, this paper will outline an
alternative approach for the segmentation of planar patches
based on cluster analysis in attribute space. Figure 1 shows the
main stages of the proposed methodology.
Figure1. Proposed methodology
This paper is organized as follows: Section 2 describes the
organization of 3D laser data using kd-tree structure, the
process of neighbourhood definition based on the local point
density and physical shape of surfaces, and classification and
grouping of laser data based on defined neighbourhood system.
Section 3 presents the suggested approach for segmentation of
3D laser point cloud which is essentially based on clustering the
computed attributes. Section 4 provides the experimental results
of the proposed method. Finally, section 5 summarizes the main
achievements reached in this work.
2. ADAPTIVE NEIGHBOURHOOD DEFINITION AND
POINT CLASSIFICATION
The original laser scanner point cloud does not provide explicit
information about the distribution of points; therefore, it is
necessary to structure the irregular laser point cloud, define the
relationship between points and then search for the nearest
neighbouring points before processing them. In this paper, a kd-
tree data structure is used for the organization of 3D laser data
and computation of the local point density. The adaptive
cylinder neighbourhood for each point is then established based
on the local point density and physical properties of the object
surface.
Finally, 3D laser data are classified and grouped into rough and
planar surfaces based on the adaptive neighbourhood definition.
2.1 Structuring the laser point cloud based on kd-tree
structure
The performance of the clustering based segmentation methods
highly depends on the computed attributes for individual laser
points. These attributes are derived based on the defined
neighbourhood for each point. In order to improve the
efficiency of the neighbourhood definition process, some level
of organization should be introduced for the 3D laser data
before further processing.
The kd-tree data structure, which was recommended by
Freidman et al. (1977), is a strategy for sorting and organizing a
set of points. This structure is constructed by recursive
subdivision of the three-dimensional space. The splitting
strategy used in this paper subdivides the space along the
longest extent of the data in the X, Y, or Z direction. The
splitting plane will be perpendicular to the chosen extent
direction and pass through the point with median coordinate
along the selected extent. The recursive splitting procedure in
three dimensions proceeds until all the points are structured in
the kd-tree. This kind of space-partitioning process makes the
points being stored in a balanced tree (Moore, 1991). The main
advantage of such a structure is faster and more efficient
searching of the nearest neighbours.
2.2 Neighbourhood definition
Neighbourhood definition is the primary step of 3D laser data
processing. This definition is a rule that determines the
neighbours of each point, and as a result has a great impact on
the computed attributes for laser data segmentation.
Different neighbourhood definitions are being used for laser
scanning data presently. Triangulated irregular network (TIN) is
a neighbourhood system which is defined based on the
proximity of points in 2D space (projection of the points on XY
plane). The major shortcoming of this neighbourhood definition
is that points belonging to different physical objects might be
included in the same neighbourhood.
The other type of neighbourhood definition is based on
proximity of points in 3D space (Euclidian distance between
points). This definition, which is called spherical
neighbourhood, corresponds to a sphere with a certain radius
whose centre coincides with the point in question (Lee and
Schenk, 2001). All points within the sphere are considered as
neighbouring points. While using the 3D distance among
investigated points, this definition doesn’t consider the physical
shape of objects; therefore, different physical surfaces may be
included in the same neighbourhood.
The shortcomings of aforementioned neighbourhood systems
mandate the development of an alternative neighborhood
definition which takes proximity of points in 3D space, physical
shapes of associated surfaces (Filin and Pfeier, 2005) and local
point density parameters into account. Most of the existing
neighbourhood definitions do not consider the varying point
densities in laser datasets within the segmentation process. The
main objective of this research is the development a
segmentation approach which is suitable for both airborne and
terrestrial laser data with varying point densities.
In order to compute the local point density (LPD) parameter for
neighbourhood definition, a bounding sphere is defined which
includes K nearest neighbours of the point in question. K is the
number of points which are utilized for the local point density
computation and assumed to be coplanar. This parameter is
determined based on the source of the laser data. These
neighbouring points are then sorted based on their distances to
the query point. The radius of this bounding sphere, rk, is the
distance between the point in question and its Kth nearest
International Archives of the Photogrammetry, Remote Sensing and Spatial Information Sciences, Volume XXXVIII-5/W12, 2011ISPRS Calgary 2011 Workshop, 29-31 August 2011, Calgary, Canada
104
neighbour. So, the local point density (number of points/m2) is
calculated using this formula:
2
Kr
KLPD
π=
(1)
The adaptive cylinder neighbourhood of a point is then
determined as follows: At first, a spherical neighbourhood is
defined for the point of interest with radius:
LPD
nr
SN×
=π
(2)
In which, n is the reliable number of the points for definition of
a plane while considering the existence of the outliers, and LPD
is the local point density.
Afterwards, the best fitted plane for the points in the spherical
neighbourhood is computed using an iterative plane fitting
process based on Least squares adjustment. The parameters of
the best fitted plane are refined in the Least squares adjustment
process by assigning the proper weight to the points based on
their normal distances to the computed plane. Finally, the
adaptive neighbourhood is defined by determination of the
points whose normal distances to the best fitted plane are less
than half of the cylinder height. The cylinder height is an
adaptive parameter which is defined proportional to the
expected level of noise (σ) in different datasets.
The schematic concept of the adaptive cylinder neighbourhood
system is illustrated in Figure 2.
Figure 2. 2D representation of Adaptive cylinder
neighbourhood definition
The defined neighbourhood system is implemented based on the
local point density, 3D relationships between the points, the
local surface trend and the expected level of noise in the data;
so, it is suitable for both terrestrial and airborne laser datasets
with varying point density and different surface slopes.
2.3 Classification and grouping of points
In order to speed up the process of the attributes computation,
the dataset should be classified and grouped into rough and
planar surfaces. This is carried out based on the defined
adaptive cylindrical neighbourhood using a classification
measure which is calculated as:
N o. of pnts in the cylindrical neighborhood Classification_Measure
N o. of pnts in the spherical neighborhood =
(3)
If this measure is more than a pre-defined threshold, the point is
considered as a part of planar surface; otherwise it is classified
as a part of rough surface. Afterwards, a region growing
algorithm is employed to group the classified points; in which
the seed points are chosen based on the order of points in the
established kd-tree. The selected seed points are grown by
checking the proximity of neighbouring points in the 3D space.
The outcomes of this process are the groups of points which
belong to planar surfaces.
3. SEGMENTATION
The segmentation is generally defined as the abstraction process
of a laser point cloud into distinct subsets of spatially connected
points with common attributes. The proposed techniques for
segmentation of laser points mainly differ in the methods or
criteria which are being used for measuring the similarity
among a group of points. In this research, a set of attributes are
computed to check the similarity of points in the parameter
space. Consequently, the distinct segments can be obtained by
clustering the points with similar attributes. The implemented
methodology for planar patch segmentation of 3D laser
scanning data will be explained in detail in the following
section.
3.1 Attribute computation
The characteristic attributes for planar patch segmentation are
computed based on the adaptive cylindrical neighbourhood
defined for each point as shown in section 2.2. To compute the
segmentation attributes, the best fitted plane for each point in
each planar group should be determined using the iterative
plane fitting process. Since, both airborne and terrestrial laser
date are dealt with in this research and these datasets comprise
planar surfaces with different slopes, a slope-intercept
representation of 3D plane is used firstly to determine the
suitable form of the plane for each point. The quality of fitting
to slope-intercept representation forms can be used as a measure
for selection of best representation. The representation form
with the best fitting quality is selected as the most convenient
plane for the neighbouring points. The parameters of the best
fitted plane are then used for computation of segmentation
attributes.
In this research, the coordinates of the origin’s normal
projection on the best fitted plane derived for each point (X0, Y0,
Z0) are utilized as the segmentation attributes. These attributes
are computed based on the parameters of the best fitted plane
for each point in each group. A 3D accumulator array is then
constructed based on the defined attributes for efficient
clustering of the planar patches in the attribute space.
),,(
11
1
00
0
ZYX
),,(
22
2
00
0
ZYX
),
,(
3
3
3
0
0
0
ZY
X
Figure 3. Computed attributes for the segmentation of planes
with different slopes and parallel planes
As shown in Figure 3, the major preference of the derived
attributes is their uniqueness when clustering planes with
different slopes and parallel planes in object space.
3.2 Clustering of laser point cloud in attribute space
Once the segmentation attributes are computed and the
accumulator array is constructed in the attribute space, a
discretization approach should be utilized for the detection and
extraction of the accumulated peaks in the attribute space.
International Archives of the Photogrammetry, Remote Sensing and Spatial Information Sciences, Volume XXXVIII-5/W12, 2011ISPRS Calgary 2011 Workshop, 29-31 August 2011, Calgary, Canada
105
These peaks will represent distinct planar patches in the object
space.
Available discretization methods tessellate the attribute space
into the cells whose size is determined based on the peaks’
extent in attribute space. The main disadvantage of these
methods is their large storage and computational requirements
when dealing with large accumulator arrays. In this paper, a
new method is proposed for finding the peaks in the attribute
space. This approach tries to improve the computational
efficiency of this process by avoiding unnecessary tessellations
of attribute space.
This method, which is developed based on octree space
partitioning, is a two-step searching procedure. This algorithm
tries to find the approximate peak location firstly (coarse peak
searching), and then detect and extract the precise peak location
(fine peak searching). In the first step, the attribute space of all
of the points in each group is defined and divided into eight
equal sub-spaces using an octree space partitioning structure.
The splitting process proceeds for sub-spaces including
maximum number of attribute points in each stage until the
defined sub-space is covered with the sphere whose radius, r, is
a function of minimum angular separation between detectable
planes and minimum distance between distinct parallel planes
(Figure 4):
∆α
r
Figure 4. 2D Representation of peak area in attribute space
Based on the derived value for r, the coarse peak searching
process proceeds until:
3
)(tan2)max(
222dd
sizespacesub∆+∆
<−−α (5)
Where d is the distance of the selected sub-space’s center
(shown in green color in Figure 5) to the origin, ∆α is the
minimum angular separation between detectable planes and ∆d
is the minimum distance between distinct parallel planes. The
selected sub-space which contains the maximum number of the
attribute points is considered as the approximate peak location.
Figure 5 shows the procedure of coarse peak searching.
Figure 5. 2D representation of coarse peak searching procedure
for finding the approximate peak location
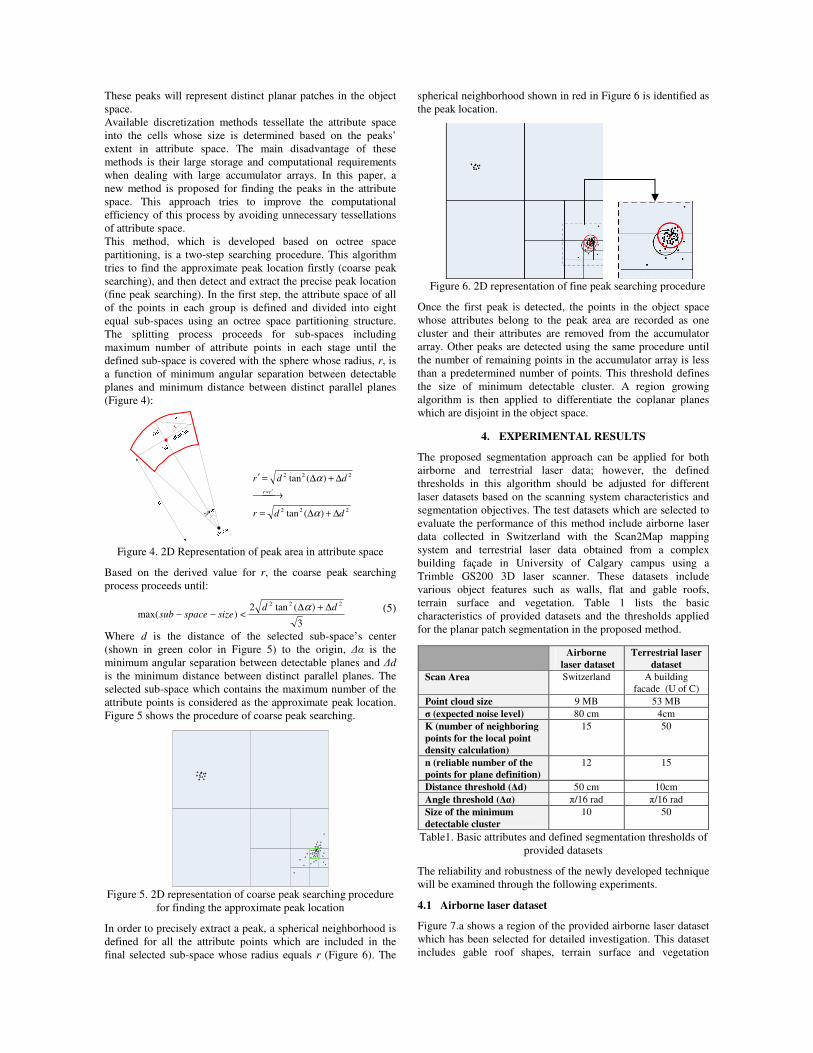
In order to precisely extract a peak, a spherical neighborhood is
defined for all the attribute points which are included in the
final selected sub-space whose radius equals r (Figure 6). The
spherical neighborhood shown in red in Figure 6 is identified as
the peak location.
Figure 6. 2D representation of fine peak searching procedure
Once the first peak is detected, the points in the object space
whose attributes belong to the peak area are recorded as one
cluster and their attributes are removed from the accumulator
array. Other peaks are detected using the same procedure until
the number of remaining points in the accumulator array is less
than a predetermined number of points. This threshold defines
the size of minimum detectable cluster. A region growing
algorithm is then applied to differentiate the coplanar planes
which are disjoint in the object space.
4. EXPERIMENTAL RESULTS
The proposed segmentation approach can be applied for both
airborne and terrestrial laser data; however, the defined
thresholds in this algorithm should be adjusted for different
laser datasets based on the scanning system characteristics and
segmentation objectives. The test datasets which are selected to
evaluate the performance of this method include airborne laser
data collected in Switzerland with the Scan2Map mapping
system and terrestrial laser data obtained from a complex
building façade in University of Calgary campus using a
Trimble GS200 3D laser scanner. These datasets include
various object features such as walls, flat and gable roofs,
terrain surface and vegetation. Table 1 lists the basic
characteristics of provided datasets and the thresholds applied
for the planar patch segmentation in the proposed method.
Airborne
laser dataset
Terrestrial laser
dataset
Scan Area Switzerland A building
facade (U of C)
Point cloud size 9 MB 53 MB
σ (expected noise level) 80 cm 4cm
K (number of neighboring
points for the local point
density calculation)
15 50
n (reliable number of the
points for plane definition)
12 15
Distance threshold (∆d) 50 cm 10cm
Angle threshold (∆α) π/16 rad π/16 rad
Size of the minimum
detectable cluster
10 50
Table1. Basic attributes and defined segmentation thresholds of
provided datasets
The reliability and robustness of the newly developed technique
will be examined through the following experiments.
4.1 Airborne laser dataset
Figure 7.a shows a region of the provided airborne laser dataset
which has been selected for detailed investigation. This dataset
includes gable roof shapes, terrain surface and vegetation
222
222
)(tan
)(tan
ddr
ddr
rr
∆+∆=
→
∆+∆=′
′≈
α
α
International Archives of the Photogrammetry, Remote Sensing and Spatial Information Sciences, Volume XXXVIII-5/W12, 2011ISPRS Calgary 2011 Workshop, 29-31 August 2011, Calgary, Canada
106
(Figure7.b). Figure 7.c displays the results of grouping planar
surfaces within the airborne laser data. The roof surfaces and
the terrain surface are correctly grouped as planar surfaces.
Figure 7.d represents the output of the developed segmentation
algorithm for this region based on the thresholds defined in
Table 1. Each color in this figure represents a single planar
surface.
(a)
(b)
(c)
(d)
Figure 7. Airborne laser data, original point cloud (a), imagery
(b), point classification result (c) and output of developed
segmentation approach (d)
Comparison of represented segmentation results with grouping
results (Figure 7.c) and image data (Figure 7.b) shows the
feasibility of this methodology for segmentation of gable roofs
(a sample is shown in red circles in Figures 7.c and 7.d), planar
roofs with different slopes and terrain surface (Figure 7.d).
4.2 Terrestrial laser data
Figure 8.a shows a terrestrial laser scan of a building façade.
Since this dataset contains planes with different slopes and
much more variations in point density, it is more challenging
than the airborne laser data.
Figure 8.c represents the results of grouping planar surfaces
within the terrestrial laser data. The roof surfaces, walls and
terrain surface are correctly grouped as planar surfaces.
Figure 8.d represents the output of the proposed segmentation
approach for this laser point cloud based on the thresholds
defined in Table 1. Each color in this figure represents a single
planar surface.
(a)
(b)
(c)
International Archives of the Photogrammetry, Remote Sensing and Spatial Information Sciences, Volume XXXVIII-5/W12, 2011ISPRS Calgary 2011 Workshop, 29-31 August 2011, Calgary, Canada