TS 1 – Coastal Zone Management Christodoulos Psaltis and Charalabos Ioannidis An Algorithm for Monitoring Informal Constructions – An Application in Coastal Areas Strategic Integration of Surveying Services 6th FIG Regional Conference 2007 San José, Costa Rica 12-15 November 2007 1/20 An Algorithm for Monitoring Informal Constructions - An Application in Coastal Areas Christodoulos PSALTIS and Charalabos IOANNIDIS, Greece Key words: Coastal Zone Management, Informal Settlements, Photogrammetry, Building Extraction, Change Detection SUMMARY An efficient environmental protection of coastal areas is of high priority, but it can only be achieved if a multidisciplinary team of experts provide the necessary knowledge, tools and strategies to analyse the current situation, detect possible risks and act to prevent them. Informal settlements is one of the dominant problems faced, which surveyors can help solving. Modern photogrammetric techniques enable automatic monitoring, thus reducing the cost and time required for such procedures while keeping a high level of accuracy. This paper introduces a simple and straightforward technique and discusses the first results of an application test carried out in a coastal area of Eastern Attica in Greece. The proposed strategy is based in comparing two digital surface models (DSM) of the same area in two different time periods and by facilitating change between them to assert possible cases of informal constructions. The DSMs used are very dense in order for at least a few points to lay on each rooftop and they are produced from large scale aerial image stereopairs oriented in the same reference system. These DSMs are transformed to raster format with the same cell size and georeference and then the reference DSM is subtracted from the new one. Next, the resulting raster is transformed to binary by an algorithm using a uniform threshold leaving out points with a high probability of being erroneous. The remaining areas are filtered further with size and shape criteria. Those areas that passed filtering are considered as changed. To test the developed algorithm, the DSMs were collected automatically in a DPW and the final change results were compared with manually extracted changed features. There was also an attempt to detect changed regions using the commercial software package eCognition™, but with little results. Taking into account the simplicity of the proposed algorithm the results were very satisfactory and further steps for augmenting its performance are proposed.
Transcript
TS 1 – Coastal Zone Management Christodoulos Psaltis and Charalabos Ioannidis An Algorithm for Monitoring Informal Constructions – An Application in Coastal Areas Strategic Integration of Surveying Services 6th FIG Regional Conference 2007 San José, Costa Rica 12-15 November 2007
1/20
An Algorithm for Monitoring Informal Constructions - An Application in Coastal Areas
Christodoulos PSALTIS and Charalabos IOANNIDIS, Greece
Key words: Coastal Zone Management, Informal Settlements, Photogrammetry, Building Extraction, Change Detection SUMMARY An efficient environmental protection of coastal areas is of high priority, but it can only be achieved if a multidisciplinary team of experts provide the necessary knowledge, tools and strategies to analyse the current situation, detect possible risks and act to prevent them. Informal settlements is one of the dominant problems faced, which surveyors can help solving. Modern photogrammetric techniques enable automatic monitoring, thus reducing the cost and time required for such procedures while keeping a high level of accuracy. This paper introduces a simple and straightforward technique and discusses the first results of an application test carried out in a coastal area of Eastern Attica in Greece. The proposed strategy is based in comparing two digital surface models (DSM) of the same area in two different time periods and by facilitating change between them to assert possible cases of informal constructions. The DSMs used are very dense in order for at least a few points to lay on each rooftop and they are produced from large scale aerial image stereopairs oriented in the same reference system. These DSMs are transformed to raster format with the same cell size and georeference and then the reference DSM is subtracted from the new one. Next, the resulting raster is transformed to binary by an algorithm using a uniform threshold leaving out points with a high probability of being erroneous. The remaining areas are filtered further with size and shape criteria. Those areas that passed filtering are considered as changed. To test the developed algorithm, the DSMs were collected automatically in a DPW and the final change results were compared with manually extracted changed features. There was also an attempt to detect changed regions using the commercial software package eCognition™, but with little results. Taking into account the simplicity of the proposed algorithm the results were very satisfactory and further steps for augmenting its performance are proposed.
TS 1 – Coastal Zone Management Christodoulos Psaltis and Charalabos Ioannidis An Algorithm for Monitoring Informal Constructions – An Application in Coastal Areas Strategic Integration of Surveying Services 6th FIG Regional Conference 2007 San José, Costa Rica 12-15 November 2007
2/20
An Algorithm for Monitoring Informal Constructions - An Application in Coastal Areas
Christodoulos PSALTIS and Charalabos IOANNIDIS, Greece
1. INTRODUCTION Coastal areas have always been more developed than continental areas. Historically, human activities are more concentrated in coastal areas and areas in close proximity to the sea were nowadays lives the largest part of global population. However, this overconcentration of human activity in a small area, in combination with the fact that human population is rapidly increasing, causes a number of problems which pose important environmental risks for these areas. One of these problems is unplanned development and informal buildings. In several countries a combination of social, economic and administrative parameters lead to a stage of unplanned development which usually takes place along the edges of large urban areas and in coastal zones. The intense need for urban land in combination with the low prices of agricultural land parcels and the low profit from agricultural products is the predominant factor leading to the unplanned urbanization. It is evident that this type of development has a serious economic and social impact both on the owners as well as the state. Furthermore in case the unplanned development are in massive scale, the lack of appropriate infrastructures has a negative environmental effect. In Greece, the lack of spatial planning policy at national and regional level, in combination with the lack of cadastre, was an additional critical factor that influenced the increase of informal buildings. In recent years these buildings are usually vacation residences and they are good or even luxurious constructions in legally owned land parcels (Figure 1), but without any kind of building permit (Potsiou & Ioannidis, 2006). A rough estimation, by the general inspector of the Hellenic Ministry of Environment, Physical Planning and Public Works shows that, in total, informal settlements in Greece include as many as 1,000,000 residences. The “new generation” of informal buildings are constructions of 1 or 2 stories of medium or large area size (>50m2), which are estimated to lie on an average land parcel size of 1,000-1,500 m2. According to a statistical study (Karavassili, 2004) for the period 1991-2001, approximately 93,000 legal and 31,000 informal residences were constructed each year. To face this situation several attempts have been made either by applying procedures toward massive, nation-wide legalization of informal settlements with a parallel provision of urban planning improvements (Law of 1977 and 1983) or by applying tough penalties (Law of 2003), or locally through extensions of the existing urban plans. Nevertheless, none of the applied procedures has been efficient; most of them have proved to be time and cost consuming due to the lack of a modern tool (e.g. spatial information system, cadastre) for applying coordinated and sound land policy. However, even if such a tool existed there would be still a need for a way to locate quickly and in time the under construction informal
TS 1 – Coastal Zone Management Christodoulos Psaltis and Charalabos Ioannidis An Algorithm for Monitoring Informal Constructions – An Application in Coastal Areas Strategic Integration of Surveying Services 6th FIG Regional Conference 2007 San José, Costa Rica 12-15 November 2007
3/20
buildings in a cost-effective way and stop the construction at its beginning or in a short period of time after its completion. The current administrative control procedures are inefficient, but modern photogrammetric techniques for construction monitoring alongside the necessary administrative and legislative reforms, can assist the completion of such a task (Ioannidis et al, 2007).
Figure 1. Informal settlement in rural area close to the coast in the island Salamina, Greece In this paper the main focus is the technical part of the above problem. First some strategies and methods for automatic building monitoring are presented from the international bibliography together with a brief overview of commercial software packages capable of object extraction and change detection. Then the layout of a newly developed approach is illustrated. The proposed strategy is a very simple and straightforward automatic photogrammetric procedure that aims to keep the cost of development and application low, whereas achieving a high accuracy output. It is based on comparing two automatically derived DSMs of the same area of interest from different time periods. After a processing step the algorithm developed is able to assert the regions where change has possibly occurred and new buildings have emerged. Then all the change candidates found are presented to an end user who takes up the role of checking if the results truly indicate changes and if these changes are legal. The above strategy has been tested in the coastal area of Vravrona, 50 km east of Athens in the prefecture of Eastern Attica. Two sets of data for the same area where used, one consisted by a strip of 3 panchromatic aerial photographs taken in 1984 and one stereopair of color aerial images taken in 2001. The two data sets where oriented simultaneously in a single bundle adjustment step and their DSMs where automatically produced in a digital photogrammetric workstation (DPW). These DSMs where then inserted in the developed algorithm which detected the change candidates in the area. The results were checked
TS 1 – Coastal Zone Management Christodoulos Psaltis and Charalabos Ioannidis An Algorithm for Monitoring Informal Constructions – An Application in Coastal Areas Strategic Integration of Surveying Services 6th FIG Regional Conference 2007 San José, Costa Rica 12-15 November 2007
4/20
manually for consistency and accuracy in three scenarios of change intensity and building density. Also, an attempt was made for change detection using the object-based classification software package eCognition™ which is widely available and it is considered as one of the most productive in its category (Meinel & Neubert, 2004; Lavigne et al, 2006). 2. STRATEGIES FOR AUTOMATIC BUILDING MONITORING To facilitate informal building monitoring in a certain area, dense periodic measurements must be made and each new period must be processed and then compared with the reference period. This is in fact a change detection problem repeated regularly over time and has a high accuracy demand since the dimensions of informal buildings are usually small. In addition the classic change detection problem is augmented by the fact that every change should be checked to verify its legality. It is clear that such a procedure entails a great amount of data and repeating processing steps which can be very costly and time consuming when done manually. Over the last 25 years continuous studies in the field of automation in digital photogrammetry and similar fields, like computer vision, helped in the automation of a great number of processes involved in a change detection application (Mayer, 1999; Blaschke, 2005), cutting down considerably the cost and time requirements they involve. Moreover new airborne and spaceborne sensors like multispectral digital cameras, SAR and LiDAR sensors offer a wide variety of high resolution data in continuously decreasing prices and increasing resolution. Nevertheless, the problem is very complex and difficult to solve that is why most successful applications, in order to achieve the appropriate results, are custom made and case depended. In the same time there are commercial software packages available which offer a more generic solution and their increasing robustness, flexibility and relatively low cost make them very attractive to the end user. Both in commercial and custom made applications change detection of buildings is achieved with the same overall strategy described in Figure 2.
Figure 2. Overview of automatic change detection workflow First a certain set of attributes, features or objects are extracted in both data periods and then they are overlaid and compared. At this point a decision algorithm based on certain predefined criteria indicates if and where change took place. There is a wide variety of ways to do that using different input data, types of extracted primitives and extraction methods as well as different decision procedures. 2.1 Automatic Change Detection Strategies Depending on the complexity of the extracted primitives to be compared and consequently the way change is asserted change detection strategies can be categorized in three main types seen in Figure 3. Since the extraction process is by far the most difficult to automate, the way it is executed defines the whole change detection procedure.
Primitive extraction
Overlay of extracted primitives
Change determination
TS 1 – Coastal Zone Management Christodoulos Psaltis and Charalabos Ioannidis An Algorithm for Monitoring Informal Constructions – An Application in Coastal Areas Strategic Integration of Surveying Services 6th FIG Regional Conference 2007 San José, Costa Rica 12-15 November 2007
5/20
Figure 3. Types of change detection strategies and the used primitives Low level strategies consider information in pixel level to facilitate change. This information may be any single attribute in raster format covering the area of interest. Most frequently used attributes of this type are the color, in any combination of spectral bands, and the height. Through simple mathematical operations the values of each pixel are compared between the two periods and usually decision of change is based on a threshold value. Examples of this type of strategies include differencing, rationing and principal component analysis, all of them commonly used in the past (Pratt, 2001). The main disadvantage of these methods are limited robustness and noisy results, since misclassified pixels marked as change can appear almost anywhere. On the other hand, their philosophy and development is simple and straightforward and the computation requirements are relatively low. These characteristics make them extremely useful even in modern and more complicated techniques where they are used in conjunction with each other (Moeller & Blaschke, 2006). Mid level strategies were developed to overcome the aforementioned robustness problems of low level techniques. To do so the extracted primitives are groups of neighboring pixels sharing a common characteristic often referred to as an object feature. These features include a higher level of information and thus they are more effective and robust when it comes to change detection. Edges, texture, areas of homogeneous color and even shapes are some of the most commonly extracted features employed in these strategies. The ways to extract them vary widely, depending on the provided data and the mathematical approach selected. The most commonly used techniques are (Ioannidis et al, 2007): – filtering, a group of methods for extracting edges in an image based on convolving the
image with a properly designed matrix, – mathematical morphology, which employs a set of operators to extract objects based on
the shape and size of quasi-homogeneous regions, – segmentation of color, elevation or of both attributes, a process executed with fuzzy logic
rules or simple logical functions able to extract homogeneous areas of the selected attribute,
– active contours or snakes, where a set of points gradually encloses the target feature using an energy minimization procedure and
Pixel values Features Knowledge
Low level Mid level High level
Change detection
TS 1 – Coastal Zone Management Christodoulos Psaltis and Charalabos Ioannidis An Algorithm for Monitoring Informal Constructions – An Application in Coastal Areas Strategic Integration of Surveying Services 6th FIG Regional Conference 2007 San José, Costa Rica 12-15 November 2007
6/20
– neural networks, which are capable of scale and rotation invariant matching of predefined neuron graphs to images.
Evidently mid level strategies are more effective in change detection applications than low level ones, but they still face some problems; most of them are very case depended, it’s difficult to extend them and there are problems of misinterpreting objects to a lack of a more intelligent extraction operator. Exactly that last problem led to the development of the more advanced high level strategies, also referred to as knowledge based systems. Their target is to emulate the way humans perceive a scene and to this end they take advantage of various methods of feature extraction in order to extract complex entities that represent different classes of objects in the provided data. To achieve a robust scene analysis different types of data should be used, combined with a priori knowledge about their spatial interrelations making these strategies more flexible and effective even when facing complex scenes (Baltsavias, 2004; Mayer, 2004). The basic concept is to calculate the values of certain predefined criteria, referred to as cues (Hahn & Stätter, 1998), and from these to automatically decide in which class the current object belongs to. The data used in these methods can be imagery, multi-spectral information, height data, vector data, topological relations and logical functions. In fact, the more diverse the base data are the easier it is to formulate robust cues. The total number of cues used and the way the system makes its decisions depend on the complexity of the problem. For situations where a scene must be analyzed in a few classes, e.g. “buildings”, “water”, “vegetation”, a hierarchical approach is usually implemented. By gradually eliminating all the unwanted classes, finally the “buildings” class remains. The members of this class are then subjected to a refining stage where their exact geometric properties are defined. In cases where more detailed classes must be discerned and localized, then more cues are needed and a more complex decision system is necessary (Zimmermann, 2000; Straub et al, 2000). 2.2 Commercial Software From the above it is evident that developing an advanced change detection algorithm is difficult. Furthermore, custom made approaches work well in certain cases, but it is difficult to apply the same technique in different circumstances and it’s costly to develop a new one for each case of interest. That is why commercial software packages gain ground in change detection applications, since they are more flexible. Results derived from comparative tests between the most known packages assessing their capabilities are already published (Meinel & Neubert, 2004; Lavigne et al, 2006; Neubert et al, 2006). In general there are two broad categories of such software; segmentation based and feature based. From each category one software package is selected based on terms of popularity and it is presented briefly below. In the first category eCognition™ from Definiens is the most well known and tested package. eCognition is an object oriented classification package (Benz et al., 2004) which incorporates image segmentation, based on a variety of extracted features, and supports topological and a priori knowledge to augment the classification process. Scene analysis using fuzzy logic, is robust since the classified objects are meaningful entities with defined interrelations. After the objects and their attributes are defined, in combination with any logical or spatial relation they
TS 1 – Coastal Zone Management Christodoulos Psaltis and Charalabos Ioannidis An Algorithm for Monitoring Informal Constructions – An Application in Coastal Areas Strategic Integration of Surveying Services 6th FIG Regional Conference 2007 San José, Costa Rica 12-15 November 2007
7/20
may have, image analysis is done automatically in a few seconds. eCognition also features sample based classification, manual classification, it offers a number of tools to edit the results of the automatic procedure and has many input/output options. After classification a provided algorithm is capable to realize change detection. eCognition shows good results in extracting man-made objects, but the user must have good knowledge of the spectral and spatial characteristics of the object to be extracted in order to define the rules and classes (Lavigne et al, 2006). In the second category of software is Feature Analyst™ from Visual Learning Systems Inc. is popular software. Feature Analyst employs machine learning algorithms to extract geospatial features (VLS, 2006). A human user selects a number of features that interest him and simultaneously trains the extraction algorithm to find that type of features. The extraction procedure continues automatically with the algorithm detecting features with spatial, spectral and other types of information, like size, shape, pattern etc., which better match the provided training set (O’Brien, 2003). The learning process is hierarchical for adaptive learning in order to locate the features even in complex and cluttered scenes. To improve the classification results a clutter removal step is used which leads to an improved definition of the training set and a new extraction of features. This iterative process continues until the results are satisfying. Feature Analyst is available as an extension to ArcGIS™, ERDAS IMAGINE™, GeoMedia™, SOCET SET™. It is a continuously extending platform and lately the new LiDAR Analyst was introduced which, as its name implies, is more suitable for feature extraction from LiDAR data. As in the eCognition, change detection in Feature Analyst is available as a post-classification step. In general it is a very promising and rather accurate tool which main problem is its sensitivity to the user provided training set (Lavigne, et al, 2006). 3. PROPOSED STRATEGY 3.1 Prerequisites of a Strategy Applicable in Greece The goal of this study is to propose an effective technique for monitoring informal buildings in large areas of interest, which should suit the special characteristics of informal settlements in Greece. The interest is focused on informal buildings which have been constructed in sub-urban areas outside the urban plans, without a building permit, which gradually create unplanned settlements. Their general profile can be described with the following characteristics: – buildings in legally owned land parcels – good constructions of 1- or 2-story buildings of medium or large size (>50m2) – average land parcel size of 1,000-1,500 m2; this means that these are not high density
areas and they do not consist of attached buildings – scattered buildings in greater areas, with agricultural or mixed land uses, at the fringe of
the formal urban plans (which either are fully build-up or they are of very high land values) or in coastal areas (for vacation houses).
TS 1 – Coastal Zone Management Christodoulos Psaltis and Charalabos Ioannidis An Algorithm for Monitoring Informal Constructions – An Application in Coastal Areas Strategic Integration of Surveying Services 6th FIG Regional Conference 2007 San José, Costa Rica 12-15 November 2007
8/20
It should be noticed though, that there are also other types of “informal constructions” in Greece (Ioannidis et al, 2007) and that construction is permitted in areas without urban plans when the land parcel is bigger than 0.4 ha. The limited availability of high resolution data is a factor that determines to a great extent the proposed strategy for informal buildings monitoring. In Greece, public services provide B/W or color aerial photographs at scales of 1:6,000 – 1:40,000 and photogrammetrically derived maps at scales 1:1,000 (mainly for urban areas) or 1:5,000 (for the whole jurisdiction). The cost to acquire data other than these is high, especially if it involves LiDAR data or multispectral digital aerial photographs. However, KTHMATOLOGIO S.A., the company responsible for the compilation the new National cadastral project, recently assigned the task of producing digital orthoimages of 0.25 m ground resolution (GSD) accompanied by DTM of 1m grid size, for the coastal front in zones of about 300m width. Based on the above mentioned characteristics of informal buildings and available data, a research for applicable technical solutions was made. It is evident that commercial software packages are more user friendly, they have about the same data prerequisites as the custom applications, they are of the shelve solutions for a number of cases but they don’t perform as well, since they are of general use. On the other hand custom applications can have good results, but they have a number of disadvantages, mainly: – they are complicated to develop, – they are case depended, – to achieve good results a variety of data for the same area are needed, – the user must be well trained to operate them. The ideal solution would be a simple custom made technique, for maximizing the achieved accuracy in a well defined application, using the minimum different types of high resolution data possible. That way the development and application cost will be low, but more importantly the proposed strategy should straightforward so that even a non-expert could operate it. 3.2 Description of the Proposed Strategy Adhering to the above description of the problem and the set prerequisites the technical procedure proposed in this paper is a simple and straightforward automatic strategy based on comparing two DSMs of the same area of interest from different time periods. The feature used for change detection is elevation, in the form of raster DSM, because: – dense DSMs will be available for coastal zones after the work mentioned before from
KTIMATOLOGIO S.A., – they are easily produced through automated photogrammetric procedures and – the satellite TerraSAR-X will be able to provide DSMs with 1m ground resolution in
relatively low prices, in the near future.
TS 1 – Coastal Zone Management Christodoulos Psaltis and Charalabos Ioannidis An Algorithm for Monitoring Informal Constructions – An Application in Coastal Areas Strategic Integration of Surveying Services 6th FIG Regional Conference 2007 San José, Costa Rica 12-15 November 2007
9/20
Figure 4 presents an overview of the proposed strategy.
Figure 4. Overview of the proposed strategy The basic idea behind the proposed technique is that if a new building is constructed there will be a change to the elevation value of the area covered by that building. Providing a dense DSM for a period before the construction and a new one after it, the difference in the elevation of this area, if it is accepted that there are no errors, will equal the height of the new building. REFNEW DSMDSMCHANGE −= (Eq. 1) From the description of this idea three main questions arise: – how dense and accurate should the DSMs be, – how to ensure that each point in one time period has exactly one correspondent in the
other and – what happens with elevation changes due to vegetation growth and natural changes in the
anaglyph. The first question is answered based on the dimensions of the object the method tries to detect. It was mentioned before that the major percentage of vacation informal buildings in Greece are about 50-120m2 in size and they have 1 or 2 stories, that means they have a height of 3m to 7m. Theoretically to detect a new building there must be at least one DSM point on top of it, but for the determination to be more robust at least ten should be required. Given the predicted size of the buildings this means that a DSM with 1m-2m ground resolution is required. The accuracy of the DSM along the Z axis is determined based on the minimum change in elevation to be detected, which equals the approximate height of new buildings. A standard deviation of height determination of about σZ = ±1m means that an elevation change of ΔZ = 3*σΖ = ±3m can be achieved, an accuracy that serves the purpose of the application. The σX and σY required accuracy of the DSM points should be in the same order of σΖ since if they are larger they will affect the right point correspondence and, less importantly, the detected new building will appear in a slightly different position than it should be. The correspondence problem arises from the need to check the elevation change in a specific horizontal position. The existence of random errors on the determination of point coordinates at each one of the two DTMs, is not a problem, if the horizontal accuracy is within the limits mentioned earlier and given a high ground resolution. Yet, the correspondence problem appears when the DSMs are produced via a photogrammetric method especially for this application where, providing a common control points for both image datasets, the DSMs can
DSM comparison DSMs from 2
periods
Initial change candidates Filtering Final change
candidates
Legality assessment
User
TS 1 – Coastal Zone Management Christodoulos Psaltis and Charalabos Ioannidis An Algorithm for Monitoring Informal Constructions – An Application in Coastal Areas Strategic Integration of Surveying Services 6th FIG Regional Conference 2007 San José, Costa Rica 12-15 November 2007
10/20
be extracted automatically in the same ground points, a feature offered by all DPWs. The problem is more complicated when the DSMs are already available from another source. This almost certainly means that the elevation samples have different accuracy in each measuring period and they are located in different horizontal points. The option available in this case is to co-register the DSMs using common points between the two datasets followed by a 3D similarity transformation and then to interpolate the given height values at user defined ground positions. The interpolation step introduces new errors since the interpolated height values are not correct especially when dealing with steep changes in the elevation as in the case of a flat terrain with tall buildings on it. However, the high density of the DSM helps in overcoming possible problems. Elevation changes due to vegetation growth can be located and extracted, if NIR images are available and the necessary process will be done, e.g., images from digital cameras or high resolution satellite images. However, the problem is not crucial in coastal areas of Greece since the vegetation in these areas is very arid and it is consisted mainly by bushes. Only natural changes of great magnitude in the anaglyph or human interventions of large scales (e.g., for the creation of a new transportation network) cannot be successfully detected by the proposed procedure, since they will be presented as building changes; such changes though, are very rare. The flow chart of the proposed procedure is presented in Figure 5. After the DSM differentiation, described in Equation (1), the results are filtered in order to eliminate change candidates with high possibility of being wrong. This process is done in three steps: a) First, based on the assumption that valid changes must be within the range of
3m<ΔZ<7m, which is the expected height range of new buildings, pixels with ΔZ outside this range are considered no change areas (ΔZ < 3m) or possible errors in the DSM (ΔZ > 7m).
b) Next, pixels that passed the former criterion are grouped with their neighbors to form coherent objects-blobs and those with less than 10 member pixels are rejected as not very clear indication of change and possibly noise.
c) Finally, the remaining blobs are checked for their shape in combination with their size. This criterion is based on the fact that buildings are usually rectangular in shape so the shape of blobs representing new buildings should also be rectangular. This is checked by creating a rectangular around the blob that includes all its member pixels and then calculating the value:
%100rrectangula bedcircumscri by the covered area
blob by the covered area%100 ∗−=SHAPE (Eq. 2)
In an ideal case, if the blob is precisely rectangular, this value will be zero; to include small errors the threshold value should be set slightly higher depending on the dominant shape of buildings in the area. Using the shape criterion alone there is a possibility of rejecting very large blobs that clearly indicate change, but due to special conditions they appear irregular in shape; so, a size threshold is used in the same time. With this parameter the current criterion can be formulated as:
TS 1 – Coastal Zone Management Christodoulos Psaltis and Charalabos Ioannidis An Algorithm for Monitoring Informal Constructions – An Application in Coastal Areas Strategic Integration of Surveying Services 6th FIG Regional Conference 2007 San José, Costa Rica 12-15 November 2007
11/20
) b SIZE AND a abs(SHAPE) ( if <<rejectblob
Figure 5. Flow chart of the proposed strategy All the blobs remaining after the filtering step are delineated by their circumscribed rectangular and they are presented to the user who must check whether the changes indicated illegal buildings. This can be done firstly by overlaying the produced polygons on a map with the outline of the urban plans and secondly by overlaying the produced polygons on an orthophotomap of the recent time period or by on site control, in order to ensure the existence of a building at each location a change is detected. The whole design of the proposed strategy was oriented towards a method where the prerequisite is almost 100% completeness of the final results even if this means that a larger number of false building locations will emerge. The reason is that a human user can easily distinguish false alarms, but it is much more difficult for him to account for missing changes.
if DSMs availableif DSMs produced
DSM co-registration
DSM in predefined 2D coordinates
Interpolation
DSM differentiation
Filtering of results
Delineation of changed areas
User assessment of legality
TS 1 – Coastal Zone Management Christodoulos Psaltis and Charalabos Ioannidis An Algorithm for Monitoring Informal Constructions – An Application in Coastal Areas Strategic Integration of Surveying Services 6th FIG Regional Conference 2007 San José, Costa Rica 12-15 November 2007
12/20
4. TEST APPLICATION 4.1 Application Site and Data Preparation To test the proposed strategy an application was developed and then tested in Vravrona, a coastal area in eastern Attica about 40km east of Athens (Figure 6). Eastern Attica is the prefecture with the bigger problem of informal buildings in Greece. It is estimated that 40% of informal buildings constructed in Greece each year are located in Attica. From them, the bigger percentage is located within the greater coastal zone (of a width of a few kilometers) of Eastern Attica.
Figure 6. Location of Vravrona area in Attica (left) and close-up from an aerial photograph
taken in 2001 (right) For the application, two sets of image data for the same area where used: – one consisted by a strip of 3 panchromatic aerial photographs taken in 1984, at a scale of
1:6,000 and – one stereopair of color aerial images taken in 2001, at a scale of 1:10,000. The two periods were chosen with a 17 year interval so that the changes will be more intense. The overlap in both cases is about 65%. To produce the necessary DSMs the standard photogrammetric approach was chosen, combined with automatic DSM extraction. All the photogrammetric tasks where done in the Leica Photogrammetric Station™ (LPS) of the Laboratory of Photogrammmetry, School of Rural and Survey Engineering, National Technical University of Athens.
TS 1 – Coastal Zone Management Christodoulos Psaltis and Charalabos Ioannidis An Algorithm for Monitoring Informal Constructions – An Application in Coastal Areas Strategic Integration of Surveying Services 6th FIG Regional Conference 2007 San José, Costa Rica 12-15 November 2007
13/20
First, six (6) control points were measured by GPS and the exterior orientation parameters of the stereopair of 2001 were calculated, in the National Greek Reference System. Unfortunately only one of the measured ground control points was found in the aerial photos of 1984 period; so, 9 new control points were extracted photogrammetrically from the 2001 period, distributed along the edges and in the centre of the area of interest. Finally the new control points were located in both time periods and aerotriangulation with bundle adjustment was performed for the two periods simultaneously; results are shown at Table 1.
Table 1. Accuracy results of the bundle block adjustment The last step was to automatically produce a DSM of 1m grid size on the ground, for both periods, accompanied by the production of the corresponding orthophoto-mosaics, with 0.2m groundel, that will be used for assessing the correctness of the automatically indicated changes. The produced DSMs were not edited at all to find out how the final results are influenced by the quality of the provided DSMs. However, after a manual optical inspection of the produced DSMs, their overall quality can be considered satisfying since about 80% of the total points extracted were correct, a percentage very close to what was expected based on experience in the performance of the current system. 4.2 Data Processing The automatic data processing for the change detection was done in an implementation in MATLAB™ of the proposed strategy described above (paragraph 3.2). To check the performance of the algorithm under different scenarios of building size, density and change, four smaller test areas were selected, each with some special characteristics: – Area 1 is mainly an open space without any significant road network, with areas of high
vegetation and a few buildings at the fringe (Figure 7 left). – Area 2 is mainly an agricultural area, with a few buildings in 1984, whose density was
significantly increased by 2001 (Figure 7 right). – Area 3 is a high density area, with buildings of various sizes and with small changes
between the two time periods (Figure 8 left). – Area-4 is already since 1984 a high density built-up area within the urban plan (Figure 8
right).
Simultaneous aerotriangulation of 1984 and 2001 periods X axis Y axis Z axis
Average residuals of GCPs (m) 0.013 0.025 -0.017 Maximum residuals of GCPs (m) 0.210 0.162 0.126
TS 1 – Coastal Zone Management Christodoulos Psaltis and Charalabos Ioannidis An Algorithm for Monitoring Informal Constructions – An Application in Coastal Areas Strategic Integration of Surveying Services 6th FIG Regional Conference 2007 San José, Costa Rica 12-15 November 2007
14/20
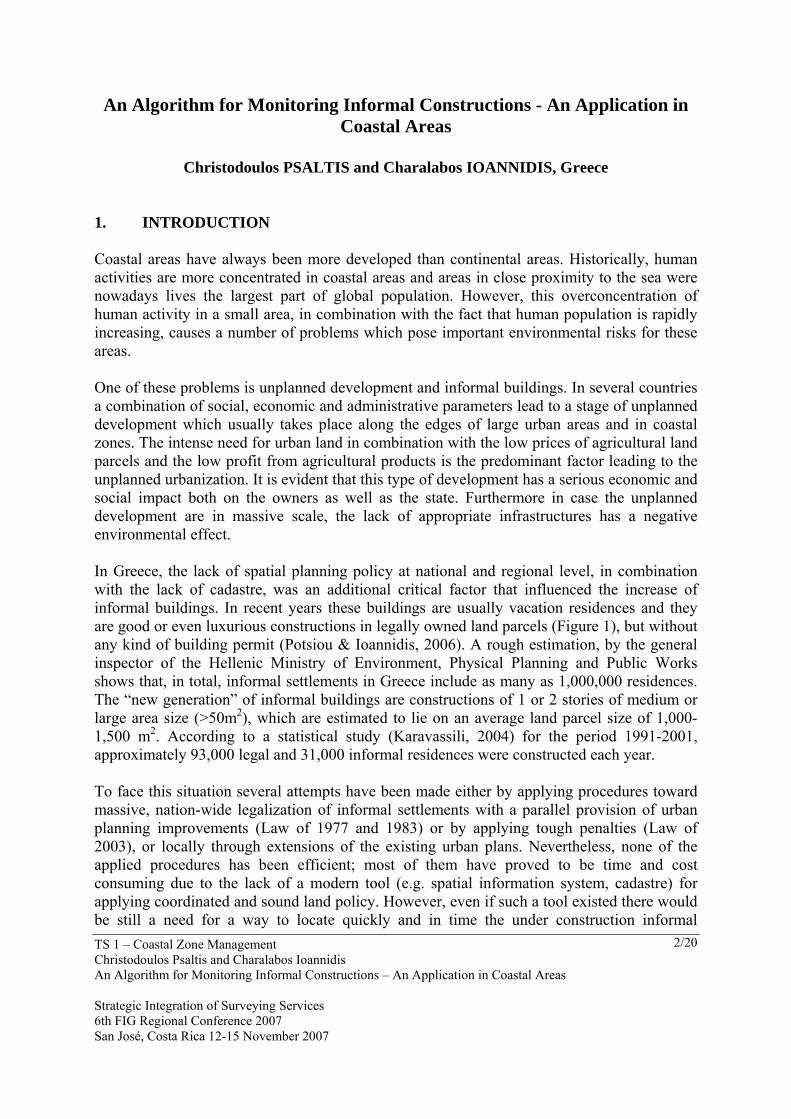
The basic statistics for the above four (4) areas are given in Table 2.
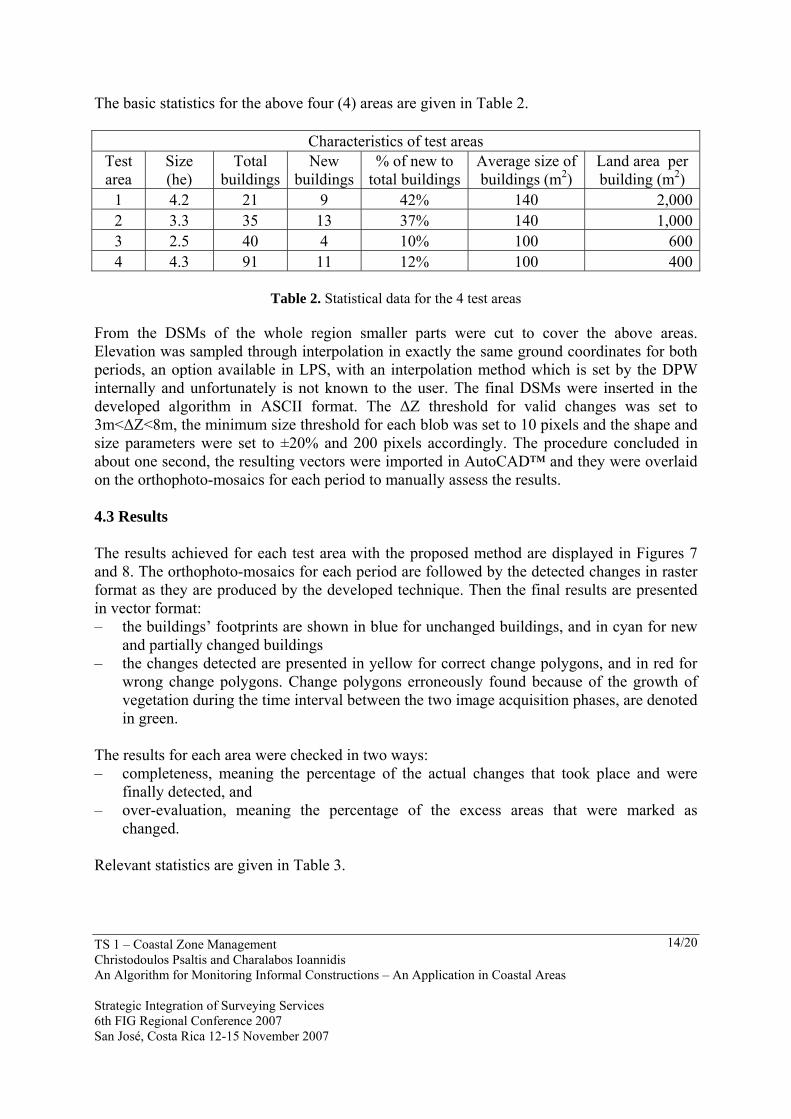
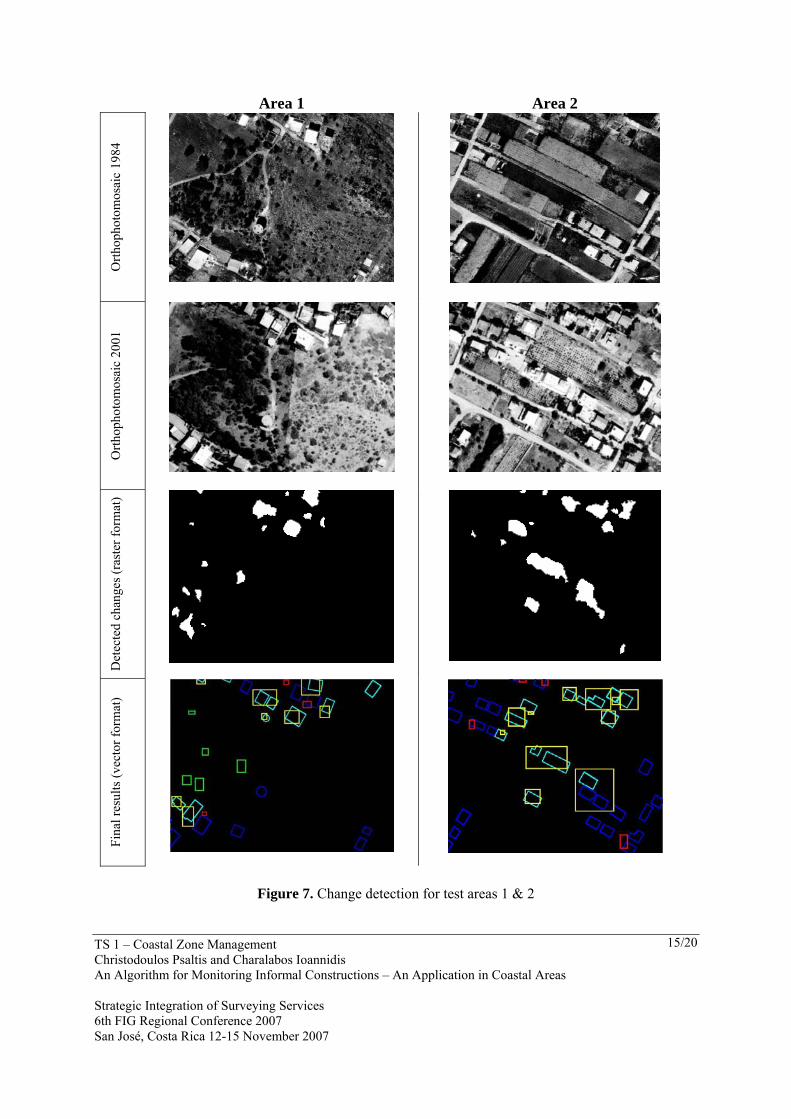
From the DSMs of the whole region smaller parts were cut to cover the above areas. Elevation was sampled through interpolation in exactly the same ground coordinates for both periods, an option available in LPS, with an interpolation method which is set by the DPW internally and unfortunately is not known to the user. The final DSMs were inserted in the developed algorithm in ASCII format. The ΔΖ threshold for valid changes was set to 3m<ΔZ<8m, the minimum size threshold for each blob was set to 10 pixels and the shape and size parameters were set to ±20% and 200 pixels accordingly. The procedure concluded in about one second, the resulting vectors were imported in AutoCAD™ and they were overlaid on the orthophoto-mosaics for each period to manually assess the results. 4.3 Results The results achieved for each test area with the proposed method are displayed in Figures 7 and 8. The orthophoto-mosaics for each period are followed by the detected changes in raster format as they are produced by the developed technique. Then the final results are presented in vector format: – the buildings’ footprints are shown in blue for unchanged buildings, and in cyan for new
and partially changed buildings – the changes detected are presented in yellow for correct change polygons, and in red for
wrong change polygons. Change polygons erroneously found because of the growth of vegetation during the time interval between the two image acquisition phases, are denoted in green.
The results for each area were checked in two ways: – completeness, meaning the percentage of the actual changes that took place and were
finally detected, and – over-evaluation, meaning the percentage of the excess areas that were marked as
changed. Relevant statistics are given in Table 3.
TS 1 – Coastal Zone Management Christodoulos Psaltis and Charalabos Ioannidis An Algorithm for Monitoring Informal Constructions – An Application in Coastal Areas Strategic Integration of Surveying Services 6th FIG Regional Conference 2007 San José, Costa Rica 12-15 November 2007
15/20
Area 1 Area 2 O
rthop
hoto
mos
aic
1984
Orth
opho
tom
osai
c 20
01
Det
ecte
d ch
ange
s (ra
ster
form
at)
Fina
l res
ults
(vec
tor f
orm
at)
Figure 7. Change detection for test areas 1 & 2
TS 1 – Coastal Zone Management Christodoulos Psaltis and Charalabos Ioannidis An Algorithm for Monitoring Informal Constructions – An Application in Coastal Areas Strategic Integration of Surveying Services 6th FIG Regional Conference 2007 San José, Costa Rica 12-15 November 2007
16/20
Orth
opho
tom
osai
c 19
84
Orth
opho
tom
osai
c 20
01
Det
ecte
d ch
ange
s (ra
ster
form
at)
Fina
l res
ults
(vec
tor f
orm
at)
Figure 8. Change detection for test areas 3 & 4
Area 3 Area 4
TS 1 – Coastal Zone Management Christodoulos Psaltis and Charalabos Ioannidis An Algorithm for Monitoring Informal Constructions – An Application in Coastal Areas Strategic Integration of Surveying Services 6th FIG Regional Conference 2007 San José, Costa Rica 12-15 November 2007
17/20
Table 3. Statistic results from the detection of new buildings
As derived from the above results, the proposed method is very efficient for area 2, whose characteristics (size and density of buildings) are more close to the typical characteristics of an area with informal settlements within the coastal zone of Greece. On the contrary, some problems are detected when the method is applied on high density urban areas (areas 3 & 4). At any case the majority of new buildings are successfully detected as locations of potential changes. Unlikely these results, the products of the change detections in buildings using the eCognition software, were not at all satisfactory for all 4 test areas. The produced image contained a lot of noise, without a reliable location of the real changes. Most likely, used data played a role in that, e.g., b/w photos of 1984 with low radiometric resolution. 5. CONCLUSIONS The use of automated techniques for the in-time location of new informal buildings consist a significant tool for the reduction and successful control of that phenomenon. When there is a large number of new informal constructions within environmentally sensitive areas, such as the coastal zones, a quick and objective change detection tool (which is not influenced by corruption or inefficiency of responsible administration) is a necessary component of a series of measures that have to be taken. The proposed technique is technologically simple, and needs short training and short time for application in broad areas, especially if high resolution satellite images will be used. Achieved results were successful for the areas which fit to the typical characteristics of informal settlements (at least) in Greece. In order to further check the achieved results a thorough application is needed and a testing in broader areas, with different relief, morphology and building density. Also, the criteria for filtering the candidate areas for change detections can be further improved so that the results will have even higher success statistics. REFERENCES Baltsavias, E.P., 2004. Object extraction and revision by image analysis using existing
geodata and knowledge: current status and steps towards operational systems. In: ISPRS Journal of Photogrammetry & Remote Sensing, 58(3-4), pp. 129-151.
Benz, U.C., Hofmann, P., Willhauck, G., Lingenfelder, I., Heynen, M., 2004. Multi-resolution, object-oriented fuzzy analysis of remote sensing data for GIS-ready information. In: ISPRS Journal of Photogrammetry & Remote Sensing, 58, pp. 239-258.
Area 1 Area 2 Area 3 Area 4 New Buildings 9 13 3 11 Changed regions detected 15 13 19 35 Completeness 90% 100% 66% 82% Over-evaluation 65% 0% 530% 220%
TS 1 – Coastal Zone Management Christodoulos Psaltis and Charalabos Ioannidis An Algorithm for Monitoring Informal Constructions – An Application in Coastal Areas Strategic Integration of Surveying Services 6th FIG Regional Conference 2007 San José, Costa Rica 12-15 November 2007
18/20
Blaschke, T., 2005.Towards a framework for change detection based on image objects. In: Erasmi, S., Cyffka, B., Kappas, M. (Eds.), Remote sensing and GIS for environmental studies, Vol. 113, Goettinger Geographische Abhandlungen, Goettingen, pp.1-9.
Hahn, M., Stätter, C., 1998. A scene labelling strategy for terrain feature extraction using multisource data In: The International Archives of the Photogrammetry, Remote Sensing and Spatial Information Sciences, Colombus, USA, Vol. XXXII, Part 3/1, pp. 435-441.
Ioannidis, C., Psaltis, C., Potsiou, C., 2007. Towards a strategy for suburban informal building control through automatic change detection. In: Joint FIG Commission 3, UN/ECE Working Party on Land Administration and UN/ECE Committee on Housing and Land Management Workshop, Sounio, Athens, Greece.
Karavassili, M, 2004. Procedure simplifications to facilitate application of urban planning and environmental legislation through control mechanisms and inspections. In: Workshop on Urban Planning and Construction, Athens, Greece, Technical Chamber of Greece (in Greek).
Lavigne, D.A., Hong, G., Zhang, Y., 2006. Performance assessment for automated feature extraction tools on high resolution imagery. In: MAPPS/ASPRS Fall Conference 2006, San Antonio, Texas. URL: www.featureanalyst.com/feature_analyst/publications/success/
AFE-Ecog-FA.pdf - (last date accessed: 15 Sep. 2007). Mayer, H., 1999. Automatic object extraction from aerial imagery – A survey focusing on
buildings. In: Computer Vision and Image Understanding, Vol. 74, Issue 2, pp.138-149. Mayer, H., 2004. Object extraction for digital photogrammetric workstations. In: The
International Archives of the Photogrammetry, Remote Sensing and Spatial Information Sciences, Istanbul, Turkey, Vol. XXXV, Part B2, pp. 165-173.
Meinel, G., Neubert, M., 2004. A comparison of segmentation programs for high resolution remote sensing data. In: The International Archives of the Photogrammetry, Remote Sensing and Spatial Information Sciences, Istanbul, Turkey, Vol. XXXV, Part B4, pp. 506-511.
Moeller, M.S., Blaschke, T., 2006. Urban change extraction from high resolution satellite image. In: The International Archives of the Photogrammetry, Remote Sensing and Spatial Information Sciences, Vienna, Austria, Vol. XXXVI, Part 2, pp. 151-156.
Neubert, M., Herold, H. and Meinel, G., 2006. Evaluation of remote sensing image segmentation quality - further results and concepts. In: The International Archives of the Photogrammetry, Remote Sensing and Spatial Information Sciences, Salzburg, Austria, Vol. XXXVI, Part 4/C42, unpaginated CD-ROM.
O’Brien, M.A., 2003. Feature extraction with the VLS Feature Analyst system. In: ASPRS 2003 Annual Conference, Anchorage, Alaska. URL: http://gi.leica-geosystems.com/
documents/pdf/VLS_obrien_asprs.pdf (last date accessed: 20 Sep. 2007). Potsiou, C., Ioannidis, C., 2006. Informal settlements in Greece: The mystery of missing
information and the difficulty of their integration into a legal framework. In: 5th FIG Regional Conference, Accra, Ghana, URL: http://www.fig.net/pub/accra/papers/ts03/ ts03_04_potsiou_ioannidis.pdf (last date accessed: 25 Feb. 2007).
Pratt, W.K., 2001. Digital image processing, 3rd edition. John Wiley & Sons Inc., New York, USA, pp. 289-294.
TS 1 – Coastal Zone Management Christodoulos Psaltis and Charalabos Ioannidis An Algorithm for Monitoring Informal Constructions – An Application in Coastal Areas Strategic Integration of Surveying Services 6th FIG Regional Conference 2007 San José, Costa Rica 12-15 November 2007
19/20
Straub, B.M., Wiedemann, C., Heipke, C., 2000. Towards automatic interpretation of images for GIS update. In: The International Archives of the Photogrammetry, Remote Sensing and Spatial Information Sciences, Amsterdam, Netherlands, Vol. XXXIII, Part B2, pp. 525-532.
VLS (Visual Learning Systems), 2006. Feature Analyst Version 4.1 for ERDAS Imagine™, Reference Manual. URL: http://www.featureanalyst.com/feature_analyst/publications.htm
#item02p (last date accessed: 25 Feb. 2007). Zimmermann, P., 2000. A new framework for automatic building detection analysing
multiple cue data. In: The International Archives of the Photogrammetry, Remote Sensing and Spatial Information Sciences, Amsterdam, Netherlands, Vol. XXXIII, Part B3, pp. 1063-1070.
BIOGRAPHICAL NOTES Christodoulos Psaltis Surveying Engineer, PhD student. Degree of Survey Engineering in 2005 from School of Rural and Surveying Engineering, National Technical University of Athens (NTUA), Greece. Special research fields: automation in change detection problems, deformation monitoring and close range photogrammetric applications. Active member of Commission 3 of FIG and Commission 5 of ISPRS. Charalambos Ioannidis Assistant Professor at the Lab. of Photogrammetry, School of Rural and Surveying Engineering, National Technical University of Athens (NTUA), Greece, teaching Photogrammetry and Cadastre. Until 1996 he worked at private sector. 1992-96: Co-chairman of Commission VI -WG2-‘Computer Assisted Teaching’ in ISPRS. 1997-2001: Member of the Directing Council of Hellenic Mapping and Cadastral Organization and Deputy Project Manager of the Hellenic Cadastre. His research interests focus on terrestrial Photogrammetry, aerial triangulations, digital orthophotos, applications of digital Photogrammetry on the Cadastre and GIS. He has authored 80 papers in the above fields, and has given lectures in related seminars both in Greece and abroad. CONTACTS Christodoulos Psaltis Surveyor Engineer, PhD student University of Athens 9, Iroon Polytechniou St. Athens 15780 GREECE Tel. + 302107722653 Fax +302107722677 Email: [email protected]
TS 1 – Coastal Zone Management Christodoulos Psaltis and Charalabos Ioannidis An Algorithm for Monitoring Informal Constructions – An Application in Coastal Areas Strategic Integration of Surveying Services 6th FIG Regional Conference 2007 San José, Costa Rica 12-15 November 2007
20/20
Prof. Charalabos Ioannidis Assistant Professor, National Technical University of Athens 9, Iroon Polytechniou St. Athens 15780 GREECE Tel. + 30 2107722686 Fax + 30 2107722677 Email: [email protected]