c o m p u t e r m e t h o d s a n d p r o g r a m s i n b i o m e d i c i n e 1 1 0 ( 2 0 1 3 ) 354–360
j o ur na l ho me pag e: www.int l .e lsev ierhea l th .com/ journa ls /cmpb
An algorithm for on-line detection of high frequencyoscillations related to epilepsy
Armando López-Cuevasa,∗, Bernardino Castillo-Toledoa,1, Laura Medina-Cejab,2,Consuelo Ventura-Mejíab,2, Kenia Pardo-Penab,2
a Centro de Investigación y de Estudios Avanzados del Instituto Politécnico Nacional (CINVESTAV), Unidad Guadalajara, Av. del Bosque1145, col. El bajío, C.P. 45019, Zapopan, Jalisco, Mexicob Laboratorio de Neurofisiología y Neuroquímica, Departamento de Biología Celular y Molecular, CUCBA, Universidad de Guadalajara,Mexico
a r t i c l e i n f o
Article history:
Received 28 March 2012
Received in revised form
18 December 2012
Accepted 30 January 2013
Keywords:
Epilepsy
Fast ripples
a b s t r a c t
Recent studies suggest that the appearance of signals with high frequency oscillations
components in specific regions of the brain is related to the incidence of epilepsy. These
oscillations are in general small in amplitude and short in duration, making them diffi-
cult to identify. The analysis of these oscillations are particularly important in epilepsy
and their study could lead to the development of better medical treatments. Therefore, the
development of algorithms for detection of these high frequency oscillations is of great
importance.
In this work, a new algorithm for automatic detection of high frequency oscillations is
presented. This algorithm uses approximate entropy and artificial neural networks to extract
High frequency oscillations
Approximate entropy
Cubature Kalman Filter
features in order to detect and classify high frequency components in electrophysiological
signals. In contrast to the existing algorithms, the one proposed here is fast and accurate, and
can be implemented on-line, thus reducing the time employed to analyze the experimental
electrophysiological signals.
1. Introduction
The electrical activity in the brain is a highly complex phe-nomenon. Signals may present frequency components in abroad spectrum, ranging from 1 to 500 Hz [1,2] or even higher[3]. Frequencies in the lower ranges (1–30 Hz) can be detectedat the scalp as EEG fluctuations [4]. Usually these low fre-quency oscillations are categorized on different sub-bands:
slow oscillation (<1 Hz), Delta (2–4 Hz), Theta (4–12 Hz), Alpha(9–13 Hz) and Beta (10–30 Hz), and their association to partic-ular brain states are to date well documented [5,6]. Recent
studies have focused on a higher band of frequencies in therange of 100–500 Hz. Such oscillations are local field potentialsand are more easily recorded with intracerebral microelec-trodes. This activity occurs at the beginning and during theepileptogenesis [7,8], and it has been suggested that some highfrequency oscillations (HFO) in hippocampus are biomarkersof epileptogenic zones [9] and could be useful in predictingseizures. However, HFO detection is complicated and time-consuming due to their short duration and small amplitude.
Most studies of HFO are carried out by visual inspection butthis is a cumbersome task specially for long time recordingswith several microelectrodes. Some algorithms for automatic
i n b i o m e d i c i n e 1 1 0 ( 2 0 1 3 ) 354–360 355
dteoddTi
2e
Ikmnqrfpsin(tptitttotsptTo[usfbs
Fs
0 50 100 150 200 250 300 350 400 450 5000
0.005
0.01
0.015
0.02
0.025
0.03
0.035
Frequency (Hz)
Am
plitu
de (
mV
)
Fig. 2 – Frequency spectrum of the HFO B (detail).
c o m p u t e r m e t h o d s a n d p r o g r a m s
etection of this activity have been developed [10,11], althoughhey are implemented off-line. These algorithms are based onnergy and statistical measures that need to be calculatedver the entire signal duration. To overcome some of theserawbacks, in this paper we propose an algorithm for theetection of HFO, which is able to be implemented on-line.his approach has several advantages: it is fast, accurate and
t is designed for real-time detection of HFO.
. High frequency oscillations related topilepsy
n hippocampus, HFO in the range of 100–200 Hz, commonlynown as Ripples, are believed to play an important role inemory consolidation, acting as compression waves during
on-REM sleep [12,13]. Oscillations at higher ranges of fre-uencies (250–500 Hz) are named fast ripples and they areelated to pathological conditions of the brain [14]. Ripples andast ripples have been the object of several studies over theast years both in experimental models [15,16] and in humantudies [17,18]. Particular interest in the HFO has increasedn neuroscience research, mainly because most neurons doot fire at high frequencies, due to their refractory period
i.e. the elapsed time after a neuron fires an action poten-ial until the neuron is able to fire again) and other intrinsicroperties. Thus, further research need to be done in ordero understand how such oscillations are generated. Interest-ngly, there is an increasing evidence that in specific regions ofhe brain where the fast ripples are detected, they are relatedo the development of epilepsy as well to the onset of epilep-ic seizures [19,20]. Specifically, the HFO called ripples can bebserved in hippocampal areas of epileptic animals wherehey never occur under normal conditions [21]. Typical HFOuperimposed on a slower wave recorded in the hippocam-us of an epileptic rat occur during the interictal period (i.e.he period between two seizures) and at the onset of seizures.hus it has been suggested that accurately real time detectionf HFO could help to predict an incoming seizure condition
22]. The mechanisms underlying these oscillations are stillnder discussion. Several hypothesis have been proposed but
till none fully confirmed. One hypothesis is that interneuronsrom hippocampus produce these HFO because they are capa-le of firing at high rates; nevertheless several studies havehown that the interneurons fire sparsely during HFO [23].
0 0.2 0.4 0.6 0.8 1.0 1.2
Am
plitu
de (
mV
)
Time (s)
HFO (a)
HFO (b)
HFO (c)
ig. 1 – Typical occurrence of HFO in electrophysiologicalignals.
Besides, in vitro studies have shown that HFO can exist evenwith blockade of chemical synapses [24]. This evidence sup-ports the hypothesis that non-synaptical mechanisms couldbe responsible for generating HFO, perhaps ephaptic interac-tions or electrical coupling between axons of principal cells[25]. This type of electrical coupling has been shown to existsamong mossy fiber axons in hippocampus [26]. Fig. 1 showsthe occurrence of a typical HFO signal and Fig. 2 shows thefrequency spectrum of the signal depicted inside the dashedbox in Fig. 1.
3. Experimental methods
In this work, five Wistar rats (250 ± 30 g weight, males) wereinjected with pilocarpine (9.8 �mol, 1 �L/min during 2 min) viaintracerebral-ventricular in order to induce a status epilepticusand eventually spontaneous recurrent seizures. Pilocarpineis a muscarinic agonist used to reproduce several character-istics of human temporal lobe epilepsy. This experimentalmodel was chosen because the presence of HFO similar tothose present in humans with epilepsy has been observed[23]. After 90 min of status epilepticus the rats were treatedwith diazepam to reduce mortality. The rats were video-monitored during two weeks every month until the presenceof spontaneous recurrent seizures. Later, eight intracerebralmicroelectrodes were implanted bilaterally in the dentategyrus (DG) and CA1 regions of hippocampal formation of thefive rats (DG: AP −3.5 mm, ML ±2.0 mm from bregma, DV−4.0 mm from the surface of neocortex; CA1: AP −5.0 mm, ML±5.0 mm from bregma, DV −5.5 mm from the surface of neo-cortex). Each microelectrode was connected to a polygraphwith eight amplifiers (Grass Technologies, Inc., RI, USA) toamplify the signal. Then, the amplified signal was filtered(lowpass 10 kHz filter and high pass 0.1 Hz filter) and digitizedwith a 12-bit precision data acquisition system MP150 (BIOPACsystems, CA, USA) with a sampling rate of 5 kHz. A pair ofmicroelectrodes were implanted in the right angular bundleto stimulate perforant path afferents to the hippocampus (AP−7.0 mm, ML 3.5 mm from bregma, DV 2.5 mm from the sur-face of neocortex). The stimulation signal was a electrical
pulse with a duration of 0.1 ms and 0.1–1.0 mA in amplitude;the pulse was applied every 10 s.
356 c o m p u t e r m e t h o d s a n d p r o g r a m s i n
Fig. 3 – Block diagram for HFO detection.
4. Algorithm
The algorithm consists of two basic parts: feature extrac-tion and classification. As shown in Fig. 3, the signal is
0 0.2 0.4 0−0.5
0
0.5
Am
plitu
de (
mV
)
Tim
0 200 400 600 8000
0.01
Freque
Am
plitu
de (
mV
)
HFO (a) HFO (b) HFO (c) HFO (d) HFO (
Fig. 4 – Changes in the ApEn of the signal during HFO (upper
b i o m e d i c i n e 1 1 0 ( 2 0 1 3 ) 354–360
passed through a feature extraction block where features areextracted and then passed to a classification block where thesignal is classified as normal or as HFO. The feature extrac-tion is made by capturing the dynamical changes in the signal.Specifically, it is determined whether or not the signal under-goes changes in its complexity during HFO. This is doneby calculating the approximate entropy (ApEn) of the signal[27,28]. The classification part is implemented through the useof an artificial recurrent neural network (ARNN). Because theARNN require training to adapt its parameters, there is an off-line step in this algorithm; however, this step is implementedonly once and requires only a small data set. The two basicparts of the algorithm are described in detail in the following.
4.1. (a) Feature extraction
The process of extracting qualitative information from a com-plex signal is called feature extraction. Feature extractioncan be complicated and computationally demanding. Sinceseveral studies have shown that brain electrical activity under-goes changes in its complexity during epilepsy [35], in thiswork we analyzed changes in the complexity of the physio-logical signal during HFO. As shown in Fig. 4, the ApEn of thesignal (dashed line) changes considerably during the presenceof HFO. In particular, the complexity of the signal is higherduring an HFO event. Complexity changes in the signal areanalyzed by using an easy-to-compute measure of complexity,the ApEn.
The ApEn is a statistic method to quantify the unpre-dictability of fluctuations in both stochastic and deterministicsignals. Higher values of ApEn mean lower predictability [29].To compute ApEn three input parameter should be specified:m, the length of compared vector in the time series of thesignal; r, the similarity tolerance and s(n) the sampled phys-iological signal with n = 1, . . ., N, the number of samples. Thealgorithm to compute the ApEn(m, r, s(n)) is given below:
Step 1. Form a vector of subsequences S1, . . ., SN−m+1 definedby Si = [s(i), s(i + 1), . . ., s(i + m − 1)] for i = 1, . . ., N − m + 1.
.6 0.8 1.0 1.2e (s)
1000 1200 1400 1600ncy (Hz)
e)
part) and the frequency spectrum of HFO E (lower part).
c o m p u t e r m e t h o d s a n d p r o g r a m s i n b i o m e d i c i n e 1 1 0 ( 2 0 1 3 ) 354–360 357
4
Ifinhwcuusk
e
4
Bocai(vcpHt
0 50 100 150 200 250 300
−0.2
0
0.2
0.4
0.6
0.8
1
Time (ms)
Am
plitu
de (
mV
)
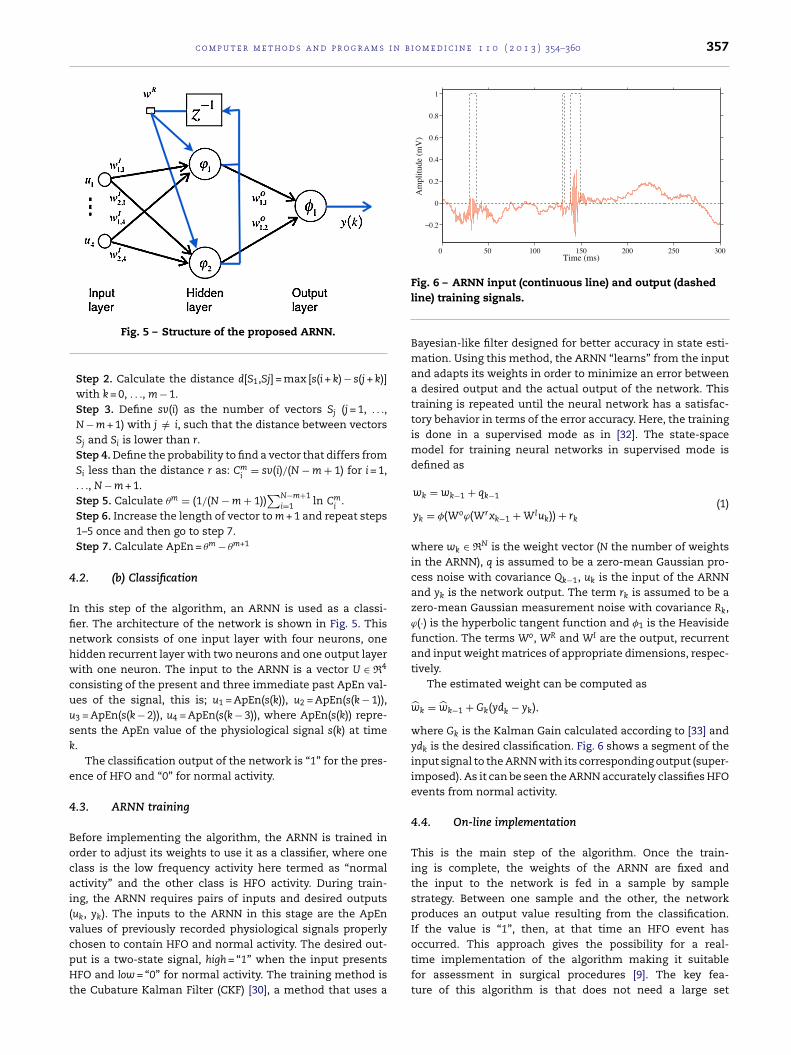
Fig. 6 – ARNN input (continuous line) and output (dashed
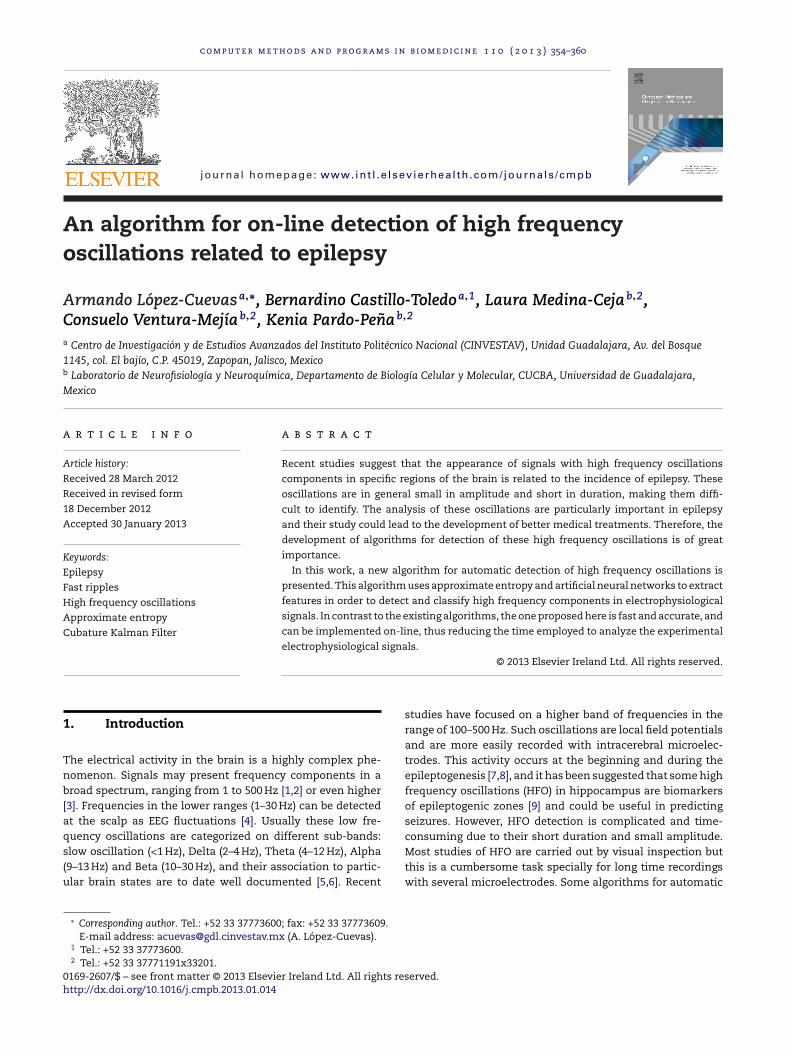
Fig. 5 – Structure of the proposed ARNN.
Step 2. Calculate the distance d[S1,Sj] = max [s(i + k) − s(j + k)]with k = 0, . . ., m − 1.Step 3. Define sv(i) as the number of vectors Sj (j = 1, . . .,N − m + 1) with j /= i, such that the distance between vectorsSj and Si is lower than r.Step 4. Define the probability to find a vector that differs fromSi less than the distance r as: Cm
i= sv(i)/(N − m + 1) for i = 1,
. . ., N − m + 1.Step 5. Calculate �m = (1/(N − m + 1))
∑N−m+1i=1 ln Cm
i.
Step 6. Increase the length of vector to m + 1 and repeat steps1–5 once and then go to step 7.Step 7. Calculate ApEn = �m − �m+1
.2. (b) Classification
n this step of the algorithm, an ARNN is used as a classi-er. The architecture of the network is shown in Fig. 5. Thisetwork consists of one input layer with four neurons, oneidden recurrent layer with two neurons and one output layerith one neuron. The input to the ARNN is a vector U ∈ R4
onsisting of the present and three immediate past ApEn val-es of the signal, this is; u1 = ApEn(s(k)), u2 = ApEn(s(k − 1)),
3 = ApEn(s(k − 2)), u4 = ApEn(s(k − 3)), where ApEn(s(k)) repre-ents the ApEn value of the physiological signal s(k) at time.
The classification output of the network is “1” for the pres-nce of HFO and “0” for normal activity.
.3. ARNN training
efore implementing the algorithm, the ARNN is trained inrder to adjust its weights to use it as a classifier, where onelass is the low frequency activity here termed as “normalctivity” and the other class is HFO activity. During train-ng, the ARNN requires pairs of inputs and desired outputsuk, yk). The inputs to the ARNN in this stage are the ApEnalues of previously recorded physiological signals properly
hosen to contain HFO and normal activity. The desired out-ut is a two-state signal, high = “1” when the input presentsFO and low = “0” for normal activity. The training method is
he Cubature Kalman Filter (CKF) [30], a method that uses a
line) training signals.
Bayesian-like filter designed for better accuracy in state esti-mation. Using this method, the ARNN “learns” from the inputand adapts its weights in order to minimize an error betweena desired output and the actual output of the network. Thistraining is repeated until the neural network has a satisfac-tory behavior in terms of the error accuracy. Here, the trainingis done in a supervised mode as in [32]. The state-spacemodel for training neural networks in supervised mode isdefined as
wk = wk−1 + qk−1
yk = �(Woϕ(Wrxk−1 + WIuk)) + rk
(1)
where wk ∈ RN is the weight vector (N the number of weightsin the ARNN), q is assumed to be a zero-mean Gaussian pro-cess noise with covariance Qk−1, uk is the input of the ARNNand yk is the network output. The term rk is assumed to be azero-mean Gaussian measurement noise with covariance Rk,ϕ(·) is the hyperbolic tangent function and �1 is the Heavisidefunction. The terms Wo, WR and WI are the output, recurrentand input weight matrices of appropriate dimensions, respec-tively.
The estimated weight can be computed as
wk = wk−1 + Gk(ydk − yk),
where Gk is the Kalman Gain calculated according to [33] andydk is the desired classification. Fig. 6 shows a segment of theinput signal to the ARNN with its corresponding output (super-imposed). As it can be seen the ARNN accurately classifies HFOevents from normal activity.
4.4. On-line implementation
This is the main step of the algorithm. Once the train-ing is complete, the weights of the ARNN are fixed andthe input to the network is fed in a sample by samplestrategy. Between one sample and the other, the networkproduces an output value resulting from the classification.If the value is “1”, then, at that time an HFO event has
occurred. This approach gives the possibility for a real-time implementation of the algorithm making it suitablefor assessment in surgical procedures [9]. The key fea-ture of this algorithm is that does not need a large set
358 c o m p u t e r m e t h o d s a n d p r o g r a m s i n b i o m e d i c i n e 1 1 0 ( 2 0 1 3 ) 354–360
0 0.1 0.2 0.3 0.4 0.5 0.6 0.7
0
0.5
1
Am
plitu
de (
mV
)
0 0.25 0.5 0.75 1.0 1.25−1
0
1
Am
plitu
de (
mV
)
0 0.25 0.5 0.75 1.00 1.25
−1
0
1
Time (s)
Am
plitu
de (
mV
)
Stimulation PopulationSpike
hm
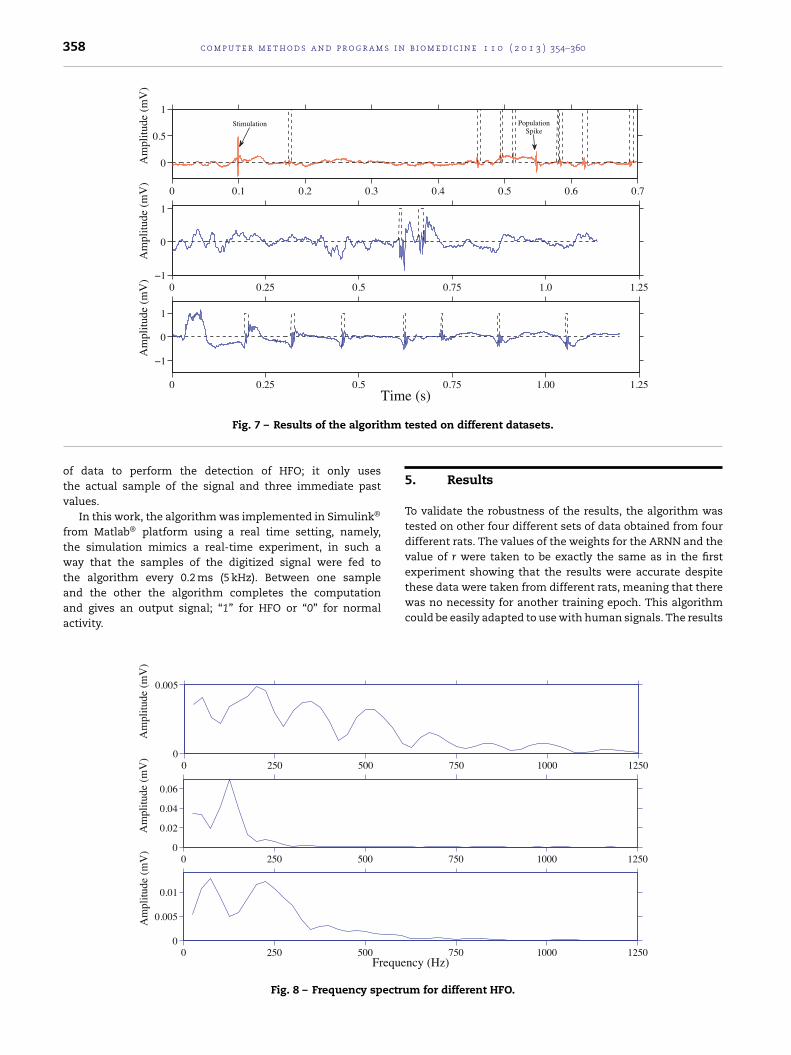
Fig. 7 – Results of the algorit
of data to perform the detection of HFO; it only usesthe actual sample of the signal and three immediate pastvalues.
In this work, the algorithm was implemented in Simulink®
from Matlab® platform using a real time setting, namely,the simulation mimics a real-time experiment, in such away that the samples of the digitized signal were fed tothe algorithm every 0.2 ms (5 kHz). Between one sample
and the other the algorithm completes the computationand gives an output signal; “1” for HFO or “0” for normalactivity.
0 250 5000
0.02
0.04
0.06
Am
plitu
de (
mV
)
0 250 5000
0.005
0.01
Freque
Am
plitu
de (
mV
)
0 250 5000
0.005
Am
plitu
de (
mV
)
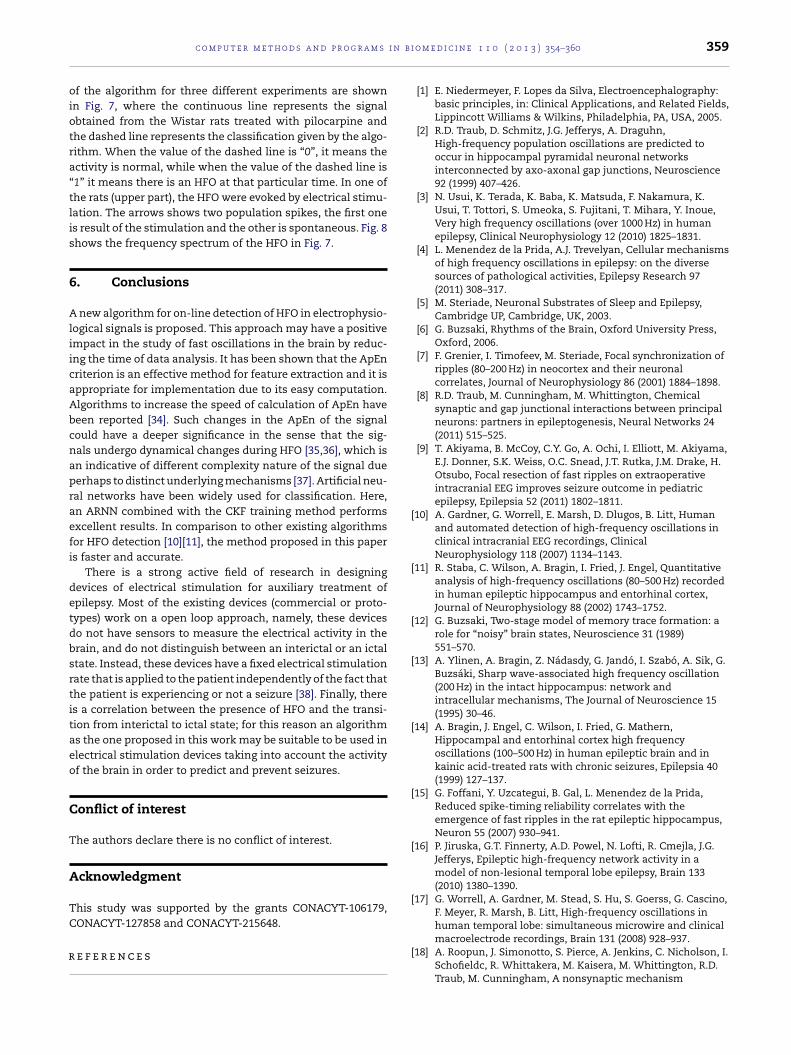
Fig. 8 – Frequency spectru
tested on different datasets.
5. Results
To validate the robustness of the results, the algorithm wastested on other four different sets of data obtained from fourdifferent rats. The values of the weights for the ARNN and thevalue of r were taken to be exactly the same as in the firstexperiment showing that the results were accurate despite
these data were taken from different rats, meaning that therewas no necessity for another training epoch. This algorithmcould be easily adapted to use with human signals. The results
c o m p u t e r m e t h o d s a n d p r o g r a m s
f the algorithm for three different experiments are shownn Fig. 7, where the continuous line represents the signalbtained from the Wistar rats treated with pilocarpine andhe dashed line represents the classification given by the algo-ithm. When the value of the dashed line is “0”, it means thectivity is normal, while when the value of the dashed line is1” it means there is an HFO at that particular time. In one ofhe rats (upper part), the HFO were evoked by electrical stimu-ation. The arrows shows two population spikes, the first ones result of the stimulation and the other is spontaneous. Fig. 8hows the frequency spectrum of the HFO in Fig. 7.
. Conclusions
new algorithm for on-line detection of HFO in electrophysio-ogical signals is proposed. This approach may have a positivempact in the study of fast oscillations in the brain by reduc-ng the time of data analysis. It has been shown that the ApEnriterion is an effective method for feature extraction and it isppropriate for implementation due to its easy computation.lgorithms to increase the speed of calculation of ApEn haveeen reported [34]. Such changes in the ApEn of the signalould have a deeper significance in the sense that the sig-als undergo dynamical changes during HFO [35,36], which isn indicative of different complexity nature of the signal dueerhaps to distinct underlying mechanisms [37]. Artificial neu-al networks have been widely used for classification. Here,n ARNN combined with the CKF training method performsxcellent results. In comparison to other existing algorithmsor HFO detection [10][11], the method proposed in this papers faster and accurate.
There is a strong active field of research in designingevices of electrical stimulation for auxiliary treatment ofpilepsy. Most of the existing devices (commercial or proto-ypes) work on a open loop approach, namely, these deviceso not have sensors to measure the electrical activity in therain, and do not distinguish between an interictal or an ictaltate. Instead, these devices have a fixed electrical stimulationate that is applied to the patient independently of the fact thathe patient is experiencing or not a seizure [38]. Finally, theres a correlation between the presence of HFO and the transi-ion from interictal to ictal state; for this reason an algorithms the one proposed in this work may be suitable to be used inlectrical stimulation devices taking into account the activityf the brain in order to predict and prevent seizures.
onflict of interest
he authors declare there is no conflict of interest.
cknowledgment
his study was supported by the grants CONACYT-106179,ONACYT-127858 and CONACYT-215648.
e f e r e n c e s
o m e d i c i n e 1 1 0 ( 2 0 1 3 ) 354–360 359
[1] E. Niedermeyer, F. Lopes da Silva, Electroencephalography:basic principles, in: Clinical Applications, and Related Fields,Lippincott Williams & Wilkins, Philadelphia, PA, USA, 2005.
[2] R.D. Traub, D. Schmitz, J.G. Jefferys, A. Draguhn,High-frequency population oscillations are predicted tooccur in hippocampal pyramidal neuronal networksinterconnected by axo-axonal gap junctions, Neuroscience92 (1999) 407–426.
[3] N. Usui, K. Terada, K. Baba, K. Matsuda, F. Nakamura, K.Usui, T. Tottori, S. Umeoka, S. Fujitani, T. Mihara, Y. Inoue,Very high frequency oscillations (over 1000 Hz) in humanepilepsy, Clinical Neurophysiology 12 (2010) 1825–1831.
[4] L. Menendez de la Prida, A.J. Trevelyan, Cellular mechanismsof high frequency oscillations in epilepsy: on the diversesources of pathological activities, Epilepsy Research 97(2011) 308–317.
[5] M. Steriade, Neuronal Substrates of Sleep and Epilepsy,Cambridge UP, Cambridge, UK, 2003.
[6] G. Buzsaki, Rhythms of the Brain, Oxford University Press,Oxford, 2006.
[7] F. Grenier, I. Timofeev, M. Steriade, Focal synchronization ofripples (80–200 Hz) in neocortex and their neuronalcorrelates, Journal of Neurophysiology 86 (2001) 1884–1898.
[8] R.D. Traub, M. Cunningham, M. Whittington, Chemicalsynaptic and gap junctional interactions between principalneurons: partners in epileptogenesis, Neural Networks 24(2011) 515–525.
[9] T. Akiyama, B. McCoy, C.Y. Go, A. Ochi, I. Elliott, M. Akiyama,E.J. Donner, S.K. Weiss, O.C. Snead, J.T. Rutka, J.M. Drake, H.Otsubo, Focal resection of fast ripples on extraoperativeintracranial EEG improves seizure outcome in pediatricepilepsy, Epilepsia 52 (2011) 1802–1811.
[10] A. Gardner, G. Worrell, E. Marsh, D. Dlugos, B. Litt, Humanand automated detection of high-frequency oscillations inclinical intracranial EEG recordings, ClinicalNeurophysiology 118 (2007) 1134–1143.
[11] R. Staba, C. Wilson, A. Bragin, I. Fried, J. Engel, Quantitativeanalysis of high-frequency oscillations (80–500 Hz) recordedin human epileptic hippocampus and entorhinal cortex,Journal of Neurophysiology 88 (2002) 1743–1752.
[12] G. Buzsaki, Two-stage model of memory trace formation: arole for “noisy” brain states, Neuroscience 31 (1989)551–570.
[13] A. Ylinen, A. Bragin, Z. Nádasdy, G. Jandó, I. Szabó, A. Sik, G.Buzsáki, Sharp wave-associated high frequency oscillation(200 Hz) in the intact hippocampus: network andintracellular mechanisms, The Journal of Neuroscience 15(1995) 30–46.
[14] A. Bragin, J. Engel, C. Wilson, I. Fried, G. Mathern,Hippocampal and entorhinal cortex high frequencyoscillations (100–500 Hz) in human epileptic brain and inkainic acid-treated rats with chronic seizures, Epilepsia 40(1999) 127–137.
[15] G. Foffani, Y. Uzcategui, B. Gal, L. Menendez de la Prida,Reduced spike-timing reliability correlates with theemergence of fast ripples in the rat epileptic hippocampus,Neuron 55 (2007) 930–941.
[16] P. Jiruska, G.T. Finnerty, A.D. Powel, N. Lofti, R. Cmejla, J.G.Jefferys, Epileptic high-frequency network activity in amodel of non-lesional temporal lobe epilepsy, Brain 133(2010) 1380–1390.
[17] G. Worrell, A. Gardner, M. Stead, S. Hu, S. Goerss, G. Cascino,F. Meyer, R. Marsh, B. Litt, High-frequency oscillations inhuman temporal lobe: simultaneous microwire and clinicalmacroelectrode recordings, Brain 131 (2008) 928–937.
[18] A. Roopun, J. Simonotto, S. Pierce, A. Jenkins, C. Nicholson, I.Schofieldc, R. Whittakera, M. Kaisera, M. Whittington, R.D.Traub, M. Cunningham, A nonsynaptic mechanism
360 c o m p u t e r m e t h o d s a n d p r o g r a m
underlying interictal discharges in human epilepticneocortex, Proceedings of the National Academy of Sciencesof the United States of America 107 (2010) 338–343.
[19] F. Grenier, I. Timofeev, M. Steriade, Neocortical very fastoscillations (ripples, 80–200 Hz) during seizures: intracellularcorrelates, Journal of Neurophysiology 89 (2003) 841–852.
[20] V. Dzhala, K. Staley, Mechanisms of fast ripples in thehippocampus, The Journal of Neuroscience 24 (2004)8896–8906.
[21] J. Engel, A. Bragin, R. Staba, I. Mody, High-frequencyoscillations: what is normal and what is not? Epilepsia 50(2009) 598–604.
[22] R. Staba, A. Bragin, High-frequency oscillations and otherelectrophysiological biomarkers of epilepsy: underlyingmechanisms, Biomarkers in Medicine 5 (2011) 545–556.
[23] A. Bragin, S. Benassi, F. Kheiri, J. Engel, Further evidence thatpathologic high-frequency oscillations are bursts ofpopulation spikes derived from recordings of identified cellsin dentate gyrus, Epilepsia 52 (2011) 45–52.
[24] R.D. Traub, A. Bibbig, A model of high-frequency ripples inthe hippocampus based on synaptic coupling plusaxon–axon gap junctions between pyramidal neurons, TheJournal of Neuroscience 20 (2000) 2086–2093.
[25] J.G. Jefferys, Nonsynaptic modulation of neuronal activity inthe brain: electric currents and extracellular ions,Physiological Reviews 75 (1995) 689–723.
[26] F. Hamzei-Sichani, N. Kamasawa, W. Janssen, T. Yasumura,K. Davidson, P. Hof, S. Wearne, M. Stewart, S. Young, M.Whittington, J. Rash, R.D. Traub, Gap junctions onhippocampal mossy fiber axons demonstrated bythin-section electron microscopy and freeze-fracture replicaimmunogold labeling, Proceedings of the National Academyof Sciences of the United States of America 104 (2007)
12548–12553.
[27] S. Pincus, Approximate entropy as a measure of systemcomplexity, Proceedings of the National Academy ofSciences of the United States of America 88 (1991) 2297–2301.
b i o m e d i c i n e 1 1 0 ( 2 0 1 3 ) 354–360
[28] P. Yu-Hsiang, W. Yung-Hung, L. Sheng-Fu, L. Kuo-Tien, Fastcomputation of sample entropy and approximate entropy inbiomedicine, Computer Methods and Programs inBiomedicine 104 (2011) 382–396.
[29] V. Srinivasan, C. Eswaran, N. Sriraam, Approximateentropy-based epileptic EEG detection using artificial neuralnetworks, IEEE Transactions on Information Technology inBiomedicine 11 (2007) 288–295.
[30] I. Arasaratnam, S. Haykin, Cubature Kalman filters, IEEETransactions on Automatic Control 54 (2009) 1254–1269.
[32] S. Haykin, I. Arasaratnam, Nonlinear sequential stateestimation for solving pattern classification problems, in: T.Adali, S. Haykin (Eds.), Adaptive Signal Processing: NextGeneration Solutions, Wiley-IEEE Press, Hoboken, NJ, USA,2010 (Chapter 6).
[33] I. Arasaratnam, S. Haykin, Nonlinear Bayesian filters fortraining recurrent neural networks, in: MICAI,Springer-Verlag, Berlin, Heidelberg, 2008.
[34] G. Manis, Fast computation of approximate entropy,Computer Methods and Programs in Biomedicine 91 (2008)48–54.
[35] K. Lehnertz, Nonlinear EEG analysis in epilepsy: its possibleuse for interictal focus localization, seizure anticipation, andprevention, Journal of Clinical Neurophysiology 18 (2001)209–222.
[36] F. Lopes da Silva, W. Blanes, S.N. Kalitzin, J. Parra, P.Suffczynski, D.N. Velis, Epilepsies as dynamical diseasesof brain systems: basic models of the transition betweennormal and epileptic activity, Epilepsia 44 (2003)72–83.
[37] P. Jiruska, J. Csicsvari, A. Powell, J. Fox, W. Chang, M.Vreugdenhil, X. Li, M. Palus, A. Bujan, R. Dearden, J.G.Jefferys, High-frequency network activity, global increase inneuronal activity, and synchrony expansion precedeepileptic seizures in vitro, The Journal of Neuroscience 30
(2010) 5690–5701.
[38] W. Stacey, B. Litt, Technology insight: neuroengineering andepilepsy-designing devices for seizure control, NatureClinical Practice Neurology 4 (2008) 190–201.