Prepared for CALIFORNIA COASTAL CONSERVANCY Prepared by PHILIP WILLIAMS & ASSOCIATES WITH H.T.HARVEY & ASSOCIATES #1908 December 13, 2007 An Alternatives Assessment & Conceptual Design for the San Clemente Dam Removal: Carmel River Reroute and Removal Option
Transcript
P r e p a r e d f o r
C A L I F O R N I A C O A S T A L C O N S E R V A N C Y
P r e p a r e d b y P H I L I P W I L L I A M S & A S S O C I A T E S W I T H H . T . H A R V E Y & A S S O C I A T E S
# 1 9 0 8
D e c e m b e r 1 3 , 2 0 0 7
An Alternatives Assessment &
Conceptual Design for the
San Clemente Dam Removal:
Carmel River Reroute and
Removal Option
AN ALTERNATIVES ASSESSMENT AND CONCEPTUAL DESIGN FOR THE SAN CLEMENTE DAM REMOVAL: CARMEL RIVER REROUTE AND REMOVAL OPTION
Prepared for
California Coastal Conservancy
Prepared by
Philip Williams & Associates, Ltd.
with
H.T. Harvey & Associates
December 13th 2007 PWA Ref. #1908 CC Ref. # 07-032
Services provided pursuant to this Agreement are intended solely for the use and benefit of the California Coastal Conservancy. No other person or entity shall be entitled to rely on the services, opinions, recommendations, plans or specifications provided pursuant to this agreement without the express written consent of Philip Williams & Associates, Ltd., 550 Kearny Street, Suite 900, San Francisco, CA 94108.
P:\Projects\1908_SanClementeDam\Report\1908_SanClementeDamRpt-Dec2007-OutV2.doc 12/13/07 i
TABLE OF CONTENTS
Page No.
1. PROJECT BACKGROUND 1 1.1 SCOPE OF REPORT 1 1.2 PROJECT SETTING AND CONTEXT 1
2. PROJECT GOALS AND OBJECTIVES 8 2.1 TECHNICAL REVIEW TEAM 8 2.2 PROJECT GOALS 8
2.2.1 Primary Goals 8 2.2.2 Secondary Goals 9
2.3 FISH PASSAGE OBJECTIVES AND PERFORMANCE CRITERIA 9 2.3.1 Hydraulic Criteria for Fish Passage 9 2.3.2 Additional Performance Objectives and Criteria 10 2.3.3 Fish Migration Timing Criteria 11
4.2 CHANNEL DIMENSIONS 26 4.2.1 Observed Channel Dimensions in the Field 26 4.2.2 Channel Dimensions Used in the Alternatives Analysis 27
4.3 PRELIMINARY ROCK DIMENSIONS 28 4.4 SUPPLYING COBBLES AND BOULDERS TO THE DIVERSION AND SAN
CLEMENTE CREEK REACHES 28 4.4.1 Identifying a Source of Cobbles and Boulders 28 4.4.2 Transporting Cobbles and Boulders to the Diversion and San Clemente River
Reaches 29
5. PROPOSED PROJECT ALTERNATIVES 40 5.1 PHYSICAL PROJECT ALTERNATIVES 40 5.2 POTENTIAL PROJECT ALTERNATIVES CONSIDERED AND REJECTED 42 5.3 PROPOSED PROJECT SUB-ALTERNATIVES 42 5.4 DESIGN OF STEP-POOLS 43 5.5 RESTORATION AND REVEGETATION PLAN 44
5.5.1 Riparian Restoration Design Elements Common to All Reaches 44 5.5.1.1 Soils 44 5.5.1.2 Willow and Alder Plant Material 44 5.5.1.3 Diversion Channel Excavation Materials (woody material, soil,
seedbank) 45 5.5.1.4 Control of Non-native Species 45 5.5.1.5 Herbaceous Vegetation and Erosion Control 45 5.5.1.6 Optional Active Habitat Restoration 46
5.5.2 Riparian Restoration Design Elements Specific to the San Clemente Reaches 49 5.5.2.1 San Clemente Reach Soils 49 5.5.2.2 Proposed Step-Pools 49
5.5.3 Restoration Design Elements Specific to Diversion Reach 49 5.5.3.1 Proposed Step-Pools 49 5.5.3.2 Optional Restoration of Coastal Scrub Habitat 49
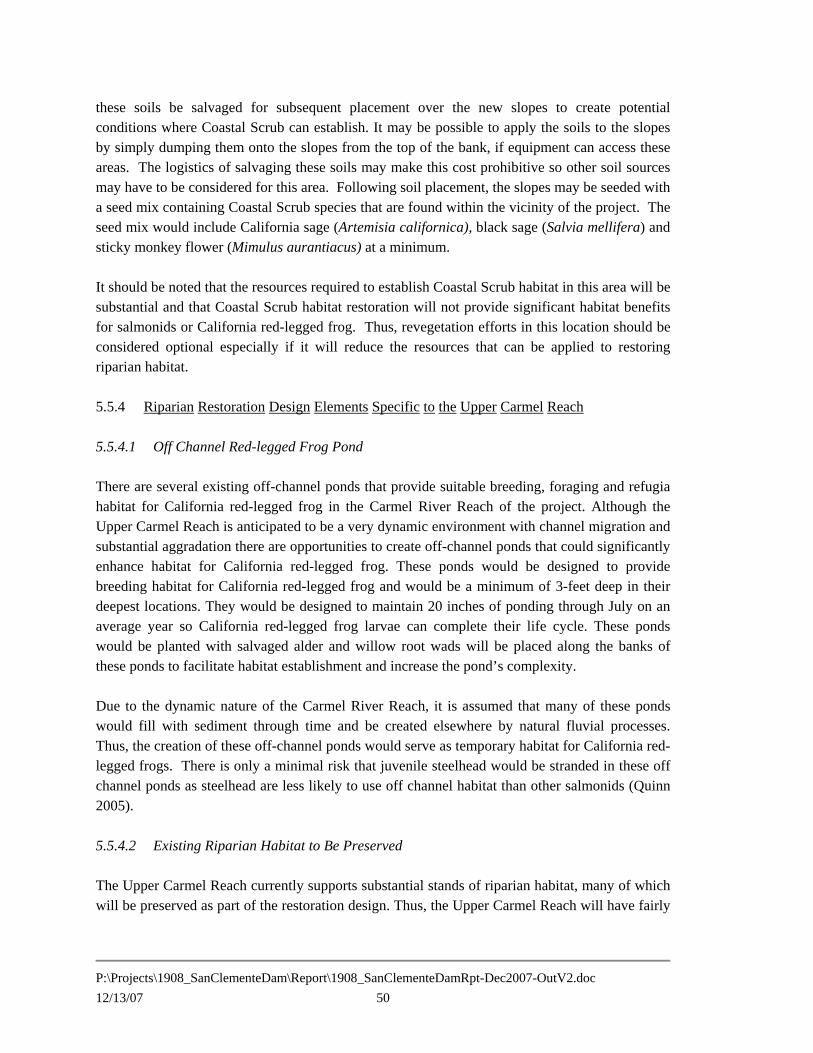
5.5.4 Riparian Restoration Design Elements Specific to the Upper Carmel Reach 50 5.5.4.1 Off Channel Red-legged Frog Pond 50 5.5.4.2 Existing Riparian Habitat to Be Preserved 50 5.5.4.3 Minimal Active Habitat Restoration 51
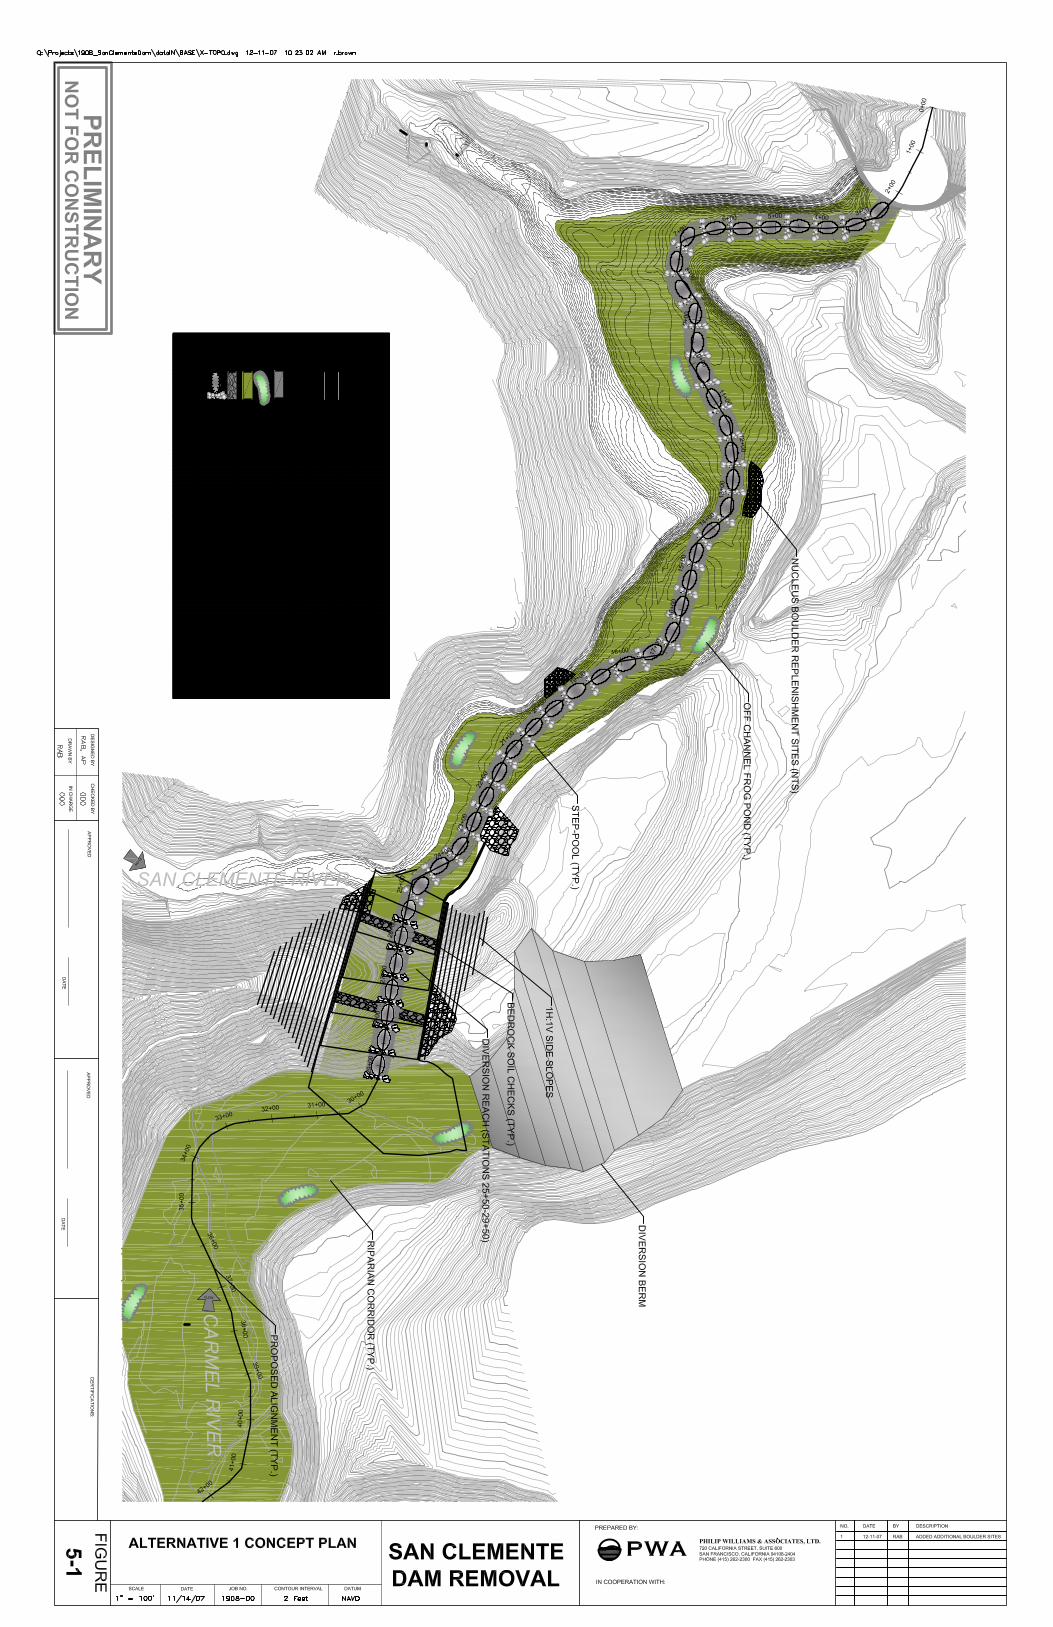
6. ASSESSMENT OF ALTERNATIVES 60 6.1 DEVELOPMENT OF HYDRAULIC MODEL OF ALTERNATIVES 60
6.1.1 Limitations in Hydraulic Modeling for Fish Passage Assessments 60 6.1.2 San Clemente Reach for Alternatives 1 and 2 61 6.1.3 Diversion Reach for Alternative 1 62
P:\Projects\1908_SanClementeDam\Report\1908_SanClementeDamRpt-Dec2007-OutV2.doc 12/13/07 iii
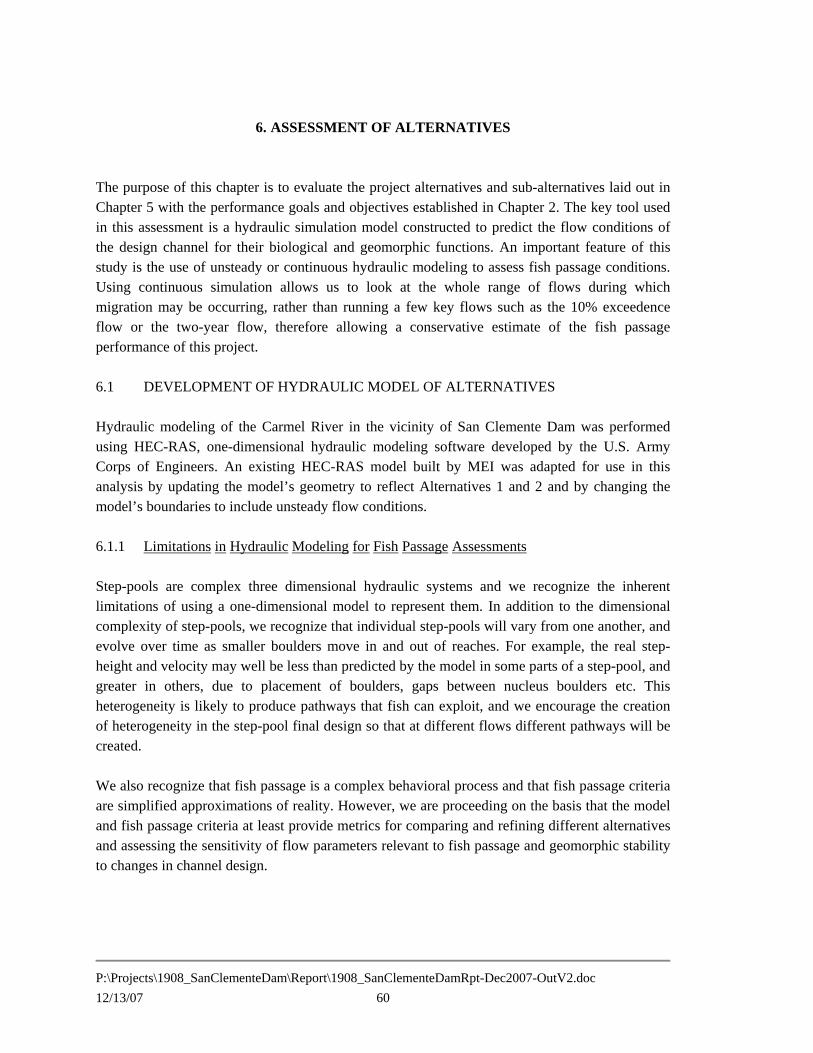
6.1.4 Diversion Reach and Upper Carmel River Reach for Alternative 2 62 6.1.5 Steady-state Simulation Hydrology 63 6.1.6 Unsteady Simulation Hydrology 63
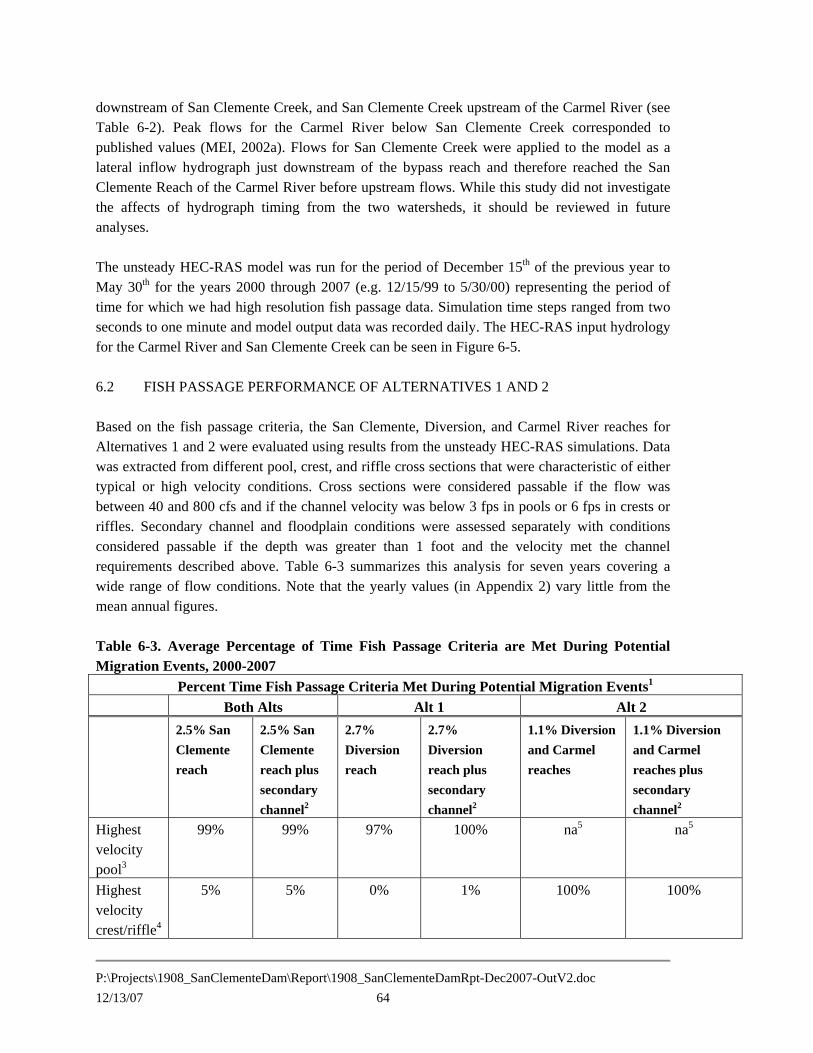
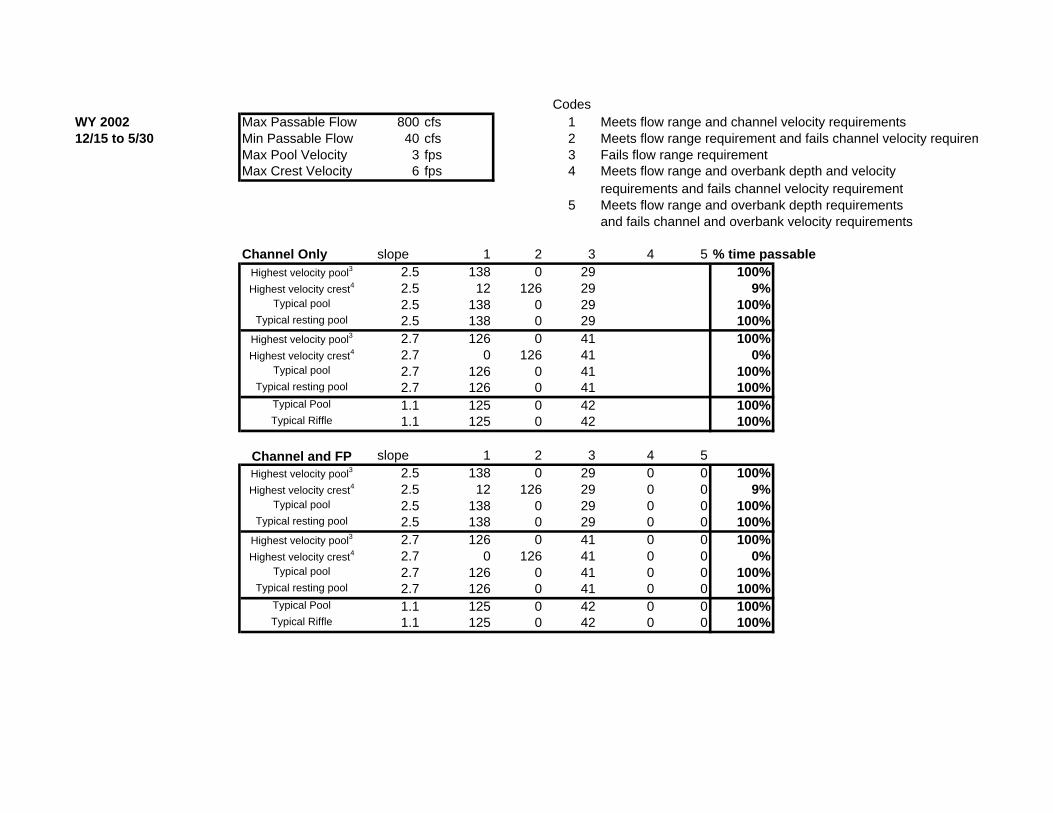
6.2 FISH PASSAGE PERFORMANCE OF ALTERNATIVES 1 AND 2 64 6.2.1 Summary of Fish Passage Performance for Alternatives 1 and 2 65
6.3 GEOMORPHIC PERFORMANCE OF ALTERNATIVES 1 AND 2 66 6.3.1 Estimated Time Required to Reach Equilibrium in the Upper Carmel River
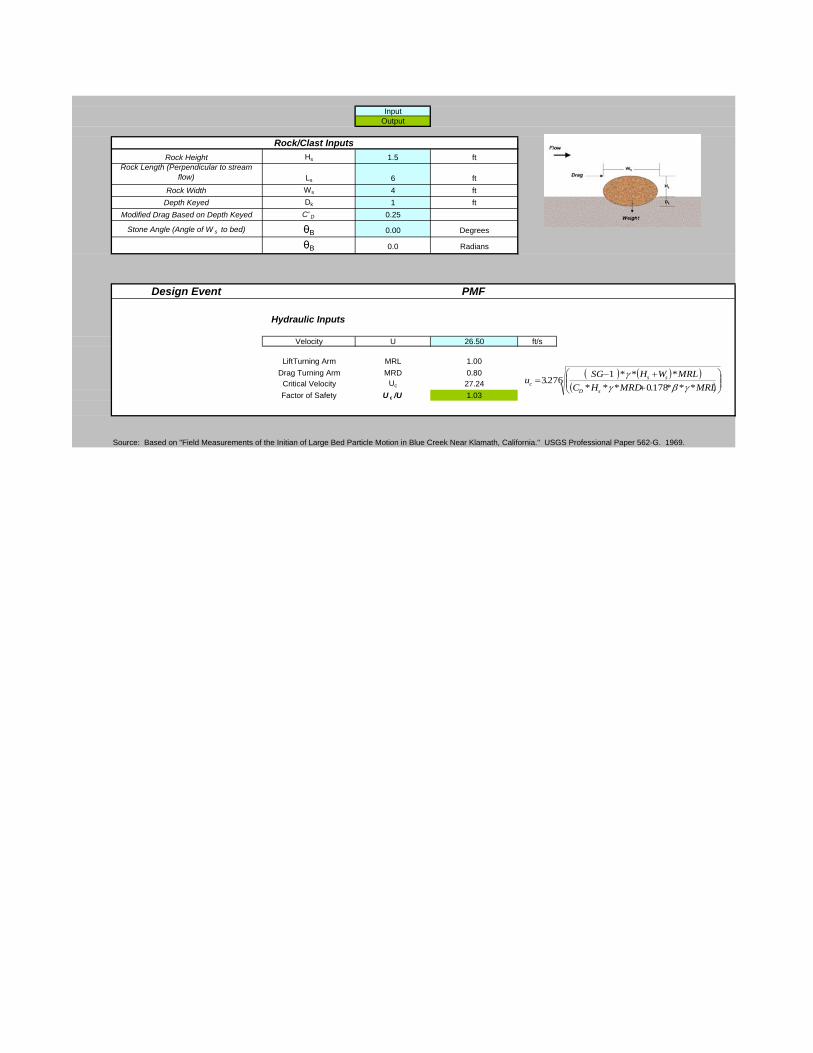
Reach 66 6.3.2 Rock Sizing for Step-Pool Nucleus Boulders 67 6.3.3 Potential Failure Mechanisms and Consequences 68 6.3.4 Sediment Transport Characteristics of the Two Alternatives 68
6.4 PERFORMANCE OF THE PROPOSED CAW WATER INTAKE 69 6.5 ASSESSMENT OF SUB-ALTERNATIVES 69
6.5.1 Placing Sediment Excavated From the Lower San Clemente Arm of the Reservoir in the Upper Carmel River Arm 69
6.5.2 Grading the Alternative 2 Upper Carmel River Reach Versus Allowing it to Erode into Shape 70
6.5.3 Placing Gravel, Cobble and Boulders in the Upper Carmel River Reach to Meter Sediment Downstream 71
6.6 SUMMARY OF ALTERNATIVES ASSESSMENT 71
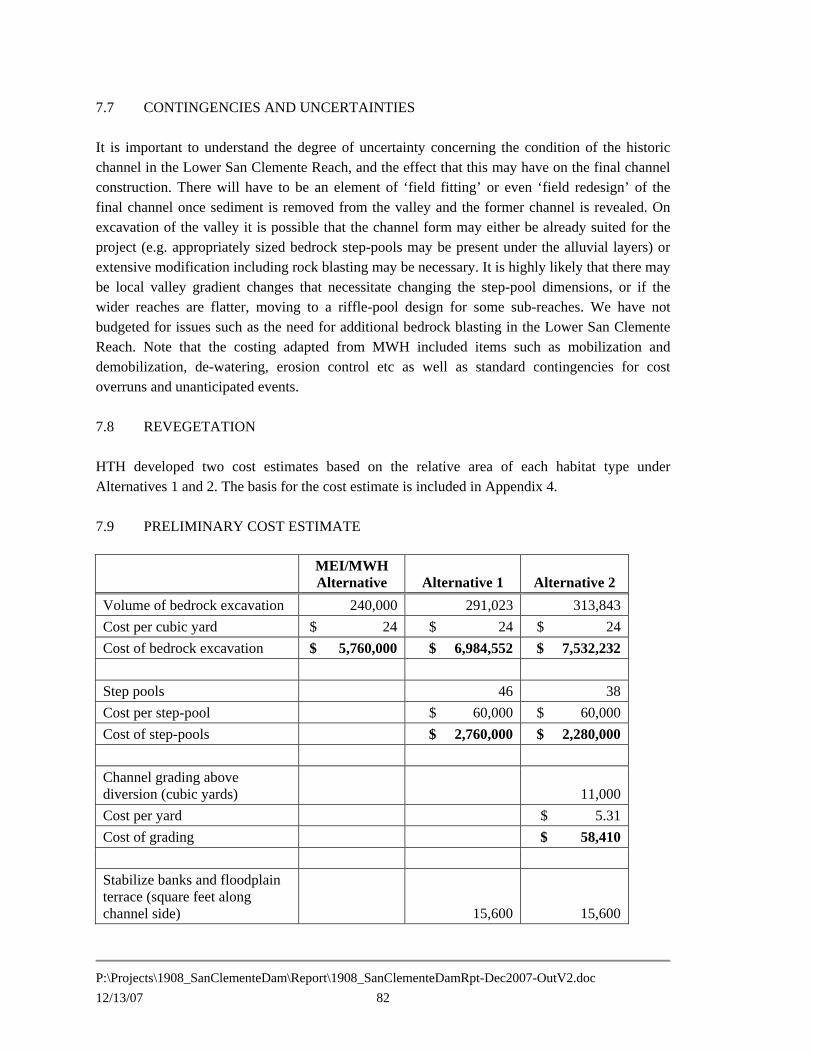
7. CONSTRUCTION COST ESTIMATE, CONSTRUCTION ISSUES, AND MONITORING & MAINTENANCE PLAN 80 7.1 BEDROCK EXCAVATION 80 7.2 STEP-POOLS 81 7.3 SIMULATED LANDSLIDES 81 7.4 CHANNEL GRADING 81 7.5 CHANNEL STABILIZATION 81 7.6 RANNEY INTAKE SYSTEM 81 7.7 CONTINGENCIES AND UNCERTAINTIES 82 7.8 REVEGETATION 82 7.9 PRELIMINARY COST ESTIMATE 82 7.10 MONITORING AND MAINTENANCE PLAN 83
8. REFERENCES 86
9. LIST OF PREPARERS 88 LIST OF TABLES Table 2-1. Basic Hydraulic Performance Criteria for Fish Passage in the San Clemente Dam Removal
Project 10 Table 4-1. Slope and Water Depth Required to Entrain Particles of Different Sizes 29
P:\Projects\1908_SanClementeDam\Report\1908_SanClementeDamRpt-Dec2007-OutV2.doc 12/13/07 iv
Table 5-1. Herbaceous Vegetation Species to be Seeded on Site 46 Table 5-2. Optional Planting Plan 47 Table 6-1. Cross Section Descriptions for the Five Cross Sections Constituting each Step Pool in the
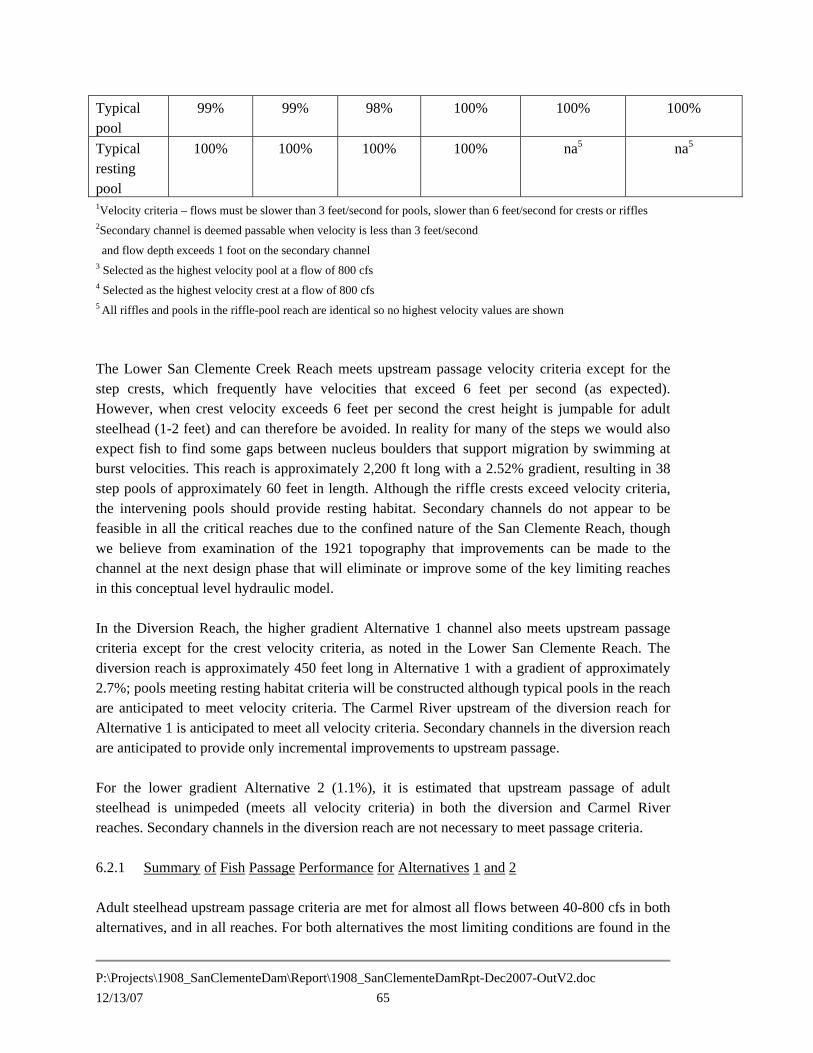
San Clemente Creek Reach 61 Table 6-2. Peak Flow Values Used in Steady-state HEC-RAS Modeling 63 Table 6-3. Average Percentage of Time Fish Passage Criteria are Met During Potential Migration
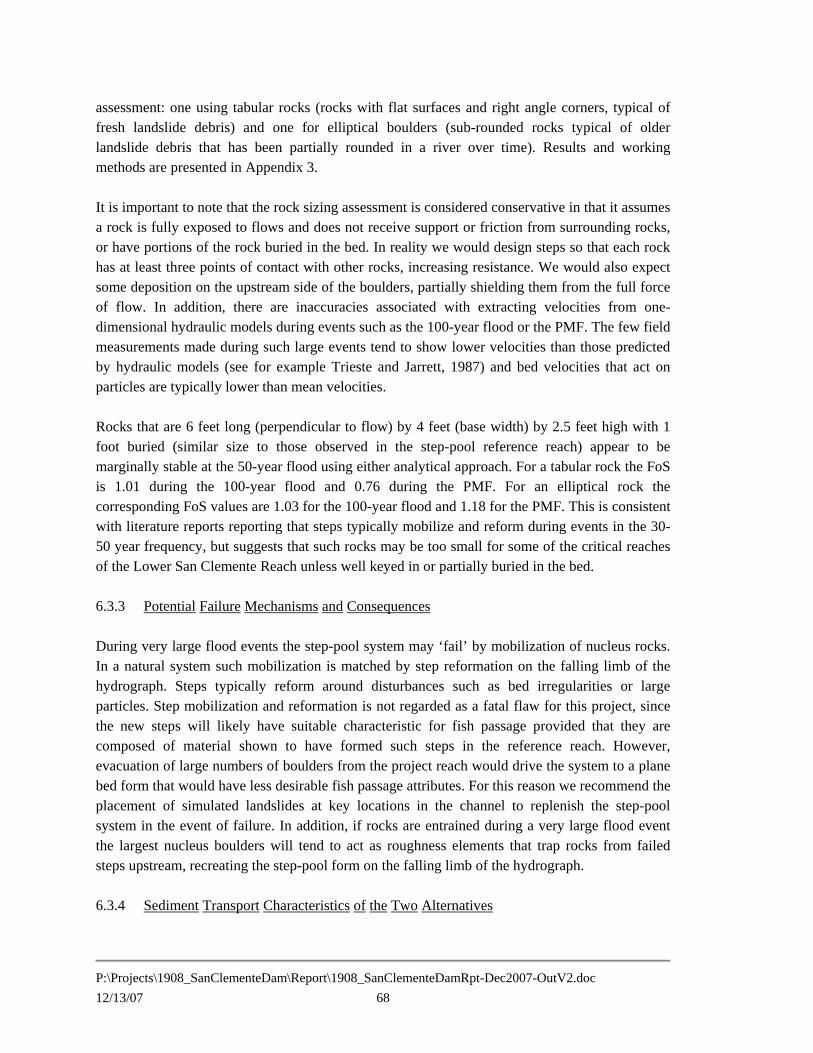
Events, 2000-2007 64 Table 6-3. Estimated Sediment Volume and Time Required to Reach Equilibrium 67 Table 6-4. Comparison of Anticipated Project Performance for the Alternatives 73 LIST OF FIGURES Figure 1-1. Project Location Map 4 Figure 1-2. Reach Labels for the Carmel River and San Clemente Creek 5 Figure 1-3. Project Elements of the Reroute and Removal Alternative 6 Figure 1-4. Long Profile Showing Existing and the MEI/MWH Proposed Diversion 7 Figure 3-1. Cumulative Adult Steelhead Daily Run Timing, San Clemente Dam, November 1999-April
2007 18 Figure 3-2. Monthly Adult Steelhead Runs and Daily Discharge by Year, San Clemente Dam 19 Figure 3-3. Mean Daily Number of Adult Steelhead by Discharge Class, San Clemente Dam 20 Figure 3-4. Peak Flow Frequencies During the Months of January Through June, 2000-2007 21 Figure 3-5. Total Monthly Fish Counts at San Clemente and Los Padres Dams, November 1999 – May
2006 22 Figure 4-1. DTM-Derived Profile of the Carmel River Through San Clemente Dam 30 Figure 4-2. Step-pool Reference Reach at River Mile 23.6 31 Figure 4-3. Plane Bed Reference Reach at Approximately River Mile 23 32 Figure 4-4. Riffle-Pool Reference Reaches on the Carmel River Upstream of San Clemente Dam 33 Figure 4-5. Channel Profile of Reference Reach Step-Pool in Carmel River 34 Figure 4-6. Location of Boreholes and Test Pits 35 Figure 4-7. Log for Test Pit 12 36 Figure 4-8. Log for Test Pit 11 37 Figure 4-9. Log for Test Pit 3 38 Figure 4-10. Log for Test Pit 2 39 Figure 5-1. Alternative 1 Planform 52 Figure 5-2. Alternative 2 Planform 53 Figure 5-3. Long Profile Showing Existing and Proposed Conditions 54 Figure 5-4. Step Pool Detail 55 Figure 5-5. Riffle-Pool Detail 56 Figure 5-6. Lower San Clemente Reach Restored Habitat 57 Figure 5-7. Diversion Reach Restored Habitat 58 Figure 5-8. Upper Carmel Reach Restored Habitat 59
P:\Projects\1908_SanClementeDam\Report\1908_SanClementeDamRpt-Dec2007-OutV2.doc 12/13/07 v
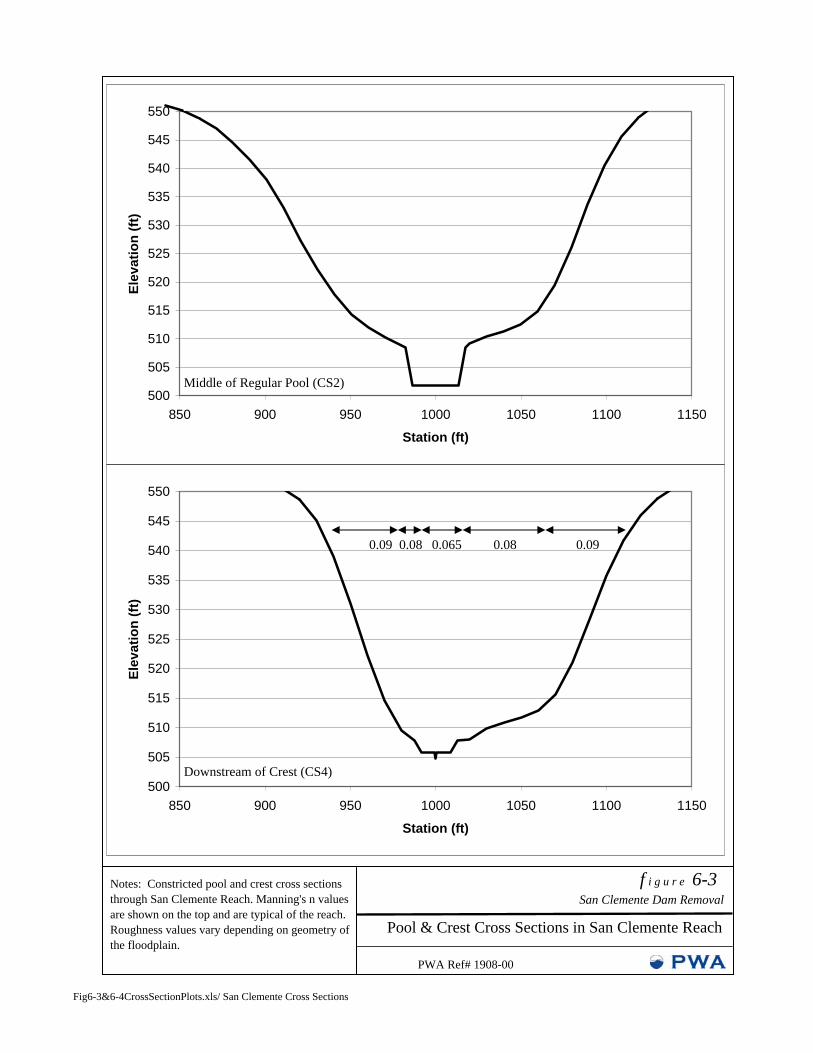
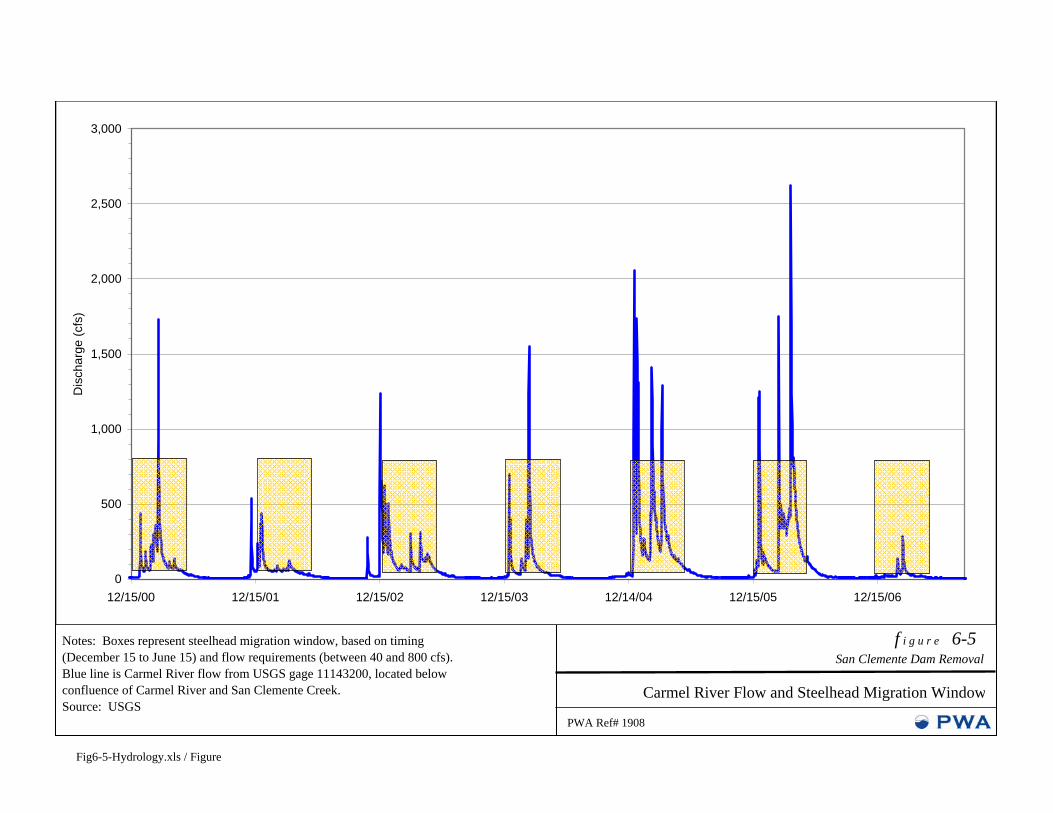
Figure 6-1. Typical Step-Pool Plan for 2.5% and 2.7% Reaches 74 Figure 6-2. Typical Step-Pool Profile for 2.5% and 2.7% Reaches 75 Figure 6-3. Pool and Crest Cross Sections in San Clemente Reach 76 Figure 6-4. Pool and Crest Cross Sections in Alt1 Diversion Reach 77 Figure 6-5. Carmel River Flow and Steelhead Migration Window 78 Figure 6-6. Volume of Sediment Required to Reach Equilibrium Gradient 79
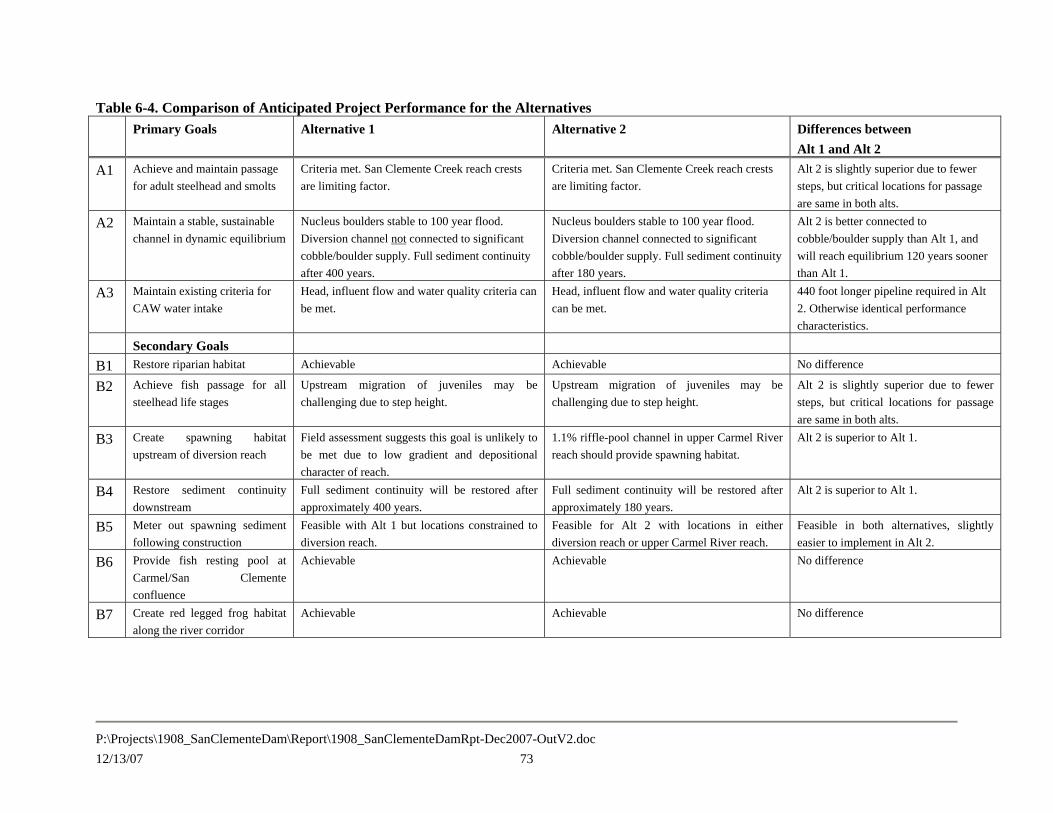
1.1 SCOPE OF REPORT Major modifications are required to the San Clemente Dam as a result of seismic and flood safety issues. A group of agencies and stakeholders organized by the California Coastal Conservancy seeks to remove the San Clemente Dam and restore a naturally-functioning river channel around the reservoir, with a particular focus on restoring migration conditions for steelhead trout (Oncorhynchus mykiss) and developing a channel that is geomorphically self-sustaining. The group is collaborating with the dam owners, California American Water Company (CAW), to develop an economically feasible project alternative to accomplish these goals. Montgomery Watson Harza (MWH) previously developed a conceptual alternative for this project (MWH, 2005) that was evaluated for hydraulic and sediment transport function by Mussetter Engineering, Inc. (MEI, 2005). This plan was subsequently analyzed as one of the alternatives in a Draft EIR/EIS of dam safety options (ENTRIX, 2006). In 2007 the Conservancy prepared a scope of work and selected a consultant team consisting of Philip Williams & Associates (PWA) and H.T. Harvey & Associates (HTH) to assess the relocation alternative for geomorphic stability and fish migration performance, and to refine a series of alternatives to improve fish passage and geomorphic performance. The PWA team was also scoped to develop revised cost estimates for the channel restoration elements. The Conservancy selected Interfluve to provide additional technical assistance and guidance. 1.2 PROJECT SETTING AND CONTEXT The Carmel River drains a 255 square mile watershed in the Coastal Range to the Pacific Ocean at Carmel in Monterey County, California. A more detailed description of the watershed is contained in MEI, 2002a and a brief summary only is included here. The watershed is underlain by resistant crystalline igneous and metamorphic rocks (dominated near the project site by granite) overlain in places by weak, surficial Tertiary sedimentary rocks. Recent and ongoing uplift has produced steep, rugged terrain with high rates of erosion by episodic mass wasting and more frequent gully and surface erosion. This is exacerbated by the Mediterranean climate (summer drought combined with highly variable winter rainfall patterns) and associated propensity for fires and erosion. In 1921 the San Clemente Dam was constructed at River Mile 18.6 (from the mouth) to supply drinking water to downstream users (Figure 1-1). The watershed area upstream of the dam is 125 square miles (110 square miles above the confluence with San Clemente Creek). The dam is a 106-foot high concrete arch structure and, despite the construction of a fish ladder, poses a considerable barrier to the migration of adult and juvenile steelhead trout that spawn and rear in
the Carmel River and its tributaries. The San Clemente Dam blocks the Carmel River immediately downstream of its confluence with San Clemente Creek, a steep channel with a 16-square mile watershed. Following construction the dam rapidly filled with sediment (a mixture of sand and gravel) and has lost 90% of its original 1,425 acre-foot capacity (Kleinfelder, 2002). In 1992 a study by the California Department of Water Resources (CDWR), Division of Safety of Dams, found that the dam does not meet minimum stability requirements during the predicted Maximum Credible Earthquake (MCE), and that in addition the Probable Maximum Flood (PMF) would overtop the dam and potentially cause scour of the foundations. CDWR required the dam owner and operator CAW to either buttress, lower or remove the dam to meet the stability criteria for MCE and PMF events. Several alternatives were evaluated including full dam removal and progressive notching to allow the stored sediment to be transported downstream, and mechanically removing the stored sediment and retaining it in a nearby upland storage site. A sediment transport study by MEI (2002b) found that releasing the majority of the historically-stored sediment downstream following dam removal posed an unacceptably high risk of channel aggradation, loss of flow conveyance and subsequent flooding. The cost of the sediment removal alternative was considered uneconomical. Attention has shifted to the “Carmel River Reroute and Dam Removal Alternative” (Reroute Alternative), which is the focus of this report. Key features of the Reroute Alternative are shown in Figures 1-2 and 1-3. The approach taken by the Reroute Alternative is to excavate a notch through the low rock divide separating the Carmel River from San Clemente Creek and reroute the Carmel River through a newly created Diversion Reach into the pre-dam San Clemente Creek. The San Clemente Creek valley will be excavated down to its pre-dam morphology and the accumulated dam sediment relocated into the Lower Carmel River Reach. The combined Carmel River and San Clemente Creek will bypass most of the sediment trapped by the dam, rejoining the pre-dam Carmel River at the former confluence. Sediment in the Lower Carmel River Reach will be regraded and stabilized in place. The Lower Carmel River Reach (Lower Carmel Reach) is approximately 2,900 feet long and runs from the San Clemente Dam upstream to the upstream entrance of the proposed Diversion Reach. It is completely within the backwater area of the reservoir, and the former river valley is buried beneath between 80 and 50 feet of sediment. Prior to sedimentation from the dam, this reach had a valley gradient of 1.1%. Upstream of the proposed Diversion Reach the Upper Carmel River Reach (Upper Carmel Reach) continues in the reservoir backwater for approximately 2,900 feet before intersecting the pre-dam channel and natural channel. The Upper Carmel Reach was formerly around 200 feet wide at the valley floor, and as it has filled with sediment is has widened to around 300 feet. The Upper and Lower Carmel Reaches are currently occupied by low gradient sand dominated channels in the backwater area of the dam, transitioning to a natural channel with an average gradient of around 1-2% upstream. The Lower San Clemente Creek Reach runs from the dam to the downstream end of the proposed Diversion Reach. The Lower
San Clemente Reach is more confined than the Carmel Reaches, having been formed by a much smaller and steeper creek with approximately a tenth of the watershed area of the Carmel River. The Lower San Clemente Reach valley floor has a gradient of approximately 2.5% buried beneath between 12 and 36 feet of sediment. Based on historic maps the buried valley floor varies from around 30 to 70 feet wide. MWH and MEI developed a conceptual plan for a bypass channel (MWH, 2005, MEI, 2005) hereafter know as the MWH/MEI plan. The historic Lower San Clemente Creek Reach has a gradient of 2.52% following excavation, based on the 1921 topography. The bedrock diversion channel through the ridge was initially planned with a gradient of approximately 2.7% so as to connect the thalweg of the former San Clemente Creek channel with the thalweg of the Carmel River over the shortest possible distance. While their plan provided an initial conceptual approach for the Reroute Alternative, stakeholders identified a need to further confirm the viability of the design in terms of fish passage and geomorphic stability. In addition, stakeholders requested additional alternatives that would further restore sediment continuity between the upper and lower watersheds as a result of the project. As a result, the current effort was initiated. The current study represents a refinement of the Reroute Alternative, which forms the basis of Alternative 1 in this report. A second alternative has been developed in response to stakeholder requests. A project team including the Coastal Conservancy, a Technical Review Team and the consultant team has developed a focused series of project goals and objectives. We have conducted geomorphic and biological investigations of the site and have used existing data to refine the plan so that it better meets those objectives. These studies focused primarily on two closely related issues: the ability of the proposed channel reaches to sustain passage for migrating steelhead trout and the long-term geomorphic stability of the channel. These issues were addressed by analyzing existing fish migration behavior in the Carmel River, and by looking at how reaches of the river that are at similar gradients to those required by project constraints function geomorphically. Supporting both components of the analysis was a detailed one-dimensional hydraulic model of two proposed alternatives. The model was used to analyze flow conditions during likely periods of fish migration, and to predict the geomorphic stability of the channel. We also conducted an assessment of the long-term geomorphic evolution of the channel, since the sustainability of the system is a key criteria.
2.1 TECHNICAL REVIEW TEAM The Conservancy and consultant team assembled a Technical Review Team (TRT) to provide advice on the project. The TRT met at a kickoff meeting on September 28th 2007 to agree upon a series of goals and objectives for the project, to develop performance standards for fish migration, and to identify potential project alternatives. A second meeting was held on October 25th 2007 to discuss a possible third alternative and to review progress. The TRT meeting participants were: Joyce Ambrosius (NOAA Fisheries), Mike Burke (Interfluve), Trish Chapman (Coastal Conservancy), Brian Cluer (NOAA Fisheries), Andy Collison (PWA), Frank Emerson (Carmel River Steelhead Association), Laura Engeman (Coastal Conservancy), Blair Greimann (US Bureau of Reclamation), Jeff Haltiner (PWA), Larry Hampson (Monterey Peninsula Water Management District (MPWMD)), Monica Hunter (Planning and Conservation League), John Klein (CAW), Matt Kondolf (U.C. Berkeley), Sharon Kramer (HTH), Paula Landis (CDWR), Kevan Urquhart (MPWMD), and Marcin Whitman (California Dept. of Fish & Game). 2.2 PROJECT GOALS While recognizing the large number of desirable goals for the project, three goals emerged from the kickoff meeting as primary foci, with a series of secondary goals that are desirable but that should only be pursued if they do not conflict with the primary goals. The alternatives considered in this study were evaluated against these goals, objectives and performance criteria. 2.2.1 Primary Goals
1. To achieve and maintain fish passage in a sustainable manner, with an emphasis on upstream migration of adult steelhead and downstream migration of smolts. While easing passage of juveniles through the project reaches to optimize summer rearing opportunities is a desirable secondary goal (see below), it should not lead to actions that undermine the primary goals (e.g. if maintaining stability of the channel morphology requires rocks that are larger than those that produce small steps optimal for juvenile migration, the stability goal outweighs the juvenile migration goal).
2. Design and construct the restored reaches in such a way that they are in dynamic
equilibrium with the surrounding rivers and watershed, and that they maintain geomorphic stability so that maintenance and repair is not needed following construction. Specifically, design reaches so that they can be naturally resupplied with coarse bedload of the size needed to maintain the bed and channel structure. The
approach should minimize geomorphic risk. We recognize that full sediment continuity will not be achieved for many decades after project implementation, and that before this occurs there is a risk that channel features will have to be repaired rather than naturally restabilized from upstream sediment.
3. Design the relocated CAW water intake so that existing head, influent flow, and water
quality criteria are met. 2.2.2 Secondary Goals
1. Restore riparian habitat so that wildlife connectivity is maximized, to provide shade for the restored river reaches, and to provide large woody debris and organic inputs to the system.
2. Achieve fish passage for all steelhead life stages to the greatest extent possible.
3. Create spawning habitat in appropriate restored reaches (e.g. Carmel River upstream of diversion reach).
4. Restore sediment continuity downstream so that spawning size gravel is transported to the Carmel River downstream of the dam, and so that channel incision is reduced.
5. Design the project so that some spawning gravels exposed during excavation of the San Clemente Creek branch are temporarily stored alongside the channel and gradually ‘metered out’ into the Carmel River to replenish spawning sites downstream without increasing flood risk.
6. Provide a fish resting pool at the confluence of the Carmel River and San Clemente Creek confluence so that spawning steelhead have time to make a decision (to encourage fish to return to their natal streams, including San Clemente Creek).
7. Create red legged frog habitat along the river corridor where geomorphically and biologically appropriate, and avoid creating bull frog habitat.
2.3 FISH PASSAGE OBJECTIVES AND PERFORMANCE CRITERIA Fish passage objectives and performance criteria were developed by HTH to provide an objective method of assessing the performance of potential project alternatives. 2.3.1 Hydraulic Criteria for Fish Passage The channel reaches should conform to the standards synthesized from the literature (see Table 2-1) with the qualifiers from the TRT described below.
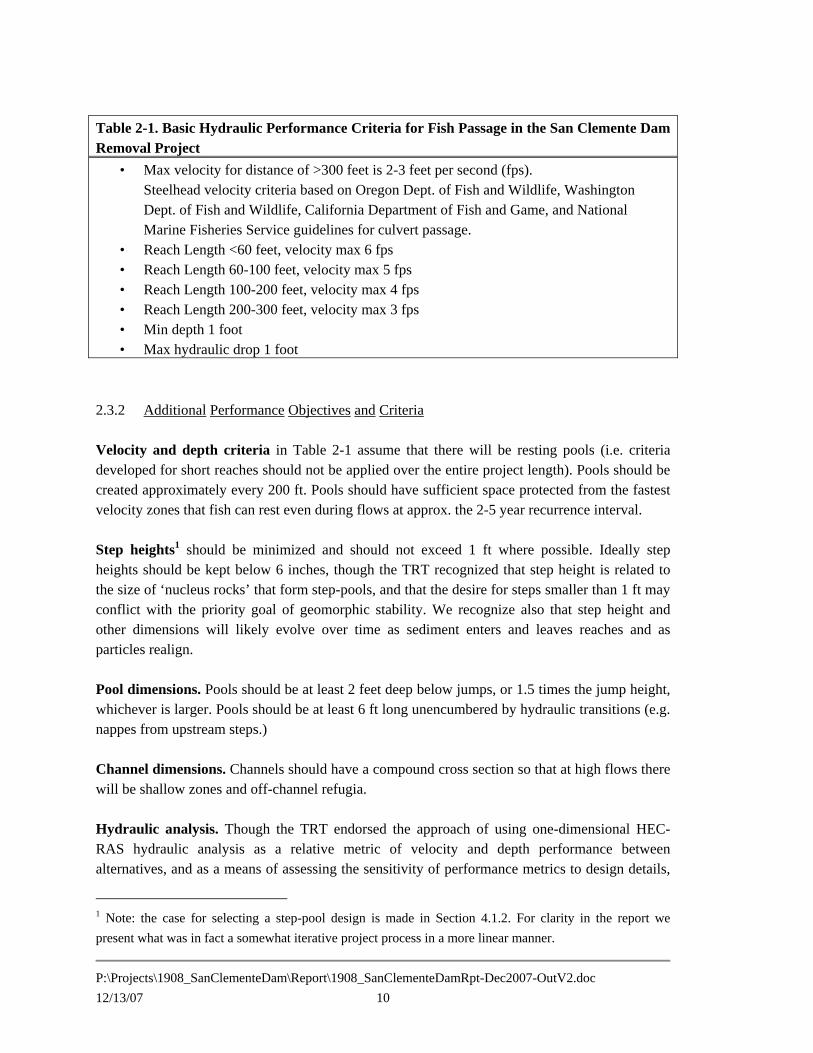
Table 2-1. Basic Hydraulic Performance Criteria for Fish Passage in the San Clemente Dam Removal Project
• Max velocity for distance of >300 feet is 2-3 feet per second (fps). Steelhead velocity criteria based on Oregon Dept. of Fish and Wildlife, Washington Dept. of Fish and Wildlife, California Department of Fish and Game, and National Marine Fisheries Service guidelines for culvert passage.
• Reach Length <60 feet, velocity max 6 fps • Reach Length 60-100 feet, velocity max 5 fps • Reach Length 100-200 feet, velocity max 4 fps • Reach Length 200-300 feet, velocity max 3 fps • Min depth 1 foot • Max hydraulic drop 1 foot
2.3.2 Additional Performance Objectives and Criteria Velocity and depth criteria in Table 2-1 assume that there will be resting pools (i.e. criteria developed for short reaches should not be applied over the entire project length). Pools should be created approximately every 200 ft. Pools should have sufficient space protected from the fastest velocity zones that fish can rest even during flows at approx. the 2-5 year recurrence interval. Step heights1 should be minimized and should not exceed 1 ft where possible. Ideally step heights should be kept below 6 inches, though the TRT recognized that step height is related to the size of ‘nucleus rocks’ that form step-pools, and that the desire for steps smaller than 1 ft may conflict with the priority goal of geomorphic stability. We recognize also that step height and other dimensions will likely evolve over time as sediment enters and leaves reaches and as particles realign. Pool dimensions. Pools should be at least 2 feet deep below jumps, or 1.5 times the jump height, whichever is larger. Pools should be at least 6 ft long unencumbered by hydraulic transitions (e.g. nappes from upstream steps.) Channel dimensions. Channels should have a compound cross section so that at high flows there will be shallow zones and off-channel refugia. Hydraulic analysis. Though the TRT endorsed the approach of using one-dimensional HEC-RAS hydraulic analysis as a relative metric of velocity and depth performance between alternatives, and as a means of assessing the sensitivity of performance metrics to design details,
1 Note: the case for selecting a step-pool design is made in Section 4.1.2. For clarity in the report we present what was in fact a somewhat iterative project process in a more linear manner.
the TRT, client and consultant teams recognize that step-pool hydraulics is a three-dimensional problem and we should avoid over-inferring conclusions from the one-dimensional HEC-RAS hydraulic analysis. The analysis should overlay quantitative data on qualitative understanding of the system to synthesize a final conclusion about the proposed alternative. 2.3.3 Fish Migration Timing Criteria The hydraulic analysis should focus on likely times of fish migration. The majority of adult steelhead upstream migration occurs from January through Mid-April, although migration can occur from November through June, and smolt outmigration occurs primarily from February through May (ENTRIX, 2006). A more detailed analysis of adult steelhead upstream migration is included in Chapter 3. 2.4 GEOMORPHIC OBJECTIVES AND PERFORMANCE CRITERIA 2.4.1 Geomorphic Objectives The project should construct a channel that is geomorphically-appropriate to the setting, and that minimizes the risk of a failure occurring that is not self-repairing2. There are two potential failure mechanisms if boulders and cobbles used to construct a step-pool system are transported out of the project reach before replacement boulders can be delivered from upstream. Loss of the nucleus boulders effectively converts the step-pool reach into a plane bed reach. Loss of smaller ‘plugging’ particles (small boulders and cobbles) increases the porosity of step-pools, reducing their ability to retain deep pools and compromising their function for fish passage and resting. This risk can be reduced if the project is constructed so that the diversion reach connects directly to a source of large cobbles and boulders at a gradient that permits relatively frequent delivery (e.g. by the 2-5 year flood). If the project does not connect to a cobble/boulder source the material comprising the step-pools should be of a size that it will not be transported until aggradation of the Carmel reach upstream of the diversion channel creates a channel of sufficient gradient to reestablish sediment supply. It is important to note that the Reroute Alternative will not restore sediment transport to pre-dam levels for a considerable period of time. The dam created a backwater area that extends for approximately 1 mile upstream. The backwater area has trapped sediment to create an almost flat delta over the original channel. The diversion channel alternative proposed in the EIR (and in Alternative 1 of this report) has its upstream end in this flat area approximately 2,900 feet downstream of where the natural river profile is found. Upstream of this hinge point the channel steepens to its original gradient and delivers sediment naturally, but from the backwater limit to the diversion channel most coarse sediment (cobble and boulder size material) will continue to be
2 See Footnote 1. The decision to adopt a step-pool system was made at the same time as geomorphic objectives were developed. This approach is justified in Section 4.1.2.
trapped and will not be transported to the diversion reach for a considerable period of time (decades to hundreds of years). Eventually deposition of coarse sediment will build up and steepen the channel around the hinge point until it reaches equilibrium grade, at which point natural sediment delivery will be restored to the diversion reach and downstream. The further up the backwater area project alternatives are extended, the sooner equilibrium and natural sediment transport will be achieved. 2.4.2 Geomorphic Performance Criteria Based on these objectives the geomorphic performance criteria are as follows:
1. Nucleus boulders used in step-pool construction should be sized to remain in place for as long as feasible without producing step sizes that endanger fish passage
2. In at least one project alternative the diversion reach should access a reasonably large supply of 6-24 inch cobbles and boulders that can be mobilized by flows in the 2-5 year recurrence interval
2.5 CAW WATER INTAKE OBJECTIVES AND PERFORMANCE CRITERIA
CAW has an existing water right, part of which is currently exercised through a diversion at the San Clemente dam. This will be continue to be met using a Ranney collector (a system of steel infiltration pipes under and adjacent to the Carmel River channel upstream of the diversion reach, connected to a well and then to a 30 inch pipeline). The system must have a capacity of 16 cubic feet per second (cfs) and an intake elevation of 525 feet, in order to provide sufficient head to drive water through the filters and clearwell into the distribution system. 2.6 RIPARIAN OBJECTIVES AND PERFORMANCE CRITERIA 2.6.1 Riparian Habitat Restoration Objectives The primary objective for the riparian habitat restoration is to create self-sustaining riparian habitat dominated by native species that provide food, shelter and shade functions for salmonids, as well as other aquatic and terrestrial organisms. This will be accomplished by creating hydrogeomorphic conditions that support riparian habitat. With creation of soil and hydrologic conditions that support riparian habitat, restoration will rely on natural recruitment from surrounding source populations as the primary means of establishing and maintaining riparian habitat. Natural recruitment processes will be supplemented (jump-started) by selective active planting of riparian tree species. These new riparian communities will develop into important components of salmonid habitat. The riparian forest will also help to stabilize the channel and eventually contribute woody debris to the system.
Upland habitat should be created in areas above the 10-year floodplain in order to stabilize the soil. The upland areas will be seeded to provide immediate cover to prevent erosion, and over time upland woody species will naturally establish. Although the project’s primary focus is salmonid habitat, it should also strive to create appropriate habitat to sustain red-legged frogs. The project should establish off-channel ponds adjacent to the Carmel River Reach and step-pools within the Diversion Reach and San Clemente Creek Reaches appropriate for California red-legged frog. The pools should be deep enough to provide refuge habitat for red-legged frogs and wetland vegetation should naturally establish along the edges. The off-channel ponds along the Carmel River are expected to be temporary in nature due to the predicted sediment deposition and channel migration. Over time the channel will likely naturally migrate, depositing sediment within these pools and scouring out other pools elsewhere that will support red-legged frogs. 2.6.2 Riparian Habitat Performance Criteria The following performance criteria will be used to indicate if riparian restoration objectives are being met.
1. As the restored riparian vegetation communities develop over time they will show a trend toward developing species composition, structure, and percent vegetative cover similar to the undisturbed reaches up and downstream from the project.
2. Upland habitats should develop sufficiently to stabilize and allow for the eventual recruitment of native woody species.
3. Red-legged frog habitat should be created by establishing instream pools and off-channel ponds that maintain 20 inches of ponding through July in an average year. Wetland vegetation should naturally establish along the edges of the pools in the Diversion and San Clemente Creek Reaches. Natural river migration and disturbance processes will destroy and regenerate habitat resulting in an approximately stable quantity and quality of habitat over time.
Chapter 3 lays out the biological basis of design for the project. Biological considerations were focused on determining characteristics of discharge during periods when adult steelhead are moving upstream, based on existing discharge and adult steelhead daily count information from San Clemente and Los Padres dams, and evaluating the potential to revegetate the restored reaches. The alternatives are then assessed relative to the project goals and performance criteria in Chapter 6. 3.1 ASSESSMENT OF EXISTING FISH PASSAGE DATA AND IDENTIFICATION OF
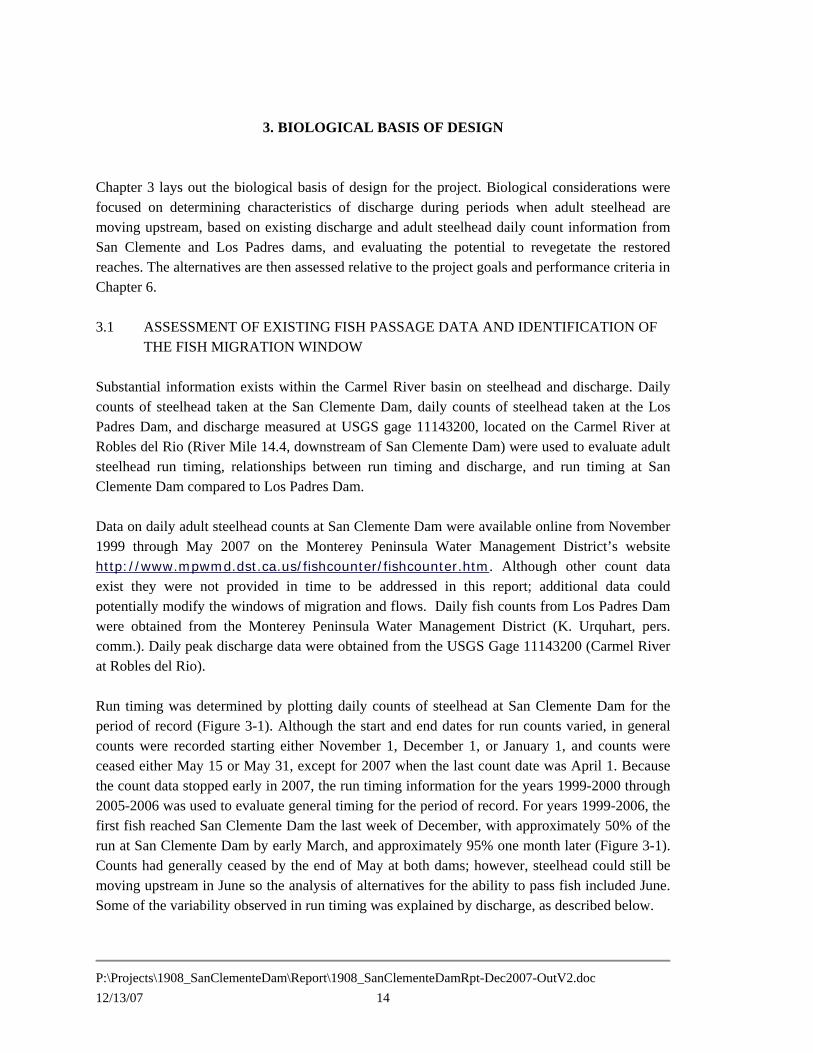
THE FISH MIGRATION WINDOW Substantial information exists within the Carmel River basin on steelhead and discharge. Daily counts of steelhead taken at the San Clemente Dam, daily counts of steelhead taken at the Los Padres Dam, and discharge measured at USGS gage 11143200, located on the Carmel River at Robles del Rio (River Mile 14.4, downstream of San Clemente Dam) were used to evaluate adult steelhead run timing, relationships between run timing and discharge, and run timing at San Clemente Dam compared to Los Padres Dam. Data on daily adult steelhead counts at San Clemente Dam were available online from November 1999 through May 2007 on the Monterey Peninsula Water Management District’s website http://www.mpwmd.dst.ca.us/fishcounter/fishcounter.htm. Although other count data exist they were not provided in time to be addressed in this report; additional data could potentially modify the windows of migration and flows. Daily fish counts from Los Padres Dam were obtained from the Monterey Peninsula Water Management District (K. Urquhart, pers. comm.). Daily peak discharge data were obtained from the USGS Gage 11143200 (Carmel River at Robles del Rio). Run timing was determined by plotting daily counts of steelhead at San Clemente Dam for the period of record (Figure 3-1). Although the start and end dates for run counts varied, in general counts were recorded starting either November 1, December 1, or January 1, and counts were ceased either May 15 or May 31, except for 2007 when the last count date was April 1. Because the count data stopped early in 2007, the run timing information for the years 1999-2000 through 2005-2006 was used to evaluate general timing for the period of record. For years 1999-2006, the first fish reached San Clemente Dam the last week of December, with approximately 50% of the run at San Clemente Dam by early March, and approximately 95% one month later (Figure 3-1). Counts had generally ceased by the end of May at both dams; however, steelhead could still be moving upstream in June so the analysis of alternatives for the ability to pass fish included June. Some of the variability observed in run timing was explained by discharge, as described below.
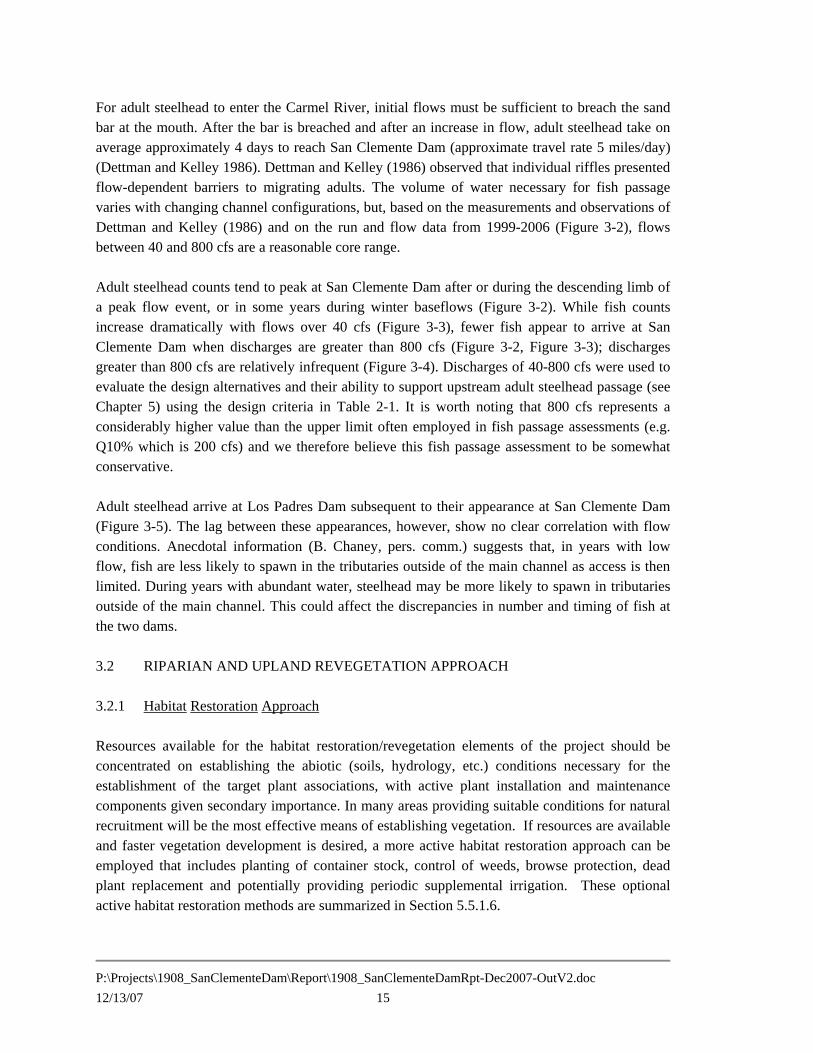
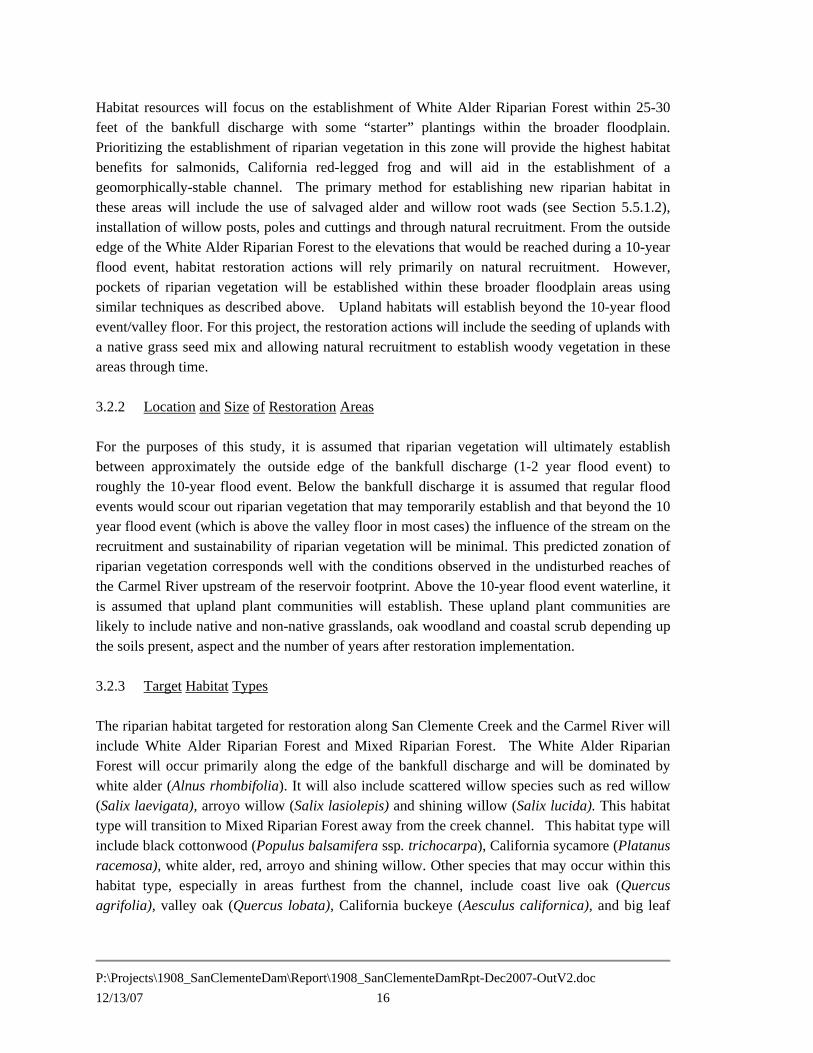
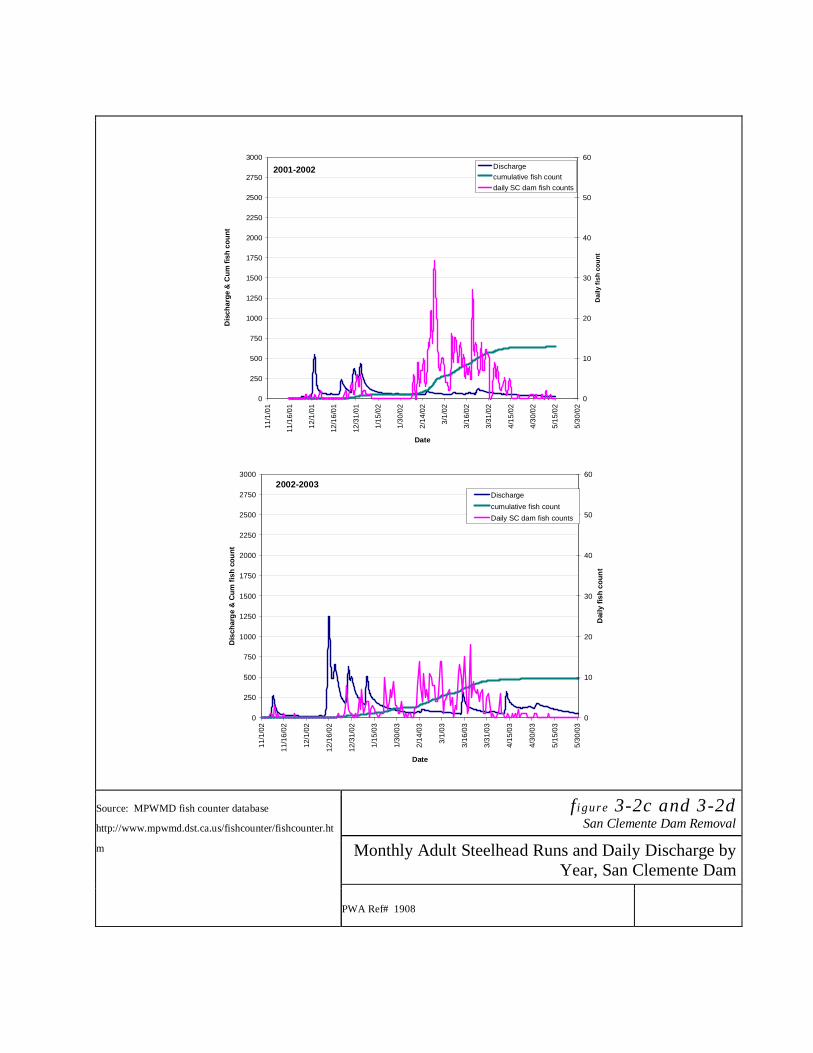
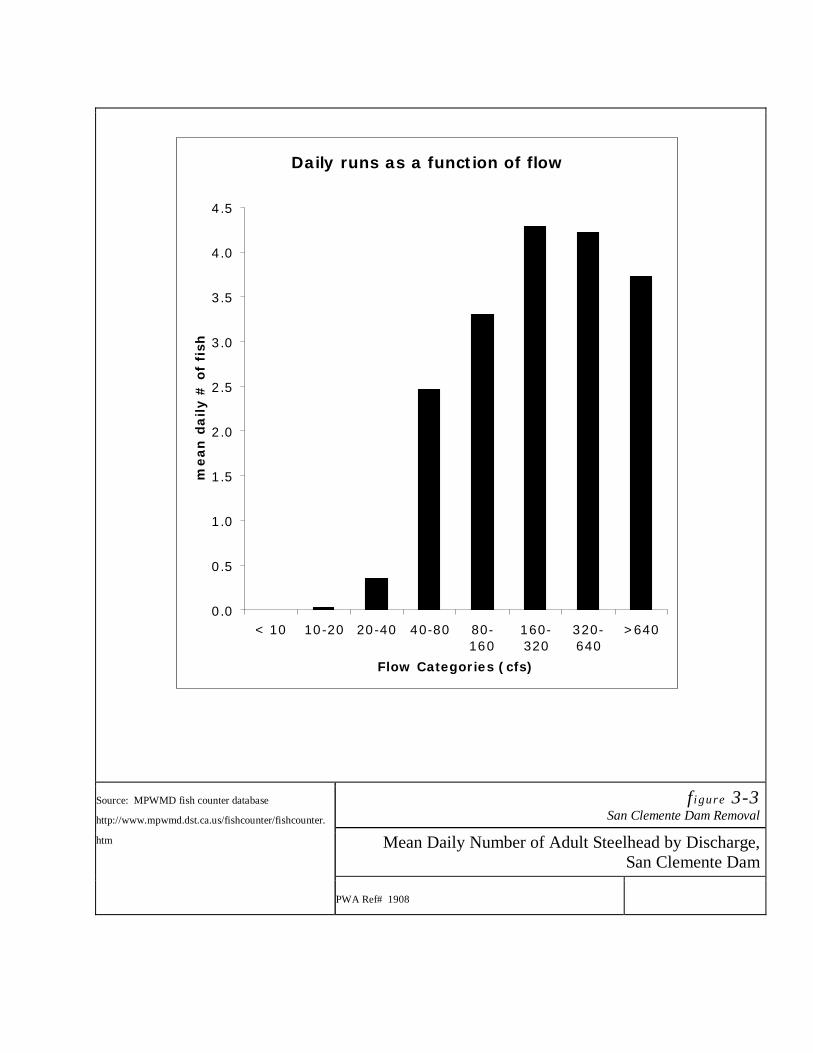
For adult steelhead to enter the Carmel River, initial flows must be sufficient to breach the sand bar at the mouth. After the bar is breached and after an increase in flow, adult steelhead take on average approximately 4 days to reach San Clemente Dam (approximate travel rate 5 miles/day) (Dettman and Kelley 1986). Dettman and Kelley (1986) observed that individual riffles presented flow-dependent barriers to migrating adults. The volume of water necessary for fish passage varies with changing channel configurations, but, based on the measurements and observations of Dettman and Kelley (1986) and on the run and flow data from 1999-2006 (Figure 3-2), flows between 40 and 800 cfs are a reasonable core range. Adult steelhead counts tend to peak at San Clemente Dam after or during the descending limb of a peak flow event, or in some years during winter baseflows (Figure 3-2). While fish counts increase dramatically with flows over 40 cfs (Figure 3-3), fewer fish appear to arrive at San Clemente Dam when discharges are greater than 800 cfs (Figure 3-2, Figure 3-3); discharges greater than 800 cfs are relatively infrequent (Figure 3-4). Discharges of 40-800 cfs were used to evaluate the design alternatives and their ability to support upstream adult steelhead passage (see Chapter 5) using the design criteria in Table 2-1. It is worth noting that 800 cfs represents a considerably higher value than the upper limit often employed in fish passage assessments (e.g. Q10% which is 200 cfs) and we therefore believe this fish passage assessment to be somewhat conservative. Adult steelhead arrive at Los Padres Dam subsequent to their appearance at San Clemente Dam (Figure 3-5). The lag between these appearances, however, show no clear correlation with flow conditions. Anecdotal information (B. Chaney, pers. comm.) suggests that, in years with low flow, fish are less likely to spawn in the tributaries outside of the main channel as access is then limited. During years with abundant water, steelhead may be more likely to spawn in tributaries outside of the main channel. This could affect the discrepancies in number and timing of fish at the two dams. 3.2 RIPARIAN AND UPLAND REVEGETATION APPROACH 3.2.1 Habitat Restoration Approach Resources available for the habitat restoration/revegetation elements of the project should be concentrated on establishing the abiotic (soils, hydrology, etc.) conditions necessary for the establishment of the target plant associations, with active plant installation and maintenance components given secondary importance. In many areas providing suitable conditions for natural recruitment will be the most effective means of establishing vegetation. If resources are available and faster vegetation development is desired, a more active habitat restoration approach can be employed that includes planting of container stock, control of weeds, browse protection, dead plant replacement and potentially providing periodic supplemental irrigation. These optional active habitat restoration methods are summarized in Section 5.5.1.6.
Habitat resources will focus on the establishment of White Alder Riparian Forest within 25-30 feet of the bankfull discharge with some “starter” plantings within the broader floodplain. Prioritizing the establishment of riparian vegetation in this zone will provide the highest habitat benefits for salmonids, California red-legged frog and will aid in the establishment of a geomorphically-stable channel. The primary method for establishing new riparian habitat in these areas will include the use of salvaged alder and willow root wads (see Section 5.5.1.2), installation of willow posts, poles and cuttings and through natural recruitment. From the outside edge of the White Alder Riparian Forest to the elevations that would be reached during a 10-year flood event, habitat restoration actions will rely primarily on natural recruitment. However, pockets of riparian vegetation will be established within these broader floodplain areas using similar techniques as described above. Upland habitats will establish beyond the 10-year flood event/valley floor. For this project, the restoration actions will include the seeding of uplands with a native grass seed mix and allowing natural recruitment to establish woody vegetation in these areas through time. 3.2.2 Location and Size of Restoration Areas For the purposes of this study, it is assumed that riparian vegetation will ultimately establish between approximately the outside edge of the bankfull discharge (1-2 year flood event) to roughly the 10-year flood event. Below the bankfull discharge it is assumed that regular flood events would scour out riparian vegetation that may temporarily establish and that beyond the 10 year flood event (which is above the valley floor in most cases) the influence of the stream on the recruitment and sustainability of riparian vegetation will be minimal. This predicted zonation of riparian vegetation corresponds well with the conditions observed in the undisturbed reaches of the Carmel River upstream of the reservoir footprint. Above the 10-year flood event waterline, it is assumed that upland plant communities will establish. These upland plant communities are likely to include native and non-native grasslands, oak woodland and coastal scrub depending up the soils present, aspect and the number of years after restoration implementation. 3.2.3 Target Habitat Types The riparian habitat targeted for restoration along San Clemente Creek and the Carmel River will include White Alder Riparian Forest and Mixed Riparian Forest. The White Alder Riparian Forest will occur primarily along the edge of the bankfull discharge and will be dominated by white alder (Alnus rhombifolia). It will also include scattered willow species such as red willow (Salix laevigata), arroyo willow (Salix lasiolepis) and shining willow (Salix lucida). This habitat type will transition to Mixed Riparian Forest away from the creek channel. This habitat type will include black cottonwood (Populus balsamifera ssp. trichocarpa), California sycamore (Platanus racemosa), white alder, red, arroyo and shining willow. Other species that may occur within this habitat type, especially in areas furthest from the channel, include coast live oak (Quercus agrifolia), valley oak (Quercus lobata), California buckeye (Aesculus californica), and big leaf
maple (Acer macrophyllum). It is assumed that this assemblage of riparian plant communities and species will be common through each of the three restoration reaches. The upland plant communities will likely include native and non-native grasslands, oak woodland, and coast scrub. The specific upland plant communities that establish will depend upon the soils present, the site’s aspect and the number of years after restoration implementation. For the purposes of this report, the restoration actions will predominantly involve the seeding of a native grass seed mix primarily for erosion control purposes as described in section 3.2.4.6.
Carmel River Adult Steelhead Counts at San Clemente Dam
4. GEOMORPHIC BASIS OF DESIGN FOR PROJECT ALTERNATIVES
Chapter 4 lays out the basis of design for the different project alternatives. The alternatives are then assessed relative to the project goals and performance criteria in Chapter 6. Channel morphology is largely controlled by channel gradient, with flow regime, sediment inputs, valley confinement and the presence or absence of large woody debris exercising a significant secondary influence. When designing a channel the first step is usually to determine the equilibrium gradient and sediment regime, from which the corresponding channel type can be determined and channel and structural element dimensions then calculated (the so-called ‘slope first’ approach). Final channel dimensions are then tested and, if necessary refined, using a hydraulic simulation model. This is the approach taken in this project. 4.1 EQUILIBRIUM GRADIENT AND CHANNEL MORPHOLOGY 4.1.1 Selection of Equilibrium Gradient 4.1.1.1 Upper and Lower San Clemente Reach (All Alternatives) and the Diversion Reach
(Alternative 1) The channel gradients for Alternative 1 were fixed constraints for this project, based on the previous work carried out by MEI and MWH. The gradient of the Lower San Clemente Reach in both Alternative 1 and 2 (2.52%) is also fixed owing to the pre-dam gradient of the bedrock channel and the narrow nature of the canyon, unless significantly more rock excavation is contemplated. Thus, the Lower San Clemente Reach will be designed to 2.52% for all alternatives. The Upper San Clemente Reach above the diversion channel will be exhumed to the former valley floor (pre-dam gradient of 2.52%. This configuration should be stable since channel morphology, flow and sediment regime will all be in their pre-dam configurations. The Diversion Reach will be constructed to 2.7%. 4.1.1.2 Diversion Reach and Upper Carmel Reach (Alternative 2) The consultant team scope called for additional alternatives to be considered that are at equilibrium grade where possible, and to be connected to a location in the backwater sediment area where cobble and boulders can be supplied and entrained downstream to sustain the steeper reaches below. Equilibrium slope is the channel gradient at which, over a period of decades or longer, sediment inputs match sediment outputs so that erosion and deposition are balanced. To determine equilibrium grade for the Carmel River in the project reaches we examined the 1921 pre-dam USGS map and for wider context compared it with a long profile constructed from the USGS Digital Terrain Model. The long profile shows the classic concave profile with an average
gradient of 1.1% through the San Clemente Dam (Figure 4-1). This number is confirmed by the 1921 topographic data, and is in close agreement with the value of 1% for the channel between San Clemente Dam and Sleepy Hollow cited by MEI (MEI, 2002a). It is possible that sediment supply reductions from Los Padres Dam have caused a reduction in equilibrium grade from this value, which represents historic conditions, but there is no field evidence of extensive channel incision in the 3 miles upstream of the San Clemente Dam, which would indicate adjustment to a flatter channel from the diminished sediment regime. There appears to be sufficient coarse sediment reaching the river from adjacent landslides and from several large tributaries for the historic equilibrium slope to remain valid in the medium to long term. As a result we have selected 1.1% as a representative equilibrium grade for alluvial reaches of the Carmel River. We have selected this value for the Diversion and Upper Carmel River Reaches in Alternative 2, in keeping with the goal of developing a more geomorphically-stable channel. We should note that the sediment in the Upper Carmel Reach close to the Diversion Reach is somewhat finer than historic conditions due to sediment trapping in the reservoir delta area. As a result we expect the Upper Carmel Reach to adjust somewhat by channel incision, until it self armors by creating a coarser gravel layer. This process could be hastened by adding a coarse armor layer during construction. 4.1.2 Selection of Channel Type The alternatives call for reaches of 2.52% (San Clemente historic channel gradient), 2.7% (Alternative 1 Diversion Reach), and 1.1% (Carmel River equilibrium gradient). 4.1.2.1 Lower San Clemente Reach (Both Alternatives) and Diversion Reach (Alternative 1) Following the classification scheme of Montgomery-Buffington (Montgomery and Buffington, 1997) channels with gradients between approximately 3-10% tend towards a step-pool form, with channels between 1-3% having plane bed morphology and channels of less than 2% tending towards riffle-pool morphology. However, these distinctions vary with the inputs of water and sediment, and with valley confinement in a specific environment, and where appropriate reference reaches can be found in the watershed under discussion it is generally more appropriate to use these rather than applying a form based on a classification approach. By ‘appropriate’ we mean that the potential reference reaches should have similar flow regimes, available sediment size and load, and be in valley settings with similar degrees of confinement. We conducted a field reconnaissance to look for suitable reference conditions in the Carmel River in the three miles upstream of the San Clemente Dam, and found examples of all three channel types. We found step-pool, plane bed and riffle-pool morphologies in channels with a gradient of approximately 2.5% and with flows that should be within approximately 10% of those found in both the Diversion Reach and Lower San Clemente Reaches (see figures 4-2, 4-3 and 4-4). We conducted a basic thalweg survey of a typical step-pool sequence and a typical riffle-pool sequence to identify channel dimensions. The difference in channel morphology between the three reaches
appears to be a function of the size and spatial density of the largest particles, the so-called nucleus boulders, the average particle size, and the valley confinement. In the step-pool reference reach (located 3 miles upstream of San Clemente Dam) a large landslide has confined the valley while supplying numerous nucleus boulders in the 4-6 foot size range. These have been organized by flow to form a series of steps and pools. A partial control on the formation of a step-pool system in this location appears to be the tabular nature of these nucleus boulders, which permits them to interlock more effectively than rounded boulders. This in turn appears due to the jointing pattern of the source granite and their proximity to the landslide source. The plane bed reaches appear to have a supply of moderate sized boulders (2-4 feet) that are not as large, tabular or plentiful enough to lock together and form well organized steps, but that have broken up the channel into a series of boulder clusters that provide some fish shelter. The riffle-pool reaches appear to have formed where there is little supply of large boulders or cobble, and on wider, flatter reaches. Assuming appropriate sediment supply from either upstream or in-situ, a case could be made for constructing each of the three channel types in these reaches. However, it is important to appreciate that with the exception of the step-pool reach which has formed where a landslide is adjacent to the river, the proposed channel will be significantly more confined than the Carmel River references reaches (minimum valley floor of 30-40 feet in the Lower San Clemente Reach compared with 200 feet in much of the Carmel River valley). The confinement of the Lower San Clemente Reach poses a significant challenge in constructing plane-bed or riffle-pool reaches that will remain stable, especially where the channel will be constructed close to bedrock. High velocities during large flows will tend to entrain the more exposed and smaller particles found in riffle-pool and plane bed channels, scouring the channel down to bedrock. Although San Clemente Creek’s channel foundation was at some point naturally formed in bedrock (and subsequently partially backfilled with cobble and alluvium) it is important to remember that the diversion of the Carmel River will add flows to the channel that are an order of magnitude greater than those that formed it, making fish passage challenging. It is the opinion of the authors that a riffle-pool channel is not sustainable in the confined portions of the Lower San Clemente Reach. A plane bed channel is more sustainable than a riffle-pool channel, but as will be seen in the rock sizing exercise, exposed rocks of the size found in the Carmel River are relatively easily mobilized and a new source of material from upstream is required to sustain a plane bed. This material will not be readily resupplied until the Upper Carmel Reach achieves equilibrium. In terms of fish passage and rearing qualities, and geomorphic stability, the step-pool reaches appear to provide the most desirable characteristics by absorbing a lot of excess shear stress on the immovable boulders, lowering average velocities and providing many fish resting areas. Even if rocks are moved and steps ‘fail’, rocks in the 4-6 foot range are unlikely to be entrained
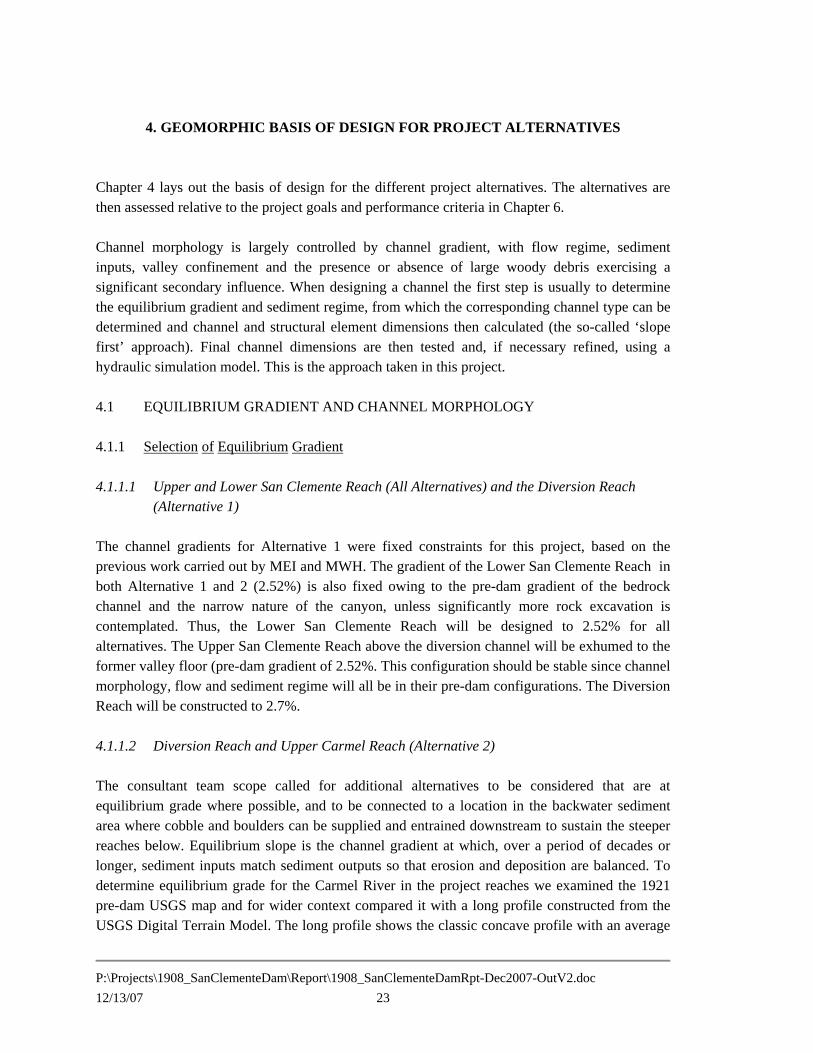
long distances and thus will likely reform steps downstream. Based on the field assessment and experience on other projects we recommend that the proposed 2.5 – 2.7% channel reaches be constructed as step-pool systems with large, tabular nucleus boulders similar in size to those found upstream. Although it is not our intent to create a plane bed channel, if the step-pools do fail in a large flow event and do not reform or are lost downstream, we might expect a plane bed form to replace them. HTH’s field assessment suggests that a plane bed condition would be less desirable than a step-pool system for upstream fish migration because for any given discharge the velocity would be higher, but that though undesirable this would not be a fatal flaw. The boulders required to form step-pool conditions will not be readily resupplied from upstream; such boulders are generally supplied by landslides close to the channel edge. For the project we propose that boulders are quarried during removal of the rock ridge, and that a supply of similar sized replacement boulders is stacked along the edge of the channel in the form of simulated landslides. These may require a matrix of smaller particles to facilitate mobilization during large flows. 4.1.2.2 Diversion Reach (Alternative 2) and Upper Carmel Reach (Alternative 2) In Alternative 2 the Diversion Reach is not constrained to the gradient developed in the MWH/MEI Plan, and is designed for the equilibrium gradient of 1.1%. Based on the field reconnaissance and literature, the appropriate channel type at this gradient and in a non-confined setting is a riffle-pool form. This form has the advantage of being sustainable at a 1.1% gradient given the current supply of sediment from upstream. 4.2 CHANNEL DIMENSIONS Having determined the gradient and channel form for the different reaches we can then calculate stable channel dimensions. We primarily used field reference reach data to develop conceptual channel dimensions, supported by empirical relationships from academic studies of step-pool and riffle-pool morphology. The channel dimensions were then simulated in a hydraulic model to assess hydraulic performance, and where necessary, varied. 4.2.1 Observed Channel Dimensions in the Field Observed channel bankfull width in the step-pool reference reaches was in the range of 15-48 feet with an average of 25 feet. Pool spacing typically varied from 37 to 63 feet (average of 50 feet) with one pool of only 14 feet (see Figure 4-5). Bankfull depth varied from 1.9 to 4.0 feet, with an average of 2.6 feet. Crest heights were typically 1 foot above the bed. Several studies have shown that step height is controlled by the size of the nucleus boulders (e.g. Curran, 2007), with step height approximating 1.2 times the particle diameter for step-pools in the Santa Monica Mountains (Chin, 1999). In many areas the bankfull channel was found to be flanked by a secondary (and in some cases tertiary) channel that appeared to be active at high flows, and
composed of cobbles. Typical secondary channels were 20 feet wide, with a thalweg elevation close to the bankfull height but separated by vegetated banks that were 1-2 feet high. One point of geomorphic interest concerns the bankfull dimensions measured relative to flow recurrence interval. Modeling typical bankfull dimensions from the step-pool reach in a one-dimensional hydraulic model showed the flow associated with bankfull conditions to be much lower than the 1.3 – 5 year flow typically described in other studies. Calculating dimensions that conformed to more typical values produced dimensions much larger than those observed in the field, though the 2-year flood was found to just occupy the step-pool and secondary channel combined. It is important to note that bankfull geometry relationships are typically measured in lower gradient streams with riffle-pool or flatter forms and may not apply to step-pool and cascade systems as consistently. In addition, the step-pool reference reach valley floor was constricted by the presence of the landslide, as will be the case in the constructed reaches. In this project we have placed more confidence in reference conditions where suitable, rather than empirical relationships derived in different stream systems. The riffle-pool reach measured in the field was somewhat atypical of proposed conditions due to its high gradient (2.5% versus 1.1% for the proposed reach) so we have not used these data to size the riffle-pool reach. Instead we propose using the existing channel dimensions in the upper Carmel River reach as a starting point and allowing the channel to adjust through erosion and deposition of the gravel and sand. Unlike the step-pool reach which is heavily armored and where the initial channel sizing will be hard to adjust, the gravel and sand bed and banks of the riffle-pool reach will be easily adjusted by the river. 4.2.2 Channel Dimensions Used in the Alternatives Analysis From the basis of design described above we developed conceptual channel dimensions for the hydraulic model and cost estimation. Given the wide variability in observed pool dimensions we adapted some pool dimensions to better meet the fish passage and resting criteria developed with the TRT. For the 2.7% diversion reach and 2.52% San Clemente Creek reach we used a typical channel width of 30 feet at the widest point in the pool, pinching to 20 feet at the crest to force flow expansions and contractions that would dissipate energy. Pools were designed to be approximately 50-60 feet long with steps of 1.5 feet. This provides average gradients between 2.5 and 3.0% and pool length to channel width ratios of approximately 2:1. Many studies have shown that step-pools have a spacing between 1-2 times channel width (Chin, 1999). Chin’s work in the Santa Monica Mountains of California (Chin, 1989) found a mean step-pool spacing of 1.9 channel widths, while Whittaker (1987) reported spacings of 2.7 channel widths for streams in New Zealand. Maximum pool depth was set at 4.5 feet for three out of every four pools (to meet the TRT’s request for pools to have a depth 1.5 times step height) with every fourth pool slightly oversized to provide better resting characteristics every 200 feet. The resting pools were made deeper by 2 feet and wider by 10 feet to provide more backwater areas. Where space on the valley floor permits we propose constructing a secondary channel to provide a high flow alternative migration path and refugia.
The riffle-pool reach was designed with pool spacings of 200 feet for the conceptual study, though field evidence from the Upper Carmel Reach suggests a slightly wider spacing that may be refined during the design phase (e.g. 300 feet). Riffles were designed with a top width of 50 feet and a depth of 2 feet, while pools were 40 feet wide and 4 feet deep. Through the Diversion Reach the riffle-pool channel will take a slightly sinuous course along the centerline of the excavated notch. Upstream in the Upper Carmel Reach the riffle-pool planform will approximately follow the existing Carmel River with an adjustment made to avoid a very sharp turn into the diversion channel. Note that due to the increase in channel gradient under an equilibrium condition, we anticipate that over time sinuosity may decrease slightly in the Upper Carmel Reach through lateral bank erosion. 4.3 PRELIMINARY ROCK DIMENSIONS A rock sizing exercise was conducted as part of the performance evaluation (see Section 6.3.2). However, preliminary rock sizing was carried out based on field observations of the largest boulders in the project area. The rocks forming the step-pools typically had a long axis of approximately 6 feet, with secondary axes of around 3-4 feet and tertiary axes of 2-3 feet. 4.4 SUPPLYING COBBLES AND BOULDERS TO THE DIVERSION AND SAN
CLEMENTE CREEK REACHES 4.4.1 Identifying a Source of Cobbles and Boulders The TRT expressed concern that the diversion reach channel in Alternative 1 has its upstream boundary in backwater sediment (sand and gravel) that would not supply sufficient cobbles and boulders to replace those transported out of the diversion or San Clemente Creek reaches3. This raises the possibility that ‘plugging’ particles could be lost from the step-pools, making them too porous and undermining their performance as fish refuges. The consultant team was asked to develop additional alternatives that would reach upstream to a location where coarser sediment in the backwater area indicated that cobbles and boulders could be periodically delivered by the Carmel River. To assess this PWA analyzed the reservoir sediment study carried out by Kleinfelder (2002). This report shows several boreholes and test pits in the Carmel River branch
3 The restored San Clemente Creek channel will join the diverted Carmel River at the downstream end of the diversion channel reach. Since San Clemente Creek will be exhumed to its original 2.5% upstream of the confluence, eliminating any flat depositional channel formed in the reservoir backwater, we expect San Clemente Creek to deliver cobble and boulder to the lower San Clemente Creek reach and partially compensate for the flat, depositional reach of the Carmel River upstream. However, given the smaller size of the San Clemente Creek watershed and the potential for a localized flood in the Carmel River but not San Clemente Creek it is not certain that San Clemente Creek will provide sufficient additional coarse particles to the combined river downstream.
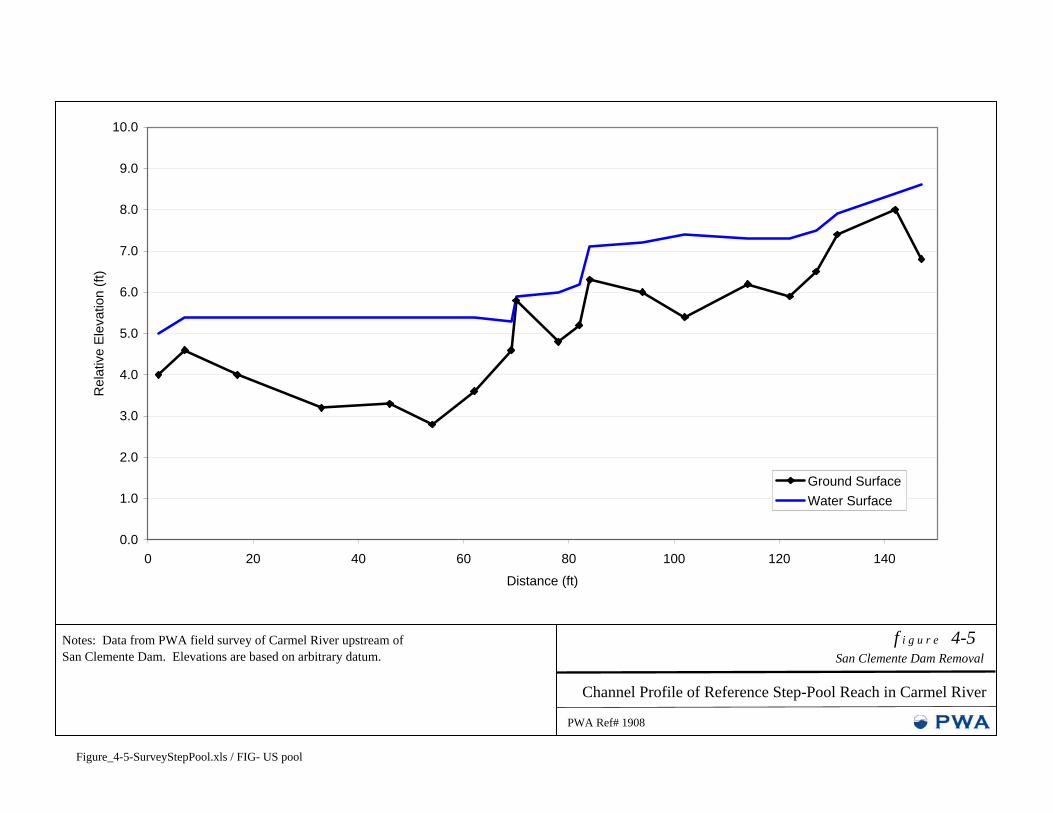
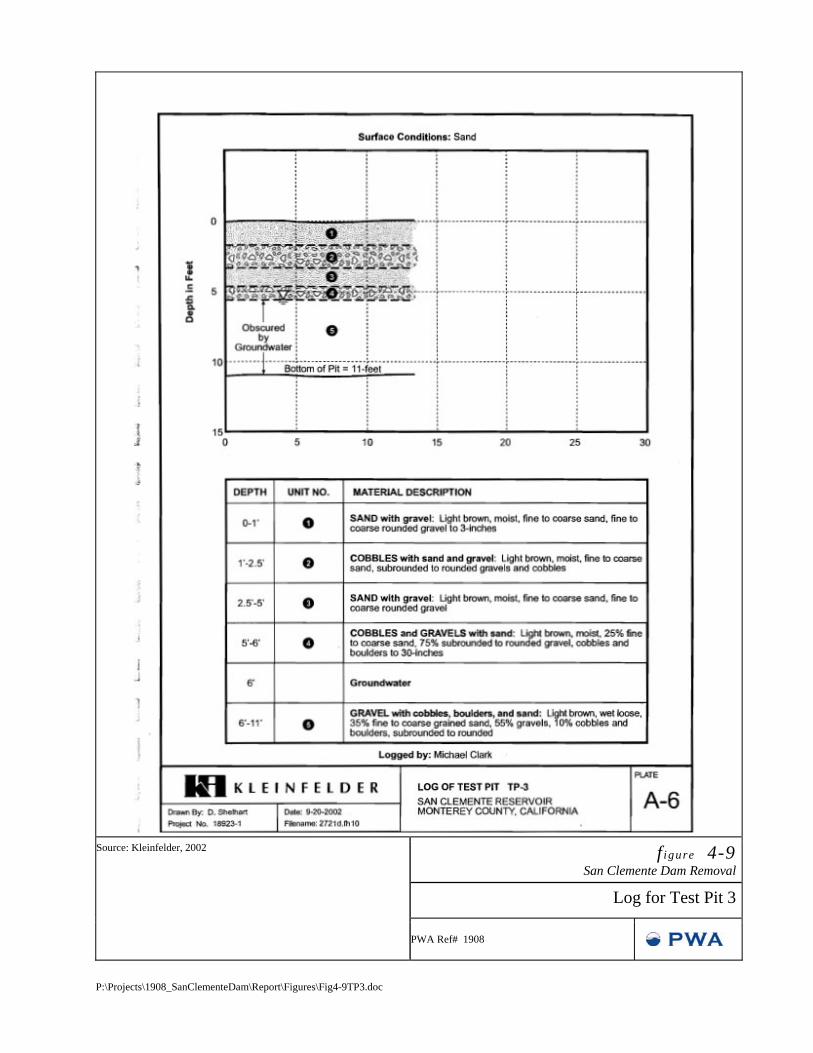
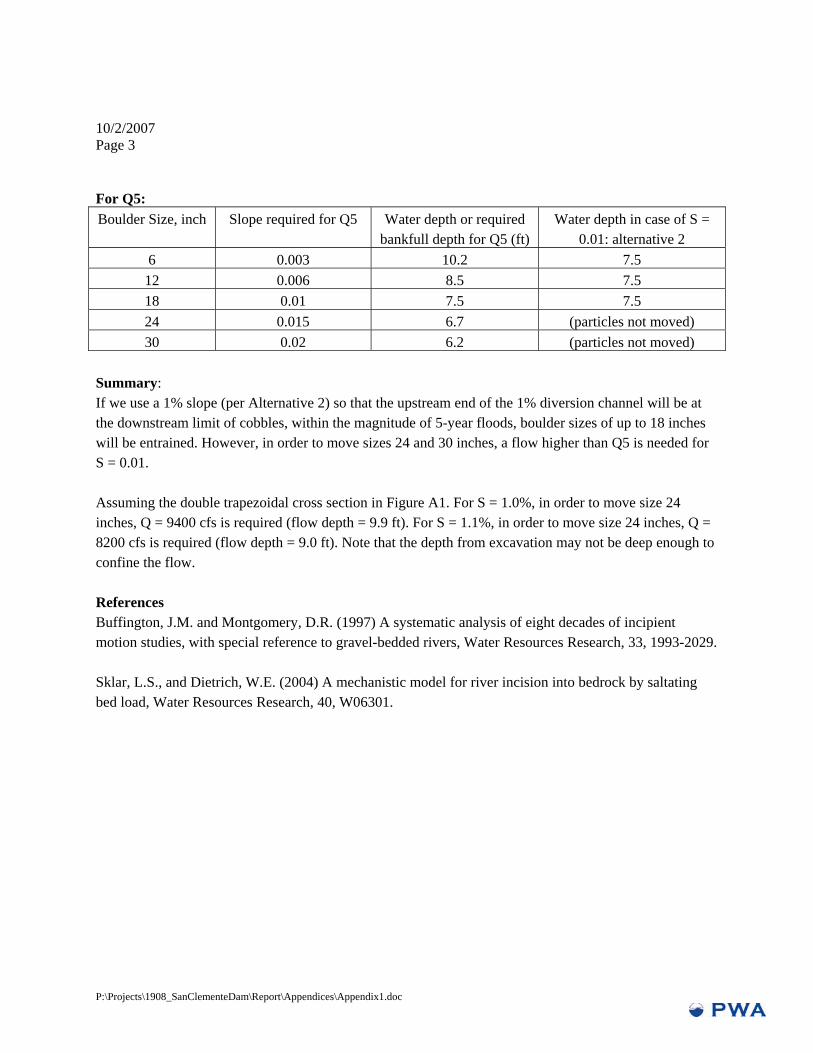
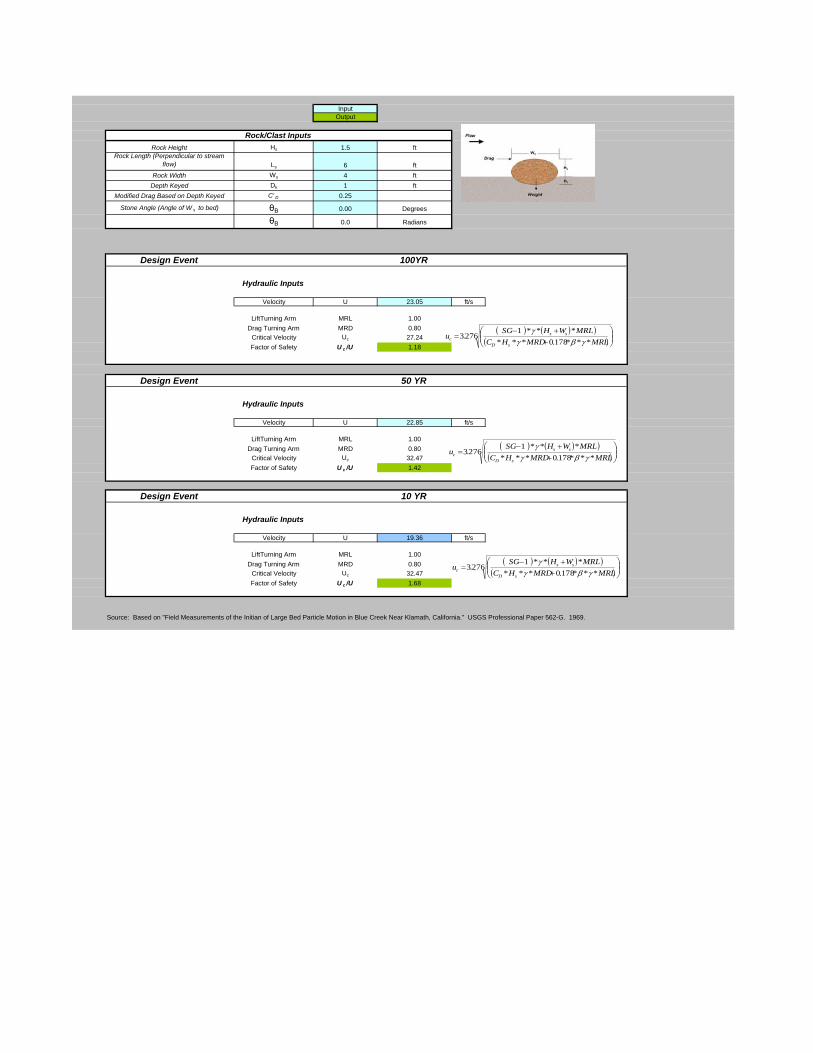
of the reservoir between the diversion ridge breach and the upstream limit of backwater effects. PWA examined test pit logs from TP12, 11, 3 and 2 (progressively further upstream). The location of the boreholes and test pits is shown in Figure 4-6 and individual test pit logs are shown in Figures 4-7 to 4-10. TP12 is located close to the upstream location where the Alternative 1 diversion reach meets the backwater deposits of the Carmel branch, and at the near-surface is composed of poorly graded sand with gravel and traces of cobbles up to 8 inches in diameter (Kleinfelder, 2002). This alignment does not meet the geomorphic criteria requested by the TRT in terms of cobble and boulder availability. Projecting a 1.1% channel upstream from the same ‘hinge point’ at the boundary of the San Clemente Creek and diversion reaches produces an alignment that ‘daylights’ against the existing Carmel River thalweg approximately 1,000 feet upstream of the bedrock ridge, close to TP11. The near-surface sediment here is defined as sandy gravel with 10% sub angular to sub rounded cobbles and boulders (Kleinfelder, 2002), better meeting the TRT’s criteria for channel stability. On the basis of eliminating the steepest gradients in the diversion reach (lowered from 2.7% to 1.1%) and reaching a more abundant cobble and boulder supply this alignment was adopted as Alternative 2. 4.4.2 Transporting Cobbles and Boulders to the Diversion and San Clemente River Reaches To ensure that the proposed channel could transport the cobbles and boulders encountered in Alternative 2 PWA performed an entrainment analysis (included as Appendix 1 to this report.) The results are summarized in Table 4-1. Table 4-1. Slope and Water Depth Required to Entrain Particles of Different Sizes Boulder Size,
inch Slope
required for Q2
Water depth or required bankfull depth for Q2 (ft)
Slope required for
Q5
Water depth or required bankfull depth for Q5 (ft)
The results show that the proposed 1.1% diversion and upper Carmel River reaches in Alternative 2 will readily transport material on the cobble/boulder boundary (8 inches diameter) during the 2-year flow. Boulders 18 inches in diameter will be entrained during the 5-year flow.
ChannelProfile1.xls / ProfilePlot (ft) (Fig4-1)
Source: USGS National Elevation Dataset - 10 m DEMNote: River Mileage on profile derived from USGS DTM does not conform to mileages used by MPWMD and is included for relative scale only. DTM-Derived Profile of Carmel River Through San Clemente Dam
5.1 PHYSICAL PROJECT ALTERNATIVES Based on the goals and objectives developed at the TRT Kickoff Meeting and the sediment assessment described above, the consultant team refined two physical project alternatives. The planform, long profile, cross sections and typical details are shown in Figures 5-1 to 5-5 and described below. The revegetation approach is almost identical for both alternatives and is described in Section 5.5. Alternative 1 is a refinement of the alternative developed by MWH and MEI. The reaches are described from downstream to upstream.
Lower San Clemente Reach. Between the San Clemente Dam and the contact between the San Clemente Creek channel thalweg and the bedrock ridge (approximately 2,200 feet) the valley and channel will be exhumed down to bedrock, with an approximate gradient of 2.52%. Nucleus boulders (approximately 6 feet in the long axis) will be used to form step-pools with a pool length of approximately 60 feet and a step height of approximately 1.5 feet. Steps will be placed on bedrock, with a layer of alluvial material replaced. Where velocities are too high for nucleus rocks to remain stable bedrock will be excavated to form steps. Smaller boulders and cobbles will be used to fill gaps in the steps and create diverse secondary pathways, while gravel and sand will form the substrate. On San Clemente Creek upstream of the confluence with the diversion reach the valley will be exhumed to the alluvial contact (believed to be 2-3 feet above bedrock).
Upper San Clemente Reach. The San Clemente Creek valley upstream of the confluence with the Diversion Reach will be excavated to the pre-dam alluvial layer and restored in-situ.
Diversion Reach. The bedrock ridge will be excavated to an elevation of approximately 520 feet on the downstream side and 530 feet on the upstream side, so that it ties in with the excavated bedrock channel of San Clemente Creek and the thalweg of the Carmel River. The diversion will have a length of 450 feet, a downstream width of 150 feet and an upstream width of 215 feet. The side slopes will be graded at 1:1. The channel will have a gradient of 2.7% assuming the 1 foot sill proposed in the MEI report is excluded. Large boulders or bedrock protuberances will be used to construct a step-pool channel in 2-3 feet of imported alluvial material, as per the San Clemente Creek reach.
Upper Carmel Reach. No action will be taken on the Carmel Reach upstream of the Diversion Reach. The diversion dike will be shaped to direct the Carmel River into the Diversion Reach.
Ranney Collector. The Ranney Collector used to replace the existing flow diversion structure will be located upstream of the diversion reach per the MWH report (MWH, 2006).
Diversion Dike. A diversion dike will be constructed per the MWH report (MWH, 2006) to keep the Carmel River from overtopping the diversion channel and flowing over its former course and the sediment stockpile. The dike will be sized to prevent the PMF from overtopping. The dike will have an impermeable cutoff wall that extends to bedrock (approximately 40 feet) to prevent dewatering of the Upper Carmel Reach. Alternative 2. Alternative 2 was developed by the PWA team to eliminate the steepest reach (a potential fish migration barrier) and to extend the diversion channel upstream closer to areas where cobble and boulders are delivered across the depositional upper Carmel backwater area. The reaches are described from downstream to upstream. Lower San Clemente Reach. This reach will be the same as for Alternative 1. Upper San Clemente Reach. This reach will be the same as for Alternative 1.
Diversion Reach. The diversion reach will have the same downstream location and elevation as Alternative 1, starting at the contact between the rock ridge and the bedrock channel thalweg of San Clemente Creek. However, it will be graded at the average Carmel River gradient of 1.1% rather than at 2.7% as in Alternative 1, requiring some additional bedrock excavation. The channel will be a riffle-pool morphology constructed in 2-3 feet of backfill placed over the bedrock channel, with some nucleus boulders or bedrock protuberances to both provide fish shelter and increase sediment retention during high flows. It will exit the bedrock ridge and enter backwater sediment deposits approximately 8 feet below existing grade.
Carmel River Reach. From the point at which the diversion channel emerges from the ridge upstream into the backwater reservoir deposits of the Carmel River branch it will continue upstream at a gradient of 1.1% until it intersects the existing thalweg of the Carmel River approximately 1,000 feet upstream of the diversion reach. The channel will be a riffle-pool morphology.
Ranney Collector. The Ranney Collector used to replace the existing flow diversion structure will be located upstream of the Carmel River Reach, approximately 440 feet upstream of the location proposed in the MWH report (MWH, 2006).
Diversion Dike. A diversion dike will be constructed per the MWH report (MWH, 2006) to keep the Carmel River from overtopping the diversion channel and flowing over its former course and the sediment stockpile. The dike will be sized to prevent the PMF from overtopping. The dike will have an impermeable cutoff wall that extends to bedrock (approximately 40 feet) to prevent dewatering of the Upper Carmel Reach.
5.2 POTENTIAL PROJECT ALTERNATIVES CONSIDERED AND REJECTED PWA assessed several additional potential alternatives to determine if it was feasible to extend a diversion channel further upstream than Alternative 2, to both increase the supply of cobbles/boulders and to reduce the time to reach equilibrium. Extending a channel further upstream requires either a lower gradient from the same starting ‘hinge point’ at the San Clemente Creek reach upstream limit, or deepening the bedrock cut of the diversion channel. Reducing the gradient would create an aggradational channel that filled in until it reached equilibrium gradient, increasing the time taken to reach equilibrium compared with both alternatives and ultimately resembling Alternative 2. Deepening the cut requires not just increasing the depth and therefore width of the bedrock excavation in the diversion channel but extending the length of bedrock excavation both down and up the San Clemente Creek reach either side of the confluence with the diversion reach. In addition to the increased excavation cost, extending excavation into the San Clemente Valley potentially undercuts the canyon side walls and would require a geotechnical assessment that is beyond the scope of this project. Lowering the confluence would also steepen the San Clemente Creek channel upstream, requiring additional measures to maintain fish passage. The TRT and Conservancy determined that at this point it is not practical or economic to develop such an alternative. 5.3 PROPOSED PROJECT SUB-ALTERNATIVES Within Alternatives 1 and 2 there are several potential sub-alternatives for the channel upstream of the diversion reach, and these were analyzed further in lieu of a third project alternative.
1. Alternatives 1 & 2. Placing sediment excavated from the San Clemente branch of the reservoir in the Carmel branch upstream of the diversion channel inlet rather than downstream. This sub-alternative would use the sediment from the San Clemente branch to jump start the aggradation process that will eventually bring the Carmel River into equilibrium through the former backwater area. This action would reduce the time taken to bring the project to equilibrium, hastening sediment continuity downstream to the project reach and beyond.
Alternative 2 requires the Carmel River reach to be lowered by 8 feet at the inlet of the diversion reach. This can be achieved several ways: 2. Lowering the diversion channel inlet by 8 feet and allowing the Carmel River to erode a
new channel by headcutting up the existing Carmel River until it reaches equilibrium grade. This would generate sediment to line the step-pools downstream and would remove the need for equipment in the 1,000 feet of channel upstream. It would also lower construction costs. The initial channel would be incised, but due to the ease with which
the sediment (gravelly sand) can be mobilized by frequently occurring flows it would rapidly widen and form a stable channel. The process of incision and widening would generate additional sediment for transport downstream.
3. Lowering the existing Carmel River course by 8 feet at the diversion inlet and grading the
channel out to the anticipated final dimensions. This would involve removing sediment to create an inset floodplain bench on one side while preserving the riparian cover on the other side.
4. An interim option between 2 and 3 involving lowering the Carmel River course by 8 feet
at the diversion inlet and grading the channel out at 2%, allowing some sediment to erode downstream to ‘prime’ the step-pools with some fine plugging sediment.
The TRT discussed several options for adding cobbles, boulders and spawning gravel to the Carmel River to improve the function of the step-pools and to provide spawning gravel for reaches downstream of the San Clemente Dam. 5. Stockpiling cobbles and boulders in riffles and in cones alongside the Upper Carmel
Reach for passive entrainment. Suitable sized material found during the excavation of the San Clemente Creek reaches could be stored in the bed and banks of the upper Carmel River reach so that during high flow events some would be entrained and transported downstream.
6. Stockpiling spawning gravel in GeoTubes or other sediment cells alongside the upper
Carmel River Reach for metered release. Sediment could be released by opening cells up when permittable downstream.
5.4 DESIGN OF STEP-POOLS The step-pools are critical to the long term stability of the project, and the final design of the steps will be an important phase of the overall project. We attach the following guidance for step-pool design. The steps should be designed using nucleus boulders that are set on bedrock or large foundation rocks that can resist scour, so that they do not roll into scour pools that form after construction. Nucleus boulders should be carefully placed and interlocked so that there are as many points of contact as possible between rocks. The upstream face of the nucleus boulders should be partially buried to reduce the force acting on them and increase rock stability. The steps should form an upstream facing arc to distribute stresses and cause the rocks to be forced together during high flows. It is important to create irregularities and heterogeneity within the steps, since this will create different preferential flow and fish migration paths at different flow rates. These
heterogeneities can include wedging smaller boulders amongst larger ones to break up steps, creating cracks and paths of different sizes, placing large shelter rocks within pools etc. 5.5 RESTORATION AND REVEGETATION PLAN 5.5.1 Riparian Restoration Design Elements Common to All Reaches There are several habitat restoration design elements that are common to each of the proposed restoration reaches. These common elements are discussed below. Figures 5-6, 5-7 and 5-8 provide typical cross-sections within the 3 restoration reaches. 5.5.1.1 Soils To the extent feasible, existing topsoil within that grading footprint should be salvaged and re-spread across riparian restoration areas. In general, the more soil that can be retained, the increased likelihood for riparian vegetation to establish and persist. In addition, riparian forest productivity will be directly tied to the volume of soil present. Retention of these soils in the first several years after construction will be a key issue that needs to be carefully considered as the design process moves forward since a substantial portion of these soils could be lost if large flood events occur prior to significant vegetation establishment. Although potentially costly, use of erosion control blankets, placement of partially buried logs and strategic positioning of boulders to aid in the retention of soils early in the process should be considered. At this time importing soils is not considered necessary to successful riparian vegetation establishment, and it would also be extremely costly. Additional soils discussions are provided for the San Clemente Reach in Section 5.5.2 and the Diversion Reach in Section 5.5.3.2. Since placement of soil is not planned for the Upper Carmel Reach and 3 feet of alluvium will be spread on the Diversion Reach, the soils work as described above would occur along the San Clemente Reaches. 5.5.1.2 Willow and Alder Plant Material Site grading will remove many willow and alder trees that can be salvaged as live planting material (cuttings, sapling transplants), live root wads, or woody debris. These can all be used extensively in the riparian restoration design. Live trees and live root wads, if harvested properly and temporarily held in appropriate wetted locations, can be installed in strategic locations where standard planting methods are cost prohibitive or ineffective. These plant materials if harvested, stored and installed properly can establish new riparian habitat relatively rapidly. Given the gravel and cobble substrate expected along much of the new channel, it will likely be necessary to rely on large live plant material and natural recruitment to re-establish streamside vegetation.
Thus the active revegetation effort may primarily rely on large (8-24 inches diameter at breast height) willow and alder trees that are harvested with the main root wad and 6-8 feet of trunk intact. 5.5.1.3 Diversion Channel Excavation Materials (woody material, soil, seedbank) The land within the footprint of the proposed diversion channel has a variety of materials that could be utilized in the restoration effort. The numerous large trees can be harvested and re-used in the channel restoration design, as stabilizing elements and also as core habitat for aquatic organisms (steelhead, California red-legged frog, etc.). The existing woodland and scrub habitat also provides a source of topsoil and a seedbank to be salvaged and re-used in the restoration areas. These soils likely contain a substantial viable seedbank of scrub species. If these soils can be harvested in a cost-effective manner, they could serve as the primary means to establish similar habitat along the slopes of the newly excavated diversion channel. Use of these soils to create appropriate conditions to establish coastal scrub habitat is discussed in additional detail in Section 5.5.3. 5.5.1.4 Control of Non-native Species Implementation of the proposed restoration will create a highly disturbed landscape that will be susceptible to invasion by non-native invasive plants. As a result, the habitat restoration planning for the site should include a program to eradicate non-native invasive plant species during the first 3-5 years following restoration to allow the restored vegetation to establish and better compete with the invasive species. 5.5.1.5 Herbaceous Vegetation and Erosion Control Establishment of herbaceous vegetation will be important early in the restoration process to control erosion. Table 5-1 provides herbaceous species that can hydroseeded in both upland and riparian habitat areas, except where soils are so mineral or coarse that seeding will be ineffective. This seeding would occur in the San Clemente Reaches where new soils with a potentially higher percentage of fines may be placed.
Table 5-1. Herbaceous Vegetation Species to be Seeded on Site Common Name Scientific Name
California brome Bromus carinatus
California oatgrass Danthonia californica
blue wild rye Elymus glaucus
slender wheat grass Elymus trachycaulus
meadow barley Hordeum brachyantherum
June grass Koeleria macrantha
creeping wildrye Leymus triticoides
Purple Needlegrass Nassella pulchra
three week fescue Vulpia microstachys 5.5.1.6 Optional Active Habitat Restoration In the event that additional resources are available for habitat restoration purposes and more rapid establishment of riparian habitat is desired, more intensive habitat restoration actions can be implemented. These would include more intensive planting accompanied by weed control, browse protection, dead plant replacement and potentially supplemental irrigation. This approach, if adopted, would primarily be applied to the Diversion and San Clemente Reaches as the predicted dynamic and depositional nature of the Carmel River Reach would likely wash away and/or bury much of the optional active planting actions. However, we consider it likely that natural recruitment and selective revegetation as described above will be successful, and conversely that the additional planting efforts described below may be severely compromised by coarse soil and flooding. 5.5.1.6.1 Optional Planting Plan A planting plan for the San Clemente and Diversion Reaches of the project would include planting woody riparian species at a density of approximately 400-500 plants per acre. All propagules used for restoration would be of local (Monterey County) origin. Thus, a contract with a native plant nursery to custom collect and grow the plants a minimum of one year in advance of the planting would be required. The plants would be established in groups of 3-5 by species to mimic the typical natural distribution of riparian vegetation. Table 5-2 provides the species, on-center spacing and container sizes proposed for each plant association.
arroyo willow Salix lasiolepis 12 Treepot or cutting
mugwort Artemisia douglasiana 8 Tree band
White Alder Riparian Forest
California blackberry Rubus ursinus 8 Treeband
black cottonwood* Populus balsamifera ssp. trichocarpa*
25 acorn or treepot
California sycamore* Platanus racemosa* 20 Treepot white alder Alnus rhombifolia 12 Treepot
red willow Salix laevigata 16 Treepot or cutting
shining willow Salix lucida 12 Treepot or cutting
arroyo willow Salix lasiolepis 12 Treepot or cutting
coast live oak Quercus agrifolia 16 Acorn or Treepot
valley oak Quercus lobata 16 Acorn or Treepot
California buckeye Aesculus californica 12 Seed or Treepot
big leaf maple Acer macrophyllum 14 Treepot mugwort Artemisia douglasiana 8 Tree band
Mixed Riparian Forest
California blackberry Rubus ursinus 8 Treeband *Dominant species in plant association 5.5.1.6.2 Weed Control Weeds around individual plants would be controlled in these active floodplain areas with use of weed mats or rice straw both of which tend to stay in place better in areas subject to flooding than wood chip mulch. In addition, weeds throughout the planting areas would be controlled through a 3-year maintenance period.
5.5.1.6.3 Plant Protection Foliage protection cages would be installed over all woody species subject to browse (most species proposed). Foliage protection cages would be installed flush to the ground, be approximately 4 feet high and 3 feet in diameter and supported by rebar or t-posts. The protective cages will be installed immediately following planting. Tree shelters could serve as optional foliage protection devices for valley and coast live oak plantings. The tree shelters would both reduce browsing pressure and increase soil moisture in the vicinity of the oak plantings. Tree shelters should be 4.25 inches in diameter, 4 feet long and anchored with 5.5-foot wooden or metal posts. Because these foliage protection devices would likely be damaged with periodic floods, the benefits associated with their installation would need to be balanced with the risk of them being damaged. 5.5.1.6.4 Irrigation Irrigation of the installed plants would substantially increase the plants’ growth and survival. However, if a temporary irrigation system were installed it would likely be substantially damaged by winter floods. Thus, the potential benefits of establishing an irrigation system would have to be carefully weighed against the potential losses that would occur with floods. As an option, less frequent irrigation during the initial plant establishment period via water truck and/or pumping from the river could be implemented to increase survival and growth without the risk associated with loosing an irrigation system to floods. Irrigation of riparian plantings typically occurs during the dry season of a 3 year maintenance period. 5.5.1.6.5 Dead Plant Replacement Dead plants would be replaced each year during the 3 year maintenance period. The species chosen for installation would be based upon an analysis of what is successfully growing in similar environments on the project site. 5.5.1.6.6 Maintenance Schedule Typically, revegetation sites are maintained for a minimum of 3 years. Thus, weed control, foliage protection cages and potentially irrigation would be implemented over a 3-5 year time period.
5.5.2 Riparian Restoration Design Elements Specific to the San Clemente Reaches 5.5.2.1 San Clemente Reach Soils The restoration plan for the San Clemente Reaches calls for the removal of the accumulated sediment down to the pre-dam topography. Because these soils have been subject to anaerobic conditions for more than 80 years they may not be appropriate for use in plant establishment. However, if some or all of the soils could be used it could provide a potentially substantial cost saving for the project. Thus, it is recommend that these soils be tested to determine if they are potentially suitable, could be made suitable with amendments or mixed with new soils to create suitable conditions. It may also be necessary to remove them from the project site if their toxicity is found to be acute. 5.5.2.2 Proposed Step-Pools Due to the relatively steep channel gradient, the proposed channel calls for the creation of 4-foot deep pools in the San Clemente Creek Reach. These deep pools will provide potential high quality foraging and breeding habitat for California red-legged frog as well as providing refugia from predators for this species. To assist in channel stabilization and maximize the habitat values of these pools for salmonids and California red-legged frog, the channel design should incorporate substantial coarse woody debris to increase the habitat complexity of the pools. 5.5.3 Restoration Design Elements Specific to Diversion Reach 5.5.3.1 Proposed Step-Pools Due to the relatively steep channel gradient, the proposed channel calls for the creation of 4-foot deep pools in the Diversion Reach in Alternative 1. These deep pools will provide high quality salmonid habitat and foraging, breeding and refuge habitat for California red-legged frog. To assist in channel stabilization and maximize the habitat values of these pools for salmonids and California red-legged frog, the channel design should incorporate substantial coarse woody debris to increase the habitat complexity of these pools 5.5.3.2 Optional Restoration of Coastal Scrub Habitat The rocky 1:1 side slopes that will be created within the Diversion Reach provide a particularly challenging environment for vegetation establishment. The placement and retention of soil in this area will be key to establishing vegetation. It is anticipated that the faces of these steep slopes will be irregular with numerous small ridges and cracks that provide potential pockets where soils may be placed and retained. The coastal scrub habitat that currently occupies the Carmel River Valley slopes that will be impacted with the project provides a potential source of Coast Scrub habitat soils that likely include a rich seed bank of Coastal Scrub species. We recommend that
these soils be salvaged for subsequent placement over the new slopes to create potential conditions where Coastal Scrub can establish. It may be possible to apply the soils to the slopes by simply dumping them onto the slopes from the top of the bank, if equipment can access these areas. The logistics of salvaging these soils may make this cost prohibitive so other soil sources may have to be considered for this area. Following soil placement, the slopes may be seeded with a seed mix containing Coastal Scrub species that are found within the vicinity of the project. The seed mix would include California sage (Artemisia californica), black sage (Salvia mellifera) and sticky monkey flower (Mimulus aurantiacus) at a minimum. It should be noted that the resources required to establish Coastal Scrub habitat in this area will be substantial and that Coastal Scrub habitat restoration will not provide significant habitat benefits for salmonids or California red-legged frog. Thus, revegetation efforts in this location should be considered optional especially if it will reduce the resources that can be applied to restoring riparian habitat. 5.5.4 Riparian Restoration Design Elements Specific to the Upper Carmel Reach 5.5.4.1 Off Channel Red-legged Frog Pond There are several existing off-channel ponds that provide suitable breeding, foraging and refugia habitat for California red-legged frog in the Carmel River Reach of the project. Although the Upper Carmel Reach is anticipated to be a very dynamic environment with channel migration and substantial aggradation there are opportunities to create off-channel ponds that could significantly enhance habitat for California red-legged frog. These ponds would be designed to provide breeding habitat for California red-legged frog and would be a minimum of 3-feet deep in their deepest locations. They would be designed to maintain 20 inches of ponding through July on an average year so California red-legged frog larvae can complete their life cycle. These ponds would be planted with salvaged alder and willow root wads will be placed along the banks of these ponds to facilitate habitat establishment and increase the pond’s complexity. Due to the dynamic nature of the Carmel River Reach, it is assumed that many of these ponds would fill with sediment through time and be created elsewhere by natural fluvial processes. Thus, the creation of these off-channel ponds would serve as temporary habitat for California red-legged frogs. There is only a minimal risk that juvenile steelhead would be stranded in these off channel ponds as steelhead are less likely to use off channel habitat than other salmonids (Quinn 2005). 5.5.4.2 Existing Riparian Habitat to Be Preserved The Upper Carmel Reach currently supports substantial stands of riparian habitat, many of which will be preserved as part of the restoration design. Thus, the Upper Carmel Reach will have fairly
good riparian habitat values immediately after construction and these stands are likely to spread laterally as well as provide good seed sources to hasten natural recruitment. 5.5.4.3 Minimal Active Habitat Restoration The Upper Carmel Reach of the project is anticipated to be the most dynamic of the reaches with channel migration and substantial aggradation expected. These natural processes would likely bury and/or wash away the optional active habitat actions described in Section 5.5.1.6 if implemented. They will also create conditions where natural recruitment of native riparian species will readily occur. Thus, substantial active habitat restoration in this reach is not recommended.
Fig5-3LongProfile.xls / HorzFigureBox
Source: 1921 USGS Topo overlaid with 2006 topographic surface. Both data sets courtesy of Montgomery Watson Harza.
Long Profile Showing Existing and Proposed Conditions
The purpose of this chapter is to evaluate the project alternatives and sub-alternatives laid out in Chapter 5 with the performance goals and objectives established in Chapter 2. The key tool used in this assessment is a hydraulic simulation model constructed to predict the flow conditions of the design channel for their biological and geomorphic functions. An important feature of this study is the use of unsteady or continuous hydraulic modeling to assess fish passage conditions. Using continuous simulation allows us to look at the whole range of flows during which migration may be occurring, rather than running a few key flows such as the 10% exceedence flow or the two-year flow, therefore allowing a conservative estimate of the fish passage performance of this project. 6.1 DEVELOPMENT OF HYDRAULIC MODEL OF ALTERNATIVES Hydraulic modeling of the Carmel River in the vicinity of San Clemente Dam was performed using HEC-RAS, one-dimensional hydraulic modeling software developed by the U.S. Army Corps of Engineers. An existing HEC-RAS model built by MEI was adapted for use in this analysis by updating the model’s geometry to reflect Alternatives 1 and 2 and by changing the model’s boundaries to include unsteady flow conditions. 6.1.1 Limitations in Hydraulic Modeling for Fish Passage Assessments Step-pools are complex three dimensional hydraulic systems and we recognize the inherent limitations of using a one-dimensional model to represent them. In addition to the dimensional complexity of step-pools, we recognize that individual step-pools will vary from one another, and evolve over time as smaller boulders move in and out of reaches. For example, the real step-height and velocity may well be less than predicted by the model in some parts of a step-pool, and greater in others, due to placement of boulders, gaps between nucleus boulders etc. This heterogeneity is likely to produce pathways that fish can exploit, and we encourage the creation of heterogeneity in the step-pool final design so that at different flows different pathways will be created. We also recognize that fish passage is a complex behavioral process and that fish passage criteria are simplified approximations of reality. However, we are proceeding on the basis that the model and fish passage criteria at least provide metrics for comparing and refining different alternatives and assessing the sensitivity of flow parameters relevant to fish passage and geomorphic stability to changes in channel design.
6.1.2 San Clemente Reach for Alternatives 1 and 2 The step pool geometry for the Lower San Clemente Reach consists of 38 step pools spaced approximately 60 feet apart with an overall channel gradient of 2.52%. Step pool dimensions were consistent with field observations of the Carmel River, upstream of the backwater effect of the San Clemente Dam. Each step pool is represented in the model by five cross sections, which are shown in planform (Figure 6-1) and long profile (Figure 6-2) and summarized in Table 6-1. Table 6-1. Cross Section Descriptions for the Five Cross Sections Constituting each Step Pool in the San Clemente Creek Reach
Cross Section Name
Cross Section Description Distance The Next Cross
Section Downstream
Top Bank Width
Channel Depth
Below Crest
CS1 – Downstream pool
The downstream portion of the pool, just upstream of the next pool’s CS5
3.0’ to next step pool’s cross
section 5
20’ 3’
CS2 – Middle pool
The middle of the pool at its deepest and widest location
22.64’ to cross section 1
30’ (40’ for resting pools)
4’ (5’ for resting pools)
CS3 – Upstream pool
The upstream portion of the pool, just downstream of the drop structure
22.64’ to cross section 2
20’ 3’
CS4 – Downstream crest
The crest of the drop structure where water plunges into the pool downstream
9.04’ to cross section 3
20’ na
CS5 – Upstream crest
The upstream part of the crest, just downstream of the next upstream pool’s CS1
3.0’ to cross section 4
20’ na
These cross sections are shown graphically in Figure 6-3 and 6-4. For each step pool, the elevation of the two crest cross sections (CS4 and CS5) were the same and were determined based on the design channel slope. To simulate the flow that may occur between the boulders of the step structures, a triangular notch was added to each crest that was one foot wide and one foot below the design crest elevation. The upstream and downstream pool cross sections (CS1 and CS3) were 4.5 feet below the crest upstream and 3 feet below the next downstream crest. The cross section representing the middle of the pool (CS2) was typically 10 feet wider and one foot deeper than CS1/CS3, however, every fourth pool was designed as a resting pool and was 20 feet wider and 2 feet deeper than those in CS1/CS3.
Floodplain and hillside elevations were extracted from the 1921 topographic surface of the San Clemente Creek valley as cross sections at 30 foot intervals. For a given step pool structure, it was assumed that a valley cross section was representative of CS5, CS4, and CS3 as well as the next upstream step pool’s CS1. The next valley cross section taken 30 feet downstream was used for the step pool’s CS2. This process was continued for each 60 foot long step pool sequence. At the appropriate location in the floodplain, the crest or pool geometries were spliced into the valley cross section. High-flow secondary channels that were one foot below the floodplain elevation and separated from the main channel by a riparian strip are included in the design cross sections where the historic valley widths were wide enough. Roughness values were estimated during site visits and based on engineering judgment of long-term vegetated conditions. The crests and pools in the main channel are set at Manning’s n-value of 0.065 to account for the form roughness associated with large cobbles and boulders in the main flow path. Floodplain and valley side n-values are set at 0.08 and 0.09, respectively, to account for the expected level of vegetation and form roughness. When incorporated, the high-flow channel’s n-value is 0.05 and the riparian strip separating the high-flow and low-flow channel is set at 0.12 to account for dense willow vegetation. 6.1.3 Diversion Reach for Alternative 1 For Alternative 1, the diversion reach consists of eight step pool structures, including two resting pools and an overall channel slope of 2.7%. The cross section design and layout of the step pools in this reach are similar to those described above for the San Clemente Reach, with one major exception being the distance between structures is approximately 56 feet. The distance between CS2 and CS3 and between CS3 and CS4 is 20.60 feet, while all other distances between cross sections are the same as those shown in Table 6-1 above. Roughness values are also consistent with those described for the San Clemente Reach. The floodplain and valley slope geometry was determined from the anticipated excavation profile of the ridge. As determined in the MEI design, floodplain widths range from 215 feet at the upstream end of the diversion to 150 feet at the downstream end. The floodplains slope from the channel banks to the valley toe at 1% and the valley sides slope at 1:1. Secondary channels are included in all cross sections of the diversion reach. These high-flow channels are 20 feet wide and one foot below the floodplain elevation and separated from the main channel by a 15 feet wide riparian fringe. 6.1.4 Diversion Reach and Upper Carmel River Reach for Alternative 2 The Diversion and Upper Carmel Reaches for Alternative 2 are designed in the HEC-RAS model to represent a riffle-pool system at a 1.1% channel slope. Riffle-pool sequences are 200 feet in length, with some variability in the Carmel River reach to accommodate the existing cross section
spacing. For riffle cross sections, the channel depth below the banks is 2 feet and the top width is 50 feet and for pool sections, the channel depth is 4 feet and the top width is 40 feet. Diversion reach floodplain and valley geometry is consistent with that described above for Alternative 1. For the Carmel River reach, the design riffle and pool cross sections were spliced into the existing conditions cross sections at the location of the existing low flow channel. A 25 foot wide low floodplain was included on both sides of the channel and the design sections were tied into the existing floodplain and valley geometry at 3:1 slopes. Secondary channels are included in the diversion reach, but not in the Carmel River reach. Roughness values are consistent with the alternatives described above. 6.1.5 Steady-state Simulation Hydrology Peak flood event flows for the Carmel River above and below its junctions with San Clemente Creek are shown in Table 6-2. Additionally, the return interval for 40 cfs and 800 cfs (fish passage flow boundaries) were estimated from the flood frequency curve developed for the Carmel River at Robles Del Rio (MEI, 2002a). Table 6-2. Peak Flow Values Used in Steady-state HEC-RAS Modeling
Return Interval Carmel River Flow Above San Clemente Creek (cfs)
Carmel River Flow Below San Clemente Creek (cfs)
2-year 1,932 2,250 5-year 5,446 6,200
10-year 8,601 9,680 50-year 16,498 18,700
100-year 19,983 22,700 PMF 70,400 81,200
~1.01-year 40 40 ~1.25-year 800 800
6.1.6 Unsteady Simulation Hydrology Unsteady boundary conditions for the Carmel River and San Clemente Creek were based on historic measurements from USGS stream flow gage 11143200 (Carmel River at Robles Del Rio), located approximately four miles downstream of San Clemente Dam. While it is not ideal to estimate hydrology for two disproportionate watersheds from a gage located downstream of the confluence and downstream of a flow impediment (the San Clemente Dam), it was deemed appropriate for this screening level analysis. Based on a ratio of peak flow events, Carmel River and San Clemente Creek flows were estimated as 85% and 15% of the Robles Del Rio gage data, respectively. The peak flow values used to establish this ratio were taken from MEI’s HEC-RAS model (MEI, 2005) for the Carmel River upstream of San Clemente Creek, the Carmel River
downstream of San Clemente Creek, and San Clemente Creek upstream of the Carmel River (see Table 6-2). Peak flows for the Carmel River below San Clemente Creek corresponded to published values (MEI, 2002a). Flows for San Clemente Creek were applied to the model as a lateral inflow hydrograph just downstream of the bypass reach and therefore reached the San Clemente Reach of the Carmel River before upstream flows. While this study did not investigate the affects of hydrograph timing from the two watersheds, it should be reviewed in future analyses. The unsteady HEC-RAS model was run for the period of December 15th of the previous year to May 30th for the years 2000 through 2007 (e.g. 12/15/99 to 5/30/00) representing the period of time for which we had high resolution fish passage data. Simulation time steps ranged from two seconds to one minute and model output data was recorded daily. The HEC-RAS input hydrology for the Carmel River and San Clemente Creek can be seen in Figure 6-5. 6.2 FISH PASSAGE PERFORMANCE OF ALTERNATIVES 1 AND 2 Based on the fish passage criteria, the San Clemente, Diversion, and Carmel River reaches for Alternatives 1 and 2 were evaluated using results from the unsteady HEC-RAS simulations. Data was extracted from different pool, crest, and riffle cross sections that were characteristic of either typical or high velocity conditions. Cross sections were considered passable if the flow was between 40 and 800 cfs and if the channel velocity was below 3 fps in pools or 6 fps in crests or riffles. Secondary channel and floodplain conditions were assessed separately with conditions considered passable if the depth was greater than 1 foot and the velocity met the channel requirements described above. Table 6-3 summarizes this analysis for seven years covering a wide range of flow conditions. Note that the yearly values (in Appendix 2) vary little from the mean annual figures. Table 6-3. Average Percentage of Time Fish Passage Criteria are Met During Potential Migration Events, 2000-2007
Percent Time Fish Passage Criteria Met During Potential Migration Events1 Both Alts Alt 1 Alt 2 2.5% San
Clemente reach
2.5% San Clemente reach plus secondary channel2
2.7% Diversion reach
2.7% Diversion reach plus secondary channel2
1.1% Diversion and Carmel reaches
1.1% Diversion and Carmel reaches plus secondary channel2
1Velocity criteria – flows must be slower than 3 feet/second for pools, slower than 6 feet/second for crests or riffles 2Secondary channel is deemed passable when velocity is less than 3 feet/second
and flow depth exceeds 1 foot on the secondary channel 3 Selected as the highest velocity pool at a flow of 800 cfs 4 Selected as the highest velocity crest at a flow of 800 cfs 5 All riffles and pools in the riffle-pool reach are identical so no highest velocity values are shown The Lower San Clemente Creek Reach meets upstream passage velocity criteria except for the step crests, which frequently have velocities that exceed 6 feet per second (as expected). However, when crest velocity exceeds 6 feet per second the crest height is jumpable for adult steelhead (1-2 feet) and can therefore be avoided. In reality for many of the steps we would also expect fish to find some gaps between nucleus boulders that support migration by swimming at burst velocities. This reach is approximately 2,200 ft long with a 2.52% gradient, resulting in 38 step pools of approximately 60 feet in length. Although the riffle crests exceed velocity criteria, the intervening pools should provide resting habitat. Secondary channels do not appear to be feasible in all the critical reaches due to the confined nature of the San Clemente Reach, though we believe from examination of the 1921 topography that improvements can be made to the channel at the next design phase that will eliminate or improve some of the key limiting reaches in this conceptual level hydraulic model. In the Diversion Reach, the higher gradient Alternative 1 channel also meets upstream passage criteria except for the crest velocity criteria, as noted in the Lower San Clemente Reach. The diversion reach is approximately 450 feet long in Alternative 1 with a gradient of approximately 2.7%; pools meeting resting habitat criteria will be constructed although typical pools in the reach are anticipated to meet velocity criteria. The Carmel River upstream of the diversion reach for Alternative 1 is anticipated to meet all velocity criteria. Secondary channels in the diversion reach are anticipated to provide only incremental improvements to upstream passage. For the lower gradient Alternative 2 (1.1%), it is estimated that upstream passage of adult steelhead is unimpeded (meets all velocity criteria) in both the diversion and Carmel River reaches. Secondary channels in the diversion reach are not necessary to meet passage criteria. 6.2.1 Summary of Fish Passage Performance for Alternatives 1 and 2 Adult steelhead upstream passage criteria are met for almost all flows between 40-800 cfs in both alternatives, and in all reaches. For both alternatives the most limiting conditions are found in the
lower San Clemente Creek Reach where confined valley conditions constrain the channel width and create high velocity zones, although intervening pools meet resting criteria. We believe that some of the apparent constraints can be eliminated during preliminary design and during construction by ‘tweaking’ and field-fitting the standard step-pool design to better fit topography. Although specific criteria for downstream migration of steelhead smolts were not used or evaluated, downstream smolt passage is not anticipated to be impeded by any of the alternatives. However, upstream passage of juvenile steelhead (as a secondary goal), may be impeded due to the size of the drops anticipated; NMFS fish ladder design criteria specifies drops of 6 inches from pool to pool, whereas the design alternatives will likely have pool to pool drops of 1 foot or greater, particularly in the San Clemente Creek reach and Alternative 1 in the diversion reach. However, upstream passage for juvenile steelhead could be provided by microhabitats that are anticipated to occur as boulders and gravels adjust over time. 6.3 GEOMORPHIC PERFORMANCE OF ALTERNATIVES 1 AND 2 6.3.1 Estimated Time Required to Reach Equilibrium in the Upper Carmel River Reach As described in the geomorphic objectives and the project sub-alternatives sections, the Carmel River will aggrade upstream of the diversion reach until equilibrium is reached (net balance between sediment volume entering and leaving the reach). Until this happens there will be a higher risk of poor project performance as cobbles and boulders needed in the Diversion and Upper San Clemente Reaches will be trapped upstream. To determine the risk exposure time and to assess the potential for using the sediment from the San Clemente Creek branch of the reservoir to hasten the equilibration process, we undertook a rough grading exercise. Extending a 1.1% floodplain slope upstream intersects existing grade around 16,000 feet upstream of the diversion channel for Alternative 1 and 9,500 feet upstream for Alternative 2. An average valley floor width of 323 feet was measured in the backwater area, and 143 feet in the upper canyon area. By measuring the difference in vertical elevation between the existing profile (taken from the USGS DTM – see Figure 6-6) and the assumed 1.1% equilibrium slope and multiplying by the relevant floodplain width we can estimate the volume of sediment required to reach equilibrium. For Alternative 1 the volume is 2,439,500 cubic yards whereas for Alternative 2 the volume is 1,094,907 cubic yards. According to MEI (2003) the Carmel River delivers an average of 24,523 cubic yards of sediment per year. At a trap efficiency of 100% this would create an equilibrium slope in 99 years for Alternative 1 and 45 years for Alternative 2. However, the current trap efficiency of the San Clemente Dam is estimated to be 75% and this will be reduced to 35% for gravel once the dam is removed and the bypass constructed (MEI, 2005). It will reduce further as the channel and floodplain slope builds up. Using this efficiency suggests that the site will reach equilibrium in approximately 400 years for Alternative 1 and 180 years for Alternative 2 (Table 6-3). There are several factors complicating this simple analysis. Firstly, as the valley floor fills it will become steeper and trap efficiency will fall, so that the rate of filling
will have an asymptotic form (approaching but never attaining equilibrium). Secondly, our calculation is based on a period in which Los Padres reservoir was trapping sediment. Los Padres reservoir is expected to fill within 40-50 years (Larry Hampson, Pers. Comm. 2007). As the reservoir fills its trap efficiency will fall and more sediment will be delivered to the project reach. Table 6-3. Estimated Sediment Volume and Time Required to Reach Equilibrium Alt 1 Alt 2 Volume for valley floor to reach 1.1% gradient
~upper canyon area cubic yards 585,241 436,944 ~reservoir backwater area cubic yards 1,854,259 657,963 Total Volume cubic yards 2,439,500 1,094,907 Difference between Alt 1 and Alt 2 cubic yards 1,344,593 ~ Sediment input from Carmel River per year cubic yards 24,523 24,523 Time to reach equilibrium at 100% trap efficiency
years 99 45
Time to reach equilibrium at 35% trap efficiency years 398 179
6.3.2 Rock Sizing for Step-Pool Nucleus Boulders The nucleus boulders are central to the geomorphic sustainability and fish passage performance of the project. Unlike gentler gradient channels that are typically formed by flows around the 1.5 – 5 year recurrence interval, step-pool systems generally form under flows that occur less frequently than every 30 years (Curran, 2007). In most step-pool environments nucleus boulders that are transported out of a reach during a high flow are replaced from upstream, and new steps form in the falling hydrographs of the same events that break up the old steps. Most commonly, new steps form around bed irregularities such as rough sections of bedrock, relics of former steps, or clusters of larger particles (Curran, 2007). However, the existing steps in the Carmel River may be somewhat different in that they appear to have formed in isolated locations where there are atypical inputs of large nucleus boulders from landslides or bank undercutting. Given the likely time scale for the channel to reach equilibrium (see section 6.3.1) it is desirable that the nucleus boulders are stable during at least the 100-year flood and ideally the Probable Maximum Flood (PMF). The rock sizing assessment involves assessing the five principal forces acting on a rock: gravity (resisting motion) and buoyancy, drag and lift (driving motion). We used flow velocity data from the hydraulic model (described in section 6.1). The balance of these forces is taken to calculate a Factor of Safety (FoS) for the rocks in flows of different magnitude. The FoS is the ratio of resisting to driving forces, with values greater than 1 indicating stability. Typically we add a margin of error to this, seeking a FoS of 1.2 or 1.3. We performed two types of stability
assessment: one using tabular rocks (rocks with flat surfaces and right angle corners, typical of fresh landslide debris) and one for elliptical boulders (sub-rounded rocks typical of older landslide debris that has been partially rounded in a river over time). Results and working methods are presented in Appendix 3. It is important to note that the rock sizing assessment is considered conservative in that it assumes a rock is fully exposed to flows and does not receive support or friction from surrounding rocks, or have portions of the rock buried in the bed. In reality we would design steps so that each rock has at least three points of contact with other rocks, increasing resistance. We would also expect some deposition on the upstream side of the boulders, partially shielding them from the full force of flow. In addition, there are inaccuracies associated with extracting velocities from one-dimensional hydraulic models during events such as the 100-year flood or the PMF. The few field measurements made during such large events tend to show lower velocities than those predicted by hydraulic models (see for example Trieste and Jarrett, 1987) and bed velocities that act on particles are typically lower than mean velocities. Rocks that are 6 feet long (perpendicular to flow) by 4 feet (base width) by 2.5 feet high with 1 foot buried (similar size to those observed in the step-pool reference reach) appear to be marginally stable at the 50-year flood using either analytical approach. For a tabular rock the FoS is 1.01 during the 100-year flood and 0.76 during the PMF. For an elliptical rock the corresponding FoS values are 1.03 for the 100-year flood and 1.18 for the PMF. This is consistent with literature reports reporting that steps typically mobilize and reform during events in the 30-50 year frequency, but suggests that such rocks may be too small for some of the critical reaches of the Lower San Clemente Reach unless well keyed in or partially buried in the bed. 6.3.3 Potential Failure Mechanisms and Consequences During very large flood events the step-pool system may ‘fail’ by mobilization of nucleus rocks. In a natural system such mobilization is matched by step reformation on the falling limb of the hydrograph. Steps typically reform around disturbances such as bed irregularities or large particles. Step mobilization and reformation is not regarded as a fatal flaw for this project, since the new steps will likely have suitable characteristic for fish passage provided that they are composed of material shown to have formed such steps in the reference reach. However, evacuation of large numbers of boulders from the project reach would drive the system to a plane bed form that would have less desirable fish passage attributes. For this reason we recommend the placement of simulated landslides at key locations in the channel to replenish the step-pool system in the event of failure. In addition, if rocks are entrained during a very large flood event the largest nucleus boulders will tend to act as roughness elements that trap rocks from failed steps upstream, recreating the step-pool form on the falling limb of the hydrograph. 6.3.4 Sediment Transport Characteristics of the Two Alternatives
A full sediment transport assessment of the project alternatives will be carried out by MEI as part of a separate scope of work. As described above, PWA carried out an entrainment analysis to ensure that cobbles and boulders that are already deposited on the upper Carmel River reach can be transported to the diversion reach and beyond during 2-year flows, and a rock sizing analysis to ensure that the nucleus boulders remain in place during a 100-year flow and PMF. 6.4 PERFORMANCE OF THE PROPOSED CAW WATER INTAKE In all alternatives the CAW water intake will be reconfigured as a Ranney Collector (a vertical shaft with lateral collectors that takes subsurface water from the sand and gravel sediment of the backwater area and pipes it to the current dam location under gravity). MWH proposed locating the intake approximately 500 feet upstream of the diversion reach, in order to maintain an intake elevation of 525 feet. Under Alternative 1 the Ranney Collector will function as proposed by MWH. In Alternative 2 the Carmel River channel at the collector will be approximately 4 feet below existing grade, potentially lowering the water table by a similar amount and threatening the water intake. In order to maintain the desired head of water above the steel intake pipes the Ranney Collector should be relocated an additional 440 feet upstream. The MWH alternative proposes running the pipeline through the San Clemente Creek reach, which includes several very constrained sections with high velocities (28 feet per second) during the 100-year flood. We recommend that this alternative be reconsidered during preliminary design and that as an alternative the pipeline should be relocated to the Carmel arm of the reservoir. 6.5 ASSESSMENT OF SUB-ALTERNATIVES 6.5.1 Placing Sediment Excavated From the Lower San Clemente Arm of the Reservoir in the
Upper Carmel River Arm This sub-alternative calls for using the sediment removed from the San Clemente arm of the reservoir to speed up the process of aggrading the upper Carmel River reach to equilibrium grade by placing it there rather than in the lower Carmel River branch. 380,000 cubic yards of sediment represents 30% of the volume required to reach equilibrium under Alternative 1 and 48% under Alternative 2. Assuming this material remained in place it would reduce the time required to reach equilibrium by approximately 62 years for each alternative. However, most of the sediment from the San Clemente arm of the reservoir is significantly finer than the average grain size delivered by the Carmel River and has a lower equilibrium gradient. For example, the average grain size (d50) for the borehole samples collected from the San Clemente Creek arm of the reservoir are 0.37mm, 0.78mm and 0.52 mm for boreholes B13, B14 and B17 respectively (Kleinfelder, 2002), whereas the average grain size in Test Pit 1 (the test pit closest to the edge of the backwater in the Carmel River arm of the
reservoir) is 9.5mm. Sediment taken from the San Clemente Creek arm of the reservoir is unlikely to remain in storage when exposed to flows at a 1.1% valley floor gradient. We would expect a lot of this sediment to wash out and deposit downstream of the dam, with undesirable consequences. There would also likely be significant impacts on red legged frog and riparian habitat that would require mitigation. This sub-alternative does not therefore appear to be advisable. 6.5.2 Grading the Alternative 2 Upper Carmel River Reach Versus Allowing it to Erode into
Shape These sub-alternatives use different degrees of excavation to create the 1.1% reach connecting the diversion reach to the Carmel River. The options range from allowing the reach to erode to the diversion reach thalweg until it equilibrates, to pre-forming the channel. We conducted a grading exercise in AutoCAD to assess the volume of sediment required to fully form a channel close to equilibrium for this reach, to provide the maximum volume of cut required. The channel cross section was produced by copying the existing cross sections and lowering them to the thalweg elevation conforming to a 1.1% equilibrium gradient channel projected from the diversion reach. This generated a volume of 11,000 cubic yards. Cutting an initial pilot channel 50 feet wide at 2%, as suggested by some TRT members, generates a cut of 3,700 cubic yards. If the pilot channel eroded out to the assumed equilibrium dimensions the volume of sediment generated would be 7,300 cubic yards (the difference between the two numbers above). To assess the impact of this on the restored reach we calculated the volume of the pools in the step-pool reaches. With a length of 2,300 feet, width of 30 feet and average depth of 4 feet, and assuming 10% of the pool volume is occupied by nucleus boulders, the pools have a volume of approximately 9,200 cubic yards. Thus, cutting a 2% pilot channel would initially fill the pools with sand and gravel to a depth of over 3 feet, initially making the system impassible for fish. To ensure passage for fish during this time, trap and haul would need to be used to move adult steelhead from the ladder at San Clemente Dam to above this blockage. The sand and gravel would likely scour out after the next large flow of the year leaving cobbles and boulder plugging particles behind, with subsequent deposition of the finer sediment downstream of the dam. With the project site currently receiving 24,523 cubic yards of sediment and the reservoir having a trap efficiency of 85% (MEI, 2005) this sediment represents approximately 2 years of average annual sediment supply under existing conditions, and 46% of the average annual sediment load under post-project conditions (assuming 35% trap efficiency after dam removal). The advantage of this sub-alternative would be slightly lower construction costs and the benefits of plugging the downstream pools in a natural manner with the eroded sediment, compared to hand placing the step-pool matrix material. This sub-alternative appears relatively feasible as an alternative to constructing the step-pools ‘fully formed’, though it may delay fish migration for as long as one year until the pools have filled and flushed, depending on the number and timing of high flows during the winter after construction.
6.5.3 Placing Gravel, Cobble and Boulders in the Upper Carmel River Reach to Meter
Sediment Downstream Placing sediment either in the channel or alongside the channel appears to be a viable way of metering sediment out to replenish step-pools downstream and to supply spawning reaches. However, any plan involving large volumes of sediment placement (in the order of thousands of cubic yards) will require a monitoring and adaptive management program involving monumented cross sections and repeat surveys to ensure that critical cross sections downstream of the dam do not lose flood capacity. Several suggestions have been made for possible gravel placement, including placement in piles to be mobilized during floods, placement in the channel itself, and placement alongside the channel in GeoTubes. This latter idea is one of the most controllable approaches, in that as long as cross sections downstream preserve their flood capacity additional GeoTubes can be cut open using a chain saw to generate more sediment. If the channel approaches a predetermined threshold no more sediment is released until the sediment wave has passed. Given the sensitivity to channel conveyance and flooding downstream the idea of a closely monitored and controlled approach may be more realistic than simply dumping sediment for entrainment in less controlled circumstances. The TRT made recommendations concerning gathering gravel and cobble during the construction process, including mining and stockpiling selective sediment layers that meet the project needs as they emerge, rather than sieving sediment, to reduce costs. The TRT also drew attention to the possibility of placing spawning gravel in specific sites near the reservoir (e.g. immediately downstream of the dam). Though not included in the scope of this project, a plan for gravel augmentation and river restoration downstream of the dam may be merited given the large volume of suitable materials found on site. 6.6 SUMMARY OF ALTERNATIVES ASSESSMENT The predicted performance of the two alternatives is summarized below, and in Table 6-4.
1. Both alternatives assessed meet the Primary Goals of the project: fish will be able to migrate upstream through the project under the vast majority of conditions under which migration currently takes place; the reaches can be constructed to be geomorphically-stable if either sufficiently large rock or bedrock is used to construct a step-pool channel; and the CAW water intake can be relocated to meet the required standards.
2. In the event of failure of the step-pool structures two outcomes are possible: reformation of the step-pools around nucleus boulders or destruction of the step-pools to a plane-bed channel form. While the step-pool form would provide more desirable fish passage
performance (fish passage in a wider range of flow conditions), the plane bed form would not be a fatal project flaw.
3. The most limiting reach for fish passage and geomorphic stability in both alternatives is the Lower San Clemente Reach owing to the confined nature of the valley floor. Some of these constraints may be reduced during the preliminary design phase by looking for opportunities to locally widen the floodplain adjacent to the channel.
4. Alternative 2 provides immediate post-construction supply of larger cobble and boulder-sized particles that play a crucial role in plugging step-pools, creating heterogeneity and improving their fish passage and resting performance.
5. Alternative 2 requires approximately half the time of Alternative 1 to reach geomorphic equilibration. Combined with Point 3 above, this reduces the risk of project failure for Alternative 2.
6. Overall, Alternative 2 offers significant benefits over Alternative 1 in terms of shortening the critical fish passage reaches, the supply of coarse sediment and the time taken for the project to reach geomorphic equilibrium. The cost difference (see Section 7.9) is small relative to the overall project costs and performance benefits.
7. Because of the high entrainment forces found in the Lower San Clemente Reach, particular care should be paid in designing the step pools. Steps should be designed using large, tabular nucleus boulders and placed to encourage particles to knit together. In critical reaches steps may be constructed directly by blasting bedrock.
8. There are inherent risks associated with diverting a river fed by a 125 square mile watershed down a steeper and more confined valley cut by a river with a 16 square mile watershed. Given this situation, and the long time required to reach equilibrium, the final plan should make contingencies and allocate budget to repair steps that fail during large flood events.
Table 6-4. Comparison of Anticipated Project Performance for the Alternatives Primary Goals Alternative 1 Alternative 2 Differences between
Alt 1 and Alt 2 A1 Achieve and maintain passage
for adult steelhead and smolts Criteria met. San Clemente Creek reach crests are limiting factor.
Criteria met. San Clemente Creek reach crests are limiting factor.
Alt 2 is slightly superior due to fewer steps, but critical locations for passage are same in both alts.
A2 Maintain a stable, sustainable channel in dynamic equilibrium
Nucleus boulders stable to 100 year flood. Diversion channel not connected to significant cobble/boulder supply. Full sediment continuity after 400 years.
Nucleus boulders stable to 100 year flood. Diversion channel connected to significant cobble/boulder supply. Full sediment continuity after 180 years.
Alt 2 is better connected to cobble/boulder supply than Alt 1, and will reach equilibrium 120 years sooner than Alt 1.
A3 Maintain existing criteria for CAW water intake
Head, influent flow and water quality criteria can be met.
Head, influent flow and water quality criteria can be met.
440 foot longer pipeline required in Alt 2. Otherwise identical performance characteristics.
Secondary Goals B1 Restore riparian habitat Achievable Achievable No difference
B2 Achieve fish passage for all steelhead life stages
Upstream migration of juveniles may be challenging due to step height.
Upstream migration of juveniles may be challenging due to step height.
Alt 2 is slightly superior due to fewer steps, but critical locations for passage are same in both alts.
B3 Create spawning habitat upstream of diversion reach
Field assessment suggests this goal is unlikely to be met due to low gradient and depositional character of reach.
1.1% riffle-pool channel in upper Carmel River reach should provide spawning habitat.
Alt 2 is superior to Alt 1.
B4 Restore sediment continuity downstream
Full sediment continuity will be restored after approximately 400 years.
Full sediment continuity will be restored after approximately 180 years.
Alt 2 is superior to Alt 1.
B5 Meter out spawning sediment following construction
Feasible with Alt 1 but locations constrained to diversion reach.
Feasible for Alt 2 with locations in either diversion reach or upper Carmel River reach.
Feasible in both alternatives, slightly easier to implement in Alt 2.
B6 Provide fish resting pool at Carmel/San Clemente confluence
Achievable Achievable No difference
B7 Create red legged frog habitat along the river corridor
Note: Step-pool geometry used in HEC-RAS modeling. Pool spacing is 60' in 2.5% reach and 56' in 2.7% reach. CS1 through CS5 correspond to the HEC-RAS cross section numbers as described in the report. Typical Step-Pool Plan for 2.5% and 2.7% Reaches
Note: Step-pool geometry used in HEC-RAS modeling. Pool spacing is 60' in 2.5% reach and 56' in 2.7% reach. CS1 through CS5 correspond to the HEC-RAS cross section numbers as described in the report. Typical Step-Pool Profile for 2.5% and 2.7% Reaches
Fig6-3&6-4CrossSectionPlots.xls/ San Clemente Cross Sections
Notes: Constricted pool and crest cross sections through San Clemente Reach. Manning's n values are shown on the top and are typical of the reach. Roughness values vary depending on geometry of the floodplain.
Notes: Typical pool and crest cross sections through Diversion Reach. Manning's n values are shown on the top and are consistent for both pools and riffles. Valley hillslopes have a n value of 0.09.
San Clemente Dam Removalf i g u r e 6-4
Pool and Crest Cross Sections in Alt1 Diversion Reach
PWA Ref# 1908-00
520
525
530
535
540
545
550
555
560
565
570
850 900 950 1000 1050 1100 1150
Station (ft)
Elev
atio
n (ft
)
520
525
530
535
540
545
550
555
560
565
570
850 900 950 1000 1050 1100 1150
Station (ft)
Elev
atio
n (ft
)
0.08 0.065 0.12
Middle of Regular Pool (CS2)
Downstream of Crest (CS4)
0.05 0.08
Fig6-5-Hydrology.xls / Figure
Notes: Boxes represent steelhead migration window, based on timing (December 15 to June 15) and flow requirements (between 40 and 800 cfs). Blue line is Carmel River flow from USGS gage 11143200, located below confluence of Carmel River and San Clemente Creek.Source: USGS
7. CONSTRUCTION COST ESTIMATE, CONSTRUCTION ISSUES, AND
MONITORING & MAINTENANCE PLAN We have developed the following cost estimate based on the data used by MWH (2005) and our experience on recent channel restoration projects. 7.1 BEDROCK EXCAVATION The volume of bedrock was calculated by taking the existing topography (MWH) and 1921 USGS DTM and producing a composite terrain model of the post-project surface that included the exhumed San Clemente Creek canyon and the existing Carmel River reach. PWA cut the proposed MEI/MWH diversion channel through the ridgeline tying in with a location 3 feet below the 1921 surface (based on the observation of 3 feet of alluvium above the bedrock contact from the Kleinfelder borehole logs). We also lowered the diversion by 2 feet to ensure that there would not be a ‘hanging’ join at the junction of the San Clemente and diversion reaches. This difference produced a slightly larger excavated volume than MWH’s for Alternative 1. For Alternative 2 we projected a 1.1% channel from the junction point. We maintained a 1:1 side slope, so the rock cut is both wider and deeper than that proposed by MWH. Our unit bedrock cost was taken by dividing MWH’s total cost for the bedrock excavation and diversion dike placement and dividing by their total volume of rock. We used the same unit cost and multiplied by our new volumes. The true cost may be slightly higher than estimated since the original MWH estimate assumed rock blasting to produce relatively small boulders (1 foot diameter). We are assuming that approximately 500 nucleus boulders will be quarried from the ridge, with a size of approximately 6 feet by 4 feet by 2 feet (approximately 1,500 cubic yards of rock allowing for replacement boulders – see below). Quarrying and transporting these rocks may be more expensive than the assumed unit cost used, and should be revised following the geotechnical report. As an alternative to the use of boulder steps, in some reaches it may be desirable to create steps directly from bedrock during blasting. Such steps should conform with the hydraulic model (1.5 foot steps located every 50-60 feet with 4 foot deep pools, plus arrangements for larger resting pools). Where boulder steps are used, we assume that the bedrock diversion reach will be constructed with an irregular floor to increase boulder stability and to encourage step reformation in the event of a failure. We envisage either that large rocks (2-3 feet diameter) will be placed in transverse ribs across the diversion reach floor at 50 foot intervals to help secure alluvial sediment for floodplain plantings, or that the rock excavation will be carried out in a manner that creates bedrock ribs.
7.2 STEP-POOLS For the step-pools we took construction costs for similarly sized boulder step-pools and added a factor for inflation. This number will be sensitive to the quality and size of the rock that can be quarried out of the diversion reach, and should be revised following the geotechnical report. As an alternate approach in the reaches with the highest entrainment forces, it may be desirable to create the steps directly in the bedrock. This approach would require a more detailed cost estimate involving cutting rock with a high degree of precision. Steps should be designed with considerable flow heterogeneity so that at different flows different fish migration pathways open up (e.g. using a range of different rock sizes and shapes). 7.3 SIMULATED LANDSLIDES We recommend that replacement boulders be placed at intervals along the channel so that if nucleus boulders are washed out there is a source of new material, simulating the processes that would occur in a landslide. The boulders should be stacked at the angle of repose alongside the valley wall so that they will be undercut in a 50 year event. 7.4 CHANNEL GRADING For the channel grading costs in Alternative 2 we took the MWH total grading cost and back calculated a unit cost. We then multiplied this by the volume of the channel, assuming that both a channel and floodplain bench would be graded. If natural channel erosion is used (per the sub-alternatives) this cost may be ignored. 7.5 CHANNEL STABILIZATION We assume that the alluvial channel banks above the step-pools and in the riffle-pool reaches will be stabilized using a system of vegetated soil lifts (VSLs). VSLs involve laying down successive 1 foot lifts of soil in a biodegradable coir fabric with live cuttings of alder or other appropriate material between each lift. We assume 4 feet of lifts on both banks along the entire project length. This replaces the channel restoration item in the MWH report. 7.6 RANNEY INTAKE SYSTEM Alternative 1 will be identical to the MWH Alternative. Alternative 2 will require the intake to be relocated 440 feet upstream. We backcalculated the cost of the 30 inch pipeline and the cost of backfilling the additional length of pipe from the MWH tables, and pro-rated this by the additional length to estimate the total cost.
7.7 CONTINGENCIES AND UNCERTAINTIES It is important to understand the degree of uncertainty concerning the condition of the historic channel in the Lower San Clemente Reach, and the effect that this may have on the final channel construction. There will have to be an element of ‘field fitting’ or even ‘field redesign’ of the final channel once sediment is removed from the valley and the former channel is revealed. On excavation of the valley it is possible that the channel form may either be already suited for the project (e.g. appropriately sized bedrock step-pools may be present under the alluvial layers) or extensive modification including rock blasting may be necessary. It is highly likely that there may be local valley gradient changes that necessitate changing the step-pool dimensions, or if the wider reaches are flatter, moving to a riffle-pool design for some sub-reaches. We have not budgeted for issues such as the need for additional bedrock blasting in the Lower San Clemente Reach. Note that the costing adapted from MWH included items such as mobilization and demobilization, de-watering, erosion control etc as well as standard contingencies for cost overruns and unanticipated events. 7.8 REVEGETATION HTH developed two cost estimates based on the relative area of each habitat type under Alternatives 1 and 2. The basis for the cost estimate is included in Appendix 4. 7.9 PRELIMINARY COST ESTIMATE
MEI/MWH Alternative Alternative 1 Alternative 2
Volume of bedrock excavation 240,000 291,023 313,843 Cost per cubic yard $ 24 $ 24 $ 24 Cost of bedrock excavation $ 5,760,000 $ 6,984,552 $ 7,532,232 Step pools 46 38 Cost per step-pool $ 60,000 $ 60,000 Cost of step-pools $ 2,760,000 $ 2,280,000 Channel grading above diversion (cubic yards) 11,000 Cost per yard $ 5.31 Cost of grading $ 58,410 Stabilize banks and floodplain terrace (square feet along channel side) 15,600 15,600
TOTAL COST OF RESTORATION $ 9,960,000 $ 15,438,787
$ 15,781,339
1 Cost of channel restoration in MWH 2005 appears to include all channel and revegetation activities 7.10 MONITORING AND MAINTENANCE PLAN Although we have endeavored to design a stable channel, there is inherent risk in any channel restoration project, especially where a river is to be relocated. We recommend that the project is monitored for performance and stability as described below or by some other methods that obtain the same results. The monitoring program should be explicitly tied back to the project goals and objectives. Fish passage (Note: This should be taken as the ultimate indicator of project performance.)
Monitoring activity. Conduct redd surveys during migration period upstream of the project area or spawner survey to visually assess whether adult steelhead are capable of moving through the project area and reaching upstream spawning habitat.
Frequency. Biweekly between December 15th and May 31st for 5 years after the project implementation, then at least once every 5 years or after a 5-year flow event.
Trigger for action. If fish passage is blocked within or below the project reach intervention will be required.
Management response. Reconstruction of step-pools or other modification of fish passage barrier as appropriate.
The project should consider designing a portion of the channel that concentrates adult steelhead moving upstream so they can be enumerated, potentially using a DIDSON (Dual frequency
Identification SONar) or other methods for counting fish in turbid water; ideally fish monitoring should include a telemetry study using radio or acoustic methodology. Nucleus boulder stability
Monitoring activity. Visually assess structural stability, look for evidence of outflanking, rocks rolling into scour pools, rocks becoming aligned downstream rather than across the channel, steps becoming too porous so that medium size boulders and cobbles are no longer retained.
Frequency: Annually for first 3 years, then every 5 years or following flows greater than 10-year flow.
Trigger for action: If the nucleus boulders appear too spread out and unconnected to each other to reform during a large event and the channel is transforming into a plane-bed system it should be closely scrutinized for fish passage. Local movement and realignment of rocks that does not appear to be affecting fish passage should not immediately trigger repair work. If fish passage is affected repair work should be triggered.
Management response. Reconstruction of step-pools or other modification of fish passage barrier as appropriate. Add additional boulders if existing rock appears too dispersed to support step-pool stability.
Channel migration or avulsion
Monitoring activity. Visually inspect for evidence of channel blockages that may trigger an avulsion around the step-pool reaches in the San Clemente and Alternative 1 Diversion Reaches (avulsions of the Carmel Reach or Alternative 2 Diversion Reach are not viewed as a problem).
Frequency: Annually for first 3 years, then every 5 years or following flows greater than 10-year flow.
Trigger for action: If the main channel is aggrading and there is evidence of secondary flow lines scouring so the thalweg elevations are converging.
Management response. If an avulsion threatened to completely outflank the step-pool system and flow for a considerable distance down the floodplain it is recommended that boulders be placed in the floodplain to act as grade control, and that if dense vegetation is becoming established in the mainstem this is cleared (e.g. stems smaller than 6 inches cut).
Bank stability
Monitoring activity. Visually inspect banks for evidence of excessive erosion.
Frequency: Annually for first 3 years.
Trigger for action: If the banks appear to be eroding before vegetation recruitment stabilizes them then action should be considered.
Management response. Patch or revegetate banks. If persistent erosion occurs consider adding harder protection e.g. large woody debris or rock protection.
Vegetation Establishment
Monitoring activity. Visually inspect riparian restoration areas for evidence of increasing vegetation establishment.
Frequency: Annually for first 10 years.
Trigger for action: Lack of trend towards increasing vegetation establishment.
Management response. Implement active revegetation efforts.
Chaney, Beverley. (2007) Personal Communication. Associate Fisheries Biologist, MPWMD. Chin, A. (1989) Step-pools in stream channels. Progress in Physical Geography, 13 (3), p. 391-408. Chin, A. (1999) The morphologic structure of step-pools in mountain streams. Geomorphology, 27, p. 191-204. Curran, J. C. (2007) Step-pool formation models and associated step spacing. Earth Surface Processes and Landforms, 32, 1611-1627. Dettman and Kelley. (1986) Assessment of the Carmel River Steelhead Resource. Volume 1. Biological Investigations. Prepared for the MPWMD. ENTRIX. (2006) San Clemente Dam Seismic Safety Project Draft EIR/EIS. Prepared for the USACE and CDWR, April 2006. Kleinfelder. (2002) Sediment characterization study: San Clemente Reservoir, Monterey County, California. Prepared for Mussetter Engineering Inc. Montgomery, D. R., and Buffington, J. M. (1997) Channel-reach morphology in mountain drainage basins. Geological Society of America Bulletin, 109(5), 596-611. Montgomery Watson Harza. (2005) Memo: San Clemente dam seismic safety EIR/EIS project description and cost estimate for Carmel River Bypass and Dam Removal Alternative. Mussetter Engineering, Inc. (2002a) Carmel River sediment-transport study. Prepared for California Department of Water Resources, Fresno, California, Project No. 01-05. Mussetter Engineering, Inc. (2002b) Evaluation of flood hazards associated with seismic retrofit alternatives for San Clemente Dam. Prepared for American Water Works Service Company, Voohees, New Jersey, Project No. 01-18. Mussetter Engineering, Inc. (2005) Hydraulic and sediment-transport analysis of the Carmel River bypass option, California. Quinn, TP. 2005. The Behavior and Ecology of Pacific Salmon and Trout. University of Washington Press, Seattle. 378 pages.
Trieste, D.J. and Jarrett, R.D. (1987) Roughness coefficients of large floods, In: James, L.G. and English, M.J., eds. Irrigation and Drainage Division Specialty Conference “Irrigation Systems for the 21st Century”, Portland, OR., 1987, Proceedings: New York, American Society of Civil Engineers, p.32–40. Urquhart, Kevan. (2007) Personal Communication. Senior Fisheries Biologist, MPWMD. Whitaker, J.G. (1987) Sediment transport in step-pool streams. In: Thorne, C.R. Bathurst, J.C., Hey, R.D. (Eds.) Sediment Transport in Gravel-bed Rivers. Wiley, Chichester, p. 545-579.
This report was prepared by the following PWA staff: Jeffrey Haltiner Andrew Collison Matt Wickland Rocko Brown Adam Parris Phairot Chatanantavet With the following H.T. Harvey & Associates staff: Sharon Kramer Dan Stephens Pat Reynolds Peter Nelson We would also like to acknowledge the suggestions and comments of the following people: Joyce Ambrosius (NOAA Fisheries), Mike Burke (Interfluve), Trish Chapman (Coastal Conservancy), Brian Cluer (NOAA Fisheries), Frank Emerson (Carmel River Steelhead Association), Laura Engeman (Coastal Conservancy), Blair Greimann (US Bureau of Reclamation), Larry Hampson – Monterey Peninsula Water Management District (MPWMD)), Monica Hunter (Planning and Conservation League), John Klein (CAW), Matt Kondolf (U.C. Berkeley), Paula Landis (CDWR), Kevan Urquhart (MPWMD), and Marcin Whitman (California Dept. of Fish & Game).
Subject: Calculation of particle entrainment thresholds for Upper Carmel Reach
Goal: estimate the combinations of channel gradient and water depth that will entrain particles of different sizes into the Carmel River and deliver them to the Diversion Reach. Assumptions
1. 1-D double trapezoidal open channel as shown below 2. D90 is ~ 10 inch cobble
Figure A.1 Cross-section through the diversion channel in the Upper Carmel Reach
where qt is volumetric sediment transport per unit width, R is nondimensional buoyant density = (ρs/ρ) –
1, ρs is rock density, ρ is density of water, g is gravitational acceleration, D is mean grain size, αt is a
coefficient in Meyer-Peter & Muller-type equation, nt is an exponent in Meyer-Peter & Muller-type
equation, ks is roughness height (analogous to Manning coefficient), qw is water discharge per unit width,
αr is a constant in the Manning-Strickler roughness relation, S is channel slope, τc* is critical Shields
number, H is water depth, and D90 is grain size such that 90 percent of the sediment is finer.
Note: For water discharge per unit width qw, it is already taken into account that it is a double trapezoidal shape channel (rather than rectangular). Values used: τc* = 0.03 (recommended by Sklar and Dietrich, 2004, for mountain streams, concluded from Buffington and Montgomery, 1997), αt = 5.7, nt = 1.5 from Fernandez Luque & van Beek (1976); αr = 8.1 for gravel streams (Parker, 1991); D90 = 10 inch, Q2 = 1932 cfs, Q5 = 5445 cfs. Method: calculate S based on other specified parameters so that sediment transport for that grain size > 0. For Q2: Boulder Size, inch
Slope required for Q2 Water depth or required
bankfull depth for Q2 (ft) Water depth (ft) in case of S
= 0.01: alternative 2 6 0.005 5.3 4.4
12 0.012 4.2 (particles not moved) 18 0.021 3.6 (particles not moved) 24 0.03 3.3 (particles not moved) 30 0.041 3.1 (particles not moved)
bankfull depth for Q5 (ft) Water depth in case of S =
0.01: alternative 2 6 0.003 10.2 7.5
12 0.006 8.5 7.5 18 0.01 7.5 7.5 24 0.015 6.7 (particles not moved) 30 0.02 6.2 (particles not moved)
Summary: If we use a 1% slope (per Alternative 2) so that the upstream end of the 1% diversion channel will be at the downstream limit of cobbles, within the magnitude of 5-year floods, boulder sizes of up to 18 inches will be entrained. However, in order to move sizes 24 and 30 inches, a flow higher than Q5 is needed for S = 0.01. Assuming the double trapezoidal cross section in Figure A1. For S = 1.0%, in order to move size 24 inches, Q = 9400 cfs is required (flow depth = 9.9 ft). For S = 1.1%, in order to move size 24 inches, Q = 8200 cfs is required (flow depth = 9.0 ft). Note that the depth from excavation may not be deep enough to confine the flow. References Buffington, J.M. and Montgomery, D.R. (1997) A systematic analysis of eight decades of incipient motion studies, with special reference to gravel-bedded rivers, Water Resources Research, 33, 1993-2029. Sklar, L.S., and Dietrich, W.E. (2004) A mechanistic model for river incision into bedrock by saltating bed load, Water Resources Research, 40, W06301.
Appendix
APPENDIX 2 Percentage of Time Fish Passage Criteria are Met During Potential Migration Events for Years
2000 through 2007
CodesWY 2000 Max Passable Flow 800 cfs 1 Meets flow range and channel velocity requirements12/15 to 5/30 Min Passable Flow 40 cfs 2 Meets flow range requirement and fails channel velocity requirem
Max Pool Velocity 3 fps 3 Fails flow range requirementMax Crest Velocity 6 fps 4 Meets flow range and overbank depth and velocity
requirements and fails channel velocity requirement5 Meets flow range and overbank depth requirements
and fails channel and overbank velocity requirements
CodesWY 2001 Max Passable Flow 800 cfs 1 Meets flow range and channel velocity requirements12/15 to 5/30 Min Passable Flow 40 cfs 2 Meets flow range requirement and fails channel velocity requirem
Max Pool Velocity 3 fps 3 Fails flow range requirementMax Crest Velocity 6 fps 4 Meets flow range and overbank depth and velocity
requirements and fails channel velocity requirement5 Meets flow range and overbank depth requirements
and fails channel and overbank velocity requirements
CodesWY 2002 Max Passable Flow 800 cfs 1 Meets flow range and channel velocity requirements12/15 to 5/30 Min Passable Flow 40 cfs 2 Meets flow range requirement and fails channel velocity requirem
Max Pool Velocity 3 fps 3 Fails flow range requirementMax Crest Velocity 6 fps 4 Meets flow range and overbank depth and velocity
requirements and fails channel velocity requirement5 Meets flow range and overbank depth requirements
and fails channel and overbank velocity requirements
CodesWY 2003 Max Passable Flow 800 cfs 1 Meets flow range and channel velocity requirements12/15 to 5/30 Min Passable Flow 40 cfs 2 Meets flow range requirement and fails channel velocity requirem
Max Pool Velocity 3 fps 3 Fails flow range requirementMax Crest Velocity 6 fps 4 Meets flow range and overbank depth and velocity
requirements and fails channel velocity requirement5 Meets flow range and overbank depth requirements
and fails channel and overbank velocity requirements
CodesWY 2004 Max Passable Flow 800 cfs 1 Meets flow range and channel velocity requirements12/15 to 5/30 Min Passable Flow 40 cfs 2 Meets flow range requirement and fails channel velocity requirem
Max Pool Velocity 3 fps 3 Fails flow range requirementMax Crest Velocity 6 fps 4 Meets flow range and overbank depth and velocity
requirements and fails channel velocity requirement5 Meets flow range and overbank depth requirements
and fails channel and overbank velocity requirements
CodesWY 2005 Max Passable Flow 800 cfs 1 Meets flow range and channel velocity requirements12/15 to 5/30 Min Passable Flow 40 cfs 2 Meets flow range requirement and fails channel velocity requirem
Max Pool Velocity 3 fps 3 Fails flow range requirementMax Crest Velocity 6 fps 4 Meets flow range and overbank depth and velocity
requirements and fails channel velocity requirement5 Meets flow range and overbank depth requirements
and fails channel and overbank velocity requirements
CodesWY 2006 Max Passable Flow 800 cfs 1 Meets flow range and channel velocity requirements12/15 to 5/30 Min Passable Flow 40 cfs 2 Meets flow range requirement and fails channel velocity requirem
Max Pool Velocity 3 fps 3 Fails flow range requirementMax Crest Velocity 6 fps 4 Meets flow range and overbank depth and velocity
requirements and fails channel velocity requirement5 Meets flow range and overbank depth requirements
and fails channel and overbank velocity requirements
CodesWY 2007 Max Passable Flow 800 cfs 1 Meets flow range and channel velocity requirements12/15 to 5/30 Min Passable Flow 40 cfs 2 Meets flow range requirement and fails channel velocity require
Max Pool Velocity 3 fps 3 Fails flow range requirementMax Crest Velocity 6 fps 4 Meets flow range and overbank depth and velocity
requirements and fails channel velocity requirement5 Meets flow range and overbank depth requirements
and fails channel and overbank velocity requirements
Purpose: This appendix presents the methodology, assumptions, and results for the preliminary sizing of nucleus boulders for constructed step-pools using force balance approaches outlined by Helley (1969), Graf (1971), and Chanson (2005). This approach was used because many common particle stability analyses assume a perfect sphere, which may not be valid as large boulders supplied from quarrying are typically irregular in nature. Moreover, inspection of the principal forces on a submerged boulder under flowing water (drag, lift, boulder weight) reveals that overall boulder size needed for stability can be reduced using shapes that reduce the surface area, As, in which drag and lift are effective, while maintaining sufficient weight and volume (Vs) for stability. Assumptions:
1. Boulders will be either tabular or elliptical in shape (see figures A.3.1 and A.3.2). 2. There are no other structural points of contact for the boulder 3. 1' of boulder is buried below bed and thus bed slope is negligible 4. Boulder length perpendicular to flow is equal to Ws. 5. The length, Ls, of the boulders was kept at 6 feet. 6. 1D uniform flow
Where ρs = sediment density, ρ = water density, g = gravity, Vs = stone volume, Ws = boulder width parallel to flow, As = boulder area perpendicular to flow, U = design velocity, Hs = height of stone above bed, Ls = length of boulder perpendicular to flow, SG = specific gravity, CD =drag coefficient, C’D = modified drag coefficient, CL = lift coefficient, MRD = drag turning arm (see Helley, 1969 for derivation), MRL = lift turning arm (see Helley, 1969 for derivation), Uc = critical velocity, Fs = factor of safety. Note: Factors of safety for elliptical stones are may be less than tabular stones, which is counterintuitive. This is attributed to the modified drag coefficient used in the derivation for critical velocity by Helley (1969). Values used: ρs = 155 lbs/ ft3, ρ = 62.4 lbs/ ft3, g = 32.2 ft/s2, SG = 2.65, CD =.75 (Munson et al., 2005), C’D = (1-Hs/1)*CD (Helley, 1969), CL = 0.2 (Munson et al., 2005), U= design velocities from HEC-RAS. Method: Using design velocities determine range of stable nucleus boulder sizes associated with recurrence interval discharges to achieve a satisfactory factor of safety. Channel hydraulics were simulated using HEC-RAS and the assumptions of 1D uniform flow should be noted. Moreover, for rock sizing purposes the roughness coefficients used in HEC-RAS were modified by a factor of 2.2 as recommended by Trieste and Jarrett (1987). This was done because using typical roughness values in the model areas of super critical flow were found and this was interpreted as unrealistic for large floods. Results: Table A.3.1 – Factor of Safety for tabular and elliptical rock sizing for rocks that are 6 feet long (perpendicular to flow) by 4 feet (base width) by 1.5 feet high (2.5 feet high, buried to a depth of 1 foot).
Summary: Stable nucleus boulders will need to be roughly 4 feet wide by 6 feet long by 2.5 feet high, with a bed key of at least one foot. Pending further design refinement, nucleus boulder geometries can be refined to meet overall project objectives. Further design sizing exercises may want to assume additional points of contact to more realistically simulate anticipated design conditions. References Chanson H. 2004. The Hydraulics of Open Channel Flows. Elsevier. USA. Graf, WH. 1971. Hydraulics of Sediment Transport. McGraw-Hill. USA. Helley EJ. 1969. Field Measurements of the Initiation of Large Bed Particle Motion in Blue Creek Near Klamath, California. USGS Professional Paper 562-G. Munson BR, Young DF, Okiishi TH. 2005. Fundamentals of Fluid Mechanics. 5th Ed. Wiley. USA. Trieste DJ, Jarrett RD. 1987. Roughness Coefficients of Large Floods. Irrigation and Drainage Division Specialty Conference. Portland Or.
InputOutput
Rock Height Hs 2.5 ftRock Length
(Perpendicular to stream flow) Ls 6 ft
Rock Width Ws 4 ftDepth Keyed Dk 1 ftRock Volume Vs 60 ft3
Rock Area As 15 ft2
Hydraulic Inputs
Velocity U 26.50 ft/sDepth D 40.13 ft/s
Resisting Gravity (p s -p ) gVs 178,903 W s /2 2 (p s -p ) gVs(Ws/2) 357,806Drag Cdp AsU
2/2 246,490 H s -D k 1.5 Cdp As(U2/2)Hs 369,735
Lift CLp AsU2/2 65,731 H s -D k 1.5 CLp As(U
2/2)Ws 98,596
Stable NOFactor of Safety MW/(MFD+MFL) 0.76
Based on force balance analyses presented by Graf (Mechanics of Sediment Transport, 1971) and Chanson (The Hydraulics of Open Channel Flows; 2004)
Driving
MomentMoment Arm
Rock/Clast Inputs
Forces
PMF Design Event
InputOutput
Rock Height Hs 2.5 ftRock Length
(Perpendicular to stream flow) Ls 6 ft
Rock Width Ws 4 ftDepth Keyed Dk 1 ftRock Volume Vs 60 ft3
Rock Area As 15 ft2
Velocity U 23.05 ft/s
Depth D 23.47 ft/s
Resisting Gravity (p s -p ) gVs 178,903 W s /2 2 (p s -p ) gVs(Ws/2) 357,806Drag Cdp AsU
2/2 186,487 H s -D k 1.5 Cdp As(U2/2)Hs 279,731
Lift CLp AsU2/2 49,730 H s -D k 1.5 CLp As(U
2/2)Ws 74,595
Stable YESFactor of Safety MW/(MFD+MFL) 1.01
Velocity U 22.85 ft/sDepth D 20.83 ft/s
Resisting Gravity (p s -p ) gVs 178,903 W s /2 2 (p s -p ) gVs(Ws/2) 357,806Drag Cdp AsU
2/2 183,265 H s -D k 1.5 Cdp As(U2/2)Hs 274,897
Lift CLp AsU2/2 48,871 H s -D k 1.5 CLp As(U
2/2)Ws 73,306
Stable YESFactor of Safety MW/(MFD+MFL) 1.03
Hydraulic InputsVelocity U 19.36 ft/sDepth D 16.95 ft/s
Resisting Gravity (p s -p ) gVs 178,903 W s /2 2 (p s -p ) gVs(Ws/2) 357,806Drag Cdp AsU
2/2 131,558 H s -D k 1.5 Cdp As(U2/2)Hs 197,337
Lift CLp AsU2/2 35,082 H s -D k 1.5 CLp As(U
2/2)Ws 52,623
Stable YESFactor of Safety MW/(MFD+MFL) 1.43
Based on force balance analyses presented by Graf (Mechanics of Sediment Transport, 1971) and Chanson (The Hydraulics of Open Channel Flows; 2004)
Driving
Rock/Clast Inputs
Hydraulic Inputs
Hydraulic Inputs
Driving
Driving
Design Event
Forces Moment Arm
Forces
10 YrDesign Event
Moment
Forces Moment Arm Moment
Moment Arm
Design Event 100 Yr
50 Yr
Moment
InputOutput
Rock Height Hs 1.5 ftRock Length (Perpendicular to stream
flow) Ls 6 ftRock Width Ws 4 ft
Depth Keyed Dk 1 ftModified Drag Based on Depth Keyed C' D 0.25
Stone Angle (Angle of W s to bed) θB 0.00 Degrees
θB 0.0 Radians
Design Event PMF
Hydraulic Inputs
Velocity U 26.50 ft/s
LiftTurning Arm MRL 1.00Drag Turning Arm MRD 0.80
Critical Velocity Uc 27.24Factor of Safety U c /U 1.03
Source: Based on "Field Measurements of the Initian of Large Bed Particle Motion in Blue Creek Near Klamath, California." USGS Professional Paper 562-G. 1969.
Rock/Clast Inputs
( ) ( ) )( )⎟
⎟⎠
⎞⎜⎜⎝
⎛+
+−=
MRLMRDHCMRLWHSG
usD
ssc ***178.0***
***1276.3
γβγγ
InputOutput
Rock Height Hs 1.5 ftRock Length (Perpendicular to stream
flow) Ls 6 ftRock Width Ws 4 ft
Depth Keyed Dk 1 ftModified Drag Based on Depth Keyed C' D 0.25
Stone Angle (Angle of W s to bed) θB 0.00 Degrees
θB 0.0 Radians
Design Event 100YR
Hydraulic Inputs
Velocity U 23.05 ft/s
LiftTurning Arm MRL 1.00Drag Turning Arm MRD 0.80
Critical Velocity Uc 27.24Factor of Safety U c /U 1.18
Design Event 50 YR
Hydraulic Inputs
Velocity U 22.85 ft/s
LiftTurning Arm MRL 1.00Drag Turning Arm MRD 0.80
Critical Velocity Uc 32.47Factor of Safety U c /U 1.42
Design Event 10 YR
Hydraulic Inputs
Velocity U 19.36 ft/s
LiftTurning Arm MRL 1.00Drag Turning Arm MRD 0.80
Critical Velocity Uc 32.47Factor of Safety U c /U 1.68
Source: Based on "Field Measurements of the Initian of Large Bed Particle Motion in Blue Creek Near Klamath, California." USGS Professional Paper 562-G. 1969.
Rock/Clast Inputs
( ) ( ) )( )⎟
⎟⎠
⎞⎜⎜⎝
⎛+
+−=
MRLMRDHCMRLWHSG
usD
ssc ***178.0***
***1276.3
γβγγ
( ) ( ) )( )⎟
⎟⎠
⎞⎜⎜⎝
⎛+
+−=
MRLMRDHCMRLWHSG
usD
ssc ***178.0***
***1276.3
γβγγ
( ) ( ) )( )⎟
⎟⎠
⎞⎜⎜⎝
⎛+
+−=
MRLMRDHCMRLWHSG
usD
ssc ***178.0***
***1276.3
γβγγ
Appendix
APPENDIX 4 Revegetation Cost Estimate
SAN CLEMENTE DAM RESTORATION COST ESTIMATE- ALTERNATIVE 112/13/2007
AREA
LENGTH OF REVEGETATION AREA
NUMBER OF CHANNEL SIDES
# SRA REVEGETATION UNITS*
# FLOODPLAIN REVEGETATION UNITS* RU COST TOTAL COST
San Clemente Creek Reach SRA*** 2900 2 22.0 $4,320 $190,080San Clemente Creek Reach Floodplain** 2900 2 9.7 $4,320 $83,520Diversion Reach SRA 450 2 4.5 $4,320 $38,880Diversion Reach Floodplain** 450 2 1.5 $4,320 $12,960Carmel River Reach SRA 0 $4,320 $4,320Carmel River Reach Floodplain** 0 $4,320 $4,320
TOTALS 26.5 11.2 $334,080
* A Revegetation Unit consists of an area 25 ft x 100ft installed with 6 live root wads 20 ft o.c. and 100 live cuttingsUnit Cost # Cost
** For floodplain planting areas assume installation of one Revegetation Unit every 300 linear feet
*** San Clemente reach length: 700 ft upper San Clemente and 2200 ft lower San Clemente
Soils Costs:San Clemente Reach- salvage 1 foot of topsoil, stockpile and respreadDiversion Channel respread some soil on slopes from onsite salvage soils
Length Width Depth Cu Yds Unit Cost Total CostSan Clemente Reach 2900 300 1 32222 $15 $483,333Diversion Channel 450 200 0.5 1667 $15 $25,000