Journal of Financial Economics 51 (1999) 3 — 44 An analysis of compensation in the U.S. venture capital partnership1 Paul Gompers, Josh Lerner* Harvard Business School, Boston, MA 02163, USA and National Bureau of Economic Research Received 7 October 1996; received in revised form 15 December 1997 Abstract Venture capital limited partnerships are an attractive arena to study cross-sectional and time-series variations in compensation schemes. We empirically examine 419 part- nerships. The compensation of new and smaller funds displays considerably less sensitiv- ity to performance and less variation than that of other funds. The fixed base component of compensation is higher for younger and smaller firms. We observe no relation between incentive compensation and performance. Our evidence is consistent with a learning model, in which the pay of new venture capitalists is less sensitive to performance because reputational concerns induce them to work hard. ( 1999 Elsevier Science S.A. All rights reserved. PACS: G23; G35; L14 Keywords: Venture capital; Private equity; Contract; Limited partnership * Corresponding author. Tel.: 617/495-6065; fax: 617/496-7357; e-mail: jlerner@hbs.edu. 1 Helpful comments were provided by Gary Chamberlain, Michael Gibbs, Steven Kaplan, Stacey Kole (the referee), Kevin J. Murphy, Canice Prendergast, Raghu Rajan, Jay Ritter, William Sahlman, Andrei Shleifer and Jerry Warner (the editor), as well as seminar participants at the American Finance Association meetings, Babson College, Columbia University, Harvard Univer- sity, Hebrew University in Jerusalem, the NBER Corporate Finance Group, Tel-Aviv University, and the University of Chicago junior faculty workshop. We thank the Aeneas Group, Kemper Financial Services, Venture Economics, and a major corporate pension fund — and especially Michael Eisenson, Kelly McGough, Robert Moreland, Jesse Reyes, and Scott Sperling — for access to their files. Jay Light, William Sahlman, and Jeffry Timmons helped us in this process. We also thank Tom Judge of AT & T and Paul Price of State Street Bank. Research assistance was provided by Meredith Fitzgerald, Leo Huang, Brian Hunt, Bac Nguyen, and Jay Yang. We thank the Center for Research in Security Prices (Gompers) and the Division of Research at Harvard Business School (Lerner) for financial support. All errors are our own. 0304-405X/99/$ — see front matter ( 1999 Elsevier Science S.A. All rights reserved PII: S 0 3 0 4 - 4 0 5 X ( 9 8 ) 0 0 0 4 2 - 7
Transcript
Journal of Financial Economics 51 (1999) 3— 44
An analysis of compensation in the U.S. venture capitalpartnership1
Paul Gompers, Josh Lerner*Harvard Business School, Boston, MA 02163, USA and National Bureau of Economic Research
Received 7 October 1996; received in revised form 15 December 1997
Abstract
Venture capital limited partnerships are an attractive arena to study cross-sectionaland time-series variations in compensation schemes. We empirically examine 419 part-nerships. The compensation of new and smaller funds displays considerably less sensitiv-ity to performance and less variation than that of other funds. The fixed base componentof compensation is higher for younger and smaller firms. We observe no relation betweenincentive compensation and performance. Our evidence is consistent with a learningmodel, in which the pay of new venture capitalists is less sensitive to performance becausereputational concerns induce them to work hard. ( 1999 Elsevier Science S.A. Allrights reserved.
1Helpful comments were provided by Gary Chamberlain, Michael Gibbs, Steven Kaplan, StaceyKole (the referee), Kevin J. Murphy, Canice Prendergast, Raghu Rajan, Jay Ritter, WilliamSahlman, Andrei Shleifer and Jerry Warner (the editor), as well as seminar participants at theAmerican Finance Association meetings, Babson College, Columbia University, Harvard Univer-sity, Hebrew University in Jerusalem, the NBER Corporate Finance Group, Tel-Aviv University,and the University of Chicago junior faculty workshop. We thank the Aeneas Group, KemperFinancial Services, Venture Economics, and a major corporate pension fund — and especiallyMichael Eisenson, Kelly McGough, Robert Moreland, Jesse Reyes, and Scott Sperling — for accessto their files. Jay Light, William Sahlman, and Jeffry Timmons helped us in this process. We alsothank Tom Judge of AT & T and Paul Price of State Street Bank. Research assistance was providedby Meredith Fitzgerald, Leo Huang, Brian Hunt, Bac Nguyen, and Jay Yang. We thank the Centerfor Research in Security Prices (Gompers) and the Division of Research at Harvard Business School(Lerner) for financial support. All errors are our own.
0304-405X/99/$— see front matter ( 1999 Elsevier Science S.A. All rights reservedPII: S 0 3 0 4 - 4 0 5 X ( 9 8 ) 0 0 0 4 2 - 7
1. Introduction
This paper explores the cross-sectional and time-series variation in thecompensation specified in venture capital limited partnership agreements.These partnerships have several features which make them particularly attract-ive for empirical study. First, the partnership agreement signed at the fund’sinception clearly defines the compensation over the fund’s life, which is usuallya decade or more. Typically, these agreements designate a percentage of thefund’s capital or assets as an annual management fee, and a percent of the profitsto be paid out as investment returns are realized. Compensation is based onobservable and verifiable returns from the venture fund’s investments. Whilecompensation in the different funds raised by a venture organization may differ,the individual partnership agreements are rarely renegotiated, unlike executiveemployment contracts. Second, contractually specified compensation is parti-cularly important in the venture capital setting. Investors in venture funds, thelimited partners, cannot utilize many of the methods of disciplining managersfound in corporations, such as dismissal, the active involvement of boards ofdirectors, and the market for corporate control. In order to maintain theirlimited liability, investors must avoid direct involvement in the fund’s activities.Removing a venture capitalist, a general partner, is a difficult and costlyprocedure. Consequently, as Venture Economics (1989b) notes, compensation is‘one of the most contentious issues between limited and general partners ofventure funds’. Third, venture organizations are heterogeneous. The differencesacross venture groups and the evolution of these organizations over time allowus to empirically identify which factors affect compensation terms. Finally,compensation plans resembling those in venture partnerships are becomingincreasingly common. Similar schemes are found in funds devoted to leveragedbuyout, mezzanine, real estate, and oil-and-gas investments, as well as hedgefunds. Estimates suggest that equity investments in such funds totaled betweenone-half and one trillion dollars at the beginning of 1995. Because these organ-izations often make leveraged investments, the funds controlled assets worthseveral times this amount. We are unaware of any prior research that hasexamined the factors that influence contractual terms in a panel of agreementssimilar to ours.
Our analysis examines compensation terms in 419 venture partnership agree-ments and offering memoranda for funds formed between 1978 and 1992. Weexamine the cross-sectional differences in compensation, comparing one venturecapital organization to another, as well as the time-series variation, examininghow contracts change as organizations become more seasoned. We find thatcompensation for older and larger venture capital organizations is more sensi-tive to performance than the compensation of other venture groups. Forexample, the oldest and largest venture groups command about a one percentgreater share of the capital gains than their less-established counterparts. This
4 P. Gompers, J. Lerner/Journal of Financial Economics 51 (1999) 3—44
greater profit share matters little if the fund is not successful, but can representa 4% or greater increase in the net present value of total compensation if thefund is successful. These differences are statistically significant whether weexamine the percentage of profits accruing to the venture capitalists (althoughthese analyses are very noisy) or the elasticity of compensation with respect toperformance. The cross-sectional variation in compensation terms for younger,smaller venture organizations is considerably less than for older, larger organ-izations. The fixed component of compensation is higher for smaller, youngerfunds and funds focusing on high-technology or early-stage investments.Finally, we do not find any relationship between incentive compensation andperformance.
We discuss two models that might explain the cross-sectional and time-seriesvariation in compensation, a learning and a signaling model. The empiricalresults are consistent with the primary predictions of the learning model. In thelearning model, neither the venture capitalist nor the investor knows the venturecapitalist’s ability. In his early funds, the venture capitalist will work hard evenwithout explicit pay-for-performance incentives because, if he can establisha good reputation for either selecting attractive investments or adding value tofirms in his portfolio, he will gain additional compensation in later funds. Thesereputation concerns lead to lower pay-for-performance provisions for smallerand younger venture organizations. Once a reputation has been established,explicit incentive compensation is needed to induce the proper effort levels. Thesignaling model, in which the venture capitalist knows his ability but investorsdo not, predicts that new funds should have higher pay-for-performance sensi-tivities and lower base compensation, because high-ability venture capitalists tryto reveal their type by accepting riskier pay.
The paper is organized as follows. A brief overview of the venture capitalindustry is presented in Section 2. Section 3 discusses the theoretical models ofthe determinants of compensation. Section 4 describes the sample of partnershipagreements, which are analyzed in Section 5. Section 6 examines the relation-ship between incentive compensation and performance. Section 7 concludes thepaper.
2. The venture capital industry2
Venture capitalists invest in young, high-potential companies. Througha combination of careful due diligence, intensive monitoring, and direct assistance,the venture capitalist seeks to create companies that can eventually go public.
2This discussion is based upon Gompers and Lerner (1996).
P. Gompers, J. Lerner/Journal of Financial Economics 51 (1999) 3—44 5
Well-known firms like Compaq, Genentech, Intel, Microsoft, Netscape, Staples,and Starbucks all received venture capital financing. Nearly one-third of allcompanies going public in recent years have received venture capital backing(Barry et al., 1990).
The first modern venture capital firm, American Research and Develop-ment (ARD), was formed in 1946. Because institutional investors werereluctant to invest, ARD was structured as a publicly traded closed-endfund, marketed mostly to individuals (Liles, 1977). The few other ventureorganizations begun in the decade after ARD’s formation were also structuredas closed-end funds. The venture capital industry, which annually raised nomore than a few hundred million dollars in the 1960s and 1970s, grew explosive-ly after 1978 due to two regulatory changes. These changes were the reductionof capital gains tax rates in 1978 and the U.S. Department of Labor’s reinter-pretation of pension investment rules in 1979. Fueled by pension investments,annual commitments to venture funds increased by a factor of ten in less thana decade.
An associated change in the venture capital industry during this period wasthe rise of the limited partnership as the dominant organizational form. The firstventure capital limited partnership was formed in 1958, but limited partnershipsremained a relatively small fraction of the venture capital pool until the end ofthe 1970s. During the 1980s and 1990s, however, over 80% of the capitalcommitted to venture funds went to limited partnerships. Venture partnershipshave pre-determined, finite lifetimes, usually ten years, although extensions ofbetween one and three years are often allowed. Most venture organizations raisefunds by forming partnerships every two to five years. The typical venture fundmakes one to two dozen investments over its life-span. In a venture capitallimited partnership, the venture capitalists are general partners and control thefund’s activities. The typical fund has between two and ten general partners. Theinvestors serve as limited partners. Investors can monitor the fund’s progress,but cannot become involved in the fund’s day-to-day management if they are toretain limited liability. Compensation is therefore the most important contrac-tual mechanism for aligning the incentives of the venture capitalist and hisinvestors.
The limited partnership agreement explicitly specifies the terms that governthe venture capitalists’ compensation over the entire ten-to-thirteen year life ofthe fund. It is extremely rare that these terms are renegotiated. The specifiedcompensation has a simple form. The venture capitalist typically receives anannual fixed fee, plus variable compensation that is a specified fraction of thefund’s profits. The fixed portion of the specified compensation is usually between1.5% and 3% of the committed capital or net asset value, and the variableportion is usually about 20% of fund profits. The simplicity and specificity of thecontracts enable us to examine how the fixed and variable compensation differacross venture organizations and over time.
6 P. Gompers, J. Lerner/Journal of Financial Economics 51 (1999) 3—44
3. Determinants of venture capitalist compensation
This section explores how information about the venture capitalist’s abilityshould affect the time-series and cross-sectional variation of compensation forventure capitalists for both fixed and variable pay. We discuss two stylizedmodels that generate predictions which frame the empirical analyses. In Sec-tion 3.1, we adapt the compensation model from Gibbons and Murphy (1992) tothe venture capital setting and derive the equilibrium compensation to explorethe learning model. We assume that initially there is symmetric uncertaintyabout the ability of the venture capitalist. In Section 3.2, we assume the venturecapitalist, but not the investor, is initially informed about the venture capitalist’sability in our discussion of the signaling model. Appendices A and B discuss themodels in detail.
3.1. The learning model
An abstraction of the learning model is the assumption that venture capital-ists raise two funds (partnerships) in two consecutive periods. The outcome ofinvestments in the first fund, including any investment returns, are realized priorto the second fund being raised. No projects shift from the first fund to thesecond. The fund return is a function of the venture capitalists’ ability to bothselect high-quality projects and add value after the investment, their effort, andnoise. While the venture capitalists’ ability either to select attractive projects orto add value after the investment is uncertain, both venture capitalists andinvestors know the distribution of abilities in advance. Investors cannot observethe effort level chosen in either fund, because this information is private. Theventure capitalists’ compensation is assumed to be a linear function of fundreturns.
Compensation contracts are written for each fund and are conditionalon the information available from returns, if any exist. The compensa-tion contract is set out before effort is chosen or investments are made.Investors in both funds can, but need not, be the same. Investors in the secondfund, however, have verifiable information about the performance of the firstfund.
The learning model has five implications for venture capitalist compensa-tion:
f ¸evel of pay-for-performance sensitivity over time. The sensitivity of compensa-tion to performance is higher in the venture capitalists’ second fund. Venturecapitalists have an incentive to work hard in their first fund because, if theyincrease effort, investors think they have higher ability. (This relation holdsfor fixed expectations about equilibrium effort choice.) Greater effort not only
P. Gompers, J. Lerner/Journal of Financial Economics 51 (1999) 3—44 7
increases current income, but also raises total compensation in the secondperiod.3
f ¸evel of fixed fees over time. The learning model is ambiguous about therelative fixed fees in new and old venture firms. While the level of variablecompensation unambiguously increases in established venture firms, fixedfees could rise, fall, or remain unchanged.
f ¸evel of fixed fees and effort level. Because we assume a Nash bargainingsolution, fixed fees incorporate the cost of effort such that the higher the costof effort, the higher the fixed fees. All else being equal, higher investment andmonitoring costs lead the venture capitalists to receive higher fixed fees.
f »ariance in pay-for-performance sensitivity over time. This model also predictsthat the cross-sectional variance should be lower for new and smaller ventureorganizations than for established organizations. Compensation schemes forsmall, young venture capital organizations should be clustered, becauseneither the venture capitalists nor the investors know the venture capitalists’abilities. As venture capitalists’ abilities become known, compensationschemes can reflect the updated information about ability. If there is a distri-bution of abilities, then the cross-sectional variance of variable compensationshould be higher for larger, older venture capital organizations.
f ¸evel of pay-for-performance sensitivity and performance. Finally, the learningmodel predicts that pay-for-performance sensitivity across periods should beunrelated to the performance of the venture capital fund. In the first period,even though pay-for-performance is lower, the venture capitalist is driven towork hard by the desire to establish a reputation. In the second period, higherexplicit incentives are required because the potential for higher compensationin the next period is not there. Put another way, incentive compensation isendogenous and elicits the optimal effort given the perceived ability of theventure capitalist. In a cross-section of venture capital funds, pay sensitivityshould have no predictive power for performance.
3The comparison of first and second fund compensation can be viewed as indicative of patternsamong venture capitalists with and without established reputations. If a venture capital firm hasestablished a good reputation, it needs explicit incentives in the form of high pay-for-performancesensitivity in order to induce effort. To empirically assess this claim, we will use venture organizationage and size as proxies for reputation. Older and larger venture capital organizations are likely tohave established reputations, and therefore need higher pay sensitivities to induce the desired effortlevel. New and smaller venture organizations work harder because they seek to establish a reputa-tion that will allow them to command greater compensation in future funds. This implicit incentivemeans that less pay-for-performance sensitivity is necessary for small, young venture firms. Animportant issue that we do not model is whether reputation adheres to the venture organization orthe individual venture capitalists. While we show in the empirical analysis below that establishedventure capital organizations tend to be comprised of more experienced venture capitalists, explor-ing the ways in which reputation resides in and transfers between financial institutions is a fertiletopic for future research.
8 P. Gompers, J. Lerner/Journal of Financial Economics 51 (1999) 3—44
3.2. The signaling model
The principal-agent literature demonstrates that the nature of contractschanges dramatically once informational assumptions are altered. In the learn-ing model, investors and venture capitalists both have the same initial informa-tion about venture capitalists’ abilities. Symmetric uncertainty leads to thecentral result. If venture capitalists have better information before entering intothe contract, however, the possible contracts signed in equilibrium stateschange. Under certain assumptions, high-ability venture capitalists will attemptto signal their type through the contracts they offer to investors in the firstperiod.4
In this simple signaling model, the second fund’s variable compensation is thesame for high- and low-ability venture capitalists. This result follows from ourassumption that marginal productivity after the first unit of effort and effortcosts of both types of venture capitalists are identical. Because types are fullyrevealed in the first fund, second period compensation differs only in the basecompensation. High-ability venture capitalists receive higher fixed fees in sub-sequent funds. Once the type of the high-ability venture capitalists has beenrevealed, they desire more insurance, and hence receive higher fixed compensa-tion and less variable compensation.
Deriving optimal first period compensation schemes is more difficult. Theseclasses of signaling models usually have a continuum of equilibria. Becauselow-ability venture capitalists set their compensation for their second fundunder full information about ability, their optimal first fund contract will beidentical to the optimal second fund contract. Low-ability venture capitalists actas if their type is completely known in their first fund.
High-ability venture capitalists offer a contract that maximizes their utility,subject to the constraint that low-ability venture capitalists are just indifferentbetween accepting this contract and their own. As shown in Appendix B, thevariable compensation for the high-ability venture capitalists in the first fund ismore sensitive to performance than it is in the second fund. Likewise, the fixedcomponent of compensation is smaller in the first fund. The fixed component ina first fund contract might even be negative, in which case high-ability venturecapitalists would pay for the opportunity to invest in start-up companies in theirfirst fund. In order for high-ability venture capitalists to separate from low-ability types, they must be willing to accept more risk. Linking compensationmore closely to uncertain future returns increases the risk that the high-abilityventure capitalists bear. The higher expected level of pay compensates theseventure capitalists for the greater risk. Pay-for-performance sensitivity in the
4While we examine the Riley (1979) information equilibrium, it is likely that other separating, aswell as pooling, equilibria exist.
P. Gompers, J. Lerner/Journal of Financial Economics 51 (1999) 3—44 9
first fund for high-ability venture capitalists increases as the difference inabilities increases. The difference in second period compensation is greater, andtherefore low-ability venture capitalists have more to gain from imitatinghigh-ability types.
The signal in this model is the level of risk that the venture capitalists bear.Variable compensation divides an uncertain payoff between venture capitalistsand investors. Unlike signaling models in which the signal is explicitly non-productive, such as in education, the use of pay sensitivity as a signal hasa second effect of inducing different effort choices in equilibrium.
Heinkel and Stoughton (1994) examine the case in which investors evaluateportfolio managers on both the contracts offered and past performance. Theiroptimal contracts are complex, but qualitatively resemble the learning model.This is because their paper has both learning and signaling components. Addinga noisy signal of ability, like performance, creates incentives to work harder.Heinkel and Stoughton show that under their assumptions, the learning effect isstronger. In the model in this section, however, investors do not have anopportunity to use past returns to update beliefs. Types are totally revealed toinvestors by the contracts offered in the first fund before the venture capitalistshave any performance. In the learning model of Section 3.1, both the venturecapitalists and investors infer the venture capitalists’ ability through realizedreturns. Our empirical analysis can be seen as a comparison of the power ofthese two effects, which are depicted in extreme form in our models. Our centralempirical result — the greater pay-for-performance sensitivity of more estab-lished venture organizations — is consistent with the predictions presented inHeinkel and Stoughton (1994) and the learning model of Section 3.1.
In our signaling model, where venture capitalists know their ability to selectand oversee entrepreneurs before raising a fund, the predicted empirical patternsdiffer from those derived in the learning model, where venture capitalists andinvestors have equally poor initial information about ability:
f ¸evel of pay-for-performance sensitivity over time. The signaling model pre-dicts that new and smaller venture organizations, who are confident that theyhave high ability, will increase their pay-for-performance sensitivity in earlyfunds. Once the venture capitalists’ ability has been revealed through theircontract choice, the desire for insurance on the part of the risk-averse venturecapitalists causes incentive compensation in subsequent funds to decline.Older and larger venture capital organizations with established reputationsshould have less incentive compensation.
f ¸evel of fixed fees over time. Fixed fees for older and larger venture capitalfirms should be higher, because these organizations will demand insurance.
f ¸evel of fixed fees and effort level. As in the learning model, higher investmentand monitoring costs should lead the venture capitalists to receive higherfixed fees.
10 P. Gompers, J. Lerner/Journal of Financial Economics 51 (1999) 3—44
f »ariance in pay-for-performance sensitivity over time. We also expect that thecross-sectional variance in pay-for-performance sensitivities will be smaller inolder, larger organizations. In the model where each type’s marginal productis equal, there is no variance in the variable compensation for the later fund.Thus, both the level and the cross-sectional variance of pay-for-performancesensitivities should be higher for younger venture capital firms. Both of thesepredictions are the reverse of the predictions of the learning model.
f ¸evel of pay-for-performance sensitivity and performance. Finally, the signalingmodel predicts that pay sensitivity should be positively related to perfor-mance. High-ability venture capitalists increase their pay-for-performancesensitivity to signal their quality. Young, high-ability venture capitalists willwork hard because of the higher variable compensation and have higherreturns.
4. The sample
4.1. Sample definition and construction
We restrict our analysis to U.S. venture capital partnerships, excludingseveral similar organizations. We include only independent private partnershipsprimarily engaged in venture capital investments. We define venture capitalinvestments as investments in equity or equity-linked securities of private firms,with active participation by the fund managers in the management or oversightof the firms. We eliminate funds whose stated mandate is to invest more than50% of their capital in other types of assets, such as the securities of firmsundergoing leveraged buy-outs, ‘special situations’, or publicly traded securities.Many venture capital organizations in the sample raised leveraged buyout(LBO) funds during the 1980s. We do not include such funds, even if all the otherfunds associated with the organization are devoted to venture capital. Venturefunds that invest more than 50% of their capital in other venture partnerships,known as ‘funds of funds’, are also excluded. Similarly, Small Business Invest-ment Companies (SBICs), publicly traded venture funds, and funds with a singlelimited partner are eliminated. We exclude all of these organizations becausetheir investment opportunities or regulatory environment are substantiallydifferent from venture capital funds, and their negotiated compensation termsmay be expected to differ.
We use the partnership agreements collected by three organizations to con-struct the sample. The organizations are the Aeneas Group, Kemper FinancialServices, and Venture Economics. Each of these organizations has been involvedin venture investing for at least fifteen years. Nonetheless, there are substantialdifferences in the funds in which each invests. We describe these organizations inAppendix C. We determine whether a fund meets our selection criteria in two
P. Gompers, J. Lerner/Journal of Financial Economics 51 (1999) 3—44 11
ways. We review each private placement memorandum, which has a section thatdescribes the partnership. We also consult a database of venture capital fundscompiled by Venture Economics, described in more detail below, to ensure thatwe have not inadvertently included inappropriate cases. If we are unsurewhether a fund corresponds to our criteria, we do not include it.
The Venture Economics database of funds contains summary information on1159 funds raised between 1978 and 1992. It includes many funds whosepartnership agreements or private placement memoranda were not found in theVenture Economics files. In all, documents on 221 funds were found in theVenture Economics files and documents on 198 additional funds were found infiles of Aeneas or Kemper.
We also characterize the investment focus of the funds. Firms typically state intheir private placement memoranda whether they intend to have an industry orstage focus. Because these are imperfectly recorded by Venture Economics, wecheck the original fund documents. One concern may be that funds need notmake investments that are consistent with these stated objectives. The partner-ship agreements, which unlike the private placement memoranda are legalcontracts, rarely state the funds’ objectives. At the same time, venture capitalistswho deviate significantly from the stated goals of their partnership are likely toalienate institutional investors and the investment managers who advise them,and may find it difficult to raise a follow-on fund (e.g., the discussion inGoodman, 1990).
4.2. Completeness of the sample
We assess the completeness of our sample of 419 funds by comparing it witha database compiled by Venture Economics’ Investors Services Group. Thisdatabase includes over two thousand venture capital funds, SBICs, and relatedorganizations. The Investors Services Group database is used in preparation ofdirectories, such as the Venture Economics annual volume »enture CapitalPerformance. The database is compiled from information provided by venturecapitalists and institutional investors. Our sample accounts for 35% of the 1159funds raised by independent venture capital organizations between 1978 and1992 that are in the Venture Economics funds database.5 Weighting observa-tions by fund size, using constant 1992 dollars, our measure of sample coverageis much better: funds in our sample account for $24.4 billion out of a total of$39.9 billion of invested capital, or 61%.
5Venture capital limited partnerships will have one or more closings, where the limited andgeneral partners sign legal documents stating the terms of the partnership, and initial cash paymentsare made. Having several closings enables venture funds to begin investing before fundraising iscompleted. Additional limited partners can be added to the partnership in the subsequent closings.We use the date of the first closing in the analyses in this paper.
12 P. Gompers, J. Lerner/Journal of Financial Economics 51 (1999) 3—44
Table 1The characteristics of the research sample of venture capital funds
The first two columns compare characteristics of funds within the Venture Economics fundsdatabase whose first closing was between January 1978 and December 1992 which were included inour sample and those which were not. Our sample includes only those funds whose partnershipagreements or private placement memoranda were found in the files of Aeneas, Kemper, andVenture Economics. We present both the mean and median (in brackets) of several measures. Thethird column presents the p-values of t-tests, Wilcoxon signed-rank tests (in brackets), and Pearsons2-tests (in braces) of the null hypotheses that these distributions are identical. The final columnpresents corrected summary statistics for the entire sample.
Funds in Venture Economics database All fundsincluded inour sample!Included
in oursample
Not includedin oursample
p-Value,test of nodifference
Number of observations 401 757 419
Date of fund’s first closing March 1986 October 1984 0.000 March 1986[June 1986] [March 1984] [0.000] [June 1986]
Size of fund(millions of 1992 dollars)
62.6 42.7 0.000 62.7[40.1] [29.4] [0.000] [40.1]
Size of venture organization(capital raised as % of total inpast 10 yr)
Fund focuses on high technology? 20.4% 7.4% M0.000N 48.0%!
Fund focuses on early-stageinvestments?
29.2% 12.8% M0.000N 41.8%!
! The data for the entire sample of 419 differ from the sub-sample of 401 for two reasons. In the finalcolumn, the sample size is larger and several aspects of the Venture Economics data have beencorrected with information from fund documents. First, venture organization age is sometimeserroneously entered in the Venture Economics funds database. Second, the coding of investmentfocus is incomplete in the Venture Economics funds database. In order to allow a comparison withthe 757 funds not included in our sample for which we only have the Venture Economics data, wereport the age and focus of the 401 funds as coded by Venture Economics. The summary statisticsabout the 419 funds incorporates our corrections based on information in the private placementmemoranda.
The first three columns of Table 1 compare those entries in the VentureEconomics funds database for which we do and do not have compensation data.We compare the distributions of the included and missing funds using t-tests,Wilcoxon signed-rank tests, and Pearson s2-tests. Larger and more recent funds,as well as funds raised by more established venture organizations, are signi-ficantly more likely to be included in our sample. Funds specializing in
P. Gompers, J. Lerner/Journal of Financial Economics 51 (1999) 3—44 13
high-technology and early-stage investments are disproportionately represent-ed, perhaps reflecting their frequent sponsorship by established organizations.The fourth column of Table 1 displays the characteristics of the funds in the finalsample, including the ones not in the Venture Economics database and hencenot included in the first column. The summary statistics in column four are alsodifferent from column one because the data reported in the fourth column werecorrected using documents from the venture organizations.
While the sample is not entirely representative of the venture industry asa whole, these differences should have a limited impact on the empirical results.As a check of this claim, we repeat the analyses reported below using only the221 observations where the partnership agreements or private placement mem-oranda were found in the files of Venture Economics. These observations aresignificantly more representative of the population of venture funds than theAeneas and Kemper samples. The results remain similar, though the significancefalls, reflecting the smaller sample size.
5. The form of compensation
We analyze the form of venture capitalist compensation in three ways. First,we examine the most visible aspect of compensation, the percentage of profitsreceived by the venture capitalists. Second, we examine the net present value(NPV) of the fixed management fees. Finally, we examine the elasticity ofventure partnerships’ compensation, defined as the percentage change that willoccur in the NPV of total compensation in response to a 1% change inperformance. The elasticity is a function of both the percentage of profitsretained by general partners and the base compensation, and therefore is thebest measure of the sensitivity of compensation to performance.
5.1. The percentage of profits
Fig. 1 presents the distribution of the percentage of profits allocated to thegeneral partners after any provision for the return of invested capital, or ofinvested capital plus a premium. The share in our sample varies from 0.7% to45%, but 81% of the funds are between 20% and 21%, inclusive. This concen-tration is broadly consistent with a learning model in which information isrevealed slowly. If investment ability is uncertain, venture capitalists negotiatevery similar compensation terms.
Panel A of Table 2 presents the mean level of variable compensation. Wedivide the observations in several ways. As discussed above, we use twomeasures of venture organization reputation. The first measure is the age of theventure organization, or the time from the closing of the first partnership thatthe venture organization raised to the closing of this fund. We use this measure
14 P. Gompers, J. Lerner/Journal of Financial Economics 51 (1999) 3—44
Fig. 1. The share of profits received by venture capital organizations. The sample consists of 419venture capital partnerships whose first closing was between January 1978 and December 1992. Theprofit figure indicates the average share of capital gains received by the venture capital organizationsafter any initial return of investment to the limited partners.
for age because investors should know more about the ability of older ventureorganizations. These older venture organizations may, however, also be ofhigher quality. Low-quality venture capitalists should eventually be unable toraise new funds. The average level of compensation should rise because we donot observe the low compensation of poor venture capitalists in later funds. Wecompute venture capital age using the funds database discussed in Section 4.2.When we use this database, we augment and correct the database using histori-cal information reported in the private placement memoranda for each fund. Ifthe Venture Economics database and the offering memorandum disagree, thenwe use the information in the offering memorandum, because we are moreconfident in the information coming directly from the venture organization.
Venture organization age will not, however, capture the fact that venturecapitalists beginning a new organization may have had considerable experienceat another venture group, or elsewhere. We consequently employ a secondproxy for the experience of the venture capitalists, which is the size of the ventureorganization’s previous funds. Venture organization size is a potentially usefulmeasure of uncertainty concerning ability. Investors may provide larger sums toventure capitalists with proven track records, even if they have not raised anyearlier funds. We total the capital invested in the organization’s funds, using1992 dollars, whose first closing was in the ten calendar years prior to the yearthat this fund closed. Because the size of the venture pool increased dramaticallyover these years, we employ a measure of relative size. We divide this sum by thetotal amount raised by venture organizations in these years, again using 1992dollars.
Neither measure of experience is perfect. Ideally, we would have a measure ofthe cumulative experience of the venture capitalists associated with the fund.
P. Gompers, J. Lerner/Journal of Financial Economics 51 (1999) 3—44 15
Table 2The share of profits received by venture capital organizations
The sample consists of 419 venture capital partnerships whose first closing was between January1978 and December 1992. We present the mean share of capital gains received by the venture capitalorganizations (VCs) after any initial return of investment to the limited partners. We also present thenumber of observations. The size of the venture organization is the ratio of the capital invested in theorganization’s funds, in 1992 dollars, whose first closing was in the ten calendar years prior to theyear that this fund closed, to the total amount raised by all venture organizations in these years,again in 1992 dollars. Panel B tests the significance of these patterns.
Panel A: Mean percentage of profits received by venture capitalists
Percent of profitsreceived by VCs
Number ofobservations
Age of venture organizationNo earlier funds 20.5% 146Four years or less 20.7 88Between four and eight years 20.6 94More than eight years 21.4 91
Size of venture organizationNo earlier funds! 20.4 170Between 0.0% and 0.2% 20.9 84Between 0.2% and 0.7% 20.5 88Greater than 0.7% 21.6 77
Objective of fundFocus on high-technology firms 21.2 199Other industry focus (or no focus) 20.3 220Focus on early-stage investments 21.1 173Other stage focus (or no focus) 20.5 246
Date of closingJanuary 1978—December 1984 20.5 100January 1985—June 1986 20.9 111June 1986—December 1988 20.7 120January 1989—December 1992 20.9 85
Panel B: ¹ests involving percentage of profits
Variables Coefficient p-value
Correlation, age of venture organization and % of profits 0.104 0.032Correlation, size of venture organization and % of profits 0.109 0.026Correlation, date of closing and % of profits 0.027 0.577t-test, high-technology focus and % of profits 0.004"
t-test, early-stage focus and % of profits 0.047"
Variance test, organizations below and above 0.7% of pool 0.000#
Variance test, organizations below and above 10 yr old 0.022#
! This category also includes funds which raised a previous fund whose size cannot be determined." p-value from a t-test comparing the percentage of profits received by funds with and without thisinvestment focus.# p-value from an F-test comparing the variance of profits received by experienced and inexperiencedventure organizations.
16 P. Gompers, J. Lerner/Journal of Financial Economics 51 (1999) 3—44
Unfortunately, constructing such a measure is problematic. Many venturecapitalists have diverse backgrounds, including experience as founders of entre-preneurial firms, corporate managers, or university researchers. It is unclearhow individual experience should be aggregated. Even if such an experiencemeasure could be designed, only about half of the private placement memoran-da provide detailed information on the backgrounds of the general partners.Obtaining biographical information on venture capitalists elsewhere is oftenvery difficult. To address this concern, we examine whether the venture capital-ists in older and larger venture organizations had more prior experience. Welook at 267 venture funds established between 1978 and 1985, including somenot in the sample, that had a board seat on at least one firm that went public inthe seven years after the fund closed. To assess experience, we look at the boardson which the venture capitalists served prior to the closing of this fund. We totalthe inflation-adjusted market capitalization of all IPOs on whose boards theseventure capitalists served. Older and larger venture organizations tend to havemore experienced venture capitalists. The correlation coefficients, 0.29 and 0.25,respectively, are significant at the one percent confidence level.
The oldest and largest funds command about a 1% greater share of profitsthan less established funds. As the correlation analysis in Panel B of Table 2demonstrates, these effects are significant at least at the 5% confidence level.Similarly, firms with a focus on high-technology or early-stage investmentsreceive a significantly higher percent of profits. No significant time effect ap-pears. Again, consistent with the learning model, larger and older venturecapital organizations also have significantly greater variance in the share ofprofits that they receive.
Even if the differences between more and less established funds are statist-ically significant, they may not be economically meaningful. To address thisconcern, we examine a representative fund, using the assumptions outlined inAppendix D. A 1% difference in the share of profits matters very little if theventure fund does not perform well. For instance, if the fund’s investments growonly at an annual rate of 10%, a increase in the venture capitalists’ profit sharefrom 20% to 21% boosts the NPV of total compensation by only 0.3%. Thesmall magnitude of this change occurs because the compensation in this case isdominated by the fixed fee. If, however, the fund’s investments perform well,a very different picture emerges. For example, if the fund’s investments grow atan annual rate of 50%, an increase in the profit share for the venture capitalistsfrom 20% to 21% raises the NPV of total compensation by 4.2%.
Table 3 reports the results from several regression analyses. The first is anordinary least squares (OLS) analysis. The dependent variable is the venturecapitalists’ share of profits. We express this variable as a number between 0 and100, where 21.2 represents a profit share of 21.2%. Independent variables are thedate of the closing, venture organization size and age, and dummy variablesdenoting whether the fund focuses on high-technology or early-stage firms. We
P. Gompers, J. Lerner/Journal of Financial Economics 51 (1999) 3—44 17
Tab
le3
Reg
ress
ion
anal
yses
ofth
esh
are
ofpro
fits
rece
ived
byve
nture
capi
talorg
aniz
atio
ns
The
sam
ple
cons
ists
of41
9ve
nture
capital
part
ners
hipsw
hos
efirs
tcl
osing
was
bet
wee
nJa
nuar
y19
78an
dD
ecem
ber19
92.T
hefir
stth
ree
regr
ession
sar
eor
dinar
yle
astsq
uare
s(O
LS)
anal
yses
,with
the
capital
gain
sre
ceiv
edby
the
ventu
reca
pita
lor
gani
zation
saf
ter
any
initia
lre
turn
ofin
vest
men
tto
the
limited
part
ners
asth
edep
enden
tva
riab
le.T
hene
xttw
ore
gres
sions
are
order
edlo
gitan
alys
es,w
ith
funds
rece
ivin
gbel
ow20
%co
ded
as0,
thos
ebe
twee
n20
%an
d21
%as
1,th
ose
bet
wee
n21
%an
d25
%as
2,th
ose
betw
een
25%
and
30%
as3,
and
thos
eab
ove
30%
as4.
The
sixt
his
aT
obit
anal
ysis
ofw
het
her
the
per
centa
geof
pro
fits
isab
ove
21%
,and
ifso
,by
how
much
.The
fina
ltw
ore
gres
sions
are
am
axim
umlik
elih
ood
anal
ysis
ofw
het
her
the
fund
rece
ives
betw
een
20%
and
21%
ofp
rofits
,and
ifnot,
wha
tth
ele
veli
s,as
sum
ing
anor
mal
distr
ibution
forth
ose
obse
rvat
ionsno
tbe
twee
n20
%an
d21
%.
Inde
pende
ntva
riab
les
incl
ude
the
dat
eof
the
closing
,w
ith
Janua
ry1,
1978
coded
as19
78.0
,and
sofo
rth,
the
size
ofth
eve
nture
capital
org
aniz
atio
n,
mea
sure
das
the
ratio
ofca
pita
lra
ised
inth
ete
nca
lend
arye
ars
prio
rto
the
year
inw
hich
the
fund
clos
edto
the
tota
lam
ount
raised
by
vent
ure
capital
orga
niza
tion
sin
that
tim
e,th
eag
eoft
heve
ntur
eor
gani
zation
atth
etim
eof
the
fund
clos
ing,
inye
ars,
and
dum
my
variab
lesin
dic
atin
gw
heth
erth
efu
nd
focu
sed
onhi
gh-t
echn
olo
gyor
early-
stag
ein
vest
men
ts,w
ith
1den
otin
gsu
cha
fund.
Abso
lute
t-st
atistics
inbr
acket
s.
OLS
OL
SO
LS
Ord
ered
logi
tO
rder
edlo
git
Tobi
tM
axim
um
likel
ihood
Pro
fits
inta
rget
range
?
Act
ual
profi
ts
Dep
enden
tva
riab
le:P
erce
nta
geofpro
fits
rece
ived
by
vent
ure
capital
org
aniz
atio
n
Dat
eof
closing
0.04
!0.
002
0.01
!0.
03!
0.21
0.05
0.12
[0.8
0][0
.03]
[0.1
9][0
.73]
[1.0
7][1
.94]
[0.6
1]
Fund
clos
edin
1978
—198
2?!
0.01
[0.0
2]
Fund
clos
edin
1983
—198
7?!
0.27
[0.8
0]
Size
ofve
nture
org
aniz
atio
n50
.67
48.1
942
.57
189.
78!
17.9
011
7.58
[2.5
4][2
.40]
[2.8
6][2
.60]
[2.0
5][1
.86]
Age
ofve
ntur
eor
gani
zation
0.07
0.05
[2.4
7][2
.11]
18 P. Gompers, J. Lerner/Journal of Financial Economics 51 (1999) 3—44
Fund
focu
ses
on
hig
hte
chnol
ogy
?0.
930.
940.
611.
570.
104.
18[3
.08]
[3.1
3][2
.41]
[2.2
7][0
.72]
[3.1
9]
Fund
focu
ses
on
early
stag
es?
0.75
0.35
[2.4
1][1
.39]
Con
stan
t!
58.5
223
.53
20.2
643
3.26
!91
.38
!21
0.63
[0.6
0][0
.23]
[60.
04]
[1.1
0][1
.93]
[0.5
5]
Adj
ust
edR
20.
030.
020.
03
F-s
tatist
ic5.
073.
493.
83
Log
likel
ihoo
d!
306.
07!
309.
52!
328.
16!
461.
74
s2-s
tatist
ic12
.42
5.52
9.78
22.0
7
p-V
alue
0.00
20.
016
0.00
50.
006
0.13
70.
020
0.00
1
Num
ber
ofob
serv
atio
ns41
641
641
641
641
641
641
6
P. Gompers, J. Lerner/Journal of Financial Economics 51 (1999) 3—44 19
include the dummy variables for fund focus to control for other factors that mayinfluence base compensation and that may also be associated with fund reputa-tion, in order to isolate the effect of the reputation measures. These dummyvariables take on a value of 1 if the fund has such a focus.
We are unsure, however, whether OLS is the proper specification, so we alsoemploy three alternatives. First, we classify funds into those where venturecapitalists’ percentage of profits is in five ranges, and run an ordered logitregression. We code funds receiving below 20% as 0, those between 20% and21% as 1, those between 21% and 25% as 2, those between 25% and 30% as 3,and those above 30% as 4. Second, we perform a Tobit regression, where weexamine whether the venture organization received more than 21% of theprofits, and if so, how much more. The use of this specification is motivated bythe fact that the vast majority of contracts fall into the range between 20% and21%, or else are greater than 21%. The final set of regressions employsa maximum likelihood approach. We estimate if the venture capitalists receivedbetween 20% and 21% of the profits, and if not, what percentage was received.We assume that the percentage received by the venture capitalists, if not in the20—21% range, has a normal distribution. This allows us to use funds receivingless than 20% as well as those getting more than 21%. It also allows us toestimate separate coefficients for the decision to deviate from the standardrange, and the extent of the deviation.
As reported in Table 3, the venture organization’s size and age are positiveand significant in the first six regressions. While the regressions are noisy and theadjusted R2s are quite low, the results are consistent with the learning model. Inthe final pair of maximum likelihood regressions, larger venture capitalists aremore likely to deviate from the 20% to 21% range and to receive a larger shareof profits (at the 10% confidence level).
5.2. Base compensation
We next examine fixed fees, also known as management fees. Because thesefees are a significant fraction of venture capitalist’s compensation and arecalculated in many different ways, omitting them may give a misleading impres-sion. Fixed fees may be specified as a percent of the committed capital (that is,the amount of money investors have committed to provide over the life of thefund), the value of fund’s assets, or some combination or modification of thesetwo measures. Both the base used to compute the fees and the percentage paid asfees may vary over the life of the fund. To examine management fees, wecompute the NPV at the time of the partnership’s closing of the fixed fees thatare specified in the contractual agreement. We express the value as a percent ofthe committed capital. We discount relatively certain compensation, such as feesbased on committed capital, at 10%, while applying a 20% discount rate tomore uncertain compensation, such as fees based on net asset value. The results
20 P. Gompers, J. Lerner/Journal of Financial Economics 51 (1999) 3—44
do not change significantly when we use other discount rates. When necessary,for example, in cases where fees are based on net asset value, we make a series ofassumptions about fund performance, which are summarized in Appendix D.
Table 4 reports the mean NPV of the base compensation as a percentage ofcommitted capital. Older and larger venture capital organizations receive lower
Table 4Base compensation and sensitivity of compensation to performance for venture capital organiza-tions
The sample consists of 419 venture capital partnerships whose first closing was between January1978 and December 1992. We present base compensation as the mean net present value of the fixedfees as a percentage of committed capital, and sensitivity of compensation to performance as themean percentage increase in the net present value of total compensation associated with an increasein the asset growth rate from 20% to 21%. We discount relatively certain compensation, such as feesbased on committed capital, at 10%, and uncertain compensation, such as the venture capitalists’share of the capital gains, at 20%. The size of the venture organization is the ratio of the capital, in1992 dollars, invested in the organization’s funds whose first closing was in the ten calendar yearsprior to the year that this fund closed to the total amount, again in 1992 dollars, raised by all ventureorganizations in these years. Panels B and C test the significance of these patterns.
Panel A: Mean base compensation and sensitivity of compensation to performance
Mean basecompensation(in percent)
Mean sensitivityof compensationto performance(in percent)
Age of venture organizationNo earlier funds 18.9% 4.5%Four years or less 18.5 4.5Between four and eight years 19.3 4.3More than eight years 15.9 4.9
Size of venture organizationNo earlier funds! 18.8 4.5Between 0.0% and 0.2% 19.9 4.4Between 0.2% and 0.7% 18.2 4.5Greater than 0.7% 15.1 5.1
Objective of fundFocus on high-technology firms 18.8 4.6Other industry focus (or no focus) 17.8 4.6Focus on early-stage investments 19.2 4.6Other stage focus (or no focus) 17.6 4.6
Date of closingJanuary 1978—December 1984 16.7 5.2January 1985—June 1986 18.8 4.6June 1986—December 1988 18.9 4.3January 1989—December 1992 18.3 4.4
P. Gompers, J. Lerner/Journal of Financial Economics 51 (1999) 3—44 21
Table 4. Continued.
Panel B: ¹ests involving base compensation
Variables Coefficient p-value
Correlation, age of venture organization and basecompensation
!0.238 0.000
Correlation, size of venture organization and basecompensation
!0.330 0.000
Correlation, date of closing and base compensation 0.134 0.008t-test, high-technology focus and base compensation 0.041"
t-test, early-stage focus and base compensation 0.001"
Variance test, organizations below and above 0.7% of pool 0.417#
Variance test, organizations below and above 10 years old 0.227#
Panel C: ¹ests involving sensitivity of compensation to performance
Variables Coefficient p-value
Correlation, age of venture organization and performancesensitivity
0.109 0.031
Correlation, size of venture organization and performancesensitivity
0.242 0.000
Correlation, date of closing and performance sensitivity !0.274 0.000t-test, high-technology focus and performance sensitivity 0.950"
t-test, early-stage focus and performance sensitivity 0.459"
Variance test, organizations below and above 0.7% of pool 0.042#
Variance test, organizations below and above 10 years old 0.043#
! This category also includes funds which raised a previous fund whose size cannot be determined." p-value from a t-test comparing the performance sensitivity in funds with and without thisinvestment focus.# p-value from an F-test comparing the variance of performance sensitivity in funds of experiencedand inexperienced venture organizations.
base compensation than younger, smaller ones. Funds focusing on early-stageand high-technology investments have higher base compensation. The NPV ofbase compensation appears to have increased over time, rising by nearly 2%since 1984.
Regression results are presented in Table 5. The dependent variable is theNPV of base compensation as a percent of committed capital. Fees totaling 20%of committed capital would again be expressed as 20. Independent variablesinclude the date of the fund’s closing, venture organization size and age, anddummy variables denoting whether the fund focuses on high-technology orearly-stage investments, with 1 denoting such a fund. We find that larger andolder venture organizations are associated with significantly lower fees, whilefunds specializing in early-stage or high-technology investments have signifi-cantly larger base compensation.
22 P. Gompers, J. Lerner/Journal of Financial Economics 51 (1999) 3—44
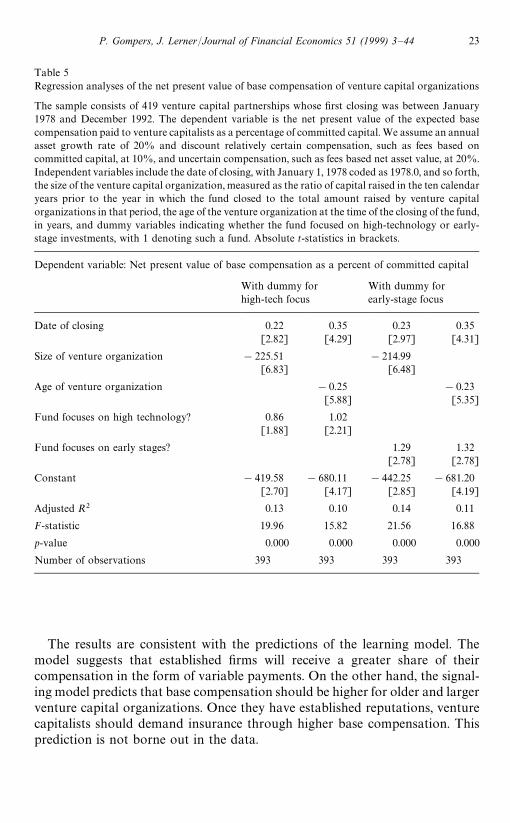
Table 5Regression analyses of the net present value of base compensation of venture capital organizations
The sample consists of 419 venture capital partnerships whose first closing was between January1978 and December 1992. The dependent variable is the net present value of the expected basecompensation paid to venture capitalists as a percentage of committed capital. We assume an annualasset growth rate of 20% and discount relatively certain compensation, such as fees based oncommitted capital, at 10%, and uncertain compensation, such as fees based net asset value, at 20%.Independent variables include the date of closing, with January 1, 1978 coded as 1978.0, and so forth,the size of the venture capital organization, measured as the ratio of capital raised in the ten calendaryears prior to the year in which the fund closed to the total amount raised by venture capitalorganizations in that period, the age of the venture organization at the time of the closing of the fund,in years, and dummy variables indicating whether the fund focused on high-technology or early-stage investments, with 1 denoting such a fund. Absolute t-statistics in brackets.
Dependent variable: Net present value of base compensation as a percent of committed capital
With dummy forhigh-tech focus
With dummy forearly-stage focus
Date of closing 0.22 0.35 0.23 0.35[2.82] [4.29] [2.97] [4.31]
Size of venture organization !225.51 !214.99[6.83] [6.48]
Age of venture organization !0.25 !0.23[5.88] [5.35]
Fund focuses on high technology? 0.86 1.02[1.88] [2.21]
Fund focuses on early stages? 1.29 1.32[2.78] [2.78]
The results are consistent with the predictions of the learning model. Themodel suggests that established firms will receive a greater share of theircompensation in the form of variable payments. On the other hand, the signal-ing model predicts that base compensation should be higher for older and largerventure capital organizations. Once they have established reputations, venturecapitalists should demand insurance through higher base compensation. Thisprediction is not borne out in the data.
P. Gompers, J. Lerner/Journal of Financial Economics 51 (1999) 3—44 23
5.3. The sensitivity of compensation to performance
An alternative measure of variable compensation is the elasticity of compen-sation with respect to fund performance. This allows us to get a more completepicture of the sensitivity of compensation to performance, as we can assess theimpact of both the base and variable compensation. To determine the elasticity,we calculate the NPV of the total compensation under reasonable assumptions.
The specific procedure we employ is as follows. We discount the paymentsback to the date of the partnership’s formation. We undertake the calculation attwo asset growth rates, 20% and 21%. By comparing these two values, we canexamine the incremental value of a small amount of additional performance ata level of performance that is typical for this period. For example, VentureEconomics (1989c) estimates that funds established prior to 1982 that were stillactive in 1989 had a mean return of 17.6%, with a standard deviation of 14.2%.We once again discount relatively certain compensation, such as that based oncommitted capital, at 10%, while applying a 20% discount rate to moreuncertain compensation, such as expected profits. Additional assumptions aredescribed in Appendix D. Fig. 2 displays the considerably greater dispersion inthe sensitivity to performance than in the share of profits.
An alternative approach to measuring the elasticity of compensation toperformance would be to view the venture capitalist’s compensation as consist-ing of two securities: a bond, the base compensation, and an option on thepercentage of the assets of the partnership, which would be the variable compen-sation. We could then compute the value of the bond and the option. While
Fig. 2. The sensitivity of venture capitalist compensation to performance. The sample consists of419 venture capital partnerships whose first closing was between January 1978 and December 1992.The figure indicates the percentage increase in compensation associated with an increase in the assetgrowth rate from 20% to 21%. We discount relatively certain compensation, such as fees based oncommitted capital, at 10%, and uncertain compensation, such as the venture capitalists’ share of thecapital gains, at 20%.
24 P. Gompers, J. Lerner/Journal of Financial Economics 51 (1999) 3—44
Sahlman (1990) computes the value of such an option in a simple case, undertak-ing such a calculation for several hundred funds with different payout structureswould be prohibitively difficult.
Table 4 reports the mean elasticity of compensation to performance. Olderand larger venture organizations have significantly greater performance sensi-tivity. Funds specializing in high-technology and early-stage investments, whichcommand both higher base and variable compensation, display no difference inthe sensitivity of compensation to performance. The variance of the performancesensitivity is significantly higher for larger and older venture organizations.
Table 6 presents regression analyses of compensation sensitivity to perfor-mance. The dependent variable is the change in the NPV of total compensationassociated with increasing the asset growth rate from 20% to 21%. Compensa-tion for larger and older venture organizations displays a greater performancesensitivity, while compensation for funds specializing in early-stage and high-technology firms does not.
Two observations about the level and pattern of elasticity measures are inorder. The first is the relatively large impact of an increase in performance on thepay of the venture capitalists. An increase in the asset growth rate from 20% to21% leads to a 4% to 5% increase in compensation. This increase results fromthe highly leveraged position of the venture capitalists, who receive a share ofthe profits only after the return of investors’ committed capital. This sensitivityis magnified among the older and larger firms, due to the greater sensitivity oftheir compensation to performance.
Second, our analyses have a significant bias against finding the patterns inTables 4—6. Several of the oldest and largest venture organizations do not chargea fixed annual fee based on committed capital or assets. Rather, they negotiateannual budgets with their limited partners. These organizations are reputed to havevery low fee structures. This claim is corroborated through an examination of recentannual reports for eight such funds in the Aeneas files. The funds charged anaverage fee of 1.6% of committed capital, considerably below the standard 2.5%.These funds are not included in our analyses of base compensation or performancesensitivity, since their compensation is not fixed in advance. Were we able to includethem, the level of base compensation would decline and the level and variance of theperformance sensitivity would increase for the oldest and largest funds.
The elasticity results are consistent with the predictions of the learning model,but not the signaling one. As the abilities of venture capitalists become knownwith greater certainty, explicit incentives, typically in the form of variableperformance compensation, replace implicit career concerns. The variance incompensation schemes rises over time as investors and venture capitalists learnabout abilities. If early-stage and high-technology venture funds differ fromother funds only in the level of effort necessary to monitor the portfolio, fixedfees should be higher, but performance sensitivity should not differ between thegroups. This is what we find empirically.
P. Gompers, J. Lerner/Journal of Financial Economics 51 (1999) 3—44 25
Table 6Regression analyses of the sensitivity of compensation to performance for venture capital organiza-tions
The sample consists of 419 venture capital partnerships whose first closing was between January1978 and December 1992. The dependent variable is the percentage increase in the net present valueof total compensation associated with an increase in the asset growth rate from 20% to 21%. Wediscount relatively certain compensation, such as fees based on committed capital, at 10%, anduncertain compensation, such as the venture capitalists’ share of the capital gains, at 20%.Independent variables include the date of closing, with January 1, 1978 coded as 1978.0, and so forth,the size of the venture capital organization, measured as the ratio of capital raised in the ten calendaryears prior to the year in which the fund closed to the total amount raised by venture capitalorganizations in that time, the age of the venture organization at the time of the closing of the fund,in years, and dummy variables indicating whether the fund focused on high-technology or early-stage investments, with 1 denoting such a fund. Absolute t-statistics in brackets.
Dependent variable: Sensitivity of compensation to performance
With dummy forhigh-tech focus
With dummy forearly-stage focus
Date of closing 0.10 0.12 !0.10 !0.12[5.73] [6.53] [5.76] [6.54]
Size of venture organization 36.72 36.15[5.05] [4.93]
Age of venture organization 0.04 0.04[3.87] [3.73]
Fund focuses on high technology? 0.02 !0.01[0.18] [0.09]
Fund focuses on early stages? !0.05 !0.06[0.44] [0.53]
Our two models also differ in their predicted relationship between ex antesensitivity of compensation to performance and ex post performance. In other
26 P. Gompers, J. Lerner/Journal of Financial Economics 51 (1999) 3—44
words, each model provides different predictions regarding whether per-formance-sensitive compensation negotiated at the time of the partnershipagreement will be associated with higher returns. The learning model sug-gests that there will not necessarily be any relationship between pay sensi-tivity and performance. Reputational concerns lead young venture capitalistswith little explicit incentive compensation to work hard and perform well.The signaling model, on the other hand, suggests a positive relationshipbetween pay sensitivity and success. Higher-ability venture capitalistssignal their ability by taking more risk and then work harder. In this section,we empirically examine this relationship. Consistent with the learning model, wedo not find any evidence of a relationship between pay sensitivity and perfor-mance.
Several data constraints limit our analysis. First, we do not have access to theinternal rate of return (IRR) information for the funds in our sample. While thisinformation is compiled by several monitoring organizations, it is consideredproprietary information. Second, our sample consists primarily of funds fromthe 1980s and 1990s. Few of these funds have yet been concluded. The ten-yearcontractual life for most venture funds is often extended by several years.Consequently, most of our funds have investments remaining in their portfolios.Because valuations of private firms are often very subjective, even if they wereavailable, rates of return would be of limited value.
Thus, we employ an alternative measure of performance, which is the ratioof the market value of the fund’s stakes in firms that went public to thetotal amount raised by the fund. This measure is highly correlated with thefund’s final IRR. Venture capitalists generate the bulk of their profits from firmsthat go public. A Venture Economics study (1988) finds that a $1 investment ina firm that goes public provides an average cash return of $1.95 in excess of theinitial investment, with an average holding period of 4.2 years. The next bestalternative as estimated by Venture Economics (1988), an investment in anacquired firm, yields a cash return of only 40 cents over a 3.7 years averageholding period.
We identify potential venture-backed initial public offerings (IPOs) usingthree sources. The first is the listings of venture-backed IPOs published inVenture Economics’ »enture Capital Journal. This is the same source used byBarry et al. (1990), and Megginson and Weiss (1991). Venture Economics’listings, however, do not include approximately 15% of all venture-financedfirms (Lerner, 1995). We consequently use listings of security distributions byventure funds. Venture capitalists typically divest their successful investments bydistributing shares to their partners. We obtain lists of the distributions receivedby a major pension fund and three investment managers. Most of the successfulinvestments by 135 venture funds can be identified from these lists. The finalsource is the private placement memoranda used to raise new venture funds.In these offering memoranda, venture organizations often list successful past
P. Gompers, J. Lerner/Journal of Financial Economics 51 (1999) 3—44 27
investments. We examine over 200 memoranda in the files of Venture Econ-omics. We then examine the firms’ IPO prospectuses, and note each venturecapital fund holding an equity stake of at least 5%. We identify 835 IPOsbetween 1972 and 1992 where one or more venture capitalists held such anequity stake. We then determine which venture capital funds in our sample of419 partnerships held an investment in one of the IPO companies.
Venture capitalists typically do not sell their holdings at the time of the IPO,but hold them for approximately one and a half years thereafter (Gompers andLerner, 1998). We do not know the precise date at which they liquidated theseinvestments in most cases. We consequently value the venture capitalists’ stakesat the market price eighteen months after the IPO date, using the SecuritiesData Company Corporate New Issues and Center for Research into SecuritiesPrices databases.
These analyses, reported in Table 7, employ all 234 funds begun beforeJanuary 1987, which include those out of the sample of 419 with at least sixyears to take firms public. The dependent variable is the ratio of the dollarvalue of each fund’s stake in IPOs, summing the amount in 1992 dollars, tothe fund’s total committed capital. Because older funds have had more timeto harvest their portfolios, we normalize the ratio of the mean fund in eachyear to one. Independent variables include the date of the fund’s closing,venture organization size, and the percent of profits accruing to the generalpartners. One concern in choosing the sample of firms to review is that diff-erent venture organizations may take companies public at different times.Gompers (1996) shows that a new venture capital organization may takecompanies public earlier in order to impress potential investors in its secondfund. Consequently, IPOs in the first years of a fund’s life may not providea clear indicator of ultimate performance. We address this concern in un-reported regressions by examining only the subset of funds begun beforeJanuary 1983. For these funds, we can observe all IPOs over the first ten years ofthe fund’s life. Neither the magnitude nor the significance of the relationshipbetween compensation and performance differs appreciably when this subset isused.
In the first regression, we use an OLS specification. Because the dependentvariable is bounded by zero, this may produce biased coefficients. We thusemploy a Tobit specification in the second regression. Finally, we employa two-stage approach to control for factors that may explain the percentage ofprofits received by the venture capitalist. In each, the compensation measure hasvirtually no explanatory power. We explore several alternative approaches inunreported regressions. First, we use the measure of pay sensitivity defined inSection 5.3. We add additional independent variables, such as venture organiza-tion age. In none of these regressions is there a significant relationship betweencompensation and performance. This result is consistent with the predictions ofthe learning model.
28 P. Gompers, J. Lerner/Journal of Financial Economics 51 (1999) 3—44
Table 7Regression analyses of the performance of venture capital funds
The sample consists of 234 venture capital partnerships whose first closing was between January1978 and December 1986. The first regression is an ordinary least squares (OLS) analysis, with theratio of the value of the fund’s stakes in firms which had gone public in an initial public offering(IPO) by December 1992 to the total amount raised by the fund as the dependent variable. The valueof the firm is determined eighteen months after the IPO. To control for the different maturities of theportfolios, the ratio of the mean fund begun in each year is normalized as 1.0. The second regressionemploys a Tobit specification, the third, a two-stage least squares approach, for which only thesecond-stage regression is reported. Independent variables include the date of closing, with January1, 1978 coded as 1978.0, and so forth, the size of the venture capital organization, measured as theratio of capital raised in the ten calendar years prior to the year in which the fund closed to the totalamount raised by venture capital organizations in that time, and the percentage of profits receivedby the venture organization. Absolute t-statistics in brackets.
Dependent variable: Dollar volume of IPOs relative to capital raised
OLSanalysis
Tobitanalysis
Two-stageleast squaresanalysis
Date of closing 0.004 !0.05 !0.12[0.09] [0.78] [0.29]
Size of venture organization 11.79 23.77 0.01[1.07] [1.70] [0.11]
Venture capitalists’ percentage of profits 0.004 0.001 17.92[0.15] [0.04] [0.76]
Constant !6.92 91.27 !6.86[0.08] [0.79] [0.07]
Adjusted R2 !0.008
F-statistic 0.41 0.40
Log likelihood !388.64
s2-statistic 4.06
Root MSE 1.454
p-value 0.744 0.255 0.757
Number of observations 234 234 234
An interesting unanswered question is whether the variance of returns of high-and low-ability venture capitalists differs. The models presented constrain thevariance of these two group’s returns to be the same. It could be that experi-enced venture capitalists invest in less risky firms or reduce these risks byengaging in active management of these firms. This question has not beenempirically explored to date by financial economists, but is a topic that we arecurrently examining in a research project.
P. Gompers, J. Lerner/Journal of Financial Economics 51 (1999) 3—44 29
7. Conclusion
The unique institutional features of the U.S. venture capital organizationprovide an attractive arena to examine compensation schemes. Because theyhave few alternatives, investors in limited partnerships must rely on incentiveschemes to control managers. The small number of general partners, and theaccuracy with which their success can be measured, ensure that compensationschemes can effectively motivate management actions. Finally, the terms of thecompensation schemes are clearly defined in the initial partnership agreementsand are rarely renegotiated.
Evidence from 419 U.S. venture partnerships formed between 1978 and 1992is generally consistent with the view that reputation is an important motivationfor young, unseasoned venture capitalists. Using two proxies for reputation, theage and size of the venture organization, we find that the compensation ofestablished funds is significantly more sensitive to performance and morevariable than that of other funds. Older and larger firms have lower basecompensation as well. Performance and pay sensitivity do not appear to berelated.
The results indicate that venture capital entrants may not have superiorinformation about their investment abilities and may be concerned aboutestablishing a reputation. This interpretation seems plausible. The venturecapital industry may require skills that were not used in venture capitalists’previous employment. Venture capitalists argue that it is difficult to predictsuccess of new partners in advance. For instance, Robert Kunze (1990) ofHambrecht and Quist notes: ‘The life of the associate [at a venture capital firm]is akin to playing house. Since associates never make the actual investmentdecision . . . it’s impossible to tell whether or not they’ll be successful venturecapitalists if and when they get the chance’. Meanwhile, investors are sophisti-cated institutions that closely track performance. It is reasonable to expect thatneophyte venture capitalists do not know their own investment abilities anybetter than their investors do.
While we have only tested the learning model against the signaling model,other factors may help explain compensation patterns. A leading alternative isa human capital-based model. Leading venture capitalists may be able to extracthigher pay than their less-seasoned counterparts because more investors want toinvest in their next funds. This might lead to a similar pattern of older ventureorganizations, whose venture capitalists often have extensive investment experi-ence, receiving higher compensation as a return on their superior human capital.It is difficult to build a human capital model, however, that has the higher payoccurring only in the variable compensation. If venture capitalists are riskaverse, they should demand more insurance. Established venture capital firmsshould raise new funds with higher base and variable compensation, if theventure capitalists extract higher pay with both components, or with higher base
30 P. Gompers, J. Lerner/Journal of Financial Economics 51 (1999) 3—44
and lower variable compensation, if the demand for insurance predominates.Section 5 demonstrates that older and larger venture capital organizationsreceive higher variable and lower base compensation. This pattern is not whata human capital-based model would suggest, but it is consistent with ourlearning model.
These empirical patterns raise several unanswered questions. One unresolvedissue is why there is so much uniformity in the most visible aspect of compensa-tion, the distribution of carried interest. Clustering of the visible portion ofcompensation is very common. For instance, many lawyers work for a 33%contingent fee and most real estate brokers in an area charge the same salescommission. An interesting theoretical model would attempt to explain this lackof variation within professions and the factors that lead to these focal equilibria.A second puzzle is how compensation arrangements in limited partnershipsinteract with the many restrictions in these arrangements. Gompers and Lerner(1996) find that there is considerably more variability in the use of covenants andrestrictions in venture capital limited partnership agreements. These variationsin covenants might be thought of as prices as well. Why the price of restrictionsis more variable than explicit compensation terms is a fertile area for futureresearch.
Appendix A. Derivation of the learning model
We assume that there is symmetric uncertainty about the ability of theventure capitalist, g. This can represent either the venture capitalist’s skill inselecting portfolio companies (either through screening or through pro-activelyidentifying transactions), or his ability to add value after the investment. Venturecapitalists and investors believe that g is distributed normally, with mean m
0and
variance p20. Neither side has private information about the venture capitalist’s
quality in advance of the project.Venture capitalists raise two partnerships in two consecutive periods. The
outcome of investments in the first fund and any investment returns are realizedprior to the second fund being raised. No projects shift from the first fund to thesecond. The fund return in period t, n
t, is a function of ability, the venture
capitalist’s effort (et), and noise (e
t):
nt"g#e
t#e
t. (A.1)
We use the simple additive production function to simplify the derivation of theoptimal contract. We have also derived results for a multiplicative productionfunction (i.e., ge). Using this alternative production function, the feature of thelearning model that distinguishes it from the signaling model presented belowremains the same: early funds have lower pay-for-performance sensitivity.The multiplicative production function, however, leads to second-period
P. Gompers, J. Lerner/Journal of Financial Economics 51 (1999) 3—44 31
compensation schemes in which high-ability venture capitalists have lowerpay-for-performance sensitivity than the others. In reality, certain activities ofthe venture capitalist appear to be additive, such as providing contacts andadvice, while others, like reputational spillovers, seem to be multiplicative.
In Eq. (A.1), noise (et) is distributed independently and identically normal with
mean 0 and variance p2e . The number of projects in a venture fund is typicallysmall enough that residual uncertainty about returns exists. At the time a ven-ture capitalist raises his next fund, considerable uncertainty about abilities islikely to remain. While venture capitalists and investors have the same beliefsabout ability before the funds are formed, investors cannot observe the effortlevel chosen in either fund. Effort choice is private information.
The venture capitalist’s compensation, wt, is a linear function of fund returns.
Holmstrom and Milgrom (1987) show that when effort choice and output arecontinuous, but monitoring by the principal is periodic, linear sharing rules areoptimal. An added motivation for using a linear scheme in the model is theprevalence of such agreements in venture partnership agreements. The venturecapitalist receives some fixed payment, f
t, and variable compensation which
represents a share, vt, of the return on the fund:
wt(n
t)"f
t#l
tnt. (A.2)
C(et) is the direct disutility, in monetary terms, of effort. Both the venture
capitalist and the investor know C(et). C(e
t) is convex, and C@(0)"0,
C@(R)"R, and C@@@*0. C@@@*0 ensures uniqueness of the equilibrium con-tract. The investor is risk neutral, but the venture capitalist is risk averse, witha coefficient of risk aversion, r, and a constant per-period discount rate, d. Theventure capitalist’s utility function is given by Eq. (A.3):
º(w1, w
2; e
1, e
2)"!expA!rC
2+t/1
dt~1[wt!C(e
t)]DB. (A.3)
As in Gibbons and Murphy (1992), this utility function is not additively separ-able. The utility function displays constant absolute risk aversion and makes thederivation of two-period incentive schemes easier. Because investors in venturefunds are primarily large institutions, such as pension funds and insurancecompanies, investor risk neutrality is reasonable. Venture capitalist risk aver-sion may result from wealth constraints or lack of investment portfolio diversifi-cation (for survey evidence, see Tyebjee and Bruno, 1984).
Compensation contracts are written for each fund, conditional on the in-formation available from returns, if any exist. The terms of the compensationcontract are set out before effort is chosen or investments are made. Investors inboth funds can, but need not be, the same investors as in the first fund. Investorsin the second fund, however, have verifiable information about the performance
32 P. Gompers, J. Lerner/Journal of Financial Economics 51 (1999) 3—44
of the first fund. We assume that one investor and one venture capitalistnegotiate over the terms of the compensation and that a Nash (1950) bargainingsolution is relevant, that is, the compensation package evenly splits the expectedgains from investment:
f1(l
1)#l
1E(n
1D eL
1)!C(eL
1)"1
2[E(n
1D eL
1)!C(eL
1)], (A.4)
f2(l
2)#l
2E(n
2D n
1, eL
1, eL
2)!C(eL
2)"1
2[E(n
2D n
1, eL
1, eL
2)!C(eL
2)]. (A.5)
A Nash bargaining solution, which assumes equal bargaining power, seemsappropriate for venture capital settings where only a small number of potentialplayers are involved in the negotiations. The number of investors and venturecapitalists is not large. The model’s theoretical predictions are robust to otherdivisions of the surplus.
The venture capitalist maximizes his expected utility in both funds:
max!E[exp(!r[ f1#l
1(g#e
1#e
1)!C(e
1)]
!rd[ f2#l
2(g#e
2#e
2)!C(e
2)])]. (A.6)
The optimal schedule of incentives is derived by starting in the second period.Conditional on first fund returns of n
1, venture capitalists choose effort to
maximize:
max!E[exp(!r[ f2#l
2(g#e
2#e
2)!C(e
2)]) D n
1]. (A.7)
If the investor observes a return of n1
and believes that the venture capitalistexerted eL
1in the first fund, the investor’s posterior estimate of the venture
capitalist’s ability will be
m1(n
1, eL
1)"
p2em0#p2
0(n
1!eL
1)
p2e#p20
. (A.8)
The intuition behind Eq. (A.8) is that the higher first period returns are, thelarger the revision in beliefs about ability will be. The higher the variance ofnoise relative to the variance in abilities is, the smaller the revision in beliefs willbe. If Eq. (A.7) is maximized with respect to e
2, we get the first order condition
for the optimal second period effort:
C@(e2)"l
2. (A.9)
Eq. (A.9) says that venture capitalists work until their marginal share of theexpected increase in return equals their marginal effort cost. We substitute
P. Gompers, J. Lerner/Journal of Financial Economics 51 (1999) 3—44 33
Eq. (A.5) into Eq. (A.7), and take the expectation, to get
max!expC!r
2[m
1(r1, eL )#e
2(l
2)!C(e
2(l
2))!
r
2l22(p2e#p2
1)]D. (A.10)
Note that EMexp(!kx)N"exp(!kk#12k2p2). Maximizing Eq. (A.10) gives the
first order condition for v*2. Eq. (A.11) gives the expression derived from that
solution:
l2"
1
1#2r(p2e#p21)CA(e*
2(l
2)). (A.11)
To get a value for v1, Eqs. (A.5) and (A.4) are substituted into Eq. (A.6), to yield
max!ECexpA!r[12[(1!2l
1)(m
0#eL
1(l
1))#C(eL
1(l
1))]
#l1[g#e
1(l
1)#e
1]!C(e*
1(l
1))]
!rdC1
2C(1!2l2)C
p2e m0#p2
0(y
1!eL
1(l
1))
p2e#p20
#eL2(l
2)D#C(eL
2(l
2))D
#l2[g#e
2(l
2)#e
2]!C(e
2(l
2))DBD. (A.12)
Taking the expectation of Eq. (A.12) yields:
max!expG!r[12(m
0#eL
1(l
1)!C(eL
1(l
1)))]!1
2rd[m
0#e
2(l
2)
!C(e2(l
2))]#1
2r2l2
1[p2e#p2
0]#
1
8
r2d2(1!2l2)2(p2
0)2(p2e#p2
0)
(p2e#p20)2
#12r2d2l2
2(p2e#p2
0)#
1
2
r2dl1(1!2l
2)(p2
0)(p2e#p2
0)
p2e#p20
#
1
2
r2d2l2(1!2l
2)p2
0p2e#p2
0
#r2dl1l2p20H (A.13)
The v1
that satisfies the first-order condition for Eq. (A.13) will be the optimalvariable compensation sensitivity. The first-order condition is
!12#1
2C@(e*
1(l
1))#rl
1(p2e#p2
0)CA(e*
1(l
1))#1
2rd(1!2l
2)p2
0CA(e*
1(l
1))"0.
(A.14)
34 P. Gompers, J. Lerner/Journal of Financial Economics 51 (1999) 3—44
From Eq. (A.12), we know that the venture capitalist’s optimal effort level inperiod 1, e
1, must be given by
C@(e*1(l
1))"l
1#d(1!2l
2)
p20
p2e#p20
. (A.15)
We substitute Eq. (A.15) into Eq. (A.14) and solve for the optimal variablecompensation in period 1:
l1"
1
1#2r(p2e#p20)CA[e*
1(l
1)])
!d(1!2l*2)
p20
p2e#p20
!
2rdl*2p20CA[e*
1(l
1)]
1#2r(p2e#p20)CA[e*
1(l
1)]
. (A.16)
The level of fixed fees is determined by substituting Eq. (A.11) and Eq. (A.16)into Eq. (A.5) and Eq. (A.4), respectively, taking expectations, and solving, toyield f
1and f
2:
f1(l*
1)"1
2[(1!2l*
1)[m
0#e*
1(l*
1)]#C(e*
1(l*
1))], (A.17)
f2(l*
2D n
1)"1
2[(1!2l*
2)C
p2em0#p2
0(n
1!e*
1(l*
2))
p2e#p20
#e*2(l*
2)D#C(e*
2(l*
2))].
(A.18)
Appendix B. Derivation of the signaling model
We continue to employ the basic framework and notation of Appendix A,except that we assume venture capitalists initially know their ability type, butinvestors do not. For ease of exposition, we assume that venture capitalists canhave two types, high-ability (H) or low-ability (L), with gH'gL. Effort after thefirst unit is equally productive for both types because we have assumed anadditive return function. In order to determine the optimal contract that will beoffered by high-ability venture capitalists, we first need to assume that we areconstructing a separating equilibrium. Not only will other separating equilibriaexist, but pooling equilibria are also likely to exist for various parameter values.Because we are interested in the case in which high-ability types are able todistinguish themselves, we will only focus on the Riley (1979) separating equilib-rium.
We again assume that venture capitalists and investors split the expectedsurplus from investments:
f H2#lH
2[gH#eL (lH
2)]!C(eL (lH
2))"1
2[E(gH#eL (lH
2)!C(eL (lH
2)))], (B.1)
f L2#lL
2[gL#eL (lL
2)]!C(eL (lL
2))"1
2[E(gL#eL (lL
2)!C(eL (lL
2)))]. (B.2)
P. Gompers, J. Lerner/Journal of Financial Economics 51 (1999) 3—44 35
The single-period maximization problem then becomes a problem of maximiz-ing expected utility in the second period, assuming full information. Because weare constructing separating equilibria, information about abilities is totallyrevealed in the first period. Contracts signed in the second period reflect thisinformation. For high-ability venture capitalists, we solve
max!E[exp(!r[ f H2#lH
2(gH#e
2#e
2)!C(e
2)])]. (B.3)
The second fund’s variable compensation for both high- and low-ability venturecapitalists is
lH2"lL
2"
1
1#2rp2e CA[e*2(l
2)]"l
2. (B.4)
The result in Eq. (B.4) is not surprising, because we assume that marginalproductivity and effort costs of high- and low-ability venture capitalists are thesame. Because types are fully revealed in the first period, second period compen-sation differs only in the base component of compensation. This is true becausethe utility function we choose does not display any wealth effects. The level ofexpected income does not affect risk aversion. Fixed compensation for the twotypes is given by Eqs. (B.5) and (B.6):
f H2
(l*2)"1
2[(1!2l*
2)[gH#e*
2(l*
2)]#C(e*
2(l*
2))], (B.5)
f L2
(l*2)"1
2[(1!2l*
2)[gL#e*
2(l*
2)]#C(e*
2(l*
2))], (B.6)
The difference in second period fixed compensation is directly proportional tothe difference between high- and low-ability venture capitalists:
f H2!f L
2"1
2(1!2l*
2)[gH!gL]. (B.7)
The optimization program for the high-ability venture capitalist in period 1 isgiven by Eq. (B.8):
max !E[expM!r[12[(1!2lH
1)[gH#eL
1(lH
1)#C(eL
1(lH
1))]
#lH1[gH#e
1(lH
1)#e
1]!C(e
1(lH
1))]N]
s.t !E[expM!r[12[(1!2lL
1)[gL#e*
1(lL
1)#C
1(e*
1(lL
1))]
#lL1[gL#e*
1(lL
1)#e
1]!C(e*
1(lL
1))#dM(1!2lL
2)[gL#e*
2(lL
2)
#C(e*2(lL
2))]#lL
2[gL#e*
2(lL
2)#e
2]!C(e*
2(lL
2))N]N]
"!E[expM!r[12[(1!2lH
1)[gH#e*
1(lH
1)#C(e*
1(lH
1))]
#lH1[gL#e*
1(lH
1)#e
1]!C(e*
1(lH
1))]
#dM(1!2lH2)[gH#e*
2(lH
2)#C(e*
2(lH
2))]
#lH2[gL#e*
2(lH
2)#e
2]!C(e*
2(lH
2))N]N]. (B.8)
36 P. Gompers, J. Lerner/Journal of Financial Economics 51 (1999) 3—44
The interpretation of Eq. (B.8) is straightforward. High-ability venture capital-ists maximize their utility in the first period, subject to the constraint thatlow-ability venture capitalists are indifferent between offering their optimalcontract which reveals their type in period 1 and offering the contract that hightypes offer. The choice of contract for high-ability venture capitalists in the firstperiod will not influence the form of their second period contract, so theirprogram for the first period is to maximize their first period utility, assumingthat low-ability venture capitalists will not find it in their interest to mimic thehigh type’s offer. The high-ability venture capitalist is concerned only aboutfirst-period utility because we are ruling out two-period contracts.
Taking the expectation of Eq. (B.8), and remembering from Eq. (B.4) thatvH2"vL
2"v
2, yields the following:
max!expG!rC12[gH#e1(lH
1)!C(e
1)]!
r
2(lH
1)2p2eDH
s.t. !expG!rC12[gL#e*1(lL
1)!C(e*
1)]!
r
2(lL
1)2p2e
#dM12[gL#e*
1(l
2)!C(e*
2)]!
r
2(l
2)2p2e NDH
"!expG!rC12[(1!2lH1)gH#2lH
1gL#e*
1(lH
1)!C(e
2(l
2))]!
r
2(lH
1)2p2e
#dG12[(1!2l2)gH#2l
2gL#e*
2(lH
2)!C(e*
2(l
2))]!
r
2(l
2)2p2eHDH.
(B.9)
Eq. (B.9) can be transformed into an equivalent optimization problem byremoving the exponentials, to give the program in Eq. (B.10):
max 12[gH#e
1(lH
1)!C(e
1)]!
r
2(lH
1)2p2e
s.t. 12[gL#e*
1(lL
1)!C(e*
1(lL
1))]!
r
2(lL
1)2p2e#dM1
2[gL#e*
1(l
2)
!C(e*2(l
2))]!
r
2(l
2)2p2e N
"12M(1!2lH
1)gH#2lH
1gL#e*
1(lH
1)!C(e
2(l
2))N!
r
2(lH
1)2p2e
#dG12[(1!2l2)gH#2l
2gL#e*
2(lH
2)!C(e*
2(l
2))]!
r
2(l
2)2p2eH.
(B.10)
P. Gompers, J. Lerner/Journal of Financial Economics 51 (1999) 3—44 37
Eq. (B.10) can be solved by forming the Lagrangian Eq. (B.11), and taking thefirst-order conditions for vH
1:
¸"[gH#e*1(lH
1)!C(e*
1)]!r(lH
1)2p2e!jM(1!2lH
1)gH#2lH
1gL
#e*1(lH
1)!C(e
2(l
2))!r(lH
1)2p2e#dM[(1!2l
2)gH#2l
2gL#e*
2(l
2)
!C(e*2(lH
1))]!r(l
2)2p2e N!M[gL#e*
1(lL
1)!C(e*
1(lL
1))]
!r(lL1)2p2e#d[gL#e*
1(l
2)!C(e*
2(l
2))!r(l
2)2p2e r]NN. (B.11)
The solution to these first-order conditions is shown in Eq. (B.12) and (B.13):
lH1"
1#2Aj
1!jB(gH!gL)CA[e1(lH
1)]
1#2rp2eCA[e*1(lH
1)]
, (B.12)
j"e@1!C@(e
1)e@
1!2rlH
1p2e
e@1!C@(e
1)e@
1!2rlH
1p2e#2(gL!gH)
. (B.13)
Because the optimal vH1
is above the unconstrained optimal v, both the numer-ator and the denominator in Eq. (B.13) are less than 0. The absolute value of thedenominator is greater than the absolute value of the numerator, and theLagrangian multiplier is therefore between 0 and 1:
0(j(1. (B.14)
Appendix C. Data sources
The Aeneas Group (now known as Harvard Private Capital Group) is theaffiliate of Harvard Management Company that handles the private-marketinvestments for the Harvard University endowment. The Group’s files onventure investments date back to the late 1970s. Aeneas’ venture investmentstrategy was shaped by the philosophy of Walter Cabot, who ran HarvardManagement between 1974 and 1990. While investing in risky asset classes, suchas venture capital and oil and gas, he emphasized the importance of conductingbusiness with established and reputable financial intermediaries (Grassmuck,1990).
Kemper Financial Services is an investment manager, also known as a gate-keeper, which has invested in venture capital on a regular basis since 1978.
38 P. Gompers, J. Lerner/Journal of Financial Economics 51 (1999) 3—44
Institutional investors, such as pension funds, frequently seek to diversify theirportfolios to include privately held assets. They may not have the resourcesto evaluate potential investments or may not wish to grapple with the compli-cations posed by these investments. For instance, venture capitalists fre-quently liquidate investments in firms by distributing thinly traded sharesto investors. Investment managers will select and manage private investmentsfor institutions, typically for a fee of one percent of the funds invested(Venture Economics, 1989a). Gatekeepers will usually invest in a variety offunds, but the very oldest and youngest funds are likely to be under-represented.Very established venture capital organizations typically have close relationshipswith their limited partners who have invested in several of their funds. They areunlikely to turn to gatekeepers for funding. Meanwhile, gatekeepers may bereluctant to invest in new funds of unproven venture capitalists (Goodman,1990).
Venture Economics is a unit of Securities Data Company that tracks theventure capital industry. The organization was known as Capital Publishingwhen it was established in 1961 to prepare a newsletter on Small BusinessInvestment Companies. Since its acquisition by Stanley Pratt in 1977, thecompany has maintained a file on venture partnerships. Venture Economicscollects this information for its Fund Raiser Advisory Service, which providesconsulting assistance to venture capital organizations that are drafting partner-ship agreements or seeking investors. The funds whose documents are in theirfiles appear to represent a random sample of the industry.
All three organizations began collecting information on a regular basis in thelate 1970s. The occasional earlier documents in these files do not appear to havebeen gathered systematically. We consequently restrict our analysis to fundsthat closed in the period from 1978 through 1992. We find two types ofdocuments in these files. The first are private placement memoranda, themarketing documents that are circulated to potential investors. The second arelimited partnership agreements. These are the contracts that govern the work-ings of the funds. The files at Aeneas and Kemper generally contain both typesof documents. The files at Venture Economics frequently only contain theformer documents. We use the limited partnership agreements in this analysiswhen available. Not only are these documents more comprehensive, but theycontain the final version of the contractual terms. We undertake our analysesusing the entire sample, then repeat the analyses using just the limited partner-ship agreements. This provides a check that our use of two data sources does notintroduce biases.
The search of these three files identifies a total of 543 venture capital fundswhich apparently meet our criteria. We are reluctant to use some of the 142funds with compensation information that are not included in the database offunds compiled by the Venture Economics’ Investors Services Group. Thissubset of the sample is described in Section 4.2. Our primary concern relates to
P. Gompers, J. Lerner/Journal of Financial Economics 51 (1999) 3—44 39
those funds whose only documentation is the private placement memorandumin the Venture Economics collection. We are often unsure whether the fund everclosed. In some cases, the general partners may have been unable to raise thestipulated minimum amount of funds. Several files at Venture Economicscontain a notation indicating that the fund never closed. In other cases, we knowindependently that the fundraising was unsuccessful, but there is no suchnotation in the Venture Economics files. Since many of the offering documentsin Venture Economics files are for young venture capital organizations, there isa danger of including funds that were never raised.
Consequently, we do not include all 543 funds in this analysis. Instead, weinclude funds that satisfy one of two conditions. Either the fund is included inthe Venture Economics funds database and is coded as a partnership sponsoredby an independent venture capital organization, or the fund itself is not includedin the database but the documentation indicates that it is a partnership spon-sored by an independent venture capital organization, and independent corrob-oration of this fund’s successful closing can be found. This corroboration caninclude its listing as a previous fund in a subsequent marketing document, thepresence of a signed contract in one of the files, or a listing by Asset Alternatives(another consulting firm). From our review, we find partnership agreements orprivate placement memoranda in the files of Aeneas, Kemper, and VentureEconomics for 401 funds that satisfied the first set of criteria. 18 funds met thesecond requirement.
Appendix D. Assumptions used in the calculation of variable and basecompensation
The fixed fee in venture capital fund contracts, also known as the managementfee, changes in many funds over time. For instance, the management fees willoften be reduced in later years, reflecting the expectation that the partnership’scosts will decline in the last years of a venture capital fund’s life. The fees maycontain provisions for inflation adjustments. The base used to calculate the feealso often varies. While most agreements compute the annual fee as a percentageof invested capital, in some cases the partnership’s net asset value is used as thebase. Funds will also often limit the maximum or the minimum fee, or both.A number of funds do not charge a stated fee, but rather negotiate fees based onactual expenses. While in most cases the contract will indicate a range in whichfees are expected to fall, in other cases a budget is negotiated annually. Finally,a number of firms charge fees not only on the funds raised by the partnership,but also on the indebtedness of the companies in which they invest. This feestructure was commonplace in the 1960s when Small Business InvestmentCompanies, many of which were commercial bank affiliates, made equity invest-ments in firms and arranged for their credit lines.
40 P. Gompers, J. Lerner/Journal of Financial Economics 51 (1999) 3—44
In order to address the problems that arise from the disparities in venturecapital partnership agreements, we make several assumptions, as follows:
f We do not include in the analysis cases where a budget is negotiated eachyear, or where fees are charged on the indebtedness of companies in whichthey invest. These cases represent only 6% of the observations.
f We assume that all funds last for 11 years. Most funds have a contractual lifeof ten years (a few have shorter lives). Most have provisions, however, for oneor two extensions, each of which can extend the life of the contract for one ortwo more years, which venture capitalists frequently exercise. We repeat theanalysis assuming that the partnerships have a 13 years life. Because mostfunds have fees in their final years that are considerably below the feescharged in earlier years and the assets remaining in the funds at this point aretypically quite small, we find that this change makes little difference.
f In some cases, the fixed fees stipulated in the private placement memorandaare conditional on the ultimate amount raised. For example, fees could be setat 2.5% of committed capital up to $20 million and 2% of all committedcapital above that amount. In these cases, we employ the ultimate amountraised by the partnership to compute the annual fee. If we do not know theultimate amount raised, we use the mid-point between the minimum andmaximum amount being sought. We know the actual amount raised for 94%of the funds.
f We assume that the venture fund’s assets, before any deductions for fees, growat one of three rates: 5%, 20%, or 35%. These values roughly correspond tothe average returns and a one standard deviation range for funds active overthe sample period. As noted above, Venture Economics (1989c) estimates thatfunds established prior to 1982 that were still active in 1989 had a mean returnof 17.6% with a standard deviation of 14.2%.
f We assume that the venture capitalist draws down funds from the limi-ted partners in even amounts at the beginning of the year. Venture partner-ship agreements typically call for funds to be disbursed in a series ofcapital infusions. This structure reflects the staged nature of the ven-ture investment process, wherein the bulk of the funds are not immediatelyneeded (Sahlman, 1990). For example, if the contract calls for 40% of thefunds to be disbursed at the close of the investment and 30% to be disbursedat the first and second anniversaries, we treat these as three equal install-ments. If the contract only indicates a minimum and maximum time until thelast investment will be required, we use the anniversary nearest the mid-pointof this range. If no schedule of capital infusions is provided, we assume thatthe funds are drawn down in three equal amounts, at the closing and firstand second anniversaries. For those funds in our sample with complete data,the mean time from the closing to the last draw-down is 2.4 years; the median,2.0 years.
P. Gompers, J. Lerner/Journal of Financial Economics 51 (1999) 3—44 41
f We assume that distributions follow an identical pattern for all funds includedin the sample. A major institutional investor has provided us with monthlyvaluation and distribution data through December 1992 for 140 domestic andforeign venture funds. For the 116 funds which we can confirm as independentU.S.-based venture partnerships, we compute the ratio of the distributions ineach year of the fund’s life to its valuation on the previous anniversary. Weassume that each fund follows this average pattern in undertaking its distribu-tions. In other words, since the average fund distributes 10% of the value of itsassets between its fourth and fifth anniversary, each fund in our calculationsdoes the same. If all distributions go to the limited partners prior to the returnof committed capital, we replicate this pattern in our calculations, and if thefund specifies a hurdle based on net asset value, we employ such a test. Weassume that the portfolios are completely liquidated on their eleventh anni-versary. We explore the robustness of the results to other assumptions byrepeating the calculations using two other rules. We alternatively assume that(i) distributions, as a percentage of asset value, are twice as high as in theinstitutional investor’s sample, and (ii) that no fund undertakes any distribu-tions until the end of the eleventh year. The results in Tables 4—6 are robust tothese assumptions.
f For those funds that compute fees on the basis of capital under management,less the cost basis of distributions and write-offs, we assume that the cost basisof distributions follows a pattern proportional to the distributions, such thatif 10% of all distributions over the life of the partnership occur in one year,then 10% of the reduction in the cost basis occurs in that year. When we varythe pattern of distributions as described above, we vary the change in the costbasis accordingly.
f We assume that each year’s fixed fees are paid in advance on each anniver-sary. These payments are almost always paid in advance on a quarterly basis,but this assumption simplifies the calculations considerably.
f If the fees are reduced after the fund is fully invested, we assume thatthis reduction occurs two years after the date of the last capital draw-down. If the fees are reduced after the fund is 75% invested, we assumethat this reduction occurs one year after the date of the last capital in-fusion. We also assume that these events occur four and two years, respec-tively, after the last capital draw-down, and find that the changes have littleimpact.
f If the fees are reduced after the organization raises a new fund, we assume thatthis event occurs on the fund’s sixth anniversary. We use this anniversary yearbecause of historical patterns. Examining the venture funds raised before1985, we find that the median organization raised its next fund four years andone month after the last closing. Because fund-raising has become moredifficult in recent years, we use a slightly longer interval for our calculations.We also assume that the next fund is raised four years after this fund’s closing.
42 P. Gompers, J. Lerner/Journal of Financial Economics 51 (1999) 3—44
We find that the change has little impact. If fees are indexed for inflation, weassume that they rise at a 4% annual rate.
f In our calculations, we do not consider whether the fixed fee covers the legal,accounting, brokerage, and consulting fees, or whether these additional costsare borne in whole or in part by the limited partners. These charges aregenerally modest. An analysis of recent annual reports in the files of Aeneas,which include a total of 141 reporting years covering 44 funds, suggest thatthese fees average less than 0.1% of net asset value. Our reluctance to includethese fees stems from the disparate information contained in the partnershipagreements and private placement memoranda. While the treatment of thesefees is always addressed in the partnership agreements, such relatively minorconsiderations are often ignored in placement memoranda. Rather thanintroduce biases due to incomplete reporting, we ignore this factor entirely.This choice will lead to a slight understating of fees. Similarly, we ignore anyreductions in fees due to the payment of board membership fees by portfoliocompanies to the general partners. This omission will lead to a slight overstat-ing of fees.
f We alternately discount the venture capitalists’ compensation at 10%,15%, or 20%. We also discount fees that can be expected to be paid withrelative certainty, including those based on committed capital, committedcapital less the cost basis of distributions, or the minimum of committedcapital and net asset value, at 10%, while applying a 20% discount rate to themore uncertain fees, based on net asset value or the maximum of asset valueand capital under management. Distributions of capital gains are discountedin this case at 20%.
References
Barry, C.B., Muscarella, C.J., Peavy III, J.W., Vetsuypens, M.R., 1990. The role of venture capital inthe creation of public companies: Evidence from the going public process. Journal of FinancialEconomics 27, 447—471.
Gibbons, R., Murphy, K.J., 1992. Optimal incentive contracts in the presence of career concerns:Theory and evidence. Journal of Political Economy 100, 468—505.
Gompers, P.A., 1996. Grandstanding in the venture capital industry. Journal of Financial Econ-omics 42, 133—156.
Gompers, P.A., Lerner, J., 1996. The use of covenants: An empirical analysis of venture partnershipagreements. Journal of Law and Economics 39, 463—498.
Gompers, P.A., Lerner, J., 1998. Venture capital distributions: Short- and long-run reactions.Journal of Finance (forthcoming).
Grassmuck, K., 1990. The much-praised and often-criticized “architect” of Harvard’s endowmentgrowth steps down. Chronicle of Higher Education 36 (June), A25—A27.
Heinkel, R., Stoughton, N.M., 1994. The dynamics of portfolio management contracts. Review ofFinancial Studies 7, 351—388.
P. Gompers, J. Lerner/Journal of Financial Economics 51 (1999) 3—44 43
Holmstrom, B., Milgrom, P., 1987. Aggregation and linearity in the provision of intertemporalincentives. Econometrica 55, 303—328.
Kunze, R.J., 1990. Nothing Ventured: The Perils and Payoffs of the Great American Venture CapitalGame. HarperBusiness, New York.
Lerner, J., 1995. Venture capitalists and the oversight of private firms. Journal of Finance 50,301—318.
Liles, P., 1977. Sustaining the Venture Capital Firm. Management Analysis Center, Cambridge, MA.Megginson, W.C., Weiss, K.A., 1991. Venture capital certification in initial public offerings. Journal
of Finance 46, 879—893.Nash, J.F., 1950. The bargaining problem. Econometrica 18, 155—162.Riley, J., 1979. Information equilibrium. Econometrica 47, 331—359.Sahlman, W.A., 1990. The structure and governance of venture capital organizations. Journal of
Financial Economics 27, 473—521.Tyebjee, T.T., Bruno, A.V., 1984. A model of venture capitalist investment activity. Management
Science 30, 1051—1066.Venture Economics, 1988. Exiting Venture Capital Investments. Venture Economics, Needham, MA.Venture Economics, 1989a. Investment managers — a force in the venture capital industry. Venture
Capital Journal 29 (September), 10—17.Venture Economics, 1989b. Terms and Conditions of Venture Capital Partnerships. Venture