Page 1
1
An Analysis of Competition and Market Structure in the Nigerian Banking Industry
(2001-2013)
SAIBU Olufemi Muibi
Department of Economics,
University of Lagos Akoka Lagos, Nigeria
Email: [email protected] ,ng Phone: +234 (0)8033518639
Abstract
This paper investigates the degree of competition and concentration in the Nigerian banking
industry since 2001. This paper also measures and compares the degree of banking
competition in two sub periods, 2001–2004 and 2005–2013, in order to investigate the
implication of 2004 bank consolidation on the competiveness of banks in Nigeria. A unique
contribution of this study over any other studies on Nigerian banking industry is the use of a
detailed bank-level panel data set, and measuring competition using the PR-H-statistic and
the Lerner index. The estimation of Lerner index provides the first ever documented
empirical evidence on the evolution of competition in the Nigerian industry. The results
showed that over the sample period, Nigerian banks exhibited elements of monopolistic
competitive behaviour. Specifically, the H- statistic estimated from the composite revenue
equation was found to be positive and statistically different from zero and unit. For the Lerner
index, the results provide deeper insights on the competitive conduct of Nigeria banks. Over
the period of analysis, the Lerner index showed a growing intensity of competition, particular
in post-consolidation period. Furthermore, the paper finds that banks’ risk averseness,
revenue diversity and regulatory intensity are all important factors in influencing exercise of
revenue generating capacity of banks and market power.
JEL Classifications: C33, D43, G21, L13
Key Words: Banking, competition, Lerner index, market power
Page 2
2
1.0 Introduction
The Nigerian banking industry underwent significant restructuring between 2000 and 2014
when over 100 banks as at 2000 were contrived to 25 banks in 2005 and to less than 18 banks
by 2014. Prior to this period, many of these banks had less than N2billion as their capital
base. Through a Central Bank directive the bank were mandated to recapitalise to a minimum
of N25billion by 2005. Those banks that could not raise such funds were encouraged to
merge or be acquired by other bigger banks. Definitely, the reduction in the number and
increase in the capital base would have altered the structure and competiveness of the
banking industry in Nigeria. A competitive banking sector is important for the proper
functioning of the economy. Indeed, the banking sector is the cornerstone of any properly
functioning modern economy hence changing in its structure should be utmost important to
both scholars and policy analysts. . Studies on competition in banking markets though has
been at the centre of research since 1980s,, yet studies from Africa and other emerging
markets are sparse and significant pedestrian in scope and depth. Without doubt, studying
competition in banking industry particularly for developing country like Nigeria where
reforms have been undertaken over the past decades is undoubtedly crucial hence the need to
examine the experiences countries in Africa that have undertaken financial reforms in term of
how such reforms have altered the structure and competiveness of the banking industry in
such counties
A unique contribution of this study over any other studies on Nigerian banking industry is the
use of a detailed bank-level panel data set, and measuring competition using the PR-H-
statistic and the time varying Lerner index. The estimation of Lerner index provides the first
ever documented empirical evidence on the evolution of competition in the Nigerian industry.
In addition to evaluate the consolidation effects on competitive conduct of banks operating in
Nigeria, H -statistic across two periods (pre-consolidation and post-consolidation) and the
time varying Lerner indices are estimated and compared. This analysis provides a unique
opportunity to reconcile the dilemma of inconsistencies between expectations of policy
reforms and observed evidence on the conduct of Nigerian banks and identify those factors
that can under a successful competition law and regulatory framework to strengthening
competiveness of Nigerian baking industry..
.Apart from the introduction section the paper will be divided into five sections. Section 2
provided some stylized fact about Nigerian banking industry while section 3 reviews some
related studies and provides the conceptual underpinning of the study. Section 4 discusses the
methodology and section 5 presents the empirical results while section 6 summarizes with
policy implications
2.0 Financial Sector Reforms and Bank Competitiveness in Nigeria
After more than two decades of financial repression, financial liberalisation offered an
opportunity for a revival of the Nigerian banking industry. As part of the broader economic
reform package, financial reforms were in recognition that a well-functioning and
competitive financial system is critical to the country’s overall economic development. By
2005, the Central Bank of Nigeria embarked on Banking Consolidation exercise, a
widespread strategy aimed at strengthening financial sector infrastructure to enable it support
sustainable economic growth. The implementation of the consolidation has helped address
key bottlenecks in the financial system, including improving corporate governance of the
banking sector, after the crisis of the pre 2004.
Page 3
3
In 2008,the existing 25 banks were further pruned down to 17 through a rescue exercise by
the central bank of Nigeria. Out of these, seven were first generation banks and others were
new generation banks. Majority of these banks were instructed to divest from non banking
activities and this led to the provision of a unique feature of ownership, encompassing foreign
financial equity stake, domestic private sector participation and public sector interest.
Nonetheless, management rights reside with Nigerians. However, the Nigerian banking
industry continues to exhibit a high level of concentration as very few banks dominate the
financial landscape. In terms of assets and deposits, five largest banks accounted for sixty six
percent between 2004 and 2013. The other banks captured the remaining one third.
As per profitability, the two traditional profitability measures of ROA and ROC employed.
However, these measures alone are no longer adequate to measure banks profitability
performance as they do not adequately meet the needs of stakeholders. Nigerian banks have
been vibrant, generated from earnings on loans, bonds and treasury bills. The increase in the
number of new entrants in the late 1990s lent credence to this view. The profitability level of
most banks however nosedived between 1998 and 2011 due to a number of factors including,
inadequate risk management capacity, ethical issues and poor corporate governance. ROA
averaged about 6% for this period, the regulatory authority had to intervene to acquire the
non performing loans of these banks by 2009. At the same time, this performance led to
acquisition of five distressed banks, at a time the whole industry also experienced a squeeze
in earnings due to the global financial crisis.
To reinforce the Nigerian economy, the central bank of Nigeria announced a new 13-point
reform agenda in mid 2004. Overall, the goal of this agenda is to promote soundness, stability
and enhance international efficiency of the Nigerian banking industry. The highpoint of this
reform is that all banks in the country should raise their minimum capital base to N25 billion,
with a compliance deadline of 18 months. The efforts of banks to comply with this directive
triggered merger and acquisitions. This also led to the increase of the share of the industry in
the Nigeria Stock capitalization from 24% to 38% between 2004 and 2006. At this end of
this deadline, 25 banks made it through out of which nine were first generation banks. (CBN,
2008).In spite of these positive developments, a new set of challenges merged in 2008 and
threatened the financial system, coinciding with the global financial crisis.
0
10
20
30
40
50
60
70
80
90
100
19
90
19
91
19
92
19
93
19
94
19
95
19
96
19
97
19
98
19
99
20
00
20
01
20
02
20
03
20
04
20
05
20
06
20
07
20
08
20
09
20
10
20
11
20
12
20
13
Fgure 1: Number of Baks in Nigeria
Page 4
4
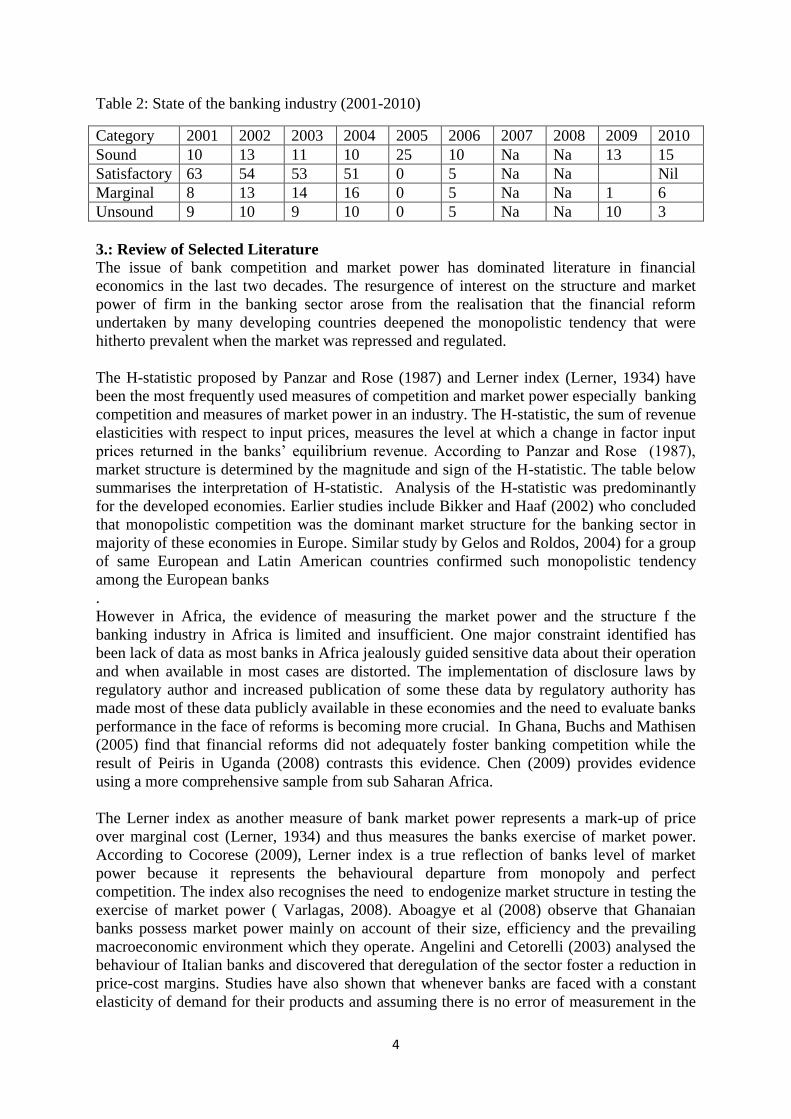
Table 2: State of the banking industry (2001-2010)
Category 2001 2002 2003 2004 2005 2006 2007 2008 2009 2010
Sound 10 13 11 10 25 10 Na Na 13 15
Satisfactory 63 54 53 51 0 5 Na Na Nil
Marginal 8 13 14 16 0 5 Na Na 1 6
Unsound 9 10 9 10 0 5 Na Na 10 3
3.: Review of Selected Literature
The issue of bank competition and market power has dominated literature in financial
economics in the last two decades. The resurgence of interest on the structure and market
power of firm in the banking sector arose from the realisation that the financial reform
undertaken by many developing countries deepened the monopolistic tendency that were
hitherto prevalent when the market was repressed and regulated.
The H-statistic proposed by Panzar and Rose (1987) and Lerner index (Lerner, 1934) have
been the most frequently used measures of competition and market power especially banking
competition and measures of market power in an industry. The H-statistic, the sum of revenue
elasticities with respect to input prices, measures the level at which a change in factor input
prices returned in the banks’ equilibrium revenue. According to Panzar and Rose (1987),
market structure is determined by the magnitude and sign of the H-statistic. The table below
summarises the interpretation of H-statistic. Analysis of the H-statistic was predominantly
for the developed economies. Earlier studies include Bikker and Haaf (2002) who concluded
that monopolistic competition was the dominant market structure for the banking sector in
majority of these economies in Europe. Similar study by Gelos and Roldos, 2004) for a group
of same European and Latin American countries confirmed such monopolistic tendency
among the European banks
.
However in Africa, the evidence of measuring the market power and the structure f the
banking industry in Africa is limited and insufficient. One major constraint identified has
been lack of data as most banks in Africa jealously guided sensitive data about their operation
and when available in most cases are distorted. The implementation of disclosure laws by
regulatory author and increased publication of some these data by regulatory authority has
made most of these data publicly available in these economies and the need to evaluate banks
performance in the face of reforms is becoming more crucial. In Ghana, Buchs and Mathisen
(2005) find that financial reforms did not adequately foster banking competition while the
result of Peiris in Uganda (2008) contrasts this evidence. Chen (2009) provides evidence
using a more comprehensive sample from sub Saharan Africa.
The Lerner index as another measure of bank market power represents a mark-up of price
over marginal cost (Lerner, 1934) and thus measures the banks exercise of market power.
According to Cocorese (2009), Lerner index is a true reflection of banks level of market
power because it represents the behavioural departure from monopoly and perfect
competition. The index also recognises the need to endogenize market structure in testing the
exercise of market power ( Varlagas, 2008). Aboagye et al (2008) observe that Ghanaian
banks possess market power mainly on account of their size, efficiency and the prevailing
macroeconomic environment which they operate. Angelini and Cetorelli (2003) analysed the
behaviour of Italian banks and discovered that deregulation of the sector foster a reduction in
price-cost margins. Studies have also shown that whenever banks are faced with a constant
elasticity of demand for their products and assuming there is no error of measurement in the
Page 5
5
variables, there is a symmetrical relationship between the H-statistic and the Lerner index
(Shaffer, 1983; Bikker and Haaf, 2002). As banks become more competitive (higher H-
statistic), the narrower the relative price-cost mark-up (smaller Lerner index). A number of
recent studies apply both approaches in measuring banking competition to serve as a check
for the other. In general, the two approaches provide reasonable explanations of banking
competitive performance in any economy (Cetorelli 1999).
Casu and Girardone (2003), investigated factors influencing the degree of competition in the
banking sector of the single European market. The result suggests that, the degree of
concentration did not necessarily relate to the degree of competition. The relationship
between the two is not uni-directional as increased competition has forced banks to become
more efficient but increased efficiency is not resulting in more competition in the EU banking
system. Similar concerns were expressed by Habte (2012), when he explores competitive
conditions of banking system of Sweden using the same method; the result suggests that,
banks in Sweden generate their revenues under a monopolistically competitive environment.
The boone indicator however suggests that, there was a slight drop in the degree of
completion after the recent global crisis.
However, applying the Lerner approach to China, Bing and Michael (2013), observed that
Lerner index failed to measure competition in the Chinese banking industry due to the
regulation of interest. Simpasa (2013) argued that profit elasticity approach of Boone (2008)
does not suffer from these shortcomings. Adopting the same model, Stavarek and Repkova
(2011), analysed competitive nature of Czeck banks over a decade. The result indicated that,
dound conditions for competition were present in the banking industry of Czeck. While the
market can be described as perfectly competitive, the degree of competitiveness declined
after joining the EU in 2004 and the market can now be described as one of monopolistic
competition.
Sunil and Binsheng (2008), investigated the impact of financial sector reforms on the
competitiveness of banks in Egypt. The study showed that while that the state owned banks
are generally less competitive, when compared with their privately owned counterparts. The
average x-efficciency of Egyptian banks is around 30% which is comparable to those
reported for other African countries. Mohammad (2013),presented a comparative analysis of
the banking sector in Iran using two different empirical Industrial Organisation (NEIO)
approaches (Panzar-Rosse and Hall Roeger Models. The result of the calculated H-statistic
shows that, the Iranian banking sector’s has a monopolistic structure. The results showed that,
the degree of competitiveness in Hall-Roeger model seems to be intensive than other model,
indicating that, the Iranian banking industry is non-competitive. Similarly, Sami (2009) and
Bikker et al. (2012), analysed the degree of competitiveness of banks in Tunisia using
Panzar-Rosse Model. The result of the study reports the H-statistic to be 0.89, indicating that
Tunisian banks operate in neither a joint monopoly nor a collusive competition context, and
that they evolve within an oligopolistic competition context in a contestable market. Thus, it
confirms the presence of a competitive environment.
Hakam et al (2013), Fosu (2013), empirically showed that, there is a positive relationship
between the index of competition and concentration thereby verifying our theoretical
perception. Their results are consistent with those of other emerging economies, results
suggest African banks generally, demonstrate monopolistic competitive behaviour. Although
the result further indicate that, the Panzar-Rosse H-statistic is downward biased compared to
Page 6
6
the dynamic version. The competitive characteristics identified are however robust to
alternative estimators. Kot (2004), unlike earlier studies differ by employing both the Panzar-
Rosse and Bresnahan models respectively to analyse the implication of competition on the
South Africa banking sector. The result of the study suggests is consistent with monopolistic
competition. There seems to be high concentration and the banks are not acting aas a cartel.
Generally speaking, the two approaches offer reasonable explanations of banking competitive
performance in any economy and reinforce the perceptive that competition and monopoly are
neither plausible practical outcomes of market conduct in the banking industry , (Cetorelli,
1999). Simpasa (2013) evaluated the degree of competition in the Zambian banking sector in
the wake of dynamic market shifts induced by entry of new foreign banks and privatisation of
the state-owned bank. Using both PR-H index and a time varying Lerner index showed that
Zambian banks earned their revenue under conditions of monopolistic competition and
argued further that competitive conditions could be further enhanced by easing regulatory
impediments and in the long-run, allowing more foreign bank participation could spur
competitive conduct in the industry.
The evidence of banking structure and market power is sparse, indeed to stimulate interest in
this area the Central bank of Nigeria has to initiate a comprehensive study on the issue. CBN
(2013) argued that while the trend of bank profits in Nigeria since the liberalization of the
financial sector and the increased number of new entrants to the industry had led to the
thinking in many circles that investment was most worthwhile in the banking industry, the
bank noted that there are no available statistics either for inter-temporal or group comparisons
within the banking industry and much more so for comparison between returns on investment
in the banking and the other industries. The paper argued that existing studies that assess the
performance of the Nigerian banking industry either had the mark of incomplete coverage or
were limited in scope in terms of the number of metrics used. Different from past studies
which employed majorly aggregate data, CBN (2013) adopts bank level data for assessment
of not just bank performance but also intermediation, growth and competition in the banking
sector. The results of the study indicated that though the Herfindahl-Hirschman Index (HHI),
a metric for measuring competition, with respect to assets and deposits increased after the
bank consolidation exercise, the industry remained largely competitive, as concentration
declined slightly. With respect to size and performance, the mixed results from the analysis
across the different policy periods and sizes, indicated that bigger is not necessarily better, in
terms of profitability, cost and managerial efficiency as well as productivity. The paper
argued that the result notwithstanding, except similar studies are done the outcome of this
study may not be sufficient to safely and conveniently conclude that the banking industry is
more competitive enough to attract for investments than other segments of the economy.
One of the major motivations for this paper is to determining the nature and degree of market
structure of Nigeria banks. While the CBN (2013) paper remained the most comprehensive
study on the post consolidation appraisal of banking industry, the caution expressed its result
shows that the issue is subject to empirical debate. More so this paper attempt to use PR-H
model and also to estimate the time varying Lerner index which has not been used
extensively in studies on Nigeria economy.
4 .0 Methodology
The primary interest of this study is to analyse the nature of competition in the Nigerian
banking industry from the perspective of broader macroeconomic setting. This paper adopts
Page 7
7
both the Panzar-Rosse and Lerner index methods. Both approaches have sound theoretical
foundations and empirical appeal and had been applied to banking data from other countries
like Ghana, Egypt Morocco and Zambia. The analysis enables us to compare our results with
those obtained from previous studies, especially those African countries with similar banking
reform experiences.
The PR methodology allows for bank specific differences in the reduced form revenue
function and acknowledge of bank output and prices is not required. Following Simpasa
(2013) the empirical PR model is specified as
:
𝐼𝑛(𝑁𝑟𝑒𝑣𝑖𝑡) = 𝛽0 + 𝛽1𝐼𝑛(𝑃𝐶𝑖𝑡) + 𝛽2𝐼𝑛(𝑃𝐹𝑖𝑡) + 𝛽3𝐼𝑛(𝑃𝐿𝑖𝑡) + 𝛽4𝐼𝑛(𝐶𝑅𝐼𝑆𝐾𝑖𝑡) +𝛽5𝐼𝑛(𝐶𝐴𝑃𝑅𝑖𝑡) + 𝛽6𝐼𝑛(𝑂𝐼𝑖𝑡) + 𝛽7𝐼𝑛(𝐼𝑁𝐹𝑖𝑡) + 𝛽8𝐼𝑛(𝑇𝐵𝑅𝑖𝑡) + +𝑒𝑖𝑡…….(1)
Where subscripts i and t denote bank i at time t and nrevit is bank Net Income, scaled by total
assets to control for scale effect; PC, PLit, PF are price of capital, approximated by expenses
on salaries and other staff compensation, divided by total asset; unit price of fund (interest
expenses divided by total purchased fund); unit price of capital (all other expenses divided by
fixed and other assets). While OIit, RISKit, INFLt, and TBRRit denote, respectively,
operational inefficiency, Credit Risk, Capital to risk Ratio, Inflation Rate, Treasury Bills
Rate. Explanatory variable are given by bank specific factor and indicators of
macroeconomics condition to capture the environment under which banks operate. RISK is
the ratio of nonperforming loan to gross loan; CAPR is the ratio of capital-to-risk weighted
assets capturing regulatory burden. To capture macroeconomic condition, we include
volatility in the rate or inflation (INFL) to control for macroeconomic uncertainty while the
91-day Treasury bill rate (TBR) is included to capture stance of monetary policy on the bank
behaviour(Sanya and Gaether 2012).
From Equation (2), H=𝛽1 + 𝛽2 + 𝛽3, the sum of the revenue elasticities with respect to input
factor prices.
Table 3: Interpretation of the Panzar Rose H-statistic H-statistic
Hypothesis
Market Structure Features
H <0 Monopoly or conjectural variations short term oligopoly. In this case each bank operates
independently as under monopoly profit maximising conditions and the H-statistic is a decreasing
function of the perceived demand elasticity.
0 < H < 1 Monopolistic competition characterised by free entry equilibrium excess capacity. The H-statistic
is an increasing function of perceived demand elasticity.
H = 1 Perfect competition, or natural monopoly in a perfect contestable market or sales maximising firm
subject to break even constant. It could imply free entry equilibrium with full capacity utilization.
Source: Simpasa (2013).
4.1 Empirical model of the Lerner index
The empirical strategy for estimating the Lerner index is adapted from Fernandez de Guevara
and Maudos (2007) and Aboagye, et al. (2008) as applied it to Ghanaian banks. Thus, in line
with these studies, we estimate a generalised a translog cost function given by the equation
below:
Page 8
8
𝐼𝑛(𝑇𝐶𝑖𝑡) = 𝛼0 + 𝛼1𝐼𝑛(𝐼𝑁𝐶𝑖𝑡) + 1/2𝛼2𝐼𝑛(𝐼𝑁𝐶𝑖𝑡)2 + 𝛼3𝐼𝑛(𝑃𝐶𝑖𝑡) + 𝛼4𝐼𝑛(𝑃𝐹𝑖𝑡) +𝛼5𝐼𝑛(𝑃𝐿𝑖𝑡) + 𝛼6𝐼𝑛(𝑃𝐶𝑖𝑡)2 + 𝛼7𝐼𝑛(𝑃𝐹𝑖𝑡)2 + 𝛼8𝐼𝑛(𝑃𝐿𝑖𝑡)2 + 𝛼9𝐼𝑛(𝑃𝐶𝑖𝑡)𝐼𝑛(𝑃𝐹𝑖𝑡) +𝛼10𝐼𝑛(𝑃𝐶𝑖𝑡)𝐼𝑛(𝑃𝐿𝑖𝑡) + 𝛼11𝐼𝑛(𝑃𝐿𝑖𝑡)𝐼𝑛(𝑃𝐹𝑖𝑡) + 𝛼12𝐼𝑛(𝐼𝑁𝐶𝑖𝑡)𝐼𝑛(𝑃𝐶𝑖𝑡) +𝛼13𝐼𝑛(𝐼𝑁𝐶𝑖𝑡)𝐼𝑛(𝑃𝐹𝑖𝑡) + 𝛼14𝐼𝑛(𝐼𝑁𝐶𝑖𝑡)𝐼𝑛(𝑃𝐿𝑖𝑡) + 𝛼15𝐼𝑛(𝑅𝐼𝑆𝐾𝑖𝑡) + 𝑒𝑖𝑡…….(2)
If (𝑃𝐹𝑖𝑡), (𝑃𝐹𝑖𝑡) 𝑎𝑛𝑑 (𝑃𝐿𝑖𝑡) is represented by (𝑃𝑖) 𝑎𝑛𝑑 𝑖 = 1,2 … … 𝑗 then equation 3
becomes
𝐼𝑛(𝑇𝐶𝑖𝑡) = 𝛼0 + 𝛼1𝐼𝑛(𝐼𝑁𝐶𝑖𝑡) + 1/2𝛼2𝐼𝑛(𝐼𝑁𝐶𝑖𝑡)2 + ∑ 𝛿1𝑖𝐼𝑛𝑃𝑖
𝑗=3
𝑖=1
+ ∑ 𝛿2𝑖
𝑗=3
𝑖=1
(𝐼𝑛𝑃𝑖𝑖𝑡)2
+ ∑ 𝛿3𝑖
𝑗=3
𝑖=1
(𝐼𝑛𝑃𝑖𝐼𝑛 𝑃𝑖𝑖𝑡) + ∑ 𝛿4𝑖
𝑗=3
𝑖=1
(𝐼𝑁𝐶𝑖𝐼𝑛𝑃𝑖𝑖𝑡) + 𝛼15𝐼𝑛(𝑅𝐼𝑆𝐾𝑖𝑡) + 𝜖𝑖𝑡, 𝑖
= 1 … 𝑁 𝑡 = 1 … 𝑇 … … … … .3
TCit denotes total operating cost (interest expenses plus non-interest expenses), output
measure by total assets (INCit), input factor prices are as defined above while 𝜖 is a composite
disturbance error term obeying all classical assumptions. Partially differentiating Equation (2
or 3) with respect to INCit yield bank level marginal cost (MCit):
𝑀𝐶𝑖𝑡 =𝜕𝐼𝑛𝑇𝐶
𝜕𝐼𝑛𝐼𝑁𝐶=
𝑇𝐶𝑖𝑡
𝐼𝑁𝐶(𝛼1 + 𝛼2𝐼𝑛(𝐼𝑁𝐶𝑖𝑡) + ∑ 𝛿4𝑖𝐼𝑛𝑃𝑖
𝑗=3
𝑖=1
) … … … … … 4
Bank level marginal cost (𝑀𝐶𝑖𝑡) and corresponding output price, measured as total income
divided by total bank assets (𝑂𝑃𝑖𝑖𝑡), are in turn used to calculate the bank-specific time
varying Lerner index,
𝐿𝐼𝑖𝑡 =𝑂𝑃𝑖𝑡 − 𝑀𝐶𝑖𝑡
𝑂𝑃𝑖𝑡… … … … … … 5
Averaging (MCit) and (OPit) across all banks yields the industry Pit , wide marginal cost (mcit)
and market price (Pt) which are used to generate the industry wide Lerner index, given by;
𝐿𝐼𝑡 =𝑂𝑃𝑡 − 𝑀𝐶𝑡
𝑂𝑃𝑡… … … … … … … 6
𝐿𝐼𝑡 is a counterpart of the H-statistic but show evolution over time. Under perfect
competition, 𝑂𝑃𝑡 = 𝑀𝐶𝑡 t, and hence 𝐿𝐼 = 0. A large deviation of prices from marginal cost
depicts increasing monopolistic conduct with the Lerner index approaching unit. A 𝐿𝐼 = 1
signifies complete exercise of market power. Like the H-statistic, LIit is bounded between 0
and 1 with intermediate values denoting monopolistic competition. However, Sampisa (2013)
argued that it is not uncommon for Lerner index to take on negative values and Solis and
Page 9
9
Maudo (2008), denotes it as ‘super competition’ and may occur when banks price below
marginal cost such as the case of initial subsidization noted above .
To analysis the main determinants of market power of Nigeria banks, the estimates of the
bank level Lerner index regress on bank-specific and environmental factors (regulatory and
macroeconomic variables) in order to evaluate factors that drive market power in the
Nigerian banking industry . Equation (4) specifies the relationship between the estimated
bank level Lerner index and potential correlates.
𝐿𝐼𝑖𝑡 = 𝜗0 + 𝜗1𝐼𝑛𝑅𝐼𝑆𝐾𝑖𝑡 + 𝜗2𝐼𝑛𝐶𝐴𝑅𝑖𝑡 + 𝜗3𝑂𝐼𝑖𝑡 + 𝜗4𝑇𝐵𝑅𝑖𝑡 + 𝜗5𝐼𝑁𝐸𝐹𝐹𝑖𝑡 + 𝑣𝑡…7
The variables are as previously defined. In addition, we add a measure of intermediation
inefficiency (INEFF) to capture the potential effect of market inefficiency on financial
intermediation. Simpassa (2013 used Cost inefficiency scores generated from a stochastic cost
frontier equation in line with Simpasa (2010). As Simpasa noted “Cost inefficiency in banking is
often associated with high mark-ups because banks tend to mask their operating inefficiency
through high spreads, the cost of which is borne in most cases by customers
4.3 Data Sources and Estimation Techniques
Annual time series data from 1998-2011 for 20 commercial banks in Nigeria are used to
estimate the H statistic and LI. Two banks that began operation after 2010 are excluded
from the analysis due to insufficient data points. Three competing panel (Pooled, Random
and Fixed Effects) econometric approaches are usually adopted in estimating models of
banking competition. However, out of the competing panel data methods, the choice is
mainly between fixed and random effects models. Pooled effects approach has been found to
be inadequate due potentially strong firm and temporary effects, which may arise from
heterogeneity of banks (Arellano, 2003). The choice between random and fixed effects
models is guided by the results of the Hausman specification test. The data are collected from
the banks’ balance sheet and profit/loss accounts and Fact NSE Factbook, a yearly
publication of Nigeria stock exchange.
5.0 Empirical Results
The starting point of the analysis is the estimation of the panel model. Based on the estimates
evidence on competitive conduct in the Nigerian banking sector is assessed by the estimate of
the H – Statistics. The benchmark model is applied on a full sample period for all banks
captured in the study. The Hausman specification tests for panel data ruled out the random
effects model. Nonetheless, in assessing the robustness of the PR model under different panel
data statistical methods, we present the results of the three models and we estimated the H-
statistic for all the three and it was clear that the H-statistic for the Fixed Effect model is
found to be higher and most significant by the Wald test conducted. Thus, for the Nigerian
banking sector, the full sample H – statistic estimate may be sensitive to the choice of the
panel estimation approach and therefore conscious effort must be made in model selection
process. The results are presented in Table 4
Page 10
10
Table 4.0: Panel estimation of PR Model
Independent variables Pooled Effects Random Effect Fixed Effect
PC
0.115**
(4.105)
0.116**
(3.88)
0.527**
(4.01)
PF
0.023**
(3.213)
0.023**
(3.36)
0.024**
(3.20)
PL
-0.053**
(-2.044)
-0.015
(-0.39)
-0.041**
(-3.45)
CRISK
-0.069**
(-3.995)
-0.007**
(-4.79)
-0.078**
(-3.57)
CAPR
-0.059*
(-1.949)
-0.028
(-1.20)
-0.061
(-1.75)
OI
-0.005
(-0.760)
-0.011
(-1.23)
-0.005
(-0.65)
TBR
-0.067
(-0.257)
-0.016
(-0.77)
0.001
(0.30)
INFL
-0.016
(-0.719)
-0.054
(.0.88)
-0.041**
(-3.33
C
0.089
(0.652)
0.013
(0.12)
0.050
(0.37)
Adjusted R-squared 0.163 0.133 0.209
F-statistic
6.458
(0.000)
5.069
(0.00)
3.179
(0.000)
Wald Test: H-Statistics 0.133 0.139 0.511
Null: H=0 (p-value) Monopoly
Null: H=1 (p-value) Perfect Competition
(Hausman ) Test Χ2 = 4.2745 (0.00333)
Significance Level : *p<0.10, **p<0.05, ***p<0.01
The empirical analysis of the results show that the estimated H- statistic is 0.51 and it is
statistically significant at 1% level. The null hypothesis of both monopoly and perfect
competition are therefore rejected. The intuition of the empirical analysis result of the study
over the sample period is that Nigerian Banks earned their revenue under conditions of
monopolistic competition. Intuitively, the empirical results suggest that the factor prices are
important for the Nigerian banks in the pricing of bank products and services. From the
result, price of capital contribute the most to the value of H- statistic. The wages and salary
was found to be drag of revenue generating capacity of the banks, The banking industry is the
highest paying industry in Nigeria. And the bulk of this are paid to top management staff.
In addition, bank – specific variables especially credit Risk and OI variables are in line with
the expected signs and are highly significant at 1% significant level. This means that credit
risk has impeded the growth of the Nigerian Banks revenue performance vis- a- vis the
negative relationship between Net income of the banks and the nature of the non –
performing loans granted within the sample period and the ability to offer services to the
market at competitive prices. The negative coefficient of CAPR suggests that a large capital
buffer aimed at maintaining banks’ solvency imposes opportunity costs on banks’ revenue
performance. For macroeconomic variables, the Treasury bill rate (TBR) has a sign that is
contrary to apriori expectation and it is significant at 1% level. This means that the monetary
policy employed within the sample period through open market operation has not perform to
expectation. Macroeconomic instability, denoted by inflation volatility, appears to have a
Page 11
11
dampening effect on the banks’ revenue performance because the coefficient estimate of the
empirical result is negative and significant.
5.2 Lerner index measure of market power `Following the methods discussed in equation 3 to 6, the Lerner index was derived. The
starting point is estimation of bank total cost function and derivation of marginal cost. The
estimates are presented in in table 4 as an appendix below. From the estimated the marginal
cost is derived and the Lerner index is calculated based on the equation 5 and6 to be 0.77 .
6.0 Conclusion and Policy implications
This paper explored a crucial topic of competition and structure of banks in Nigeria. Using a
unique and detailed banks level data set, the study broadens previous research by estimating
the Panzar-Rosse H-statistic from a reduced net income regression for the full sample. Taking
into consideration market dynamics and their effects on competitiveness the Lerner index
which assesses evolution of banking competition over time and the factors driving I was also
estimated. These competitiveness indices offer hand on perspective on the understanding of
banking sector competition in Nigeria and the policy implication of it. The general conclusion
from our analysis is that, over the period under consideration, Nigerian banks exhibited
monopolistic competitive behaviour. Specifically, the H-statistic from estimate was found to
be positive (0.511) and statistically different from zero and unit. The Lerner index also
provides an alternative to the popular PR-H index for determining bank competitiveness and
market power. The Lerner index estimate (0.77) gives further evidence on market power and
the degree of competitiveness of banks in Nigeria.
As an initial attempt at exploring the competitive conduct of Nigerian banks and how it has
evolved overtime, the study offers important policy insights for the Nigerian banking
industry, particularly, the estimate of the Lerner index offers more insightful perspective to
the analysis of competitive behaviour among banks in Nigeria than the more static H-statistic.
In this regard, the study corroborates previous studies in other countries which note the
importance of penetration as a key factor stimulating competition in the banking industry.
In the final analysis therefore, maintaining an open policy could play a crucial role in
fostering competitiveness in the Nigerian banking industry, particularly in view of the recent
regulatory reforms on capital requirement and sound risk management. In this regard, the
study extends the frontier of knowledge in developing economies and particularly subs
Saharan Africa where such evidence is currently limited. The study concluded that,
competitive behaviour of banks in developing economies may not be necessarily different
from those of their developed economies counterparts.
Page 12
12
Reference
Aboagye et al (2008), “Explaining the market power of Ghanaian banks” South African
Journal of Economics. 76, 569-585.
Angelini, P. N. Cetorelli (2003), “The effect of regulatory reforms on competition in the
banking industry” Journal of Money, Credit and Banking. 35(5) 664-684.
Bikker, J. K. Haaf (2002), “competition, concentration and their relationship; an empirical
analysis of the banking industry” Journal of Banking and Finance, 26, 2191-2214
Bing et al (2013)measuring bank competition in china: a comparison of new versus
conventional approaches applied to loan market. BIS working paper No 422.
Bhoga et al (2012), “Competitiveness of Indian banks.” International journal of business and
management finance. Vol. 2 (3). 2012.
Boone, J. (2008), “A new way to measure competition” Economic Journal, 118, 1245-1261.
Buchs, T. and Mathisien, J., (2005). “Competition and efficiency in banking: behavioural
evidence from Ghana. Working Paper WP/05/17.Washington DC. International
Monetary Fund.
Casu and Girardone (2004), “Bank concentration, competition and efficiency in the single
European market” Management science, 39. 1261-1264. UK.
Craigwell et al (2006), “competition in the commercial banking industry of Barbados”
P: 206-224.
Cocorese (2009), “Banking concentration and retail interest rates” Journal of Banking
and Finance, 26, 2155-2189.
Fosu (2013), “Banking competition in Africa: sub-regional comparative studies. Working
paper: 12/13. University of Leicester, UK.
Gelos, R. and Roldos J. (2004), “consolidation and market structures in emerging market
banking system” emerging market review. 5. 39-59.
Hakam et al (2013), “Determinants of banking competition in Morocco and evaluation of the
structural reforms” Journal of economics and financial issues. Vol. 3 (No. 2).
P: 447-465.
Kot (2004), “Testing for competition in the South African banking sector” The review of
economics and statistics. No. 71. 291-299.
Lerner A.P. (1974), “The concept of monopoly and measurement of monopoly power”
Review of economics. 157-175.
Lonca and Rajic (2012), “Concentration and competitiveness of the Serbia Banking Market”
current situation and possible future changes under the influence of market
consolidation. Review paper: Ekonomika Preduzeca 336.71
Musonda (2008), “Deregulation, Market power and competition” An empirical investigation
of Zambian banking industry. Working paper centre for studies of African
economies, Oxford University.
Page 13
13
Mensi (2010), “Measurement of competitiveness degree in Tunisian deposit banks” an
application of the Panzar-Rosse model. Scientific review, panoeconomicus. P: 189-
207
Mohammad (2012), “Comparative approach of competitiveness of Iranian banking sector”
Journal of applied economics and business. Vol. 1. Issue 3, P 32-41.
Panzar J.C., and Rosse J.N., (1987), “Testing for monopoly equilibrium” The Journal of
Industrial Economics, 35. P: 443-465.
Park (2013), “Bank mergers and competition in Japan” Journal of Banking and Finance. Vol.
9 Issue 2. Article 1.
Simpasa (2013), “Competition and market structure in the Zambian banking sector” African
Development Bank group. Working Paper. No. 168.
Shaffer (1983), “Non Structural measures of competition: toward a synthesis of alternatives.
Economic letters. 12. 349-353.
Starvarek and Repkova (2011), “Estimation of the competitive conditions in the Czech
banking sector. MPRA paper No. 30720.
Stucke (2013), “Is competition always good” Journal of antitrust enforcement. P: 162-197.
Ryszard (2012), “Determinants of competitiveness in local financial market” e-Finanse:
Financial internet quarterly. Vol.8. issue 1. P:1-13.
Appendix
Table 4: Estimating the Bank Total cost Function Variable Coefficient Std. Error t-Statistic Prob.
LINC -0.223 1.54 -0.34 0.824
LINCSQ -0.203 0.07 -0.02 0.839
PL 1.258 2.33 2.93 0.210
PC 0.290 11.67 3.38 0.772
PF 2.540 11.55 29.35 0.012
PCPL 0.669 1.23 0.82 0.504
PLPF -3.763 0.60 -2.27 0.000
PCPF -0.382 22.04 -8.41 0.703
LINCPC 0.501 0.70 0.35 0.617
LINCPF -1.232 1.55 -1.91 0.219
INCPL -0.265 0.20 -0.05 0.792
PLSQ -1.435 0.10 -0.14 0.153
PCSQ -2.416 1.33 -3.22 0.016
PFSQ -2.052 0.80 -1.64 0.041
CRISK 0.770 1.21 0.94 0.442
C 0.312 12.42 3.88 0.755
R-squared 0.528514
Adjusted R-squared 0.501102
F-statistic 19.28044
Prob(F-statistic) 0.000000