Studia Geotechnica et Mechanica, Vol. 37, No. 3, 2015 DOI: 10.1515/sgem-2015-0029 AN ANALYSIS OF EXCAVATION SUPPORT SAFETY BASED ON EXPERIMENTAL STUDIES KAROLINA GORSKA, MAREK WYJADŁOWSKI Wrocław University of Technology, Poland. E-mail: [email protected], [email protected]Abstract: The article presents the results of inclinometric measurements and numerical analyses of soldier-pile wall displacements. The excavation under investigation was made in cohesive soils. The measurements were conducted at points located at the edge of the canti- lever excavation support system. The displacements of the excavation support observed over the period of three years demonstrated the pattern of steady growth over the first two months, followed by a gradual levelling out to a final plateau. The numerical analyses were conducted based on 3D FEM models. The numerical analysis of the problem comprise calculations of the global structural safety factor depending on the displacement of the chosen points in the lagging and conducted by means of the φ/c reduction procedure. The adopted graphical method of safety estimation is very conservative in the sense that it recognizes stability loss quite early, when one could further load the medium or weaken it by further strength reduction. The values of the M sf factor are relatively high. This is caused by the fact that the structure was designed for excavation twice as deep. Nevertheless, the structure is treated as a temporary one. Key words: soldier-pile wall, inclinometer measurements, φ/c reduction procedure 1. INTRODUCTION AND PROBLEM DEFINITION The article presents the results of field studies and numerical analyses of excavation support displace- ments. A better understanding of mechanisms in- volved in soil–structure interaction in excavations could reduce costs and help avoid potential problems. Designing a retaining structure should be consistent with the EN 1997-1 Eurocode 7 standard [20]. It is particu- larly important when the support works as a permanent structure. Estimating the predicted displacements at the design stage is essential for ensuring safety. Zhang and Ng [19] point out that geotechnical structures are more often governed by allowable displacement re- quirements than by ultimate limit requirements. The article discusses the results of three-year long observations of displacements of a soldier-pile wall. In order to estimate the excavation support displace- ments, inclinometer measurements were conducted on a cantilever wall securing a 2-metre deep excavation. They enabled determining real displacements of the excavation support, and, based on them, the deflection of the support towards the excavation. During the experiment, an increase in pile displacement was ob- served, which could be explained by a deterioration in the geotechnical parameters of soil. This led to an increase in the active and a reduction in the passive earth pressure. The displacements of the top of the wall observed during these three years exceeded the displacements calculated for the initial geotechnical parameters. In the final stage of the observation, the displacements stabilized. The numerical analyses were conducted based on 3D FEM models. This led to good approximation of the real work of the soldier-pile wall. The solution of the problem involved calculations of the displace- ment-related global structural safety factor, which were performed by means of the φ/c reduction proce- dure. These numerical calculations enabled estimating changes in the global safety factor occurring during the observation of the excavation support. Periodic systems of laterally loaded piles are widespread in engineering. The common feature of these geo-structural systems is that a drilled pile is loaded horizontally and this kind of load governs the design with respect to both ultimate and serviceabil- ity limit states [18]. The existing methods of analys- ing single laterally loaded piles can be generally divided into the following categories: (a) the limit state method; (b) the subgrade reaction method; (c) the p–y method; (d) the elasticity method; and (e) the finite element method.
Transcript
Studia Geotechnica et Mechanica, Vol. 37, No. 3, 2015DOI: 10.1515/sgem-2015-0029
AN ANALYSIS OF EXCAVATION SUPPORT SAFETYBASED ON EXPERIMENTAL STUDIES
Abstract: The article presents the results of inclinometric measurements and numerical analyses of soldier-pile wall displacements. Theexcavation under investigation was made in cohesive soils. The measurements were conducted at points located at the edge of the canti-lever excavation support system. The displacements of the excavation support observed over the period of three years demonstrated thepattern of steady growth over the first two months, followed by a gradual levelling out to a final plateau. The numerical analyses wereconducted based on 3D FEM models. The numerical analysis of the problem comprise calculations of the global structural safety factordepending on the displacement of the chosen points in the lagging and conducted by means of the φ/c reduction procedure. The adoptedgraphical method of safety estimation is very conservative in the sense that it recognizes stability loss quite early, when one could furtherload the medium or weaken it by further strength reduction. The values of the M sf factor are relatively high. This is caused by the factthat the structure was designed for excavation twice as deep. Nevertheless, the structure is treated as a temporary one.
The article presents the results of field studies andnumerical analyses of excavation support displace-ments. A better understanding of mechanisms in-volved in soil–structure interaction in excavationscould reduce costs and help avoid potential problems.Designing a retaining structure should be consistent withthe EN 1997-1 Eurocode 7 standard [20]. It is particu-larly important when the support works as a permanentstructure. Estimating the predicted displacements atthe design stage is essential for ensuring safety. Zhangand Ng [19] point out that geotechnical structures aremore often governed by allowable displacement re-quirements than by ultimate limit requirements.
The article discusses the results of three-year longobservations of displacements of a soldier-pile wall.In order to estimate the excavation support displace-ments, inclinometer measurements were conducted ona cantilever wall securing a 2-metre deep excavation.They enabled determining real displacements of theexcavation support, and, based on them, the deflectionof the support towards the excavation. During theexperiment, an increase in pile displacement was ob-served, which could be explained by a deterioration in
the geotechnical parameters of soil. This led to anincrease in the active and a reduction in the passiveearth pressure. The displacements of the top of thewall observed during these three years exceeded thedisplacements calculated for the initial geotechnicalparameters. In the final stage of the observation, thedisplacements stabilized.
The numerical analyses were conducted based on3D FEM models. This led to good approximation ofthe real work of the soldier-pile wall. The solution ofthe problem involved calculations of the displace-ment-related global structural safety factor, whichwere performed by means of the φ/c reduction proce-dure. These numerical calculations enabled estimatingchanges in the global safety factor occurring duringthe observation of the excavation support.
Periodic systems of laterally loaded piles arewidespread in engineering. The common feature ofthese geo-structural systems is that a drilled pile isloaded horizontally and this kind of load governs thedesign with respect to both ultimate and serviceabil-ity limit states [18]. The existing methods of analys-ing single laterally loaded piles can be generallydivided into the following categories: (a) the limitstate method; (b) the subgrade reaction method;(c) the p–y method; (d) the elasticity method; and (e)the finite element method.
K. GORSKA, M. WYJADŁOWSKI20
The problem of piles submitted to lateral loads hasbeen analysed by numerous researchers, starting fromthe classic work of Broms [3], [4]. Broms’ method isbased on the earth pressure theory with a simplifyingassumption for the distribution of ultimate soil resis-tance along the pile length. This method is applicableto both short and long piles.
The subgrade reaction method [12], and the p–ymethod [13], [14], employing beam-on-elastic-founda-tion assumptions, are widely used because of their sim-plicity and reasonable accuracy.
Recent works [11], [15] have been devoted mainlyto 3D FEM elasto-plastic analyses of pile-soil sys-tems. A FEM solution must start with constitutivemodelling of in situ soil, then the effect of the pileinstallation must be modelled and finally the solutionmust address the influence of loading [16].
2. TECHNOLOGY OUTLINE
A soldier-pile wall is a retaining structure com-posed of vertical piles and horizontal lagging. Thepiles are made predominantly of structural steel. Thelagging, usually built of squared timber, is mountedbetween the piles in several stages as the excavation isdeepened and successive soil layers are uncovered. Itis difficult to build such a structure in non-cohesivesoils like uniform sands as the uncovered soil shouldbe capable of maintaining momentary stability untilthe lagging is mounted. What is crucial for displace-ments of the structure at the service stage is the be-haviour of vertical piles, which work like piles loadedwith a lateral force and a moment. A soldier-pile wallis predominantly a temporary structure and it usuallystays in place after the excavation work is completed.The lifetime of the structure is limited and no changein geotechnical soil parameters is predicted.
3. SUBSOIL CONDITIONSAND PARAMETERS
The excavation under investigation was made incohesive soils. The soil conditions after [7] are shownin Table 1.
The surface layer is made up of uncontrolled fillsand alluvia, whose thickness is up to 1.00 m. They areunderlain with a layer of cohesive glacial sandy clayscontaining pebbles and gravel. Their plasticity, deter-mined from laboratory study results is IL = 0.05. Thenext layer is made up of cohesive glacial silty andsandy clays with pebbles. Their plasticity, determinedfrom laboratory study results, is IL = 0.15.
The excavation support works like a structure witha cantilever static scheme. The basic element consists ofpiles made of 9.0-metre long HEB 300 profiles, spacedat 3.00-metre intervals. During the experiment, the pileswere embedded in soil to the depth of 7.0 m. The laggingis made of 12 cm thick pine wood class C 27.
4. INCLINOMETER MEASUREMENTSAND RESULTS
The investigations were conducted at three pointslocated at the edge of the excavation support system.Two of these points were prepared halfway the lengthof the lagging. The ABS inclinometer casing in theform of a special grooved tube was installed intoa drillhole and the remaining space was filled with grout[6]. One point was made of a 40 × 40 × 2 profile weldedto a soldier pile (HEB300). A zero measurement wasperformed a month after installing the inclinometer cas-ing – after the grout had cured (sites I2 and I3) and di-rectly after forcing in the profiles (site I6).
An analysis of excavation support safety based on experimental studies 21
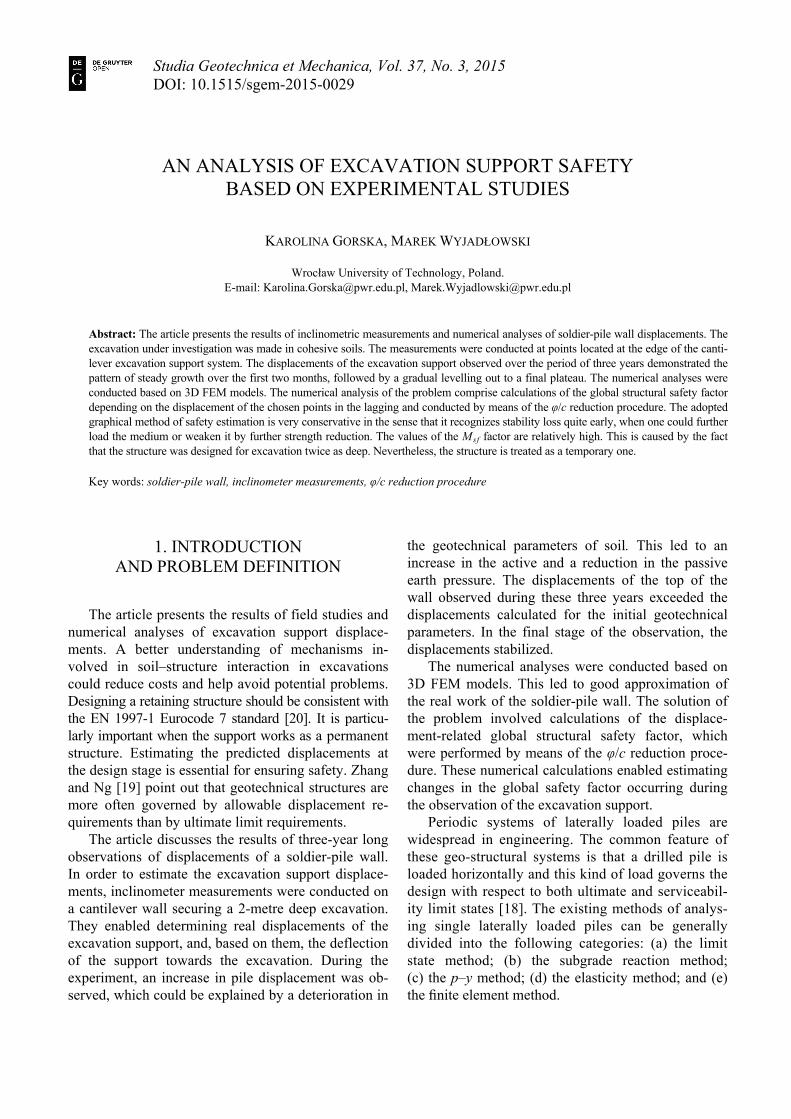
The measurements were performed along the in-clinometer casing, at points spaced at half a metreintervals in four mutually perpendicular directions. Itwas assumed that displacements of the casing basewere equal to zero. In the case presented, the casingswere 9.0 m long and the excavation – only 2.0 m deep.The measurements, performed by means of an incli-nometer set produced by SISGEO [17], took place fromJune 2011 to September 2014. Initially, they were per-formed at dense time intervals and then, after displace-ment stabilization, more rarely. The measurement re-sults are shown in Figs. 1, 2, 3. Also, displacementgrowth over time is presented in Figs. 4, 5, 6.
The inclinometer measurements were conducted atthe following measurement points:I2 – lagging,I3 – lagging (central part),I6 – pile, inclinometer casing welded to the profile.
The displacements of the excavation support ob-served over the period of three years demonstrated thepattern of steady growth over the first two months,followed by a gradual levelling out to a final plateau.
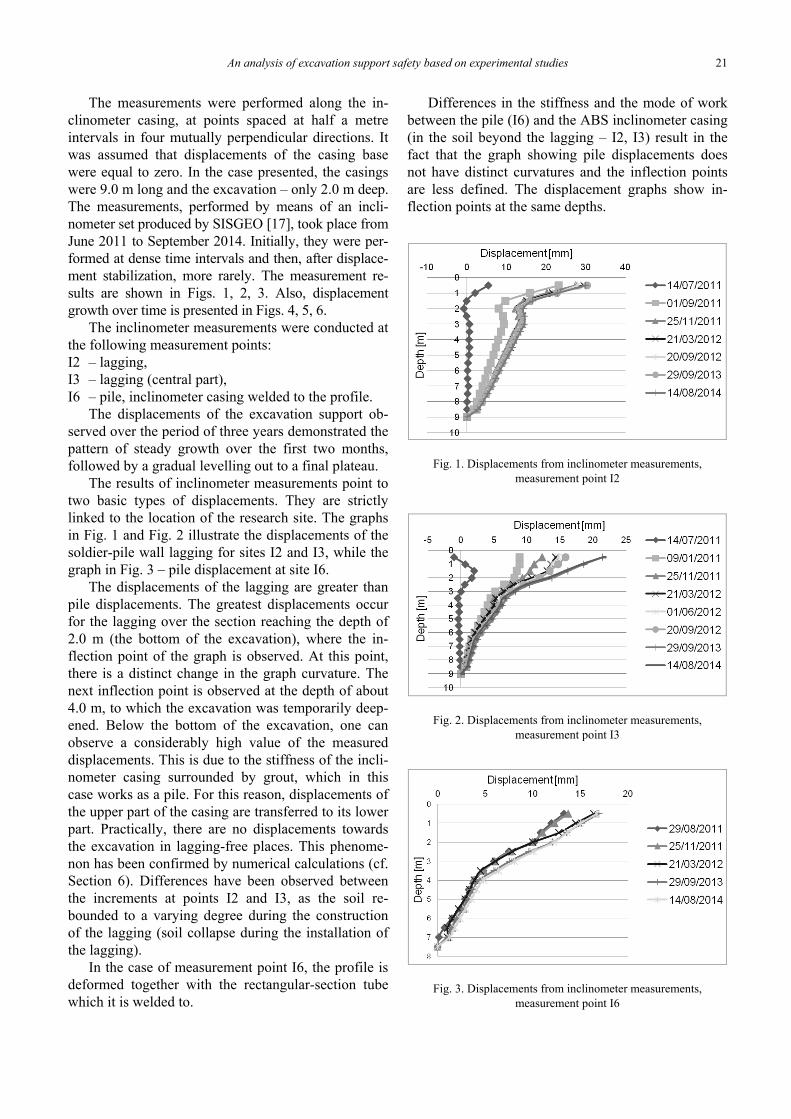
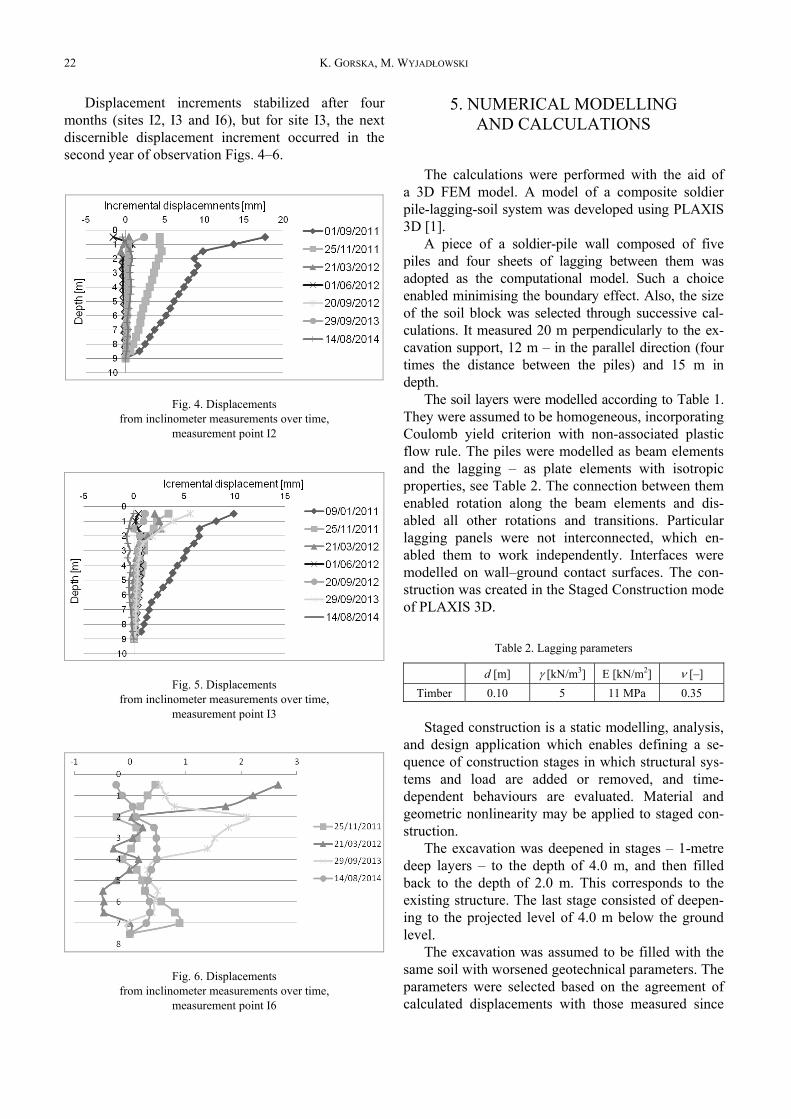
The results of inclinometer measurements point totwo basic types of displacements. They are strictlylinked to the location of the research site. The graphsin Fig. 1 and Fig. 2 illustrate the displacements of thesoldier-pile wall lagging for sites I2 and I3, while thegraph in Fig. 3 – pile displacement at site I6.
The displacements of the lagging are greater thanpile displacements. The greatest displacements occurfor the lagging over the section reaching the depth of2.0 m (the bottom of the excavation), where the in-flection point of the graph is observed. At this point,there is a distinct change in the graph curvature. Thenext inflection point is observed at the depth of about4.0 m, to which the excavation was temporarily deep-ened. Below the bottom of the excavation, one canobserve a considerably high value of the measureddisplacements. This is due to the stiffness of the incli-nometer casing surrounded by grout, which in thiscase works as a pile. For this reason, displacements ofthe upper part of the casing are transferred to its lowerpart. Practically, there are no displacements towardsthe excavation in lagging-free places. This phenome-non has been confirmed by numerical calculations (cf.Section 6). Differences have been observed betweenthe increments at points I2 and I3, as the soil re-bounded to a varying degree during the constructionof the lagging (soil collapse during the installation ofthe lagging).
In the case of measurement point I6, the profile isdeformed together with the rectangular-section tubewhich it is welded to.
Differences in the stiffness and the mode of workbetween the pile (I6) and the ABS inclinometer casing(in the soil beyond the lagging – I2, I3) result in thefact that the graph showing pile displacements doesnot have distinct curvatures and the inflection pointsare less defined. The displacement graphs show in-flection points at the same depths.
Fig. 1. Displacements from inclinometer measurements,measurement point I2
Fig. 2. Displacements from inclinometer measurements,measurement point I3
Fig. 3. Displacements from inclinometer measurements,measurement point I6
K. GORSKA, M. WYJADŁOWSKI22
Displacement increments stabilized after fourmonths (sites I2, I3 and I6), but for site I3, the nextdiscernible displacement increment occurred in thesecond year of observation Figs. 4–6.
Fig. 4. Displacementsfrom inclinometer measurements over time,
measurement point I2
Fig. 5. Displacementsfrom inclinometer measurements over time,
measurement point I3
Fig. 6. Displacementsfrom inclinometer measurements over time,
measurement point I6
5. NUMERICAL MODELLINGAND CALCULATIONS
The calculations were performed with the aid ofa 3D FEM model. A model of a composite soldierpile-lagging-soil system was developed using PLAXIS3D [1].
A piece of a soldier-pile wall composed of fivepiles and four sheets of lagging between them wasadopted as the computational model. Such a choiceenabled minimising the boundary effect. Also, the sizeof the soil block was selected through successive cal-culations. It measured 20 m perpendicularly to the ex-cavation support, 12 m – in the parallel direction (fourtimes the distance between the piles) and 15 m indepth.
The soil layers were modelled according to Table 1.They were assumed to be homogeneous, incorporatingCoulomb yield criterion with non-associated plasticflow rule. The piles were modelled as beam elementsand the lagging – as plate elements with isotropicproperties, see Table 2. The connection between themenabled rotation along the beam elements and dis-abled all other rotations and transitions. Particularlagging panels were not interconnected, which en-abled them to work independently. Interfaces weremodelled on wall–ground contact surfaces. The con-struction was created in the Staged Construction modeof PLAXIS 3D.
Table 2. Lagging parameters
d [m] γ [kN/m3] E [kN/m2] ν [–]Timber 0.10 5 11 MPa 0.35
Staged construction is a static modelling, analysis,and design application which enables defining a se-quence of construction stages in which structural sys-tems and load are added or removed, and time-dependent behaviours are evaluated. Material andgeometric nonlinearity may be applied to staged con-struction.
The excavation was deepened in stages – 1-metredeep layers – to the depth of 4.0 m, and then filledback to the depth of 2.0 m. This corresponds to theexisting structure. The last stage consisted of deepen-ing to the projected level of 4.0 m below the groundlevel.
The excavation was assumed to be filled with thesame soil with worsened geotechnical parameters. Theparameters were selected based on the agreement ofcalculated displacements with those measured since
An analysis of excavation support safety based on experimental studies 23
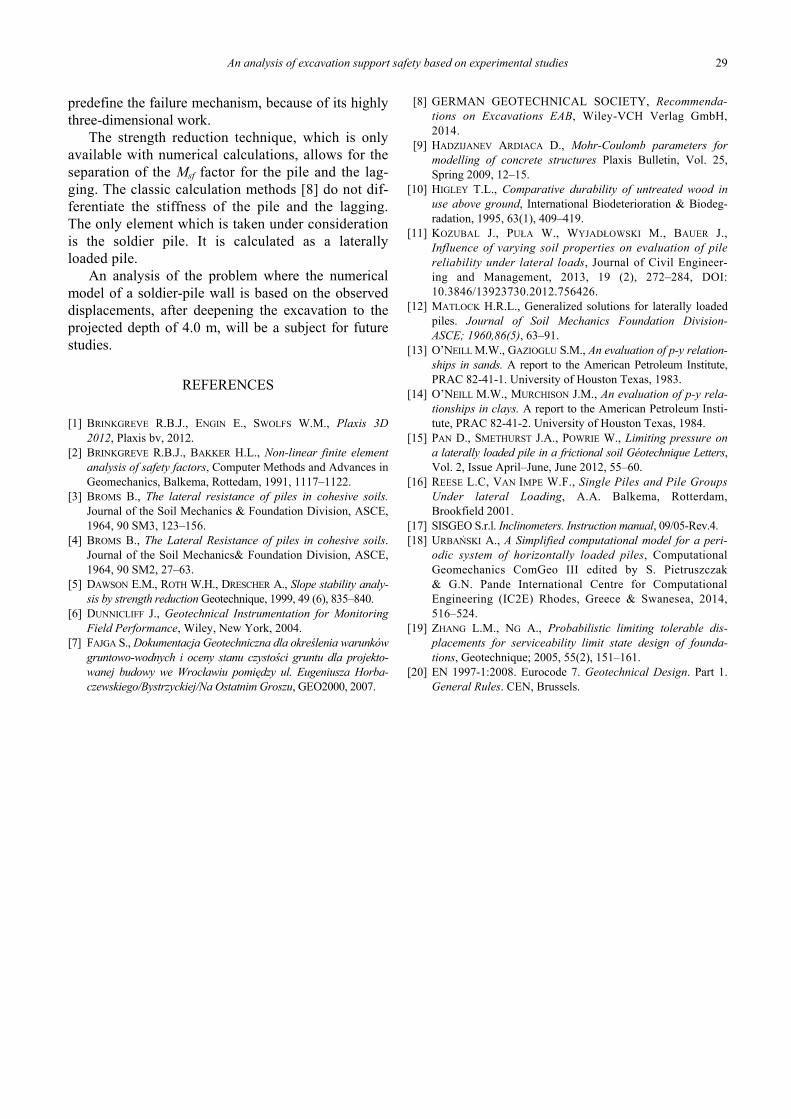
July 2011 for the lagging and the pile. The location ofpoints of agreement is presented in Table 4. The com-putational model of the problem is presented in Fig. 7.Quadratic tetrahedral 10-node elements were used tocreate the mesh.
Table 3. Pile parameters
A [m2] γ [kN/m3] E [kN/m2] Iy [m4] Ix [m4]H Beam 0.01491 78.5 210 GPa 0.000252 0.000085
Fig. 7. Computational model
Preliminary calculations were not running smoothly.This was due to the application of relatively high co-hesion in combination with a zero tension cut-off forall the materials. For the Mohr–Coulomb model, thetension cut-off is, by default, selected with a tensilestrength of zero. As a result, a large number of tensionpoints are generated behind the wall. Most of them areconsidered to be “inaccurate” and thus they influencethe numerical procedure (Fig. 8). An example of thisphenomenon are the unreliable values of ∑Msf < 1.0(cf. Section 7).
Materials with such high cohesion as those inTable 1 will generally have some tension capacity.In numerical calculations, an area with tensilestresses has developed. According to the Coulombenvelope shown in Fig. 9, it is allowed when theshear stress is sufficiently small. This indicates thatsoil may fail as a result of tension as well as shear.Such behaviour can be included in PLAXIS 3Danalysis by selecting the tension cut-off. Regardingtensile strengths, they can be obtained from plasticparameters according to the representation of the yieldsurface as shown in Fig. 9 [9], where: σc – compres-sive strength, σt – tensile strength.
After such a modification of the Coulomb modelparameters, the number of tension cut-off points rap-idly decreases.
Figure 10 displays a map of displacements towardsthe excavation occurring after the completion of this
Fig. 8. Plastic points and tension cut-off points in preliminary calculations
K. GORSKA, M. WYJADŁOWSKI24
excavation. The displacements of the top of the exca-vation support observed over the three years of theexperiment exceeded the displacements calculated forthe initial geotechnical parameters compiled in Table 1.This implies that the soil conditions deteriorated asa result of atmospheric exposure. This process is de-scribed by further calculations using the ϕ/c reductionprocedure.
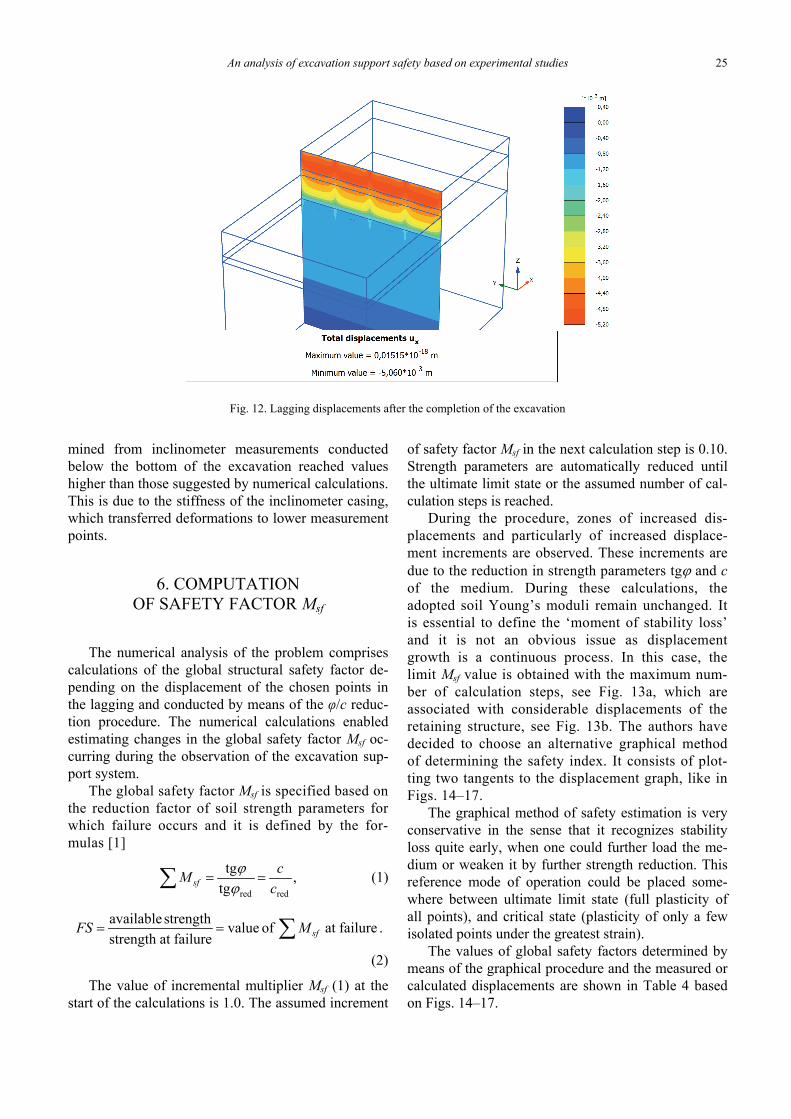
The displacements of the pile and the lagging de-creased with depth (see Figs. 11, 12). The decreasewas particularly significant below the ground surface.Soil displacement occurred only at the level of thelagging (Fig. 12). The lagging displacements deter-Fig. 9. Deduction of Mohr–Coulomb parameters
Fig. 10. Displacements of the computational model after the completion of the excavation
Fig. 11. Pile displacements after the completion of the excavation
An analysis of excavation support safety based on experimental studies 25
mined from inclinometer measurements conductedbelow the bottom of the excavation reached valueshigher than those suggested by numerical calculations.This is due to the stiffness of the inclinometer casing,which transferred deformations to lower measurementpoints.
6. COMPUTATIONOF SAFETY FACTOR Msf
The numerical analysis of the problem comprisescalculations of the global structural safety factor de-pending on the displacement of the chosen points inthe lagging and conducted by means of the φ/c reduc-tion procedure. The numerical calculations enabledestimating changes in the global safety factor Msf oc-curring during the observation of the excavation sup-port system.
The global safety factor Msf is specified based onthe reduction factor of soil strength parameters forwhich failure occurs and it is defined by the for-mulas [1]
,redredtg
tgccM sf ==∑ ϕ
ϕ (1)
failureatofvaluefailureatstrength
strengthavailable ∑== sfMFS .
(2)
The value of incremental multiplier Msf (1) at thestart of the calculations is 1.0. The assumed increment
of safety factor Msf in the next calculation step is 0.10.Strength parameters are automatically reduced untilthe ultimate limit state or the assumed number of cal-culation steps is reached.
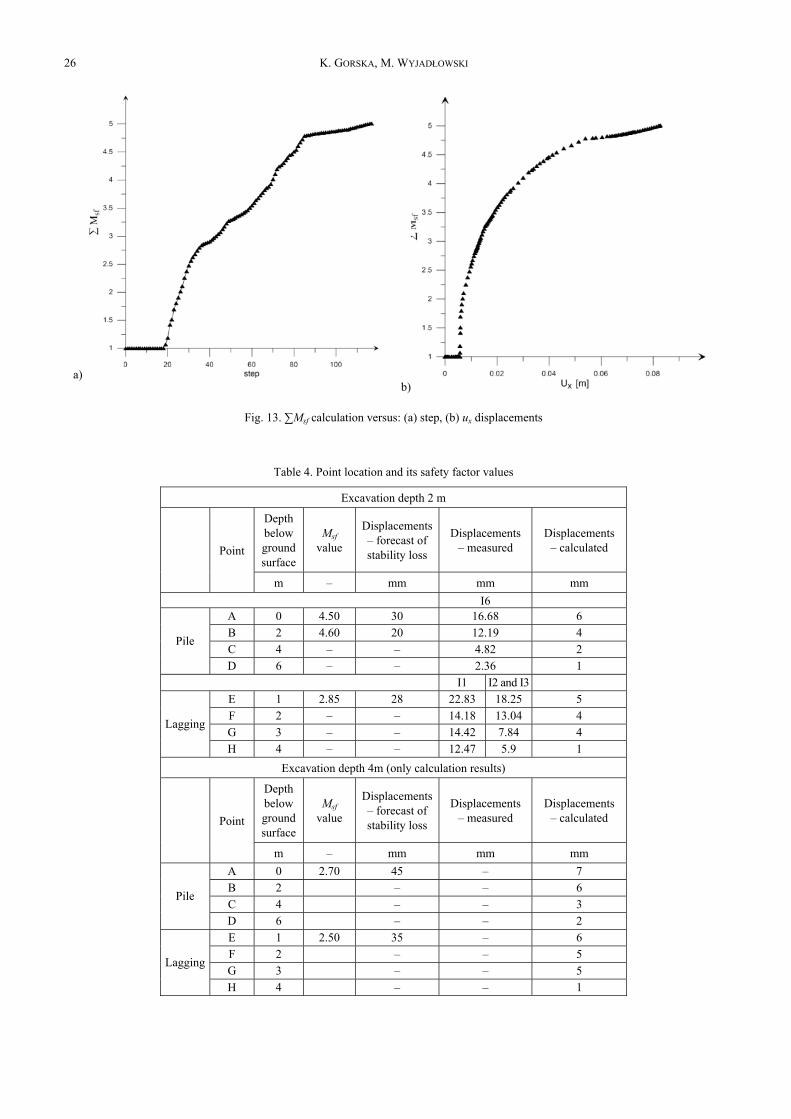
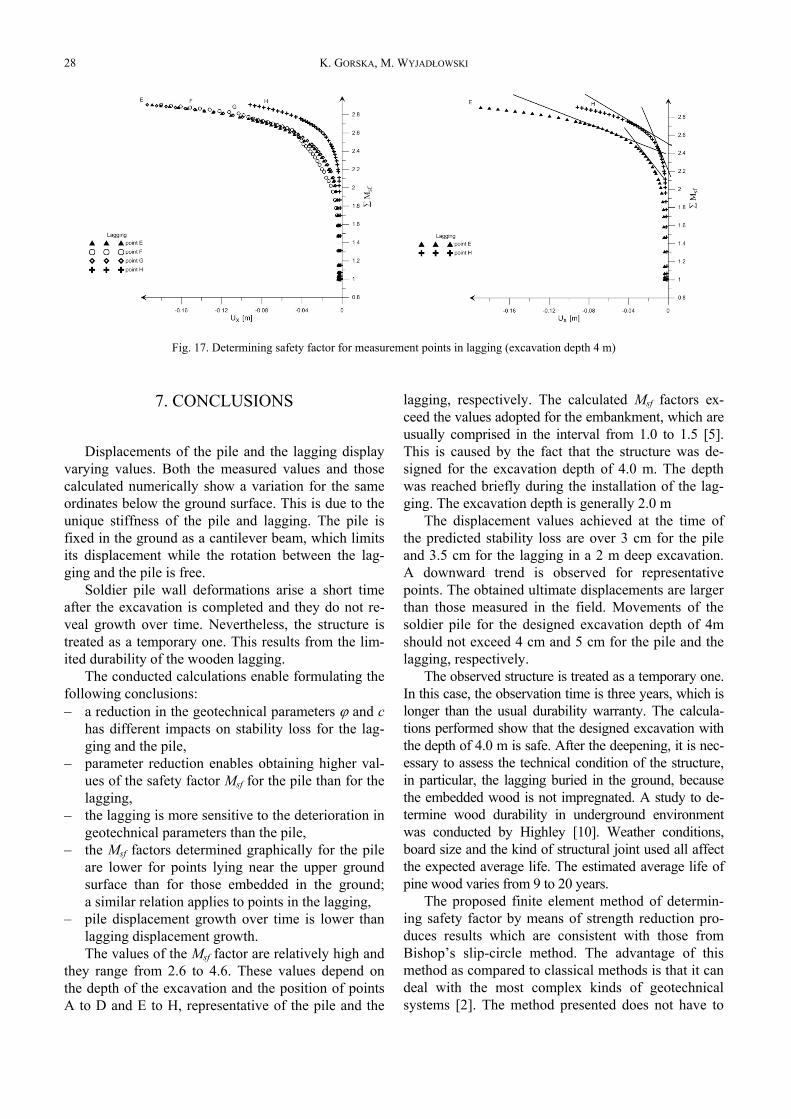
During the procedure, zones of increased dis-placements and particularly of increased displace-ment increments are observed. These increments aredue to the reduction in strength parameters tgϕ and cof the medium. During these calculations, theadopted soil Young’s moduli remain unchanged. Itis essential to define the ‘moment of stability loss’and it is not an obvious issue as displacementgrowth is a continuous process. In this case, thelimit Msf value is obtained with the maximum num-ber of calculation steps, see Fig. 13a, which areassociated with considerable displacements of theretaining structure, see Fig. 13b. The authors havedecided to choose an alternative graphical methodof determining the safety index. It consists of plot-ting two tangents to the displacement graph, like inFigs. 14–17.
The graphical method of safety estimation is veryconservative in the sense that it recognizes stabilityloss quite early, when one could further load the me-dium or weaken it by further strength reduction. Thisreference mode of operation could be placed some-where between ultimate limit state (full plasticity ofall points), and critical state (plasticity of only a fewisolated points under the greatest strain).
The values of global safety factors determined bymeans of the graphical procedure and the measured orcalculated displacements are shown in Table 4 basedon Figs. 14–17.
Fig. 12. Lagging displacements after the completion of the excavation
An analysis of excavation support safety based on experimental studies 27
Fig. 14. Determining safety factor for measurement points in a pile (excavation depth 2 m)
Fig. 15. Determining safety factor for measurement points in lagging (excavation depth 2 m)
Fig. 16. Determining safety factor for measurement points in a pile (excavation depth 4 m)
K. GORSKA, M. WYJADŁOWSKI28
7. CONCLUSIONS
Displacements of the pile and the lagging displayvarying values. Both the measured values and thosecalculated numerically show a variation for the sameordinates below the ground surface. This is due to theunique stiffness of the pile and lagging. The pile isfixed in the ground as a cantilever beam, which limitsits displacement while the rotation between the lag-ging and the pile is free.
Soldier pile wall deformations arise a short timeafter the excavation is completed and they do not re-veal growth over time. Nevertheless, the structure istreated as a temporary one. This results from the lim-ited durability of the wooden lagging.
The conducted calculations enable formulating thefollowing conclusions:– a reduction in the geotechnical parameters ϕ and c
has different impacts on stability loss for the lag-ging and the pile,
– parameter reduction enables obtaining higher val-ues of the safety factor Msf for the pile than for thelagging,
– the lagging is more sensitive to the deterioration ingeotechnical parameters than the pile,
– the Msf factors determined graphically for the pileare lower for points lying near the upper groundsurface than for those embedded in the ground;a similar relation applies to points in the lagging,
– pile displacement growth over time is lower thanlagging displacement growth.The values of the Msf factor are relatively high and
they range from 2.6 to 4.6. These values depend onthe depth of the excavation and the position of pointsA to D and E to H, representative of the pile and the
lagging, respectively. The calculated Msf factors ex-ceed the values adopted for the embankment, which areusually comprised in the interval from 1.0 to 1.5 [5].This is caused by the fact that the structure was de-signed for the excavation depth of 4.0 m. The depthwas reached briefly during the installation of the lag-ging. The excavation depth is generally 2.0 m
The displacement values achieved at the time ofthe predicted stability loss are over 3 cm for the pileand 3.5 cm for the lagging in a 2 m deep excavation.A downward trend is observed for representativepoints. The obtained ultimate displacements are largerthan those measured in the field. Movements of thesoldier pile for the designed excavation depth of 4mshould not exceed 4 cm and 5 cm for the pile and thelagging, respectively.
The observed structure is treated as a temporary one.In this case, the observation time is three years, which islonger than the usual durability warranty. The calcula-tions performed show that the designed excavation withthe depth of 4.0 m is safe. After the deepening, it is nec-essary to assess the technical condition of the structure,in particular, the lagging buried in the ground, becausethe embedded wood is not impregnated. A study to de-termine wood durability in underground environmentwas conducted by Highley [10]. Weather conditions,board size and the kind of structural joint used all affectthe expected average life. The estimated average life ofpine wood varies from 9 to 20 years.
The proposed finite element method of determin-ing safety factor by means of strength reduction pro-duces results which are consistent with those fromBishop’s slip-circle method. The advantage of thismethod as compared to classical methods is that it candeal with the most complex kinds of geotechnicalsystems [2]. The method presented does not have to
Fig. 17. Determining safety factor for measurement points in lagging (excavation depth 4 m)
An analysis of excavation support safety based on experimental studies 29
predefine the failure mechanism, because of its highlythree-dimensional work.
The strength reduction technique, which is onlyavailable with numerical calculations, allows for theseparation of the Msf factor for the pile and the lag-ging. The classic calculation methods [8] do not dif-ferentiate the stiffness of the pile and the lagging.The only element which is taken under considerationis the soldier pile. It is calculated as a laterallyloaded pile.
An analysis of the problem where the numericalmodel of a soldier-pile wall is based on the observeddisplacements, after deepening the excavation to theprojected depth of 4.0 m, will be a subject for futurestudies.
REFERENCES
[1] BRINKGREVE R.B.J., ENGIN E., SWOLFS W.M., Plaxis 3D2012, Plaxis bv, 2012.
[2] BRINKGREVE R.B.J., BAKKER H.L., Non-linear finite elementanalysis of safety factors, Computer Methods and Advances inGeomechanics, Balkema, Rottedam, 1991, 1117–1122.
[3] BROMS B., The lateral resistance of piles in cohesive soils.Journal of the Soil Mechanics & Foundation Division, ASCE,1964, 90 SM3, 123–156.
[4] BROMS B., The Lateral Resistance of piles in cohesive soils.Journal of the Soil Mechanics& Foundation Division, ASCE,1964, 90 SM2, 27–63.
[5] DAWSON E.M., ROTH W.H., DRESCHER A., Slope stability analy-sis by strength reduction Geotechnique, 1999, 49 (6), 835–840.
[6] DUNNICLIFF J., Geotechnical Instrumentation for MonitoringField Performance, Wiley, New York, 2004.
[7] FAJGA S., Dokumentacja Geotechniczna dla określenia warunkówgruntowo-wodnych i oceny stanu czystości gruntu dla projekto-wanej budowy we Wrocławiu pomiędzy ul. Eugeniusza Horba-czewskiego/Bystrzyckiej/Na Ostatnim Groszu, GEO2000, 2007.
[8] GERMAN GEOTECHNICAL SOCIETY, Recommenda-tions on Excavations EAB, Wiley-VCH Verlag GmbH,2014.
[9] HADZIJANEV ARDIACA D., Mohr-Coulomb parameters formodelling of concrete structures Plaxis Bulletin, Vol. 25,Spring 2009, 12–15.
[10] HIGLEY T.L., Comparative durability of untreated wood inuse above ground, International Biodeterioration & Biodeg-radation, 1995, 63(1), 409–419.
[11] KOZUBAL J., PUŁA W., WYJADŁOWSKI M., BAUER J.,Influence of varying soil properties on evaluation of pilereliability under lateral loads, Journal of Civil Engineer-ing and Management, 2013, 19 (2), 272–284, DOI:10.3846/13923730.2012.756426.
[12] MATLOCK H.R.L., Generalized solutions for laterally loadedpiles. Journal of Soil Mechanics Foundation Division-ASCE; 1960,86(5), 63–91.
[13] O’NEILL M.W., GAZIOGLU S.M., An evaluation of p-y relation-ships in sands. A report to the American Petroleum Institute,PRAC 82-41-1. University of Houston Texas, 1983.
[14] O’NEILL M.W., MURCHISON J.M., An evaluation of p-y rela-tionships in clays. A report to the American Petroleum Insti-tute, PRAC 82-41-2. University of Houston Texas, 1984.
[15] PAN D., SMETHURST J.A., POWRIE W., Limiting pressure ona laterally loaded pile in a frictional soil Géotechnique Letters,Vol. 2, Issue April–June, June 2012, 55–60.
[16] REESE L.C, VAN IMPE W.F., Single Piles and Pile GroupsUnder lateral Loading, A.A. Balkema, Rotterdam,Brookfield 2001.
[17] SISGEO S.r.l. Inclinometers. Instruction manual, 09/05-Rev.4.[18] URBAŃSKI A., A Simplified computational model for a peri-
odic system of horizontally loaded piles, ComputationalGeomechanics ComGeo III edited by S. Pietruszczak& G.N. Pande International Centre for ComputationalEngineering (IC2E) Rhodes, Greece & Swanesea, 2014,516–524.
[19] ZHANG L.M., NG A., Probabilistic limiting tolerable dis-placements for serviceability limit state design of founda-tions, Geotechnique; 2005, 55(2), 151–161.
[20] EN 1997-1:2008. Eurocode 7. Geotechnical Design. Part 1.General Rules. CEN, Brussels.