21 An Analysis of Special Needs Student Busing An Analysis of Special Needs Student Busing Behrooz Kamali, Virginia Tech Scott J. Mason, Clemson University Edward A. Pohl, University of Arkansas Abstract Population growth can lead to public school capacity issues as well as increased school bus utilization, which, in turn, can result in longer school bus transport times for regular and special needs students. Special needs or medically fragile students are children with special health care needs who are at increased health and safety risk. It is common practice to provide special needs students with specially-equipped buses and/or special classroom environments with specific facilities or services. However, the assignment of student services to schools is regularly made without regard to bus transportation considerations for special needs students. Considering the potentially negative impact of long school bus rides on these students, we present the first sys- tematic, integrated analyses of special needs student busing and classroom assign- ments. We provide models and algorithms for maintaining administration-based transportation financial performance measures while simultaneously designing smarter transportation networks considering both student geographical location and service needs. Introduction As urban areas grow in population, some people choose to relocate to the suburbs, often for “more space”—to be more spread out across suburban neighborhood areas. One of the main public services that is impacted by these city-to-suburb moves is rural public education systems. When a school district grows both in
Transcript
21
An Analysis of Special Needs Student Busing
An Analysis of Special Needs Student BusingBehrooz Kamali, Virginia Tech
Scott J. Mason, Clemson University Edward A. Pohl, University of Arkansas
Abstract
Population growth can lead to public school capacity issues as well as increased school bus utilization, which, in turn, can result in longer school bus transport times for regular and special needs students. Special needs or medically fragile students are children with special health care needs who are at increased health and safety risk. It is common practice to provide special needs students with specially-equipped buses and/or special classroom environments with specific facilities or services. However, the assignment of student services to schools is regularly made without regard to bus transportation considerations for special needs students. Considering the potentially negative impact of long school bus rides on these students, we present the first sys-tematic, integrated analyses of special needs student busing and classroom assign-ments. We provide models and algorithms for maintaining administration-based transportation financial performance measures while simultaneously designing smarter transportation networks considering both student geographical location and service needs.
IntroductionAs urban areas grow in population, some people choose to relocate to the suburbs, often for “more space”—to be more spread out across suburban neighborhood areas. One of the main public services that is impacted by these city-to-suburb moves is rural public education systems. When a school district grows both in
Journal of Public Transportation, Vol. 16, No. 1, 2013
22
terms of its number of schools and its geographic area, school capacity limitations and student bus transportation can become important challenges. Ineffectively making student-to-school assignments and/or inefficient bus routing plans can result in longer school bus rides for students. The magnitude of these inefficien-cies is further magnified when one considers the transportation of special needs students.
According to McPherson et al. (1998), special needs or medically fragile students are “children with special health care needs who have or are at increased risk for a chronic physical, developmental, behavioral, or emotional condition and who also require health and related services of a type or amount beyond that required by children generally.” Given this characterization, it follows that longer school bus rides caused by the planning inefficiencies described above can adversely impact special needs students.
Special needs students typically require special buses and/or special classroom environments with specific facilities or services. Based on the severity of their needs, special needs students are placed into a class containing a specific teacher-to-student ratio, such as a 1:6 class containing a maximum of 6 students and 1 teacher. Additionally, 1:10 and 1:15 classrooms are typically found in practice. Stu-dents in the latter classroom type typically have less or fewer needs for services.
In terms of busing, not all buses in a school district can be used for special needs student transport since they require special facilities. In terms of service needs, the special services required are not offered in all schools in a school district—often, they are offered in less than one half of the district’s schools. These special ser-vices do not necessarily refer to lifts and physical equipment; they could refer to a trained teacher for special needs students, for example. It follows that these limited busing and services options can result in one or more special needs students being assigned to a school that is not necessarily close to his/her home, resulting in longer bus transportation times.
Interviews with school district officials suggest that current practice is for school administrators to assign special needs services to district schools based on either experience and/or requests from a principal, often with little or no consideration of where the special needs students reside. In one extreme case, the authors learned about a special needs student who rides her bus two hours each way to and from school every day. Since the assignment process is somewhat subjective and cur-rently is not supported by any type of analytical models in the school districts we investigated, it is quite possible that model-supported assignment decisions can
23
An Analysis of Special Needs Student Busing
help impact current special needs student transportation practices by providing better transportation and special needs service assignments for school districts.
Previous ResearchA number of previous research studies investigated both assignment and transpor-tation models. Unfortunately, only a small portion of the existing literature focuses on special needs students. Further, most special needs student-focused studies either present case study results or do not examine transportation-related issues. However, it is important to understand the current body of knowledge in order to effectively address the problem under study in this paper.
The assignment problem for special needs students is similar to the general-ized assignment problem in many ways. Generally, assignment problems can be thought of as having a number of agents and a number of tasks. Each agent should be assigned to one task under some conditions in order to accomplish some total job with minimal cost/maximal value. In the research problem of interest, the agents are special needs students and the tasks are available seats or positions in special needs classrooms at district schools of the previously defined types (i.e., 1:6, 1:10, or 1:15 teacher-to-student ratios).
Among the different assignment models, the semi-assignment problem has the greatest similarity to the problem under study, because each agent should be assigned to exactly one task and, also, there are a limited numbers of task groups, each of which requires some number of agents (Pentico 2007). These problems can be solved very quickly for large-scale problems.
Lee and Schniederjans (1983) developed a multi-criteria assignment model for assigning teachers to schools using goal programming with two objectives: cost minimization and maximization of preference goals. They solved the model under different priority ranking schemes and were able to find some solution combina-tions that satisfy a range of stated goals. Ferland and Guenette (1990) developed a decision support system for school districts to assign groups of students to a school. They developed a student network and used heuristic procedures to assign the network’s edges (i.e., students) to schools such that the total distance cost is minimized.
There exists some previous transportation literature related to the general school bus routing problem, such as the Vehicle Routing Problem with Pickups and Deliveries (VRPPD) and the Dial-A-Ride Problem (DARP). However, the bus rout-
Journal of Public Transportation, Vol. 16, No. 1, 2013
24
ing problem for special needs students is different from the general student bus routing problem, as special needs students often require door-to-door service. It is possible to consider each special needs student’s home as an individual bus stop containing a single student.
While the classical Vehicle Routing Problem considers only pickups or deliveries, the VRPPD assumes both pickups and deliveries can be performed on the same vehicle tour. Nagy and Salhi (2005) developed a heuristic transportation model for VRPPD. The main objective of their model was minimizing the total distance traveled using a four-step method that allows for weak feasibility/infeasibility of starting solutions.
The VRPPD can be extended to include time constraints. In a student transporta-tion application, the Vehicle Routing Problem with Pickups and Deliveries and Time Windows (VRPPDTW) examines the case in which students from different schools with different starting times are on the same school bus. There are some heuristic approaches developed to tackle VRPPDTW such as variable-depth algo-rithm, which has two steps of finding an initial solution and improving the solution (Bruggen et al. 1993). Ioachim et al. (1995) developed a clustering approach for the VRPPDTW problem. Their approach divides all requests into mini-clusters and then solves the problem for these mini-clusters using a column generation-based approach to improve upon an initial, existing solution. The authors also present a heuristic for minimizing the size of the mini-cluster network.
DARP is defined as requests for transportation that are submitted by users. This is a typical problem that applies to the transportation of older adults or persons with disabilities in urban areas. Requests are for transportation from a specific origin to a specific destination, and vehicles based at a common depot perform transporta-tion. Since service is shared, typical objectives are to minimize user inconveniences and to minimize operation costs (Cordeau 2006).
Cordeau and Laporte (2003) develop a Tabu search metaheuristic for the DARP. Their algorithm begins with an initial, feasible solution, and then moves to the best solution within the current solution’s neighborhood. Attanasio et al. (2004) proposed a more comprehensive version of a Tabu search for DARP that accom-modates dynamic model data. The authors suggest that their problem can be solved using parallel computing techniques for real-time vehicle routing problems. Cordeau (2006) introduced a branch-and-cut algorithm and presents valid inequal-ities for the DARP. Although his algorithm is fast and efficient in comparison to other techniques, it cannot be used for large-scale problems.
25
An Analysis of Special Needs Student Busing
Russell and Morrel (1986) presented one of the only papers to address special needs student bus routing. They developed a shuttle system to reduce bus rides and number of school visits. They identified two schools with the most students and visited them after picking up all the students; then they rerouted and dropped other students. Ripplinger (2005) focused on rural school vehicle routing and pro-vides models and analysis for separating special needs student transportation from general students and generating single routes for both types of students. Braca et al. (1997) briefly mentions special needs students in one part of their research. The authors describe the difference between special needs students and general stu-dents, but did not develop any pertinent or applicable transportation models for the research problem under study.
Our review of the published literature to date reveals very little previous research on special needs student transportation. As our research problem contains many impor-tant decisions to be made, we employed a phased research approach as described above that contains two important subproblems: the student-to-school assignment problem and the student transportation/bus routing problem. We investigated these problems by developing assignment models and vehicle routing models to minimize the total amount of time students travel. Given the complexity of the problem under study, we also present heuristic approaches for analyzing this challenging problem.
Student-to-School AssignmentIn the student-to-school assignment problem, students are assigned to district schools having some known classroom services and capacities such that total student-to-school distance is minimized. For this purpose, we use existing service/classroom assignments in a local school district. We use distance as a surrogate measure for student bus riding time, because in this phase, the direct distance between each student’s home and his/her school is used in the model without any consideration of bus routing. Even though vehicle routing is not included in this model, the result of this phase can estimate how much improvement may be pos-sible under “smarter” assignment decisions.
The assignment model developed is a mixed-integer model formulated to mini-mize the total direct distance that all students would travel in a straight line (with-out any regard to routing) from each of their houses to reach their school. First, we introduce the following set notation:
S Set of schools, indexed by i
T Set of students, indexed by j
Journal of Public Transportation, Vol. 16, No. 1, 2013
26
C Set of class (service) types, indexed by k
L Set of school levels, indexed by l
In addition, we define six parameters for use in our model:
nk Maximum number of students that can attend class type k
di,j Distance from student j place of residence to school i (miles)
gj,k 1 if student j requires class/service type k, otherwise 0
ai,k Number of classes of type k available in school i
ej,l 1 if student i should go to school level of l, otherwise 0
bi,l 1 if level of school i is l, otherwise 0
The assignment model determines the student-to-school assignments that mini-mize the total direct distance between student homes and their schools. This deci-sion is captured via the decision variable xi,j which equals 1 if student j is assigned to school i, otherwise, xi,j = 0. Since it is possible that all currently-available classes at a given school may not be used in any given assignment scheme recommended by the model, we define an additional integer bookkeeping variable to count the number of students assigned to a specific class (and its associated service type) at each school. Let yi,k denote the number of students assigned to class/service type k in school i.
Given this notation, we now present our model. We seek to minimize total direct distance (in miles) that students travel to their school.
(1)
(2)
(3)
(4)
(5)
(6)
27
An Analysis of Special Needs Student Busing
The objective function (1) minimizes total direct distances and ensures that bookkeeping variable yi,k does not become unnecessarily inflated. The very small coefficient of the second term makes sure the primary objective function term of interest is not adversely affected. Constraint set (2) requires that each student be assigned to exactly one school. Constraint set (3) verifies that each student is assigned to a school that offers his/her needed class/service type. Constraint set (4) guarantees that the number of students assigned to each class type at any school does not exceed the class’s available capacity. Constraint set (5) ensures that each student is assigned to a school of his/her appropriate level (e.g., elementary school students should be assigned only to elementary schools). Finally, constraint set (6) is a valid inequality we introduced to update the bookkeeping variable yi,k accord-ing to the values of our primary decision variable of interest, xi,j.
Bus Routing ProblemThe vehicle routing problem (VRP) model developed is a mixed-integer program-ming model that minimizes the total travel distance driven by all the buses when picking up all special needs students and delivering them to their intended school destinations. In this model, students and schools are considered to be nodes, and the different routes between students and schools are captured via arcs. Buses start their travel in the network from an origin node, which represents a depot. Similarly, each bus’s travel is deemed complete once it returns to the depot after marking all of its appropriate student drop-offs.
As mentioned earlier, the assignment model presented in the previous section recommends the optimal assignment of students to schools based on their service needs, and its output will, in turn, be used as an input parameter in the routing model. Using assignment model output as an input of the routing model makes these two problems dependent. For example, in low-density networks, the quality of the routes becomes more dependent on the network shape. Based on the given description, we define five sets for our routing model:
S Set of schools, indexed by i and j
T Set of students, indexed by i and j
D Set of depots, indexed by i and j
N Set of nodes, which is union of S, T, and D, indexed by i and j
B Set of buses, indexed by k
Journal of Public Transportation, Vol. 16, No. 1, 2013
28
In addition, the following parameters are defined for use in our routing model:
dij Distance from node i to node j
ck Capacity of bus k
aij 1 if student i is assigned to school j, 0 otherwise
The primary decision variable in this model is xijk, which equals 1 if node i is imme-diately followed by node j on bus route k, otherwise xijk = 0. To formulate the model, some bookkeeping variables are required. First, we introduce bookkeeping variable yik to record which student is served by which bus: yik = 1 if student i is served by bus k; otherwise, yik = 0. Bookkeeping variable zik is similar to yik , but keeps track of which school is visited by which bus: zik = 1 if school i is visited by bus k; otherwise, zik = 0. Finally, bookkeeping variable wik shows the position of each node on each bus route. For example, if student A is the third student visited by bus Z and bus Z has not visited any schools yet, then wAZ = 4, as the bus depot is always the first node to be visited by any bus. In addition to keeping track of the position of the nodes visited by each bus, bookkeeping variable wik also serves the purpose of eliminating any possible sub-tours traveled by each bus. We now formally state our routing model:
(7)
(8)
(9)
(10)
(11)
(12)
29
An Analysis of Special Needs Student Busing
(13)
(14)
(15)
(16)
(17)
(18)
(19)
(20)
(21)
(22)
(23)
(24)
(25)
(26)
Objective function (7) has two terms. The first term models the primary objective of minimizing the total distance traveled by all buses, while the second term makes sure that bookkeeping variable wik is not unnecessarily inflated. We use a very small constant multiplier on our second objective function term so as to not adversely impact the value of the overall objective function.
Journal of Public Transportation, Vol. 16, No. 1, 2013
30
Constraint set (8) forces each bus to visit exactly one node immediately after visiting a student node. This is necessary to make sure all picked up students are delivered. Constraint set (9) makes sure that exactly one node is visited before each student visit. Constraint set (10) guarantees that there is at least one student visited before any school is visited. Constraint set (11) ensures that, at most, one node is visited immediately after each school visit by any bus. The visited node can be a student node, another school node, or the final depot destination node when all the students are dropped off. Constraint set (12) makes sure that the capacity of each bus is not exceeded. Constraints sets (13) and (14) are valid equalities that update bookkeeping variable yik by relating it to the main decision variable, xijk. Constraint set (15) forces all buses to start their daily trips from the origin depot node. Constraint set (16) ensures that all buses end their daily trips at the depot. Constraint set (17) guarantees that no bus goes directly from the depot to a school. Constraint set (18) verifies that no bus goes directly from a student node to the depot. Constraint sets (19) and (20) update bookkeeping variable zik by relating it to the main decision variable xijk.
Next, constraint set (21) makes sure that each student is picked up by a bus that visits his/her assigned school. This is one of the constraint sets that makes use of the results from our assignment model. Constraint set (22) ensures that there is no return travel from a node back to itself. Constraint set (23) sets bookkeeping variable wik for the origin depot node = 1, thereby forcing the depot to be the first node visited by each bus. Constraint sets (24) and (25) update bookkeeping vari-able wik and together disallow sub-tours in the routing model. Constraint set (25) guarantees that a bus picks up students before that same bus visits their destina-tion school. Finally, constraint set (26) is another valid inequality that ensures no student is on a bus that does not visit his/her destination school.
Given the complexity of the problem under study, it was necessary to develop and test heuristic solution approaches for the research problem under study.
HeuristicsGiven the well-established NP-hard complexity of vehicle routing models contain-ing only a single vehicle (Nagy and Salhi 2005), large, practically-motivated, real-world problem instances for the research problem under study are unsolvable in any practical amount of computation time. Therefore, we turn our focus to the development of (hopefully) practically-implementable heuristic solution methods. First, we present a constructive heuristic based on a greedy approach that gener-
31
An Analysis of Special Needs Student Busing
ates feasible solutions quickly. Next, we introduce two local search-based post-pro-cessing techniques designed to improve the constructive heuristic’s initial solution.
Greedy HeuristicWe employed the greedy procedure InitialSolution below to construct an initial, feasible solution to the problem under study in our heuristic Greedy. This proce-dure requires the following a group of input parameters: 1) number of students, 2) number of schools, 3) number of buses, 4) bus capacities, 5) from/to straight line distance matrix between all pairs of students and schools, and 6) existing list of student-to-school assignments. By assuming that all buses start their respective trips from the depot, following the procedure below guarantees the creation of a feasible solution, as first, all students are assigned to buses, and then each bus is required to visit all required schools for student drop-off.
Procedure InitialSolution1. Main Student Assignment Loop:
a. Let S denote the set of all current students assigned to a school. Initially, S is empty.
b. Let S’ denote all current students not yet assigned to a school. Initially, S’ contains all students.
c. Let Nb denote the last visited network node of bus b. Initially, Nb is set to the depot for all buses.
d. If S’ is empty, go to Step 2. Otherwise,
i. Find the student s in S’ that lives closest to any node Nb (the current location of each bus b) for each bus b that has remaining capacity to take on more students.
ii. Assign student s to bus b. Update Nb to reflect the network node associated with student s’s house. Remove s from S’. Add s to S. Go to Step 1d.
2. Main Bus Assignment Loop:a. For each bus, determine the schools, which need to be visited for drop-
ping off each student assigned to the bus. Let Db denote the set of des-tination schools to be visited by bus b. Initially, Db contains all schools attended by the students on bus b.
Journal of Public Transportation, Vol. 16, No. 1, 2013
32
b. If Db is empty for all buses, STOP. Otherwise,
i. Find the school e in Db that is closest to any node Nb (the current location of each bus b) for each bus b.
ii. Assign bus b to travel to school e by updating Nb to reflect the network node associated with school e. Remove e from Db. Go to Step 2b.
Procedure InitialSolution produces two main outputs: the total distance traveled by all buses and the order in which nodes are visited by each bus. It is quite possible that procedure InitialSolution might produce inefficient solutions in terms of mini-mum total student distances to the assigned schools, given its greedy approach. It is this reality that led us to the following improvement methods in our heuristic development.
Improving the Greedy SolutionNext, we sought to improve our initial, greedy solution by focusing on 1) the way students are assigned to buses from the unassigned student pool S’ and 2) the placement of school visits in the bus route. In procedure InitialSolution, a student is added to each bus during every iteration of (d) in the main student assignment loop. Now, instead of simultaneously assigning students to every bus during the main assignment loop, we assign students to only one single bus at a time. When the number of students on the bus reaches capacity, the bus is removed from fur-ther consideration and the next empty bus is used for student assignment.
Considering the main bus assignment loop in procedure InitialSolution, we also sought to improve the placement of school visits on each bus’s route. In the greedy heuristic, schools are visited at the end of each bus’s route, regardless of when and where the last student is picked up; this could lead to a missed opportunity for earlier student drop-off. To identify this opportunity, we performed an additional step after assigning all students to schools that identifies the earliest position that each school can be assigned in each bus’s route. Then, when performing the main bus assignment loop, we could assess school placement in each bus route from this earliest point to the end of the bus’s route. The two improvement steps were included in our first improvement heuristic, IH1.
A Potential Issue with IH1Preliminary experiments uncovered a potential issue with IH1. Consider a problem instance of 21 students and 2 buses, each with capacity for 20 students. Our IH1 would assign the first 20 students to the first bus and then, as this bus is at capacity,
33
An Analysis of Special Needs Student Busing
it would put the last remaining student on the second bus. While, logically, there is no problem with this assignment, it is not practically attractive or reasonable. To address this potential problem, we considered different combinations of assigning students to buses by establishing and analyzing temporary bus capacities. Consider a problem instance containing n students and b buses. While we keep the upper bound on bus capacity at 20 (its true value), we set a lower bound bus capacity value of n⁄b and analyze the same problem for all bus capacity values from n⁄b up to 20. For example, in the case n = 21 students and b = 2 buses, we now exam-ine temporary bus capacities from 11 to 20 in our second improvement heuristic, IH2. In IH2, we solved each problem for all valid temporary bus capacity values and selected the solution with the lowest objective function value.
Finally, we performed a local search operation in IH1 after the best heuristic solu-tion was found. We post-processed this “best” IH1 solution via adjacent pairwise interchanges within each bus’s route to see if an improved (i.e., less distance), feasible solution exists. The interchanges are made starting from the head of each bus’s route, after the depot visit. We ensured that feasibility was maintained such that all students can still be delivered to their proper destination school. Finally, the “best” overall routing plan identified was reported once heuristic IH2 terminated.
Experimental Results and AnalysisAll mathematical models developed in this research were coded in AMPL and solved using CPLEX’s mixed-integer programming solver. CPLEX was run on a 2.93 GHz quad core, quad processor server with 128 GB of RAM. We first validated each mathematical model with a variety of small, trivial sample problems that are easily solved by hand. Once model functionality was verified, we used real-world information furnished by our project sponsor, the Fort Smith Public School (FSPS) District, as a means of analyzing each model’s computational performance and solution quality under real-world school district conditions. In addition, the heu-ristic solution methods developed in this paper were all verified and validated in similar manner. To validate and analyze performance of the model, the following set of experimental factors were used:
• Number of buses (3 levels): 2, 3, 4
• Number of special needs students (3 levels): 20, 40, 60
• Number of special needs schools (3 levels): 2, 4, 6
• School district area (2 levels): 10 miles x 10 miles, 20 miles x 20 miles
• Bus capacity (1 level): 20 students
Journal of Public Transportation, Vol. 16, No. 1, 2013
34
Our research sponsor verified these values to be valid in terms of typical school district size and complexity with regards to special needs student busing. In each problem instance, student home and school locations were randomly generated within the corresponding school district area. Given this random component of our experimental design, we generated 10 problem instances for each of the fac-tor combinations, resulting in a total of 540 problem instances. However, close inspection revealed that 60 of these instances were infeasible: the cases wherein 60 students were to be bused with only 2 buses of capacity 20. As we focused only on feasible problem instances, a total of 480 feasible instances remained for analysis by our optimization models and heuristic solution methods.
As mentioned previously, our assignment model solves quickly and optimally for all cases, due to its structure. Therefore, we present results below pertaining to the more complex vehicle routing model. This is appropriate in that the assignment model’s outputs are used as input in the routing model, and it is the routing model that lends itself to direct comparison with our heuristic solution methodologies.
Vehicle Routing Model ResultsWe set a maximum model run time limit of 1 hour and analyzed each of the 480 test instances. In terms of required solution time, while some instances solved to optimality in less than 1 minute, CPLEX could not find any solution to some other instances in 1 hour. Table 1 shows a summary of the overall CPLEX results.
Table 1. Overall Status of CPLEX Results
CPLEX Solution Type Optimal Time Limit No Solution
Number 121 241 118
Percentage 25.21% 50.21% 24.58%
Results from Table 1 confirm the need for a reliable, fast heuristic. Almost 75 per-cent of the problem instances were not solved to optimality within the 60-minute time limit. In addition, CPLEX could not produce any solution for almost 25 percent of the instances. However, for the cases in which CPLEX could find a solution, the average gap between CPLEX’s best solution and the problem’s lower bound (i.e., the optimality gap) was 23.6 percent. The summary results in Table 1 are further broken down by experimental factor level in Table 2.
35
An Analysis of Special Needs Student Busing
Table 2. Analysis of the Solutions of the Test Problem using CPLEX
InstanceCPLEX
Optimal Time Limit No Solution
Number of Buses
2 46 74 0
3 41 90 49
4 34 77 69
Number of Students
20 121 59 0
40 0 154 26
60 0 28 92
Number of Schools
2 57 90 13
4 43 72 45
6 21 79 60
District Area10x10 67 116 57
20x20 54 125 61
Table 2 confirms that increasing either the number of buses, students, and/or schools makes the problem under study more difficult to solve. It appears that the number of students has the biggest effect on CPLEX’s ability to achieve optimal solutions. While 67 percent of the solutions are optimal in the 20-student case, CPLEX found no optimal solutions for the 40- and 60-student cases. In fact, 77 per-cent of the 60-student cases resulted in no solution after the 1-hour time limit had elapsed. However, school district area has little to no effect on solution optimality. Again, these results confirmed the need for our heuristic solution methodology, given the complexity of the problem under study.
Heuristic Solution ResultsAll three heuristics (Greedy, IH1, and IH2) were coded in C# using Microsoft Visual Studio. Each heuristic easily solved every one of the 480 test instances in less than 5 seconds, which compares favorably to the optimization model’s 60-minute maxi-mum solution time. We assessed the quality of our heuristic solutions as compared to the optimization model in order to determine whether their implementation in practice was justifiable.
Let PR(H,I) be the performance ratio computed by dividing the problem instance solution produced by heuristic H for problem instance I by the solution produced by the routing model for the same problem instance. Table 3 displays both the average and standard deviation of the PR ratios for each heuristic across the experi-
Journal of Public Transportation, Vol. 16, No. 1, 2013
36
mental design space. The results are separated according to whether or not the optimization model was able to produce the optimal solution or if the one-hour time limit was reached.
Table 3. Comparison of Performance Ratios for Heuristic Methods
Greedy IH1 IH2
Optimal Time Limit Optimal Time Limit Optimal Time Limit
The overall performance ratio of the original Greedy constructive heuristic was 1.87 for the cases in which the vehicle routing model gave optimal solution. This ratio improved to 1.49 for IH1 and 1.37 for IH2. This trend confirmed that the proposed improvements to the original constructive heuristic helped to produce better solu-tions. In the cases where CPLEX found a solution but not the optimal solution, all three heuristics again showed superior performance as expected. Table 4 presents the 95% confidence intervals for each of the sets of heuristic results described in Table 3.
37
An Analysis of Special Needs Student Busing
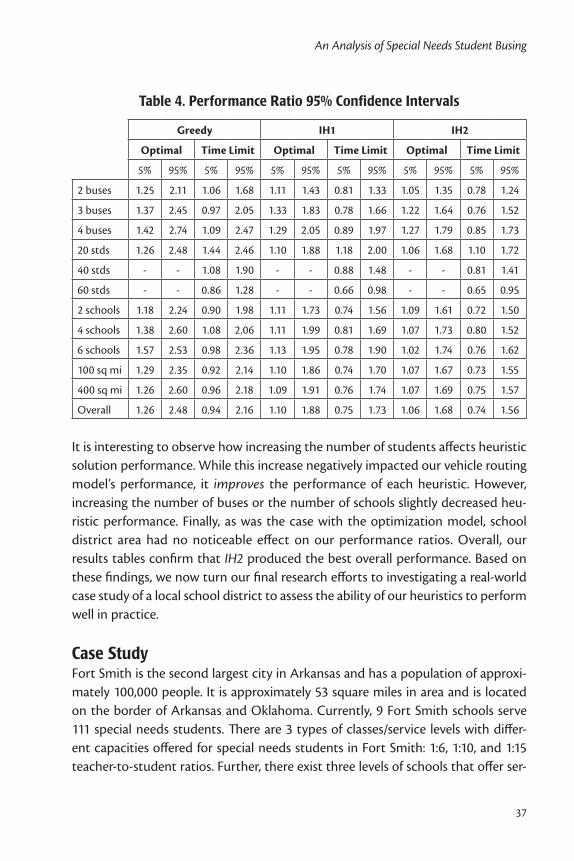
Table 4. Performance Ratio 95% Confidence Intervals
Greedy IH1 IH2
Optimal Time Limit Optimal Time Limit Optimal Time Limit
It is interesting to observe how increasing the number of students affects heuristic solution performance. While this increase negatively impacted our vehicle routing model’s performance, it improves the performance of each heuristic. However, increasing the number of buses or the number of schools slightly decreased heu-ristic performance. Finally, as was the case with the optimization model, school district area had no noticeable effect on our performance ratios. Overall, our results tables confirm that IH2 produced the best overall performance. Based on these findings, we now turn our final research efforts to investigating a real-world case study of a local school district to assess the ability of our heuristics to perform well in practice.
Case StudyFort Smith is the second largest city in Arkansas and has a population of approxi-mately 100,000 people. It is approximately 53 square miles in area and is located on the border of Arkansas and Oklahoma. Currently, 9 Fort Smith schools serve 111 special needs students. There are 3 types of classes/service levels with differ-ent capacities offered for special needs students in Fort Smith: 1:6, 1:10, and 1:15 teacher-to-student ratios. Further, there exist three levels of schools that offer ser-
Journal of Public Transportation, Vol. 16, No. 1, 2013
38
vices to special needs students in Fort Smith: elementary, junior high, and senior high. After gathering all pertinent data from FSPS personnel for our models, we converted the data into an appropriate format for each of our solution method-ologies.
Assignment Model ResultsOur assignment model was used to ascertain the total distance between special needs student homes and their currently assigned schools in Fort Smith in order to make future comparisons to some known, existing baseline. This calculation resulted in a total of 467.2 miles of direct distance for the current FSPS solution of today. Again, this distance does not account for bus routing. To further describe the current conditions, Table 5 shows the number of students currently assigned to each class type in each FSPS school today (i.e., our baseline case). School names have been changed to numbers for ease of reference.
Table 5. Current Special Needs Student Assignments in FSPS by Class Type
School 1:6 1:10 1:15
1 3
2 1
3 9 6 34
4 3
5 3 8 7
6 6 24
7 1
8 1
9 5
Total 18 52 41
In solving the assignment model, the current baseline conditions in FSPS were kept the same with respect to the number of available classes of each type in each school. Table 6 displays the results from assignment model.
Using the assignment model to make student-to-school assignments, the total directed distance between student residences and their school was reduced by 13.2 percent, from 467.2 to 405.7 miles. If a similar amount of mileage savings (in terms of percentage) can be realized from our bus routing analysis, this would prove to be a significant savings for FSPS.
39
An Analysis of Special Needs Student Busing
Table 6. Optimal FSPS Student Assignment for Directed Student Distance
School 1:6 1:10 1:15
1 1
2 3
3 9 4 34
4 10
5 3 6 7
6 6 17
7 1
8 2
9 8
Total 18 52 41
Upon comparing the results in Table 6 to the original Table 5 baseline case, the only changes that occurred were for the 1:10 classes. Therefore, it appears that under the current service assignment and capacities, FSPS has optimally assigned both 1:6 and 1:15 classes in terms of directed student distance to their respective schools. However, student assignments for the 1:10 classes change in 8 out of the possible 9 schools with no need to increase the number of teachers or classes.
Vehicle Routing Model ResultsWe now sought to produce a practical solution for implementation in practice by creating a bus routing strategy to accompany our assignment decisions. Based on FSPS’s stated bus capacity of 20 special needs students per bus on average, we assumed this value for all buses. Student-to-school assignment data was obtained from the results of our assignment model. One important consideration was that because our vehicle routing model forces all available buses to be used in its solu-tion, we chose to examine each problem instance with varying numbers of avail-able buses. For this case study, no maximum CPLEX solution time limit was speci-fied. Therefore, the solution process finished either by finding the optimal solution or by exceeding the memory resources available to CPLEX. Results of the vehicle routing model for our FSPS case study are shown in Table 7 by type of school in terms of distance traveled, optimality gap, and model computation time.
Journal of Public Transportation, Vol. 16, No. 1, 2013
40
Table 7. Vehicle Routing Model Results for FSPS Case Study
Level # of Buses Distance Traveled (mi) Optimality / Gap Solve Time (s)
Junior High School
1 36.9 Optimal 3.6
2 33.3 Optimal 2.1
3 33.0 Optimal 6.0
4 34.0 Optimal 114.7
Senior High School
2 50.5 22.7% 6,036.2
3 44.2 13.7% 10,697.0
4 45.8 15.7% 8,149.4
5 50.5 24.7% 13,758.3
Elementary School
3 100.6 53.6% 11,596.3
4 127.0 67.7% 15,379.8
5 - - -
6 - - -
As expected, the cases with fewer buses were solved optimally in a short amount of time. But as instance size grows, more time was required to solve the problem—this results in even poorer solution quality. This is evident when one considers that all junior high instances were solved optimally. In the junior high cases, 19 students were assigned to two schools. Although increasing the number of buses increases model solution time, all results for the junior high cases were optimal.
None of the senior high cases, which each contain 33 students and 2 schools, were solved to optimality. Although the average optimality gap was approximately 20 percent, the required model solve time was much larger than that of the junior high instances. This example demonstrates how a small increase in problem size can affect solution times exponentially in NP-hard problems. Finally, the elemen-tary school cases with 59 students and 5 schools were not easily analyzed by the vehicle routing model.
Table 7 results suggest the optimal busing strategy for different school levels. However, practical considerations such as the available number of buses and bus drivers must be assessed in practice to see if these solutions can be implemented. Often, a small difference in total miles can be taken on in order to save requiring an additional bus. For example, while junior high results suggest 3 buses is best, an entire bus can be saved for the cost of only 0.3 additional miles each morning and
41
An Analysis of Special Needs Student Busing
afternoon. However, length of bus ride should also be analyzed for these recom-mended solutions, as clear tradeoffs may exist between the available options.
Heuristic ResultsAs was the case previously, all three heuristic approaches can solve the FSPS case study models very quickly (e.g., in less than two seconds). As expected, Table 8 confirms that IH2 generates the best solutions in all test cases when comparing the three heuristic approaches. The amount of improvement achievable by using IH2 instead of the other two heuristic methods is much larger for the elementary school case that has the largest number of students. Table 9 displays the ratio of each heuristic’s results to the vehicle routing model for the FSPS case study prob-lems. Again, improving performance is evident for IH2, especially in the cases where there is a larger number of available buses for student transport.
Table 8. Heuristics Results in Total Miles for FSPS Case Study
Level Buses Greedy IH1 IH2
Junior High School
1 50.6 50.6 47.0
2 65.3 42.4 40.4
3 60.7 45.9 44.0
4 76.7 51.0 44.3
Senior High School
2 72.8 50.7 48.2
3 83.7 53.8 50.4
4 86.0 68.6 64.6
5 100.3 55.0 51.8
Elementary School
3 95.2 94.5 70.6
4 115.8 95.4 74.9
5 134.6 90.5 74.7
6 154.4 94.9 80.1
Journal of Public Transportation, Vol. 16, No. 1, 2013
42
Table 9. Comparison of Heuristics to Vehicle Routing Model for FSPS Case Study
Level Buses Greedy IH1 IH2
Junior High School
1 1.37 1.37 1.27
2 1.96 1.27 1.21
3 1.84 1.39 1.33
4 2.26 1.50 1.30
Senior High School
2 1.44 1.00 0.95
3 1.89 1.22 1.14
4 1.88 1.50 1.41
5 1.99 1.09 1.03
Elementary School
3 0.95 0.94 0.70
4 0.91 0.75 0.59
5 - - -
6 - - -
Conclusion and Future ResearchIn this research, we conducted what we believe to be the first systematic, analyti-cal study of special needs student busing and produced models and algorithms to aid decision makers with this challenging, practically-motivated problem. We developed the first monolithic solution approach for helping public school sys-tems to effectively 1) assign special needs students and their associated services to schools and 2) route transportation resources. We investigated the special needs student busing problem using a phased approach to assess both optimization- and heuristic-based solution approaches’ ability to produce effective solutions to this challenging problem in a practically-acceptable amount of time. The approach developed in this study can also be applied to other problems containing both assignment and vehicle routing phases.
Experimental results demonstrated our proposed methods’ abilities to develop transportation plans for both our experimental design dataset as well as for the data supplied by our research partner, the Fort Smith (Arkansas) Public School sys-tem. In the future, we hope to obtain the necessary permission/clearance to verify our case study results with current FSPS practice, as the school district’s concerns for student privacy currently are precluding us from doing so. Also, as our heuristics shows promising results for problem instances with a large number of students and a few number of schools, further modifications can be made to IH2 in the future to
43
An Analysis of Special Needs Student Busing
improve its performance over a wider range of school district scenarios. As a future step, we can also include administrative costs such as labor costs and bus financing costs in our analysis as shown in Ibeas et al. (2006, 2009). Finally, school district flex-ibility in terms of the offering of special needs services at different district schools should be investigated, as our Phase 1 model sensitivity cases suggest that some minor reassignments of special needs teachers and/or classrooms may result in a non-trivial decrease in transportation costs.
References
Attanasio, A., J. Cordeau, G. Ghiani, and G. Laporte. 2004. Parallel Tabu search heu-ristics for the dynamic multi-vehicle dial-a-ride problem. Parallel Computing 30(3): 377-387.
Braca, J., J. Bramel, B. Posner, and D. Simchi-Levi. 1997. A computerized approach to the New York City school bus routing problem. IIE Transactions 29: 693-702.
Cordeau, J. 2006. A branch-and-cut algorithm for the dial-a-ride problem. Opera-tions Research 54(3): 573-586.
Cordeau, J., and G. Laporte. 2003. A Tabu search heuristic for the static multi-vehi-cle dial-a-ride problem. Transportation Research Part B, 37(6): 579-594.
Ferland, J., and G. Guénette. 1990. Decision support system for the school district-ing problem. Operations Research 38(1): 15-21.
Ibeas, A., J. L. Moura, and L. Dell’Olio. 2009. Planning school transport: Design of routes with flexible school opening times. Transportation Planning and Tech-nology 32(6): 527-544.
Ibeas, A., J. L. Moura, L. Dell’Olio, and J. D. Ortuzar. 2006. Costing school transport in Spain. Transportation Planning and Technology 29(6): 483-501.
Ioachim, I., J. Desrosiers, Y. Dumas, M. Solomon, and D. Villeneuve. 1995. A request clustering algorithm for door-to-door handicapped transportation. Transpor-tation Science 29(1): 63-78.
Lee, S., and M. Schniederjans. 1983. A multicriteria assignment problem: A goal programming approach. Interfaces 13(4): 75-81.
Journal of Public Transportation, Vol. 16, No. 1, 2013
44
McPherson, M., P. Arango, H. Fox, C. Lauver, M. McManus, J. Perrin, and others. 1998. A new definition of children with special health care needs. Pediatrics 102(1): 137-139.
Nagy, G., and S. Salhi. 2005. Heuristic algorithms for single and multiple depot vehicle routing problems with pickups and deliveries. European Journal of Operational Research 162(1): 126-141.
Pentico, D. 2007. Assignment problems: A golden anniversary survey.” European Journal of Operational Research 176(2): 774-793.
Russell, R., and R. Morrel. 1986. Routing special-education school buses.” Interfaces 16(5): 56-64.
Ripplinger, D. 2005. Rural school vehicle routing problem. Transportation Research Record 1992: 105–110.
Van Der Bruggen, L., J. Lenstra, and P. Schuur. 1993. Variable-depth search for the single-vehicle pickup and delivery problem with time windows. Transportation Science 27(3): 298-311.
About the Authors
Behrooz Kamali ([email protected]) is a Ph.D. student in Industrial and Systems Engineering at Virginia Polytechnic Institute and State University. He received a master's degree in Industrial Engineering from University of Arkansas and a bachelor's degree from Sharif University of Technology in Iran. His main research interests are optimization and mathematical modeling in the areas of transporta-tion, logistics, and supply chain systems. He is a member of Institute of Industrial Engineers and INFORMS.
Dr. Scott J. Mason ([email protected]) is the Fluor Endowed Chair in Sup-ply Chain Optimization and Logistics and a Professor of Industrial Engineering at Clemson University. Prior to joining Clemson, he spent 10 years in the Department of Industrial Engineering at the University of Arkansas. He received a Ph. D. in Industrial Engineering from Arizona State University after earning bachelor’s and master’s degrees from The University of Texas at Austin. His areas of focus include operations planning, scheduling, and control of capital project supply chains and large-scale systems modeling, optimization, and algorithms, with domain expertise in semiconductor manufacturing. He is an Associate Editor for IEEE Transactions on
45
An Analysis of Special Needs Student Busing
Electronics Packaging Manufacturing, a senior member of the Institute for Indus-trial Engineers, and a member of INFORMS.
Edward A. Pohl, Ph.D. ([email protected]) is an Associate Professor in the Department of Industrial Engineering at the University of Arkansas. He serves as the Director of the Operations Management Program. He received a Ph.D. in Systems and Industrial Engineering from the University of Arizona, an M.S. in Reli-ability Engineering from the University of Arizona, an M.S. in Systems Engineering from AFIT, an M.S. in Engineering Management from the University of Dayton, and a B.S.E.E. from Boston University. His primary research interests are in repairable systems modeling, reliability, decision making under uncertainty, engineering opti-mization, and probabilistic design. He is a senior member of IIE, a senior member of ASQ, and a senior member of IEEE and serves as an Associate Editor for both the Journal of Military Operations Research and the Journal of Risk and Reliability. He is a member of RAMS management committee and is a two-time winner of the Alan Plait award for Outstanding Tutorial at RAMS.