Eur. Phys. J. D (2014) 68: 17 DOI: 10.1140/epjd/e2013-40556-8 Regular Article T HE EUROPEAN P HYSICAL JOURNAL D An analysis of the effect of inert gases on ozone generation using dielectric barrier discharge in oxygen Linsheng Wei a , Dingkun Yuan, Yafang Zhang, Zhaoji Hu, Zhihong Tan, Guopan Dong, and Siqi Tao School of Environmental and Chemical Engineering, Nanchang University, Nanchang 330031, P.R. China Received 7 September 2013 / Received in final form 25 October 2013 Published online 23 January 2014 – c EDP Sciences, Societ`a Italiana di Fisica, Springer-Verlag 2014 Abstract. This paper studies the influence of inert gases He, Ar, Kr and Xe on ozone generation in a dielectric barrier reactor fed by oxygen feed gas. Results show that inert gas additions would lead to lower applied voltage, discharge power and reduced field. The electron energy distribution function shifts to the right though inert gas addition would lead to a lower reduced field with He, Ar and Kr addition, but it shifts to the left with Xe addition. The effective electron density decreases with inert gas content. With respect to Ar/O2, Kr/O2 and Xe/O2 mixture, conversion ratio of oxygen into ozone and ozone yield would increase with increasing Ar, Kr or Xe content, the growth rates follow the order of Xe > Kr > Ar. Such behaviors can be ascribed to the fact that Ar*, Kr* and Xe* could provide another effective pathway to produce oxygen atom through penning dissociation of O2 and metastable species due to their relatively low excitation threshold and considerable rate coefficients. 1 Introduction Ozone, historically mainly employed for drinking water treatment, is currently widely used in numerous applica- tions. The advantages of high oxidizing ability and envi- ronmental friendliness lead to rapid increasing demand for high ozone production efficiency. Thus effective means are urgently demanded currently to enhance ozone production efficiency. The effect of gaseous impurities in air or oxygen flow is recognized as an important factor in ozone generation pro- cesses for various types of ozonizers. Influence of feed gas compositions on ozone generation has been investigated quite intensively. In these studies, the influence of differ- ent additives (CO 2 ,H 2 ,H 2 O, CO, Ar, CCl 2 F 2 , CH 2 Cl 2 , CHCl 3 , CCl 4 , SF 6 and so on) on ozone generation in pure oxygen, standard air or air-like mixtures has been inves- tigated [1–5]. Nevertheless, a conspicuous discrepancy re- garding the influence of Ar addition ozone generation per- formance is noteworthy. For instance, Manning [6] claimed that Ar addition would lead to the increase of ozone con- centration; whereas an opposite variation tendency was observed by Skalny et al. [7]. It should be noted that the configuration of coaxial reactor and the voltage across the electrodes are different in their studies. To explore the pos- sible causes leading to the inconsistency, Chen et al. [8,9] carried out an investigation in depth into the impact of Ar addition on ozone generation performance. The results show that the ozone generation might increase as the Ar concentration is increased at a fixed applied voltage, nev- ertheless the ozone concentration is lower for a specific a e-mail: [email protected]input energy. However, apart from Ar, the influence of other inert gas additions on ozone generation is still un- known. In this paper, the influence of He, Ar, Kr and Xe on ozone generation is systematically studied in a di- electric barrier discharge (DBD) within oxygen feed gas. Although Ar addition is not economically feasible to en- hance ozone generation in oxygen [8,9], the influence of inert gases on ozone generation is interesting and worth further investigation. 2 Experimental details The ozonizer has been detailed previously [3]. The ex- perimental schematic is shown in Figure 1a. The high voltage AC power supply (CTP2000K, Nanjing Suman Electronics Co., Ltd, China) was working at 7.47 kHz. The input voltage applied to the AC power supply re- mained at 250 V. The inner electrode was stressed by the applied voltage with grounding the outer electrode. The experiments were carried out in a tubular reactor, which consisted of two coaxial cylindrical electrodes forming an annular discharge gap of 0.6 mm width between them as shown in Figure 1b. The inner cylindrical electrode was a stainless-steel tube of 200 mm length, 57 mm outer di- ameter. The enamel coating on the external surface was 0.4 mm thick. The pressure in the discharge chamber was kept at atmospheric pressure 1.01 ×10 5 P. The outer cylin- drical electrode was cooled by water at a temperature of 288 ± 1 K operated with a flow rate of 55 ± 2 L/h, respectively. The operating gas temperature remained at 300 ± 2 K.
Transcript
Eur. Phys. J. D (2014) 68: 17DOI: 10.1140/epjd/e2013-40556-8
Regular Article
THE EUROPEANPHYSICAL JOURNAL D
An analysis of the effect of inert gases on ozone generationusing dielectric barrier discharge in oxygen
Linsheng Weia, Dingkun Yuan, Yafang Zhang, Zhaoji Hu, Zhihong Tan, Guopan Dong, and Siqi Tao
School of Environmental and Chemical Engineering, Nanchang University, Nanchang 330031, P.R. China
Abstract. This paper studies the influence of inert gases He, Ar, Kr and Xe on ozone generation in adielectric barrier reactor fed by oxygen feed gas. Results show that inert gas additions would lead to lowerapplied voltage, discharge power and reduced field. The electron energy distribution function shifts to theright though inert gas addition would lead to a lower reduced field with He, Ar and Kr addition, but itshifts to the left with Xe addition. The effective electron density decreases with inert gas content. Withrespect to Ar/O2, Kr/O2 and Xe/O2 mixture, conversion ratio of oxygen into ozone and ozone yield wouldincrease with increasing Ar, Kr or Xe content, the growth rates follow the order of Xe > Kr > Ar. Suchbehaviors can be ascribed to the fact that Ar*, Kr* and Xe* could provide another effective pathway toproduce oxygen atom through penning dissociation of O2 and metastable species due to their relativelylow excitation threshold and considerable rate coefficients.
1 Introduction
Ozone, historically mainly employed for drinking watertreatment, is currently widely used in numerous applica-tions. The advantages of high oxidizing ability and envi-ronmental friendliness lead to rapid increasing demand forhigh ozone production efficiency. Thus effective means areurgently demanded currently to enhance ozone productionefficiency.
The effect of gaseous impurities in air or oxygen flow isrecognized as an important factor in ozone generation pro-cesses for various types of ozonizers. Influence of feed gascompositions on ozone generation has been investigatedquite intensively. In these studies, the influence of differ-ent additives (CO2, H2, H2O, CO, Ar, CCl2F2, CH2Cl2,CHCl3, CCl4, SF6 and so on) on ozone generation in pureoxygen, standard air or air-like mixtures has been inves-tigated [1–5]. Nevertheless, a conspicuous discrepancy re-garding the influence of Ar addition ozone generation per-formance is noteworthy. For instance, Manning [6] claimedthat Ar addition would lead to the increase of ozone con-centration; whereas an opposite variation tendency wasobserved by Skalny et al. [7]. It should be noted that theconfiguration of coaxial reactor and the voltage across theelectrodes are different in their studies. To explore the pos-sible causes leading to the inconsistency, Chen et al. [8,9]carried out an investigation in depth into the impact ofAr addition on ozone generation performance. The resultsshow that the ozone generation might increase as the Arconcentration is increased at a fixed applied voltage, nev-ertheless the ozone concentration is lower for a specific
input energy. However, apart from Ar, the influence ofother inert gas additions on ozone generation is still un-known. In this paper, the influence of He, Ar, Kr andXe on ozone generation is systematically studied in a di-electric barrier discharge (DBD) within oxygen feed gas.Although Ar addition is not economically feasible to en-hance ozone generation in oxygen [8,9], the influence ofinert gases on ozone generation is interesting and worthfurther investigation.
2 Experimental details
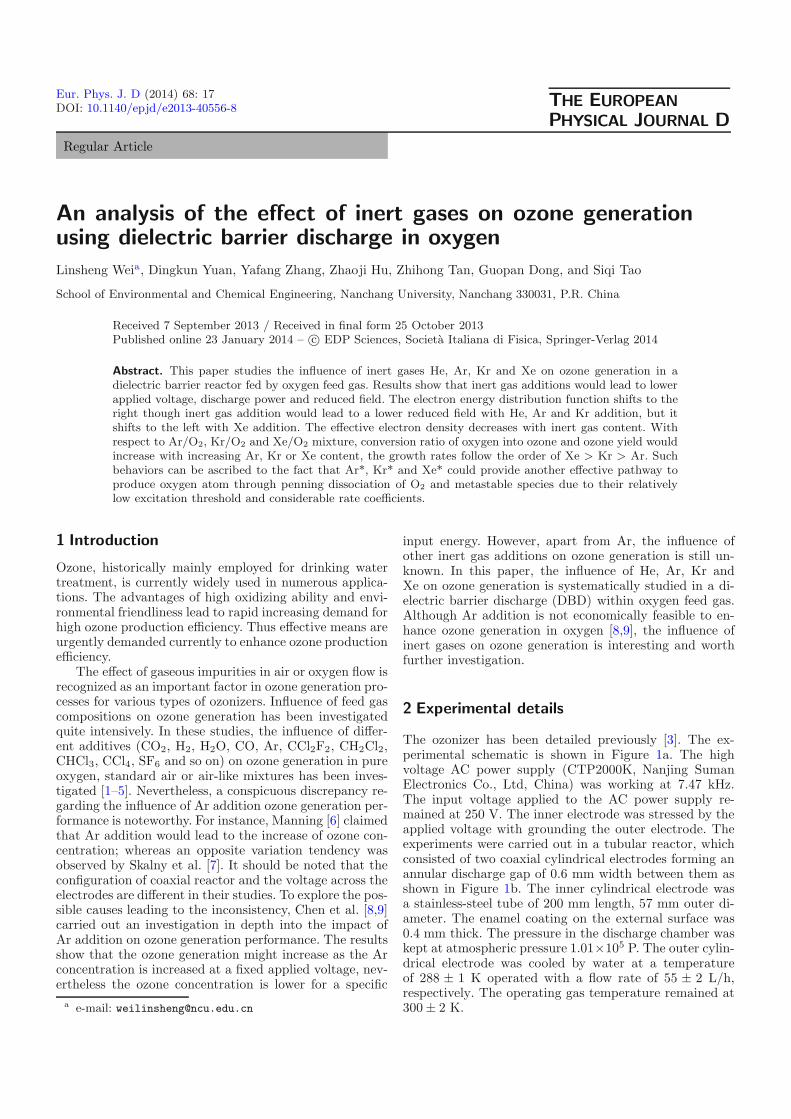
The ozonizer has been detailed previously [3]. The ex-perimental schematic is shown in Figure 1a. The highvoltage AC power supply (CTP2000K, Nanjing SumanElectronics Co., Ltd, China) was working at 7.47 kHz.The input voltage applied to the AC power supply re-mained at 250 V. The inner electrode was stressed by theapplied voltage with grounding the outer electrode. Theexperiments were carried out in a tubular reactor, whichconsisted of two coaxial cylindrical electrodes forming anannular discharge gap of 0.6 mm width between them asshown in Figure 1b. The inner cylindrical electrode wasa stainless-steel tube of 200 mm length, 57 mm outer di-ameter. The enamel coating on the external surface was0.4 mm thick. The pressure in the discharge chamber waskept at atmospheric pressure 1.01×10⁵ P. The outer cylin-drical electrode was cooled by water at a temperatureof 288 ± 1 K operated with a flow rate of 55 ± 2 L/h,respectively. The operating gas temperature remained at300 ± 2 K.
Fig. 1. Schematic diagram of experimental system (a) and tubular reactor (b).
The feed gas flow rate was controlled by mass flowme-ter at 300 L/h. The concentration of ozone was measuredby an ozone analyzer (IN2000 Ozone Analyzer, IN USAInc., 1. range 0∼21.4 g/m3, accuracy 2.14 mg/m3; 2. range0∼200 g/m3, accuracy 0.1 g/m3). The measurements wereinstantaneous and did not suffer from errors that maybe caused by the presence of inert gases. The appliedvoltage between two electrodes and Lissajous figure weremeasured by a digital oscilloscope (Tektronix, TDS3034B)equipped with a high voltage probe (Tektronix, P6015A)and a voltage probe (Tektronix, 613B). The dischargepower was determined by the applied frequency and thearea of the closed loop of the Lissajous figure. In this pa-per, all the experimental data in this paper are obtainedafter the system reached a steady state.
3 Results and discussion
3.1 Influence of inert gas addition on applied voltageand discharge power
Within DBD reactor in this study, the theoretical dis-charge power can be directly derived from Manleyequation [10].
Pd = 4fCdCd
Cd + CgUb(Up − Ub), (1)
where Pd is the discharge power (W), f is the applied fre-quency (Hz), Ub is the breakdown voltage (V), Up is theapplied voltage (V), Cd and Cg are the capacitances of thedielectric layer and the discharge gap (pF), respectively.For a given DBD reactor, the discharge power mainly de-pends on Ub(Up−Ub) due to the fact that the capacitance
0.0 0.2 0.4 0.6 0.8 1.00
4080
120160200240
Dis
char
ge p
ower
(W)
The volume fraction of inert gas
0.0 0.2 0.4 0.6 0.8 1.02.6
2.8
3.0
3.2
3.4
(b)
(a) He+O2; Ar+O2 Kr+O2; Xe+O2
App
lied
volta
ge(k
V)
The volume fraction of inert gas
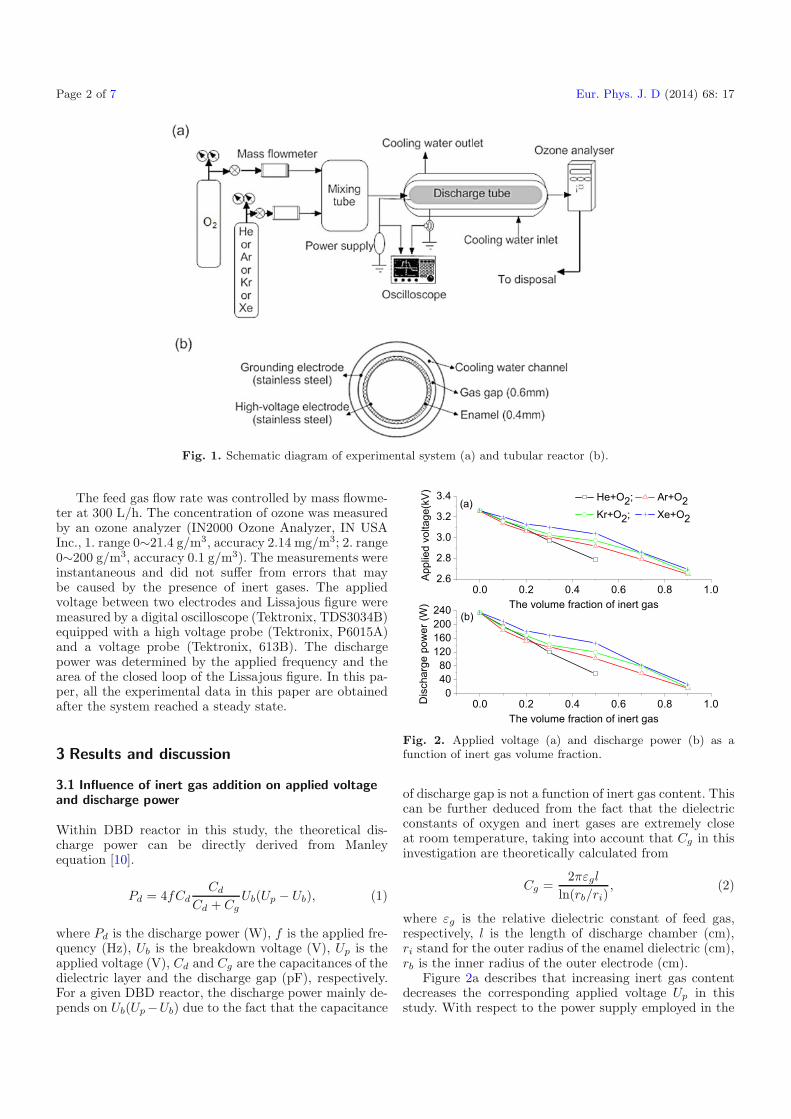
Fig. 2. Applied voltage (a) and discharge power (b) as afunction of inert gas volume fraction.
of discharge gap is not a function of inert gas content. Thiscan be further deduced from the fact that the dielectricconstants of oxygen and inert gases are extremely closeat room temperature, taking into account that Cg in thisinvestigation are theoretically calculated from
Cg =2πεgl
ln(rb/ri), (2)
where εg is the relative dielectric constant of feed gas,respectively, l is the length of discharge chamber (cm),ri stand for the outer radius of the enamel dielectric (cm),rb is the inner radius of the outer electrode (cm).
Figure 2a describes that increasing inert gas contentdecreases the corresponding applied voltage Up in thisstudy. With respect to the power supply employed in the
study, it is a class-D power amplifier named series voltageswitch amplifier which has been presented in previous in-vestigations [3,11]. The impedance of the reactor changesas the share of inert gas in gas mixtures changes, whichleads to the variation of applied voltage. In the investi-gation, a higher inert gas concentration leads to a lowerdischarge power as shown in Figure 2b. An obvious dis-crepancy can be observed that the declining rates of ap-plied voltage and discharge power differ as the share ofinert gas in gas mixtures increases, which follow the over-all order as He > Ar > Kr > Xe. It is also to be notedthe applied voltage and the discharge power both showthe similar variation performance to those in inert gas/airmixtures [3].
3.2 Influence of inert gas addition on mean electronenergy and electron density
For the coaxial DBD reactor adopted in this study, itis assumed all the species are uniform in the radial di-rection. The electric field in the gas gap of the reactor,including the external electrical field Ex(r) induced bythe applied voltage and space charge field Es(r) inducedby the charged particles generated during plasma prop-agation, is a function of the radical distance. It is wellestablished that the DBD in air or oxygen at near at-mospheric pressure is far from being homogeneous. TheDBD in this study is filamentary discharge the electricfield in the gap of DBD reactor is generally space depen-dent with a magnitude close to zero in the plasma regionand with a very high magnitude in the sheath or in thestreamer head. However, these microdischarges are statis-tically distributed with respect to space and time [12,13],For simplification, radial spatial variations are not con-sidered. So it needs to be emphasized that the electricfield strength obtained is represented by the area-averagedvalue which has been confirmed to be effective in the rel-ative studies in predicting ozone concentration and ozoneyield by comparing experimental and numerical results inrelevant literatures [8,9,14,15] to obtain the overall ini-tial electron density. However, to better understand thestreamer propagation in oxygen, a standard fluid modelbased on charged particle transport equation coupled withPossion equation should be considered [16,17].
E =
∫ rb
riE(r)2πrdr
π(r2b − r2
i ), (3)
where r is the radial distance from the center of the innerelectrode surface (cm), E(r) represents the summation ofthe external electric field and the space charge field, whichare determined by the following equations:
Ex(r) =Ug
r ln(rb/ri), (4)
Es(r) =e
4πεg
exp[∫ rb
riαeffdr
]
4∫ rb
ri(De/vd) dr
, (5)
where Ug is gas voltage, αeff is the effective ionizationcoefficient (cm−1), De is the electron diffusion coefficient(cm2 s−1) and vd is the electron drift velocity (cm s−1).Accordingly, the mean reduced field is obtained by E/n,where n is the concentration of neutral particles.
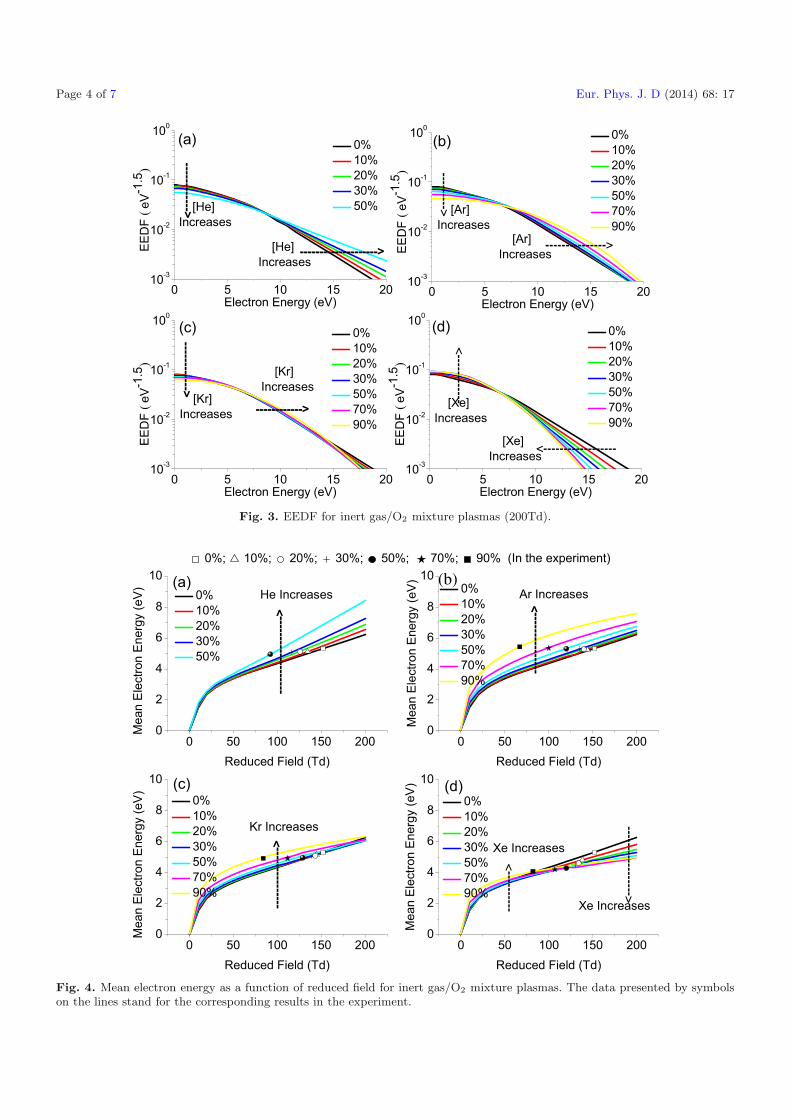
In general, electrons intend to deliver their energyto O2 molecules through electron-impact reactions withlow threshold energy (mostly rotational and vibrationalexcitation and electronic excitation in the lower states)in an O2 plasma. Therefore, it is relatively difficult forelectrons to maintain their energy in an O2 plasma. Nev-ertheless, the lowest threshold values for electron-impactexcitation of He, Ar, Kr and Xe are 19.8 eV, 11.5 eV,9.5 eV and 8.31 eV, respectively. As an electron with en-ergy lower than its lowest threshold energy collides withan inert gas atom, only elastic collision would occur andthe electron would consume an extremely small propor-tion of its total energy [9]. The electron energy distribu-tion function (EEDF) would therefore move down at thevicinity of the origin of energy space and shift to the rightin high energy region for He, Ar, Kr as shown in Fig-ure 3, although adding inert gas would lead to a lowerreduced field as shown in Figure 4. The EEDF shift-rightmovement rate decreases as the excitation threshold en-ergy decreases. When the threshold energy is reasonablylow, EEDF would shift to the left with Xe addition. Suchbehaviors directly lead to the mean electron energy varia-tion as shown in Figure 4. As it can be seen from the figure,adding inert gas would lead to a lower reduced field dueto its decreasing applied voltage (see Fig. 2a). At a fixedreduced field, introducing He, Ar or Kr into oxygen wouldincrease the mean electron energy as EEDF shifts to theright, but the mean electron energy increases in low energyregion while it decreases with Xe addition in high energies.The EEDF and mean electron energy are calculated fromBOLSIG code [18] with cross sections [19–23]. More de-tailed information regarding current status about physicsof charged particle swarm parameters and applications arereviewed by Petrovic et al. [24].
Electrons are energy providers, and the performanceof ozone production depends on the amount of availableelectrons which have sufficient energy to work. Neverthe-less the amount of high energy electrons relies on electrondensity and mean electron energy. In this study, it is as-sumed the power is mainly dissipated by electrons ratherthan by ions in the discharge gap. Consequently, the ini-tial electron density is obtained by the following equation
ne =Pd
2 × f × Vd × Ee × 1.602 × 10⁻¹⁹, (6)
where ne is the electron density (cm−3), Vd is the dischargegap volume (cm3), Ee is the mean electron energy (eV)determined by the mean reduced field in the dischargegap.
In this study, the mean electron energy Ee and cor-responding electron density ne for different working con-ditions are shown in Figure 5. The electron density ne
decreases with increasing inert gas content for all gas mix-tures and the overall decline rates follow the order as
Fig. 3. EEDF for inert gas/O2 mixture plasmas (200Td).
0 50 100 150 2000
2
4
6
8
10He Increases 0%
10% 20% 30% 50%
Mea
n E
lect
ron
Ene
rgy
(eV)
Reduced Field (Td)
------------------->
0 50 100 150 2000
2
4
6
8
10
Xe Increases
Xe Increases
Kr Increases
(a) (b)
(c) (d)
Mea
n El
ectro
n E
nerg
y (e
V)
Reduced Field (Td)
--------------->
----
----
-->
0 50 100 150 2000
2
4
6
8
10
0% 10% 20% 30% 50% 70% 90%
--------------->
0% 10% 20% 30% 50% 70% 90%
0% 10% 20% 30% 50% 70% 90%
Mea
n El
ectro
n En
ergy
(eV
)
Reduced Field (Td)0 50 100 150 200
0
2
4
6
8
10
0%; 10%; 20%; 30%; 50%; 70%; 90% (In the experiment)
Ar Increases
Mea
n El
ectro
n En
ergy
(eV
)
Reduced Field (Td)
<---
----
----
----
--
Fig. 4. Mean electron energy as a function of reduced field for inert gas/O2 mixture plasmas. The data presented by symbolson the lines stand for the corresponding results in the experiment.
Fig. 5. Initial density of electrons with energy higher than 6 eVand mean electron energy as a function of inert gas volumefraction.
He> Ar> Kr> Xe for gas mixtures. The correspondingmean electron energy is the production of the educed fieldstrength and the inert gas molecular fractions. It rarelychanges with increasing inert gas content in He/O2, Ar/O2
and Kr/O2 mixtures, however, adding Xe would lead to aconspicuous decreasing mean electron energy as shown inFigure 5.
3.3 Influence of inert gas addition on conversion ratio,ozone concentration and ozone yield
In the ozone generation, the conversion ration of oxy-gen into ozone is an important indicator in estimatingthe discharge reactor performance which can be directlyexpressed as follows:
η =3[O3]2[O2]0
× 100%, (7)
where η stands for the conversion ration of oxygen intoozone, [O2]0 stands for the initial oxygen concentration,[O3] stands for the ozone concentration.
Figure 6 elucidates the conversion ratio η, ozone con-centration [O3] and ozone yield w for different inertgas/O2 mixtures. It can be seen from the figure, ozoneconcentration [O3] decreases with He, Ar and Kr additionwhile it increases at first and then decreases uniformlywith Xe addition. The conversion ratio η increases withAr, Kr and Xe addition meanwhile the growth rate followan order as Xe > Kr > Ar. However, adding He would leadto the decreasing conversion ratio η in He/O2 mixture. Asfor ozone yield, the addition of Ar, Kr and Xe would leadto the similar performance. The values of w increase withAr, Kr and Xe additions while it decreases slightly withHe addition.
Oxygen atom is the most important precursor forozone generation. According to Eliasson et al. [12] andKogelschatz et al. [13], in pure oxygen the principal
0.0 0.2 0.4 0.6 0.8 1.00
50100150200250300
048
121620
0
20
40
60
80
0.0 0.2 0.4 0.6 0.8 1.0
(c)
(b)
(a)
He+O2; Ar+O2
Kr+O2; Xe+O2
Ozo
ne y
ield
(g/k
Wh)
The volume fraction of inert gas
η (%
)O
zone
con
cent
ratio
n(g/
m3 )
Fig. 6. Ozone concentration, conversion ratio and ozone yieldas a function of inert gas volume fraction.
reactions resulting in oxygen atoms are:
e + O2 → e + O2
(A3
∑+
u
)→ e + O
(3P
)+ O
(3P
),
(8)
e + O2 → e + O2
(B3
∑−u
)→ e + O
(3P
)+ O
(1D
).
(9)
With inert gas addition, electronically excited states ofinert gas species X∗ manifest a significant role in ozonegeneration process due to the fact that O (3P), the mostimportant precursor in three body process defined in reac-tions (8) and (9), can also be obtained from the Penningdissociation of O2 and metastable species.
O2 + X∗ → O(3P
)+ O
(3P
)+ X, (10)
O2 + X∗ → O(3P
)+ O
(1D
)+ X. (11)
Ozone is mainly formed from oxygen atoms by thereaction:
O + O2 + M → O3 + M, (12)
where M is a third collision partner (O, O2, O3, also inertgases).
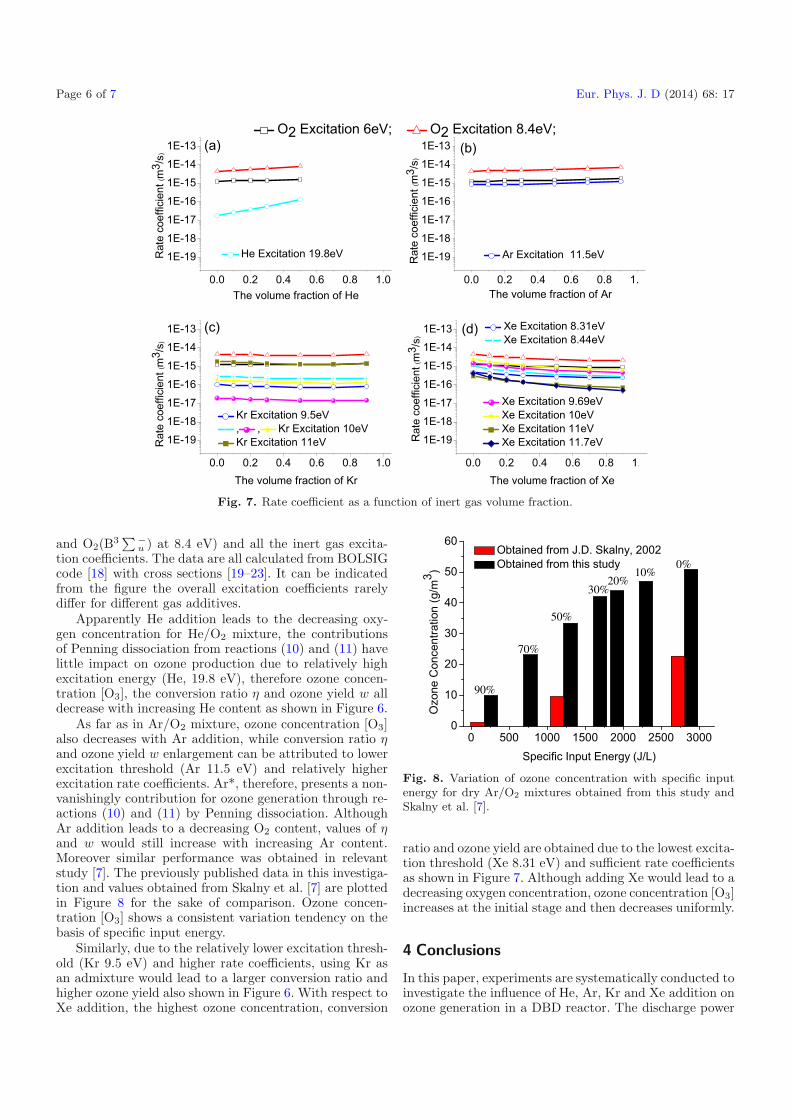
It can be inferred from reactions (8)–(11) that themetastable species of oxygen and inert gases dominate theO(3P) amount. Thereby we present the main reactions in-volved metastable species for the comparison. Figure 7reveals the dominating excitation reaction coefficients in-cluding O2 excitation coefficients (O2(A3
Fig. 7. Rate coefficient as a function of inert gas volume fraction.
and O2(B3∑ −
u ) at 8.4 eV) and all the inert gas excita-tion coefficients. The data are all calculated from BOLSIGcode [18] with cross sections [19–23]. It can be indicatedfrom the figure the overall excitation coefficients rarelydiffer for different gas additives.
Apparently He addition leads to the decreasing oxy-gen concentration for He/O2 mixture, the contributionsof Penning dissociation from reactions (10) and (11) havelittle impact on ozone production due to relatively highexcitation energy (He, 19.8 eV), therefore ozone concen-tration [O3], the conversion ratio η and ozone yield w alldecrease with increasing He content as shown in Figure 6.
As far as in Ar/O2 mixture, ozone concentration [O3]also decreases with Ar addition, while conversion ratio ηand ozone yield w enlargement can be attributed to lowerexcitation threshold (Ar 11.5 eV) and relatively higherexcitation rate coefficients. Ar*, therefore, presents a non-vanishingly contribution for ozone generation through re-actions (10) and (11) by Penning dissociation. AlthoughAr addition leads to a decreasing O2 content, values of ηand w would still increase with increasing Ar content.Moreover similar performance was obtained in relevantstudy [7]. The previously published data in this investiga-tion and values obtained from Skalny et al. [7] are plottedin Figure 8 for the sake of comparison. Ozone concen-tration [O3] shows a consistent variation tendency on thebasis of specific input energy.
Similarly, due to the relatively lower excitation thresh-old (Kr 9.5 eV) and higher rate coefficients, using Kr asan admixture would lead to a larger conversion ratio andhigher ozone yield also shown in Figure 6. With respect toXe addition, the highest ozone concentration, conversion
0 500 1000 1500 2000 2500 30000
10
20
30
40
50
60
90%
70%
50%
30%20%
10%0%
Ozo
ne C
once
ntra
tion
(g/m
3 )
Specific Input Energy (J/L)
Obtained from J.D. Skalny, 2002 Obtained from this study
Fig. 8. Variation of ozone concentration with specific inputenergy for dry Ar/O2 mixtures obtained from this study andSkalny et al. [7].
ratio and ozone yield are obtained due to the lowest excita-tion threshold (Xe 8.31 eV) and sufficient rate coefficientsas shown in Figure 7. Although adding Xe would lead to adecreasing oxygen concentration, ozone concentration [O3]increases at the initial stage and then decreases uniformly.
4 Conclusions
In this paper, experiments are systematically conducted toinvestigate the influence of He, Ar, Kr and Xe addition onozone generation in a DBD reactor. The discharge power
and corresponding reduced field in the working conditionsdecrease with inert gas addition.
The ozone concentration, conversion ratio of oxy-gen into ozone and the ozone yield have shown topresent different behaviors with increasing inert gas con-tent. He, Ar and Kr addition all lead to the decreasingozone concentration [O3] while ozone concentration firstincreases and then decreases with Xe addition.
Duo to the contribution of penning dissociation be-tween O2 and inert gas metastable species, Ar, Kr and Xeaddition all lead to the increase of conversion ratio andozone yield. The overall growth rates follow the order asXe > Kr > Ar > He owing to different excitation thresh-old (Ar 11.5 eV, Kr 9.5 eV and Xe 8.31 eV) and ratecoefficients.
The work was supported by the National Natural Sci-ence Foundation of China (11105067, 51366012) and JiangxiProvince Young Scientists (Jinggang Star) Cultivation Plan(No. 20133BCB23008).
References
1. T. Mikoviny, M. Kocan, S. Matejcik, N.J. Mason, J.D.Skalny, J. Phys. D 37, 64 (2004)
(2004)16. A. Komuro, R. Ono, T. Oda, J. Phys. D 45, 265201 (2012)17. G.V. Naidis, J.L. Walsh, J. Phys. D 46, 095203 (2013)18. G.J.M. Hagelaar, L.C. Pitchford, Plasma Sources Sci.