An Analysis of the Effect of North Korea’s International and Inter-Korean Trade on Its Economic Growth 175 An Analysis of the Effect of North Korea’s International and Inter-Korean Trade on Its Economic Growth Young-Hoon Lee* This study analyzes the growing influence of North Korea' s and inter- Korean trade on North Korea' s economic growth, and examines some of the implications for the future direction of economic or political policies. Major analyses show that the North Korea' s average economic growth rate for the years 1999-2003 that was driven by inter-Korean trade hovered at 1.2% up to 2.3% and the growth rate by North Korea' s trade stood at 2.4%. The rates are surprisingly high, roughly equivalent to the 2.8% average growth rate for the corresponding years estimated by the Bank of Korea. These results suggest that without the growth of North Korea' s and inter- Korean trade for the years, North Korea could have slipped into negative economic growth. Another striking result arising from the analyses is that inter-Korean trade, although it accounts for one-fifth of North Korea' s overall trade volume, has a significant effect on the North Korea' s economic rebound, which stems largely from "non-trade" nature or South Korea' s unilateral economic or humanitarian assistance. JEL Classification Number : C5, F1, O1, P2 Key words : North Korea ' s Trade, Inter-Korean Trade, North Korea ' s Economic Growth *Economist, Northeast Asian Economic Studies Team, Institute for Monetary & Economic Research, the Bank of Korea. (Tel : +82-2-759-5399, E-mail : [email protected]).
Transcript
An Analysis of the Effect of North Korea’s International and Inter-Korean Trade on Its Economic Growth 175
An Analysis of the Effect of North Korea’sInternational and Inter-Korean Trade
on Its Economic Growth
Young-Hoon Lee*
This study analyzes the growing influence of North Korea' s and inter-
Korean trade on North Korea' s economic growth, and examines some of the
implications for the future direction of economic or political policies.
Major analyses show that the North Korea' s average economic growth
rate for the years 1999-2003 that was driven by inter-Korean trade hovered
at 1.2% up to 2.3% and the growth rate by North Korea' s trade stood at
2.4%. The rates are surprisingly high, roughly equivalent to the 2.8%
average growth rate for the corresponding years estimated by the Bank of
Korea.
These results suggest that without the growth of North Korea' s and inter-
Korean trade for the years, North Korea could have slipped into negative
economic growth. Another striking result arising from the analyses is that
inter-Korean trade, although it accounts for one-fifth of North Korea' s
overall trade volume, has a significant effect on the North Korea' s economic
rebound, which stems largely from "non-trade" nature or South Korea' s
unilateral economic or humanitarian assistance.
JEL Classification Number : C5, F1, O1, P2
Key words : North Korea ' s Trade, Inter-Korean Trade, North Korea ' s
Economic Growth
*Economist, Northeast Asian Economic Studies Team, Institute for Monetary & Economic Research, the Bank ofKorea. (Tel : +82-2-759-5399, E-mail : [email protected]).
176 Economic Papers Vol.8 No.1
I. Introduction
It is evaluated that the North Korean economy has entered a recovery phase,
although it has not fully recovered from the economic crisis. The North Korean
economy, which had posted negative growth since 1990, rebounded in the year
1999 and together with sustained positive growth until recently. Systematic
restructuring and changed economic policies beginning in 1998, international aid
including the inter-Korean economic cooperation are cited as major contributors
of the recovery.1)
Since 1998, Kim Jeong-il' s regime has been stable, providing a
basis for the putting in place of various economic measures. At the same time,
the nation' s trade with the outside world, including inter-Korean trade, has
significantly increased. In this context, there is a high possibility that internal
and external factors have combined to contribute to the nation' s economic
recovery. However, there has been no thorough empirical analysis as to the
likelihood of this so far.
Against this backdrop, this study aims to provide an empirical analysis of how
and to what extent North Korea' s international trade and inter-Korean trade
affect its economic growth. This study separates North Korea' s trade with South
Korea from that with other countries, given its unique character of "national
internal transactions".2)
This study is organized as follows: first, before analyzing their effect on North
Korea' s economy, we compare and review North Korea' s trade with other
nations and that with South Korea. Second, we develop a model which analyzes
their effect on an economic growth in general and conduct an empirical analysis
of their effect on North Korea' s economic growth using the model. The inter-
Korean trade is short in history and quite different from North Korea' s trade
Notes : 1) " The recent recovery trend of the North Korean economy is attributed to the fact that the expansion offiscal spending to normalize the economy, inflow of large-scale grant-type aid since 1998 and inflow ofthe dollars from Mt. Geumgang tour project have led to the normalization of some plant operations, alongwith regime stabilization following the inauguration of Kim Jeong-il." Ministry of Unification,Understanding North Korea 2002. p.109, Understanding North Korea 2004, pp.139-140
Notes : 2) In principle, inter-Korean trade is regarded as domestic trade in Act on Inter-Korean Exchanges andCooperation (Aug. 1990) and Special Act on the Implementation of the WTO agreement (Jan. 1995).Agreement on Reconciliation, Non-aggression and Exchanges and Cooperation between the South and
North stipulates inter-Korean trade as " national internal transactions" . Terms regarding inter-Koreantrade are accordingly different from those regarding international trade, In inter-Korean trade, terms suchas transactions, outflow and inflow are used to refer to trade, exports and imports, respectively. However,there is no difference in the coverage of the signified.
An Analysis of the Effect of North Korea’s International and Inter-Korean Trade on Its Economic Growth 177
with other nations in nature so that separate methodologies are employed. Lastly,
we suggest the limits and challenges of the inter-Korean trade, based on a
comprehensive analysis of their implications to the North Korean economy.
II. The Current State and Features of North Korea' sInternational Trade and Inter-Korean Trade
1. International Trade
1) Overview
After liberation from Japan' s colonial rule and until the late 1980s, North
Korea' s trade had been mostly with socialist countries, such as the former Soviet
Union through barter based on the friendship price system and settlement
clearance. However, the collapse of the Communist block at the end of the 1980s
dealt a harsh blow to the North Korean economy since the socialist markets
accounted for two-thirds of its trade. Under these circumstances, North Korea
had to shift its settlement system to one based on hard currency. Lack of foreign
exchange reserves worsened the shortages of electricity, natural resource and
energy which, in turn, aggravated economic hardships. Against this backdrop,
North Korea has begun seeking its way out of the difficulties, mainly relying on
trade mainly relying on non-commercial trade including assistance from the
international community.
2) Current State of Trade
a. Perception of Trade in the North Korean Economy
North Korea' s trade has been shaped by the policy for " the construction of a
self-supporting national economy" which is Pyongyang ' s economic
development strategy.3)
North Korea defines a self-supporting national economy
as " an economic system where all factors of production such as human and
material resources are secured within the economy itself and a complete
coupling between production and consumption allows its production and
consumption cycle." 4)In accordance with this economic strategy, North Korea' s
3) " The most important thing in the international trade policy of the Workers' Party is to develop international tradebased on self-supporting national economy." Economic Dictionary1 (Pyongyang: Social Science PublishingCo., 1985) p.464,
178 Economic Papers Vol.8 No.1
trade policy initially focused on self-sufficiency. For instance, the North
emphasized the production of raw materials and fuels on its own, which
demonstrates its obsession with the principle of a self-supporting national
economy: Exports were used only as a means to acquire foreign currency and
only a minimum amount of producers' goods were allowed to be imported.
Moreover, its imported industrial facilities were confined to those designed to
produce commodities for domestic consumption, not for export, and only a
minimum amount of part and component imports were allowed. These were
parts of its efforts to produce facilities on its own through the development of its
machinery industry.5)
In this context, its policy for the construction of a self-
supporting national economy can be called an inner-directed and import-
substitute development strategy.
However, North Korea came to face the limits of a small-scale economy and
has begun to ease up " the policy for the construction of a self-supporting
national economy" in an attempt to expand trade from the early 1970s. North
Korea put more emphasis on trade as it became integrated into the global
economy following the collapse of the socialist block. Nevertheless, it has
maintained its inner-directed economic structure, only moderately easing up its
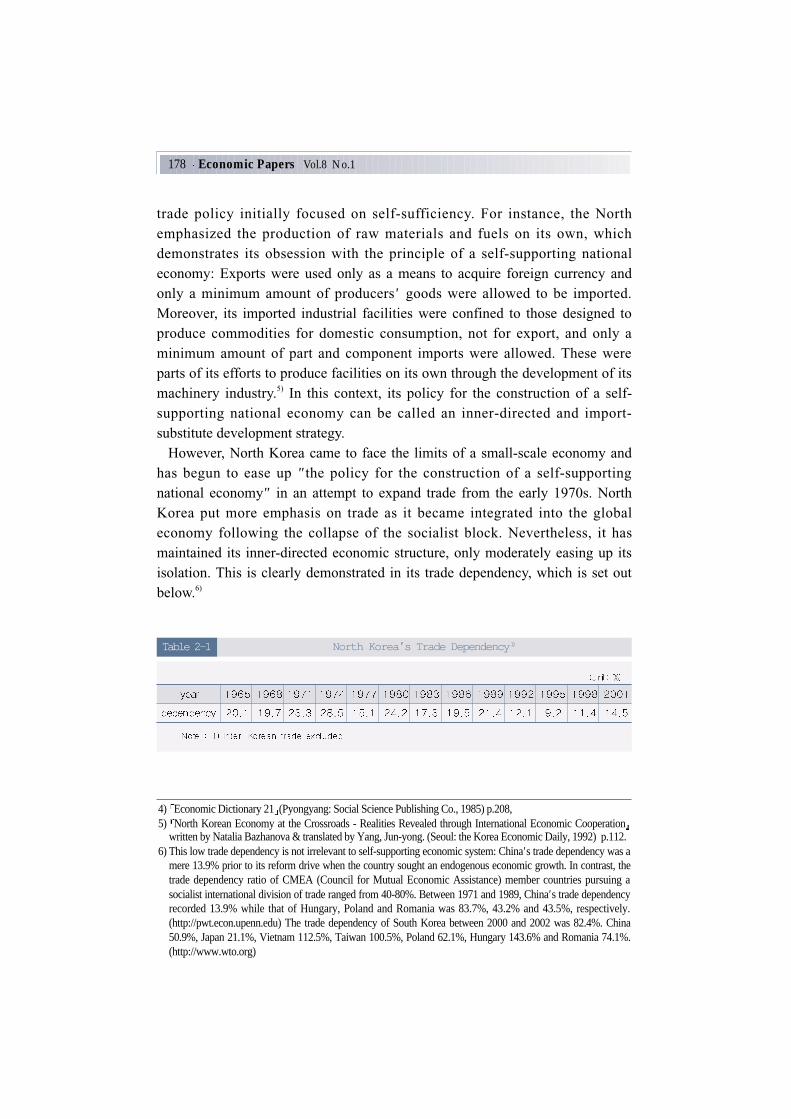
isolation. This is clearly demonstrated in its trade dependency, which is set out
below.6)
4) Economic Dictionary 21 (Pyongyang: Social Science Publishing Co., 1985) p.208, 5) North Korean Economy at the Crossroads - Realities Revealed through International Economic Cooperation
written by Natalia Bazhanova & translated by Yang, Jun-yong. (Seoul: the Korea Economic Daily, 1992) p.112. 6) This low trade dependency is not irrelevant to self-supporting economic system: China' s trade dependency was a
mere 13.9% prior to its reform drive when the country sought an endogenous economic growth. In contrast, thetrade dependency ratio of CMEA (Council for Mutual Economic Assistance) member countries pursuing asocialist international division of trade ranged from 40-80%. Between 1971 and 1989, China' s trade dependencyrecorded 13.9% while that of Hungary, Poland and Romania was 83.7%, 43.2% and 43.5%, respectively.(http://pwt.econ.upenn.edu) The trade dependency of South Korea between 2000 and 2002 was 82.4%. China50.9%, Japan 21.1%, Vietnam 112.5%, Taiwan 100.5%, Poland 62.1%, Hungary 143.6% and Romania 74.1%.(http://www.wto.org)
North Korea's Trade Dependency1)Table 2-1
An Analysis of the Effect of North Korea’s International and Inter-Korean Trade on Its Economic Growth 179
North Korea' s trade policy was based on the principle of the politico-
economic linkage that political purposes take precedence over economic ones.
This is the main feature of socialist countries' trade policies. A country that
adopts this principle places priority on its trade with socialist countries, thus
maintaining the political economic relationship. If necessary, it can pursue trade
relations with capitalist economies, yet these relations are solely confined to
economic ones. Since the beginning of the 1990s, however, the principle has
become meaningless with North Korea' s incorporation into the global market
economy.
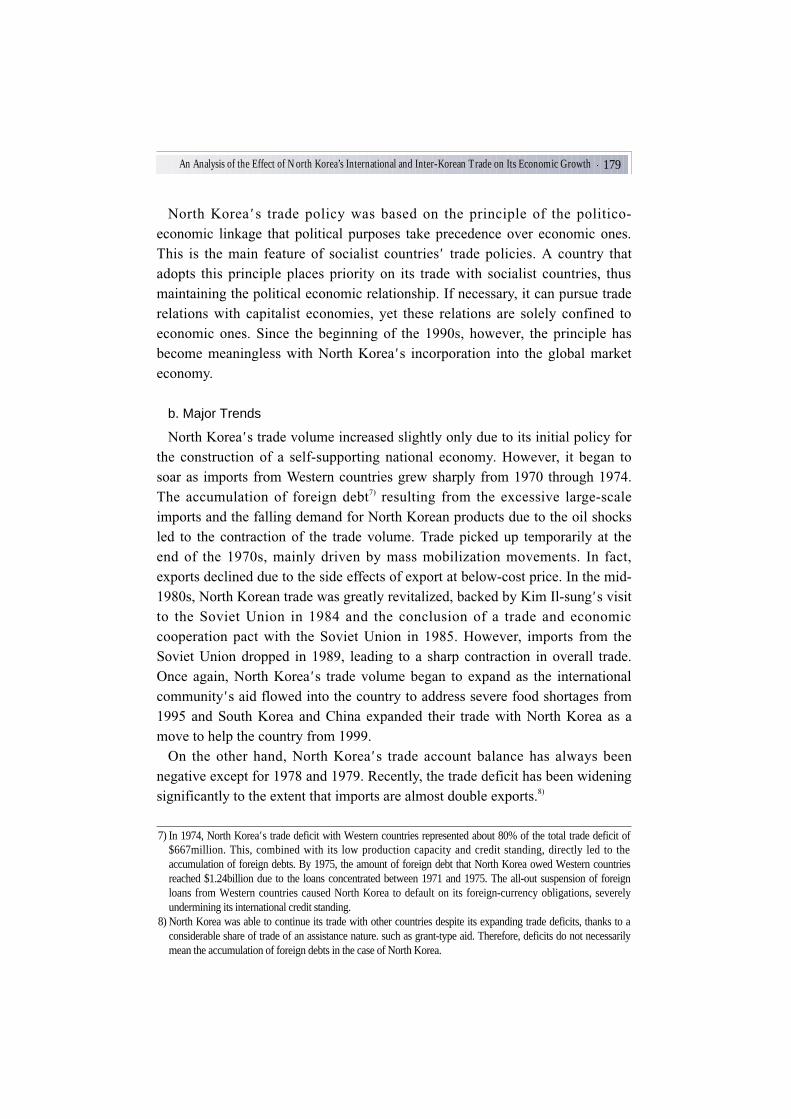
b. Major Trends
North Korea' s trade volume increased slightly only due to its initial policy for
the construction of a self-supporting national economy. However, it began to
soar as imports from Western countries grew sharply from 1970 through 1974.
The accumulation of foreign debt7)
resulting from the excessive large-scale
imports and the falling demand for North Korean products due to the oil shocks
led to the contraction of the trade volume. Trade picked up temporarily at the
end of the 1970s, mainly driven by mass mobilization movements. In fact,
exports declined due to the side effects of export at below-cost price. In the mid-
1980s, North Korean trade was greatly revitalized, backed by Kim Il-sung' s visit
to the Soviet Union in 1984 and the conclusion of a trade and economic
cooperation pact with the Soviet Union in 1985. However, imports from the
Soviet Union dropped in 1989, leading to a sharp contraction in overall trade.
Once again, North Korea' s trade volume began to expand as the international
community' s aid flowed into the country to address severe food shortages from
1995 and South Korea and China expanded their trade with North Korea as a
move to help the country from 1999.
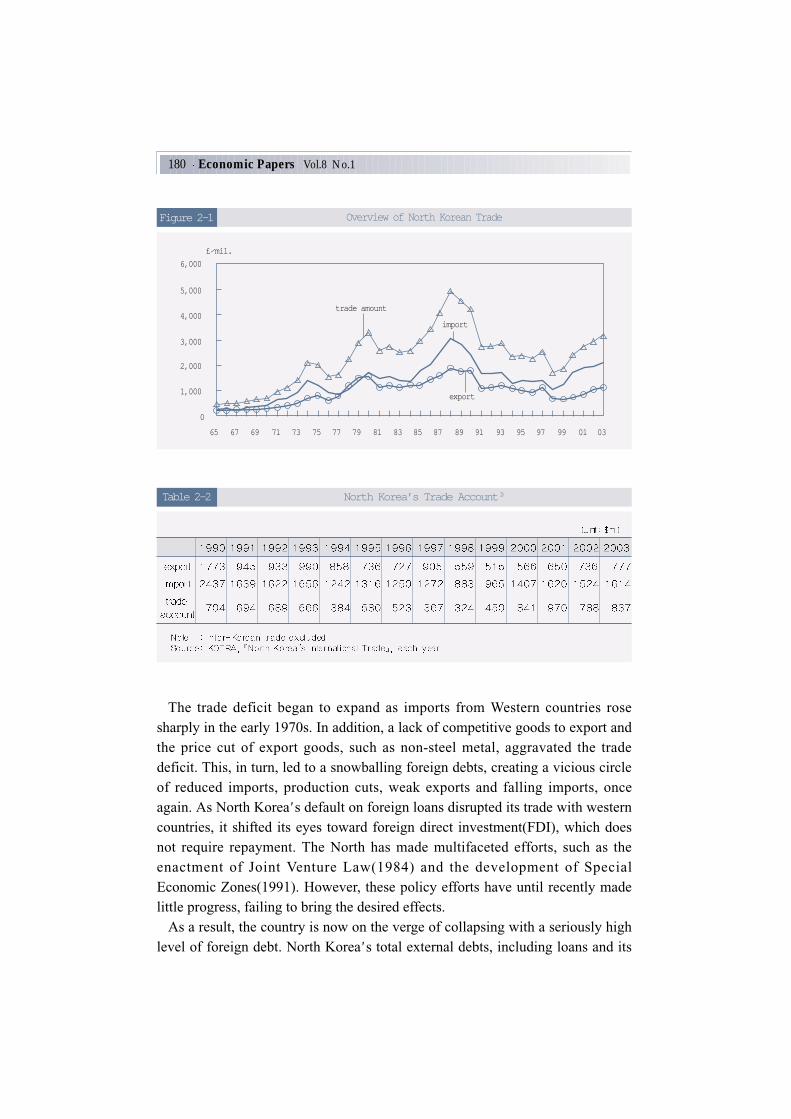
On the other hand, North Korea' s trade account balance has always been
negative except for 1978 and 1979. Recently, the trade deficit has been widening
significantly to the extent that imports are almost double exports.8)
7) In 1974, North Korea' s trade deficit with Western countries represented about 80% of the total trade deficit of$667million. This, combined with its low production capacity and credit standing, directly led to theaccumulation of foreign debts. By 1975, the amount of foreign debt that North Korea owed Western countriesreached $1.24billion due to the loans concentrated between 1971 and 1975. The all-out suspension of foreignloans from Western countries caused North Korea to default on its foreign-currency obligations, severelyundermining its international credit standing.
8) North Korea was able to continue its trade with other countries despite its expanding trade deficits, thanks to aconsiderable share of trade of an assistance nature. such as grant-type aid. Therefore, deficits do not necessarilymean the accumulation of foreign debts in the case of North Korea.
180 Economic Papers Vol.8 No.1
The trade deficit began to expand as imports from Western countries rose
sharply in the early 1970s. In addition, a lack of competitive goods to export and
the price cut of export goods, such as non-steel metal, aggravated the trade
deficit. This, in turn, led to a snowballing foreign debts, creating a vicious circle
of reduced imports, production cuts, weak exports and falling imports, once
again. As North Korea' s default on foreign loans disrupted its trade with western
countries, it shifted its eyes toward foreign direct investment(FDI), which does
not require repayment. The North has made multifaceted efforts, such as the
enactment of Joint Venture Law(1984) and the development of Special
Economic Zones(1991). However, these policy efforts have until recently made
little progress, failing to bring the desired effects.
As a result, the country is now on the verge of collapsing with a seriously high
level of foreign debt. North Korea' s total external debts, including loans and its
An Analysis of the Effect of North Korea’s International and Inter-Korean Trade on Its Economic Growth 181
trade deficit, amounted to $12.5billion as of 2000.9)
The International Monetary
Fund(IMF) defines a country with an external debt/export ratio more than 2.2
and a per-capita GDP less than $695 as a Highly Indebted Poor Country(HIPC).
North Korea barely avoided being classified as a poor country, with per-capita
GDP recording $818 as of 2003, but it still faces a serious external debt crisis
considering that its external debt/export ratio is more than 10.
c. Composition of Trade
Trade Analysis by Product
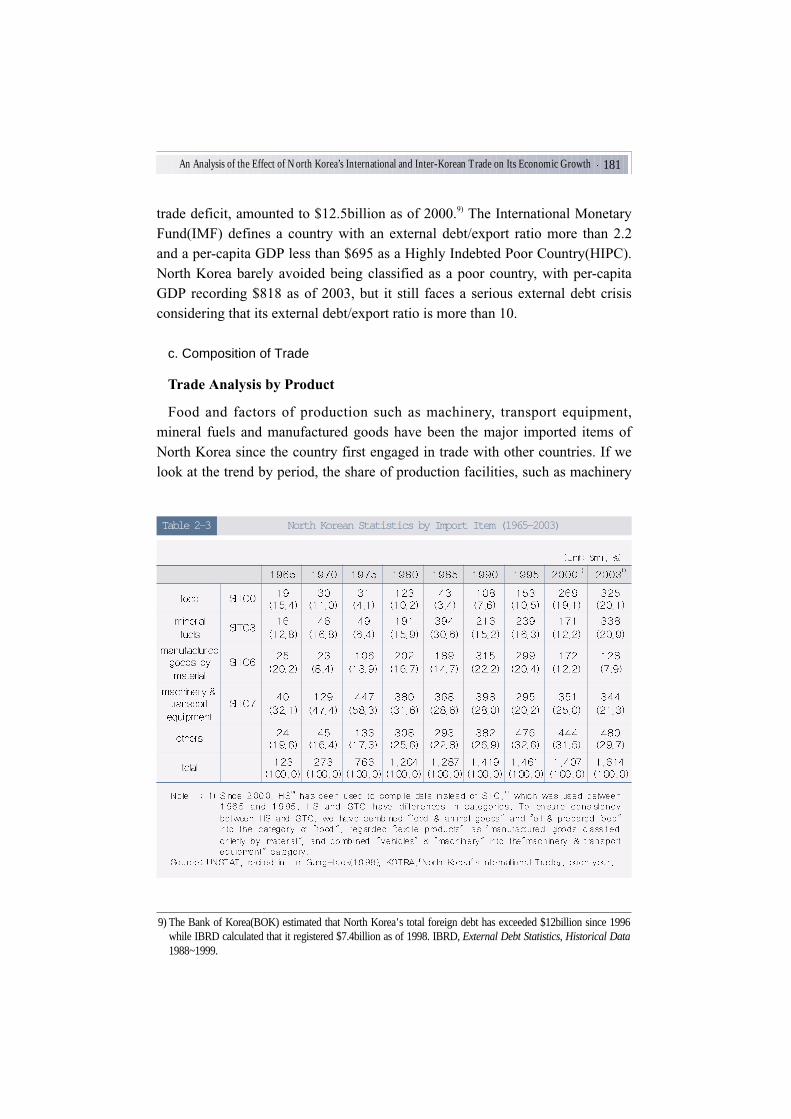
Food and factors of production such as machinery, transport equipment,
mineral fuels and manufactured goods have been the major imported items of
North Korea since the country first engaged in trade with other countries. If we
look at the trend by period, the share of production facilities, such as machinery
North Korean Statistics by Import Item (1965-2003)Table 2-3
9) The Bank of Korea(BOK) estimated that North Korea' s total foreign debt has exceeded $12billion since 1996while IBRD calculated that it registered $7.4billion as of 1998. IBRD, External Debt Statistics, Historical Data1988~1999.
182 Economic Papers Vol.8 No.1
and transport equipment, grew in the 1970s. In the 1980s, with growing imports
from Russia, the share of mineral fuels, especially coke and crude oil, were
relatively high. In the early to mid 1990s, imports of textile raw materials for
processing trade rose so that the share of manufactured goods classified chiefly
by material grew remarkably. Food imports grew in proportion well into the end
of 1990s, demonstrating North Korea' s severe food shortages.
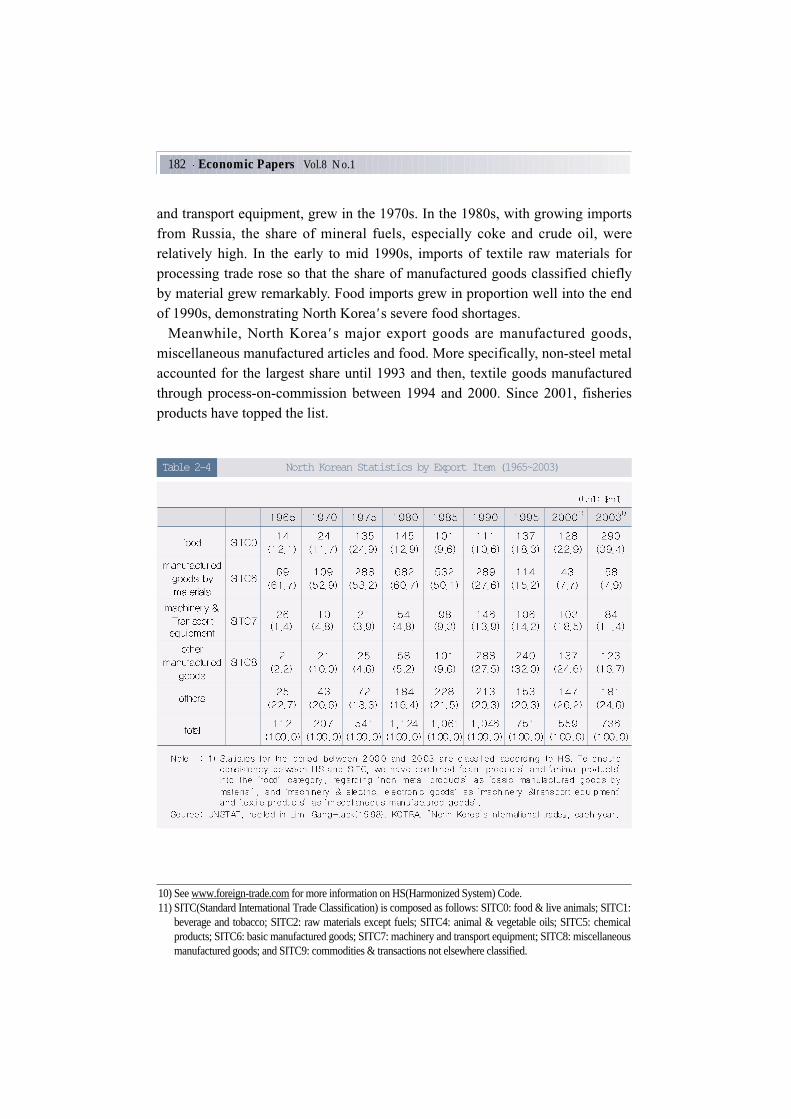
Meanwhile, North Korea' s major export goods are manufactured goods,
miscellaneous manufactured articles and food. More specifically, non-steel metal
accounted for the largest share until 1993 and then, textile goods manufactured
through process-on-commission between 1994 and 2000. Since 2001, fisheries
products have topped the list.
10) See www.foreign-trade.com for more information on HS(Harmonized System) Code.11) SITC(Standard International Trade Classification) is composed as follows: SITC0: food & live animals; SITC1:
beverage and tobacco; SITC2: raw materials except fuels; SITC4: animal & vegetable oils; SITC5: chemicalproducts; SITC6: basic manufactured goods; SITC7: machinery and transport equipment; SITC8: miscellaneousmanufactured goods; and SITC9: commodities & transactions not elsewhere classified.
North Korean Statistics by Export Item (1965~2003) Table 2-4
An Analysis of the Effect of North Korea’s International and Inter-Korean Trade on Its Economic Growth 183
Trade Record by Nature of Transaction
North Korea' s trade is quiet different from that of other nations since non-
commercial trade accounts for a very large proportion. Unlike general import &
export and capital transactions, non-commercial trade means provision of goods,
financial income or expenditures gratis by one country to another.
The chronology of North Korea' s trade by period is set out below; First, in the
wake of liberation, more specifically, immediately after the Korean War, North
Korea received a huge amount of goods, such as raw materials, as grant-type aid
from its socialist neighbors, including the Soviet Union and China. Since the
1960s, however, credit assistance has replaced grant-type aid. The total amount
of credit assistance and grant-type aid North Korea received by the end of the
1960s amounted to $2.04billion.12)
Second, as the flow of assistance from
socialist countries ebbed from the early 1970s, North Korea took out large-scale
loans from Western countries which amounted to $1.24billion.13)
Third, Kim Il-
sung' s visit to the Soviet Union in 1984 and the bilateral agreement on trade and
economic cooperation in December 1985 laid the foundation for the expansion
of North Korean trade.14)
The collapse of the Communist block, however, led to
termination of the friendship price system that had been applied to the bilateral
trade of military equipment and crude oil, etc. This meant a virtual end of
assistance-in-kind to North Korea.15)
4)From 1995, South Korea, Western
countries and international organizations began to provide aid to North Korea
which suffered from severe food shortages. Against this backdrop, the provision
of grant-type aid, was resumed, making an increasing contribution to the North
Korean economy.16)
12) Ministry of Unification, North Korea Overview 2000 2000, p. 38513) Yet, loans from western countries have been virtually suspended so far since North Korea defaulted on foreign-
currency obligations in 1976. Since then, only a small amount of loans were provided mainly by the formerSoviet Union and China. Ministry of Unification, op. cit.
14) Signing this agreement, the two nations agreed to increase the bilateral trade volume by 2,7 times that of thepreceding 5 years. In addition, the Soviet Union promised to provide about $100million of loans during the 3rdRound of 7 Year Plan(1987-1993) Far Eastern Affairs, 1986, no.3, p.188, recited by Natalia Bazhanova p.106.
15) Ministry of Unification, North Korea Overview 2004 2004, p.296 In addition, the collapse of the SovietUnion resulted in the suspension of North Korea-Soviet Union cooperation in science and technology which, infact, had been sustained by grant-type aid from the Soviet Union.
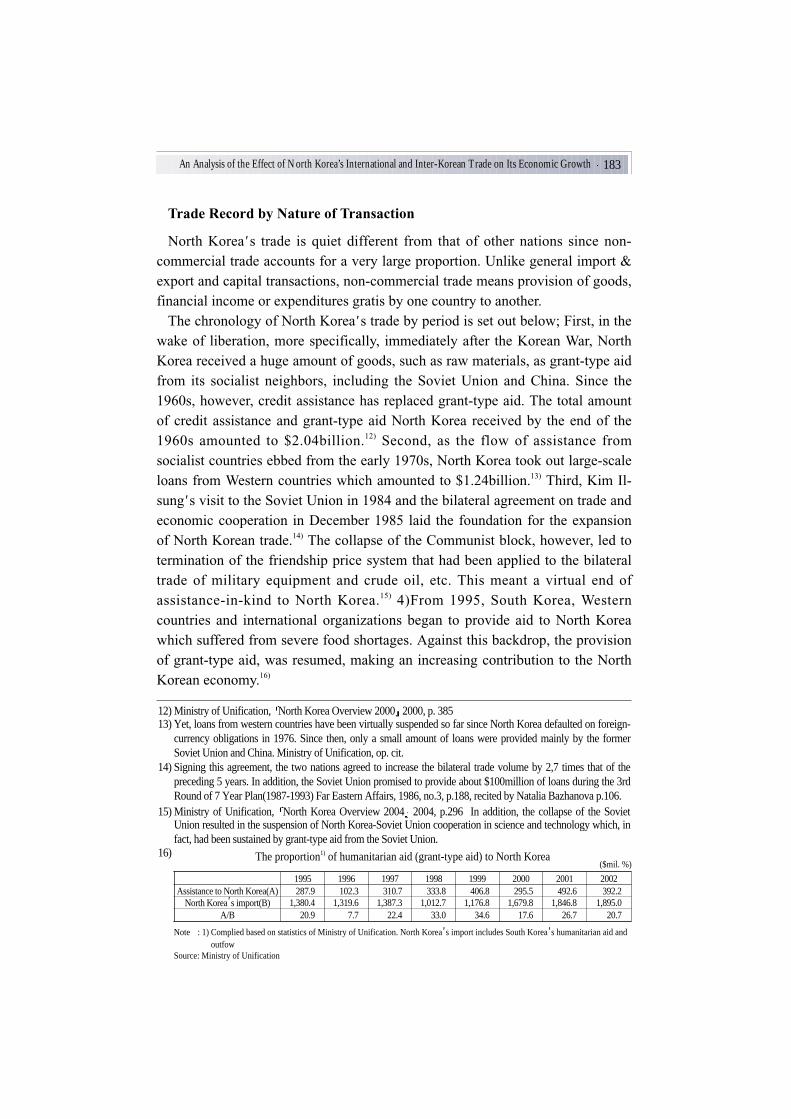
16) The proportion1) of humanitarian aid (grant-type aid) to North Korea
1995 1996 1997 1998 1999 2000 2001 2002Assistance to North Korea(A) 287.9 102.3 310.7 333.8 406.8 295.5 492.6 392.2
North Korea' s import(B) 1,380.4 1,319.6 1,387.3 1,012.7 1,176.8 1,679.8 1,846.8 1,895.0A/B 20.9 7.7 22.4 33.0 34.6 17.6 26.7 20.7
($mil. %)
Notece: 1) Complied based on statistics of Ministry of Unification. North Korea' s import includes South Korea' s humanitarian aid andoutfow
Source: Ministry of Unification
184 Economic Papers Vol.8 No.1
Trade Records by Country
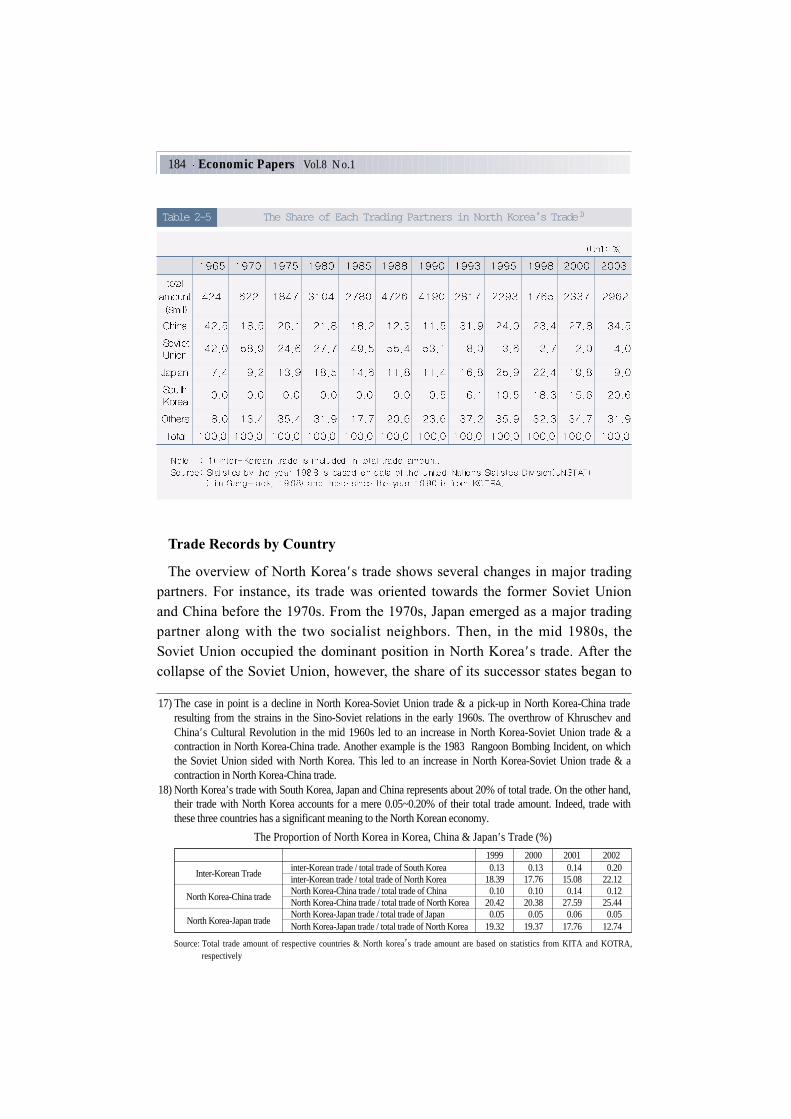
The overview of North Korea' s trade shows several changes in major trading
partners. For instance, its trade was oriented towards the former Soviet Union
and China before the 1970s. From the 1970s, Japan emerged as a major trading
partner along with the two socialist neighbors. Then, in the mid 1980s, the
Soviet Union occupied the dominant position in North Korea' s trade. After the
collapse of the Soviet Union, however, the share of its successor states began to
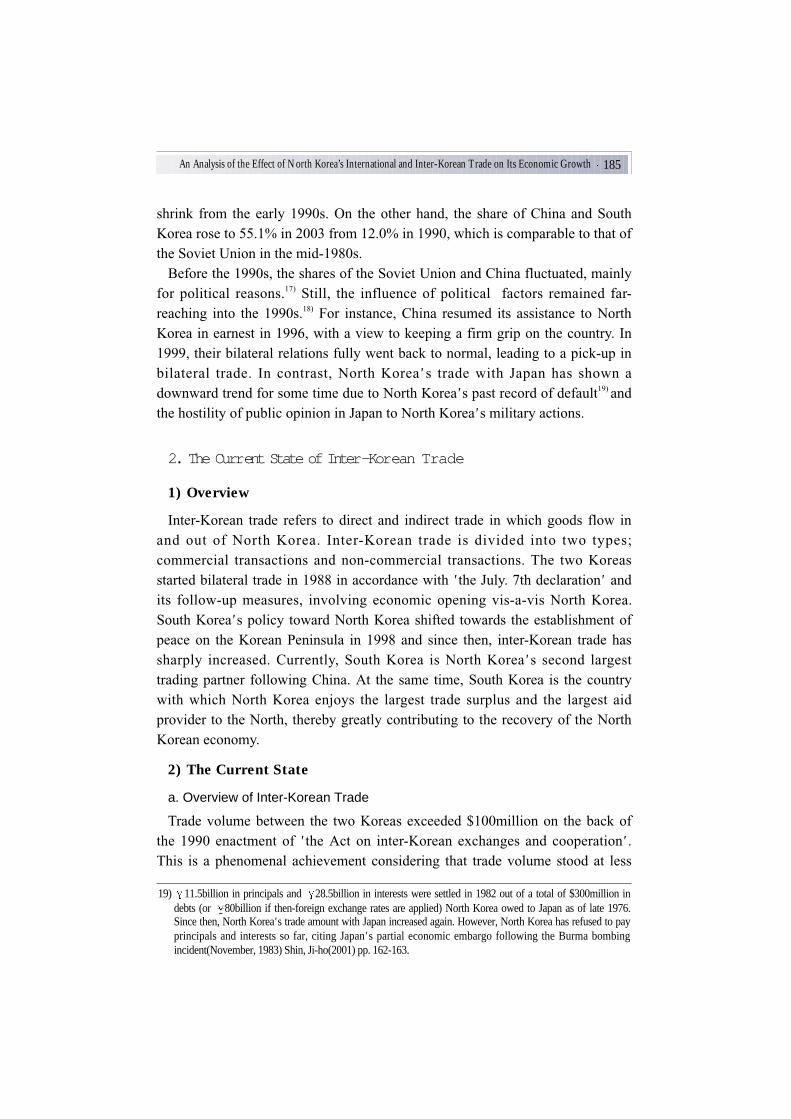
The Proportion of North Korea in Korea, China & Japan' s Trade (%)
1999 2000 2001 2002
Inter-Korean Tradeinter-Korean trade / total trade of South Korea 0.13 0.13 0.14 0.20inter-Korean trade / total trade of North Korea 18.39 17.76 15.08 22.12
North Korea-China tradeNorth Korea-China trade / total trade of China 0.10 0.10 0.14 0.12North Korea-China trade / total trade of North Korea 20.42 20.38 27.59 25.44
North Korea-Japan tradeNorth Korea-Japan trade / total trade of Japan 0.05 0.05 0.06 0.05North Korea-Japan trade / total trade of North Korea 19.32 19.37 17.76 12.74
Source: Total trade amount of respective countries & North korea' s trade amount are based on statistics from KITA and KOTRA,respectively
The Share of Each Trading Partners in North Korea's Trade1)Table 2-5
17) The case in point is a decline in North Korea-Soviet Union trade & a pick-up in North Korea-China traderesulting from the strains in the Sino-Soviet relations in the early 1960s. The overthrow of Khruschev andChina' s Cultural Revolution in the mid 1960s led to an increase in North Korea-Soviet Union trade & acontraction in North Korea-China trade. Another example is the 1983 Rangoon Bombing Incident, on whichthe Soviet Union sided with North Korea. This led to an increase in North Korea-Soviet Union trade & acontraction in North Korea-China trade.
18) North Korea' s trade with South Korea, Japan and China represents about 20% of total trade. On the other hand,their trade with North Korea accounts for a mere 0.05~0.20% of their total trade amount. Indeed, trade withthese three countries has a significant meaning to the North Korean economy.
An Analysis of the Effect of North Korea’s International and Inter-Korean Trade on Its Economic Growth 185
shrink from the early 1990s. On the other hand, the share of China and South
Korea rose to 55.1% in 2003 from 12.0% in 1990, which is comparable to that of
the Soviet Union in the mid-1980s.
Before the 1990s, the shares of the Soviet Union and China fluctuated, mainly
for political reasons.17)
Still, the influence of political factors remained far-
reaching into the 1990s.18)
For instance, China resumed its assistance to North
Korea in earnest in 1996, with a view to keeping a firm grip on the country. In
1999, their bilateral relations fully went back to normal, leading to a pick-up in
bilateral trade. In contrast, North Korea' s trade with Japan has shown a
downward trend for some time due to North Korea' s past record of default19)
and
the hostility of public opinion in Japan to North Korea' s military actions.
2. The Current State of Inter-Korean Trade
1) Overview
Inter-Korean trade refers to direct and indirect trade in which goods flow in
and out of North Korea. Inter-Korean trade is divided into two types;
commercial transactions and non-commercial transactions. The two Koreas
started bilateral trade in 1988 in accordance with ' the July. 7th declaration' and
its follow-up measures, involving economic opening vis-a-vis North Korea.
South Korea' s policy toward North Korea shifted towards the establishment of
peace on the Korean Peninsula in 1998 and since then, inter-Korean trade has
sharply increased. Currently, South Korea is North Korea' s second largest
trading partner following China. At the same time, South Korea is the country
with which North Korea enjoys the largest trade surplus and the largest aid
provider to the North, thereby greatly contributing to the recovery of the North
Korean economy.
2) The Current State
a. Overview of Inter-Korean Trade
Trade volume between the two Koreas exceeded $100million on the back of
the 1990 enactment of ' the Act on inter-Korean exchanges and cooperation' .
This is a phenomenal achievement considering that trade volume stood at less
19) 11.5billion in principals and 28.5billion in interests were settled in 1982 out of a total of $300million indebts (or 80billion if then-foreign exchange rates are applied) North Korea owed to Japan as of late 1976.Since then, North Korea' s trade amount with Japan increased again. However, North Korea has refused to payprincipals and interests so far, citing Japan' s partial economic embargo following the Burma bombingincident(November, 1983) Shin, Ji-ho(2001) pp. 162-163.
186 Economic Papers Vol.8 No.1
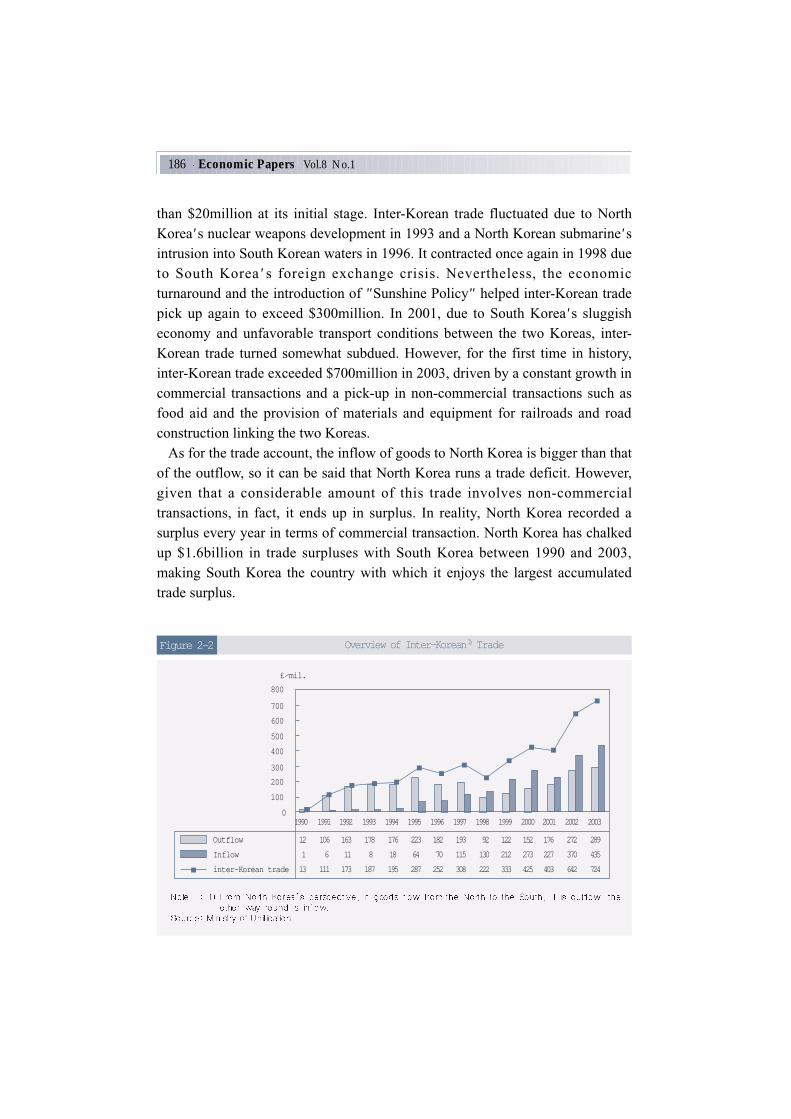
than $20million at its initial stage. Inter-Korean trade fluctuated due to North
Korea' s nuclear weapons development in 1993 and a North Korean submarine' s
intrusion into South Korean waters in 1996. It contracted once again in 1998 due
to South Korea ' s foreign exchange crisis. Nevertheless, the economic
turnaround and the introduction of " Sunshine Policy" helped inter-Korean trade
pick up again to exceed $300million. In 2001, due to South Korea' s sluggish
economy and unfavorable transport conditions between the two Koreas, inter-
Korean trade turned somewhat subdued. However, for the first time in history,
inter-Korean trade exceeded $700million in 2003, driven by a constant growth in
commercial transactions and a pick-up in non-commercial transactions such as
food aid and the provision of materials and equipment for railroads and road
construction linking the two Koreas.
As for the trade account, the inflow of goods to North Korea is bigger than that
of the outflow, so it can be said that North Korea runs a trade deficit. However,
given that a considerable amount of this trade involves non-commercial
transactions, in fact, it ends up in surplus. In reality, North Korea recorded a
surplus every year in terms of commercial transaction. North Korea has chalked
up $1.6billion in trade surpluses with South Korea between 1990 and 2003,
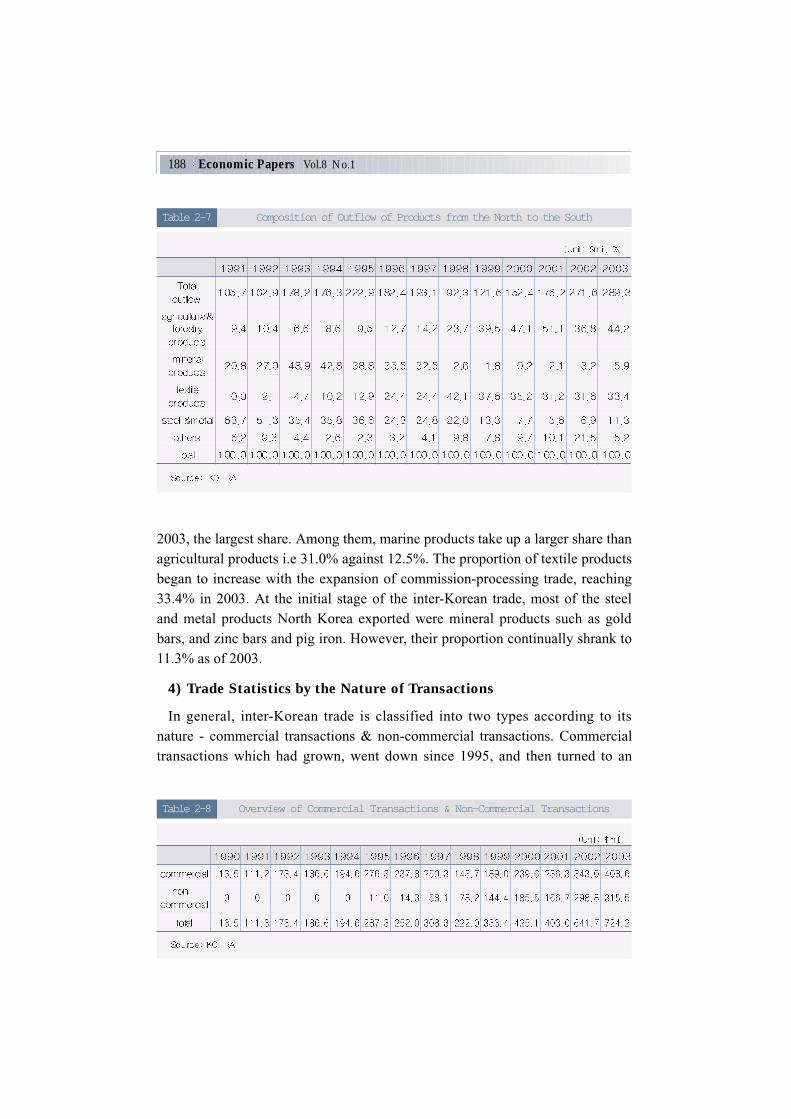
making South Korea the country with which it enjoys the largest accumulated
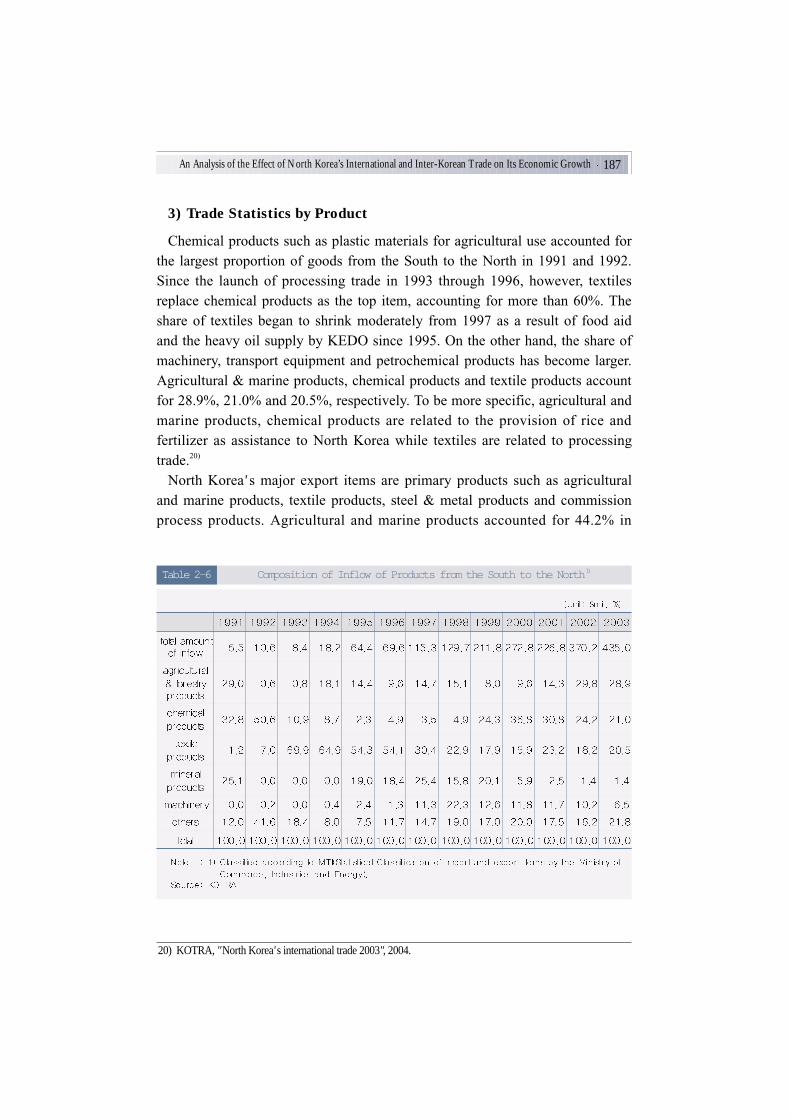
transactions which had grown, went down since 1995, and then turned to an
Composition of Outflow of Products from the North to the SouthTable 2-7
Overview of Commercial Transactions & Non-Commercial TransactionsTable 2-8
An Analysis of the Effect of North Korea’s International and Inter-Korean Trade on Its Economic Growth 189
increase again after 1998. Beginning in 1995, non-commercial transactions have
been constantly on the rise, with their proportion approaching that of
commercial transactions recently.
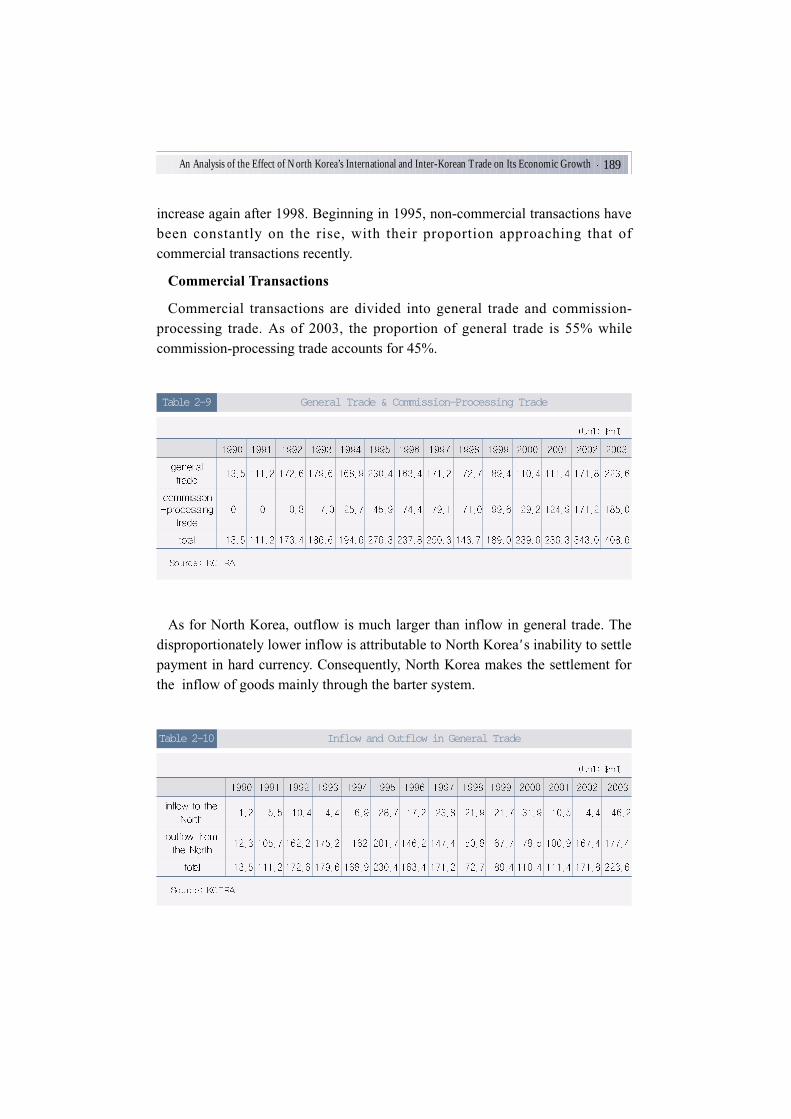
Commercial Transactions
Commercial transactions are divided into general trade and commission-
processing trade. As of 2003, the proportion of general trade is 55% while
commission-processing trade accounts for 45%.
As for North Korea, outflow is much larger than inflow in general trade. The
disproportionately lower inflow is attributable to North Korea' s inability to settle
payment in hard currency. Consequently, North Korea makes the settlement for
the inflow of goods mainly through the barter system.
General Trade & Commission-Processing TradeTable 2-9
Inflow and Outflow in General TradeTable 2-10
190 Economic Papers Vol.8 No.1
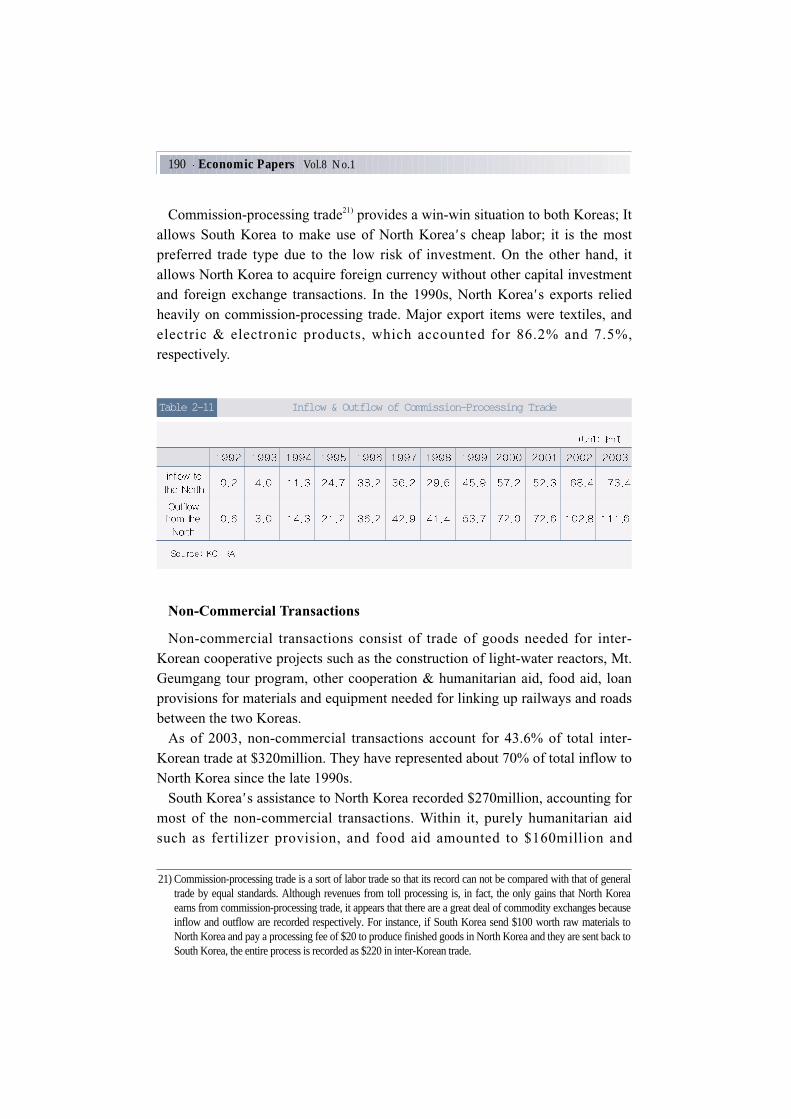
Commission-processing trade21)
provides a win-win situation to both Koreas; It
allows South Korea to make use of North Korea' s cheap labor; it is the most
preferred trade type due to the low risk of investment. On the other hand, it
allows North Korea to acquire foreign currency without other capital investment
and foreign exchange transactions. In the 1990s, North Korea' s exports relied
heavily on commission-processing trade. Major export items were textiles, and
electric & electronic products, which accounted for 86.2% and 7.5%,
respectively.
Non-Commercial Transactions
Non-commercial transactions consist of trade of goods needed for inter-
Korean cooperative projects such as the construction of light-water reactors, Mt.
Geumgang tour program, other cooperation & humanitarian aid, food aid, loan
provisions for materials and equipment needed for linking up railways and roads
between the two Koreas.
As of 2003, non-commercial transactions account for 43.6% of total inter-
Korean trade at $320million. They have represented about 70% of total inflow to
North Korea since the late 1990s.
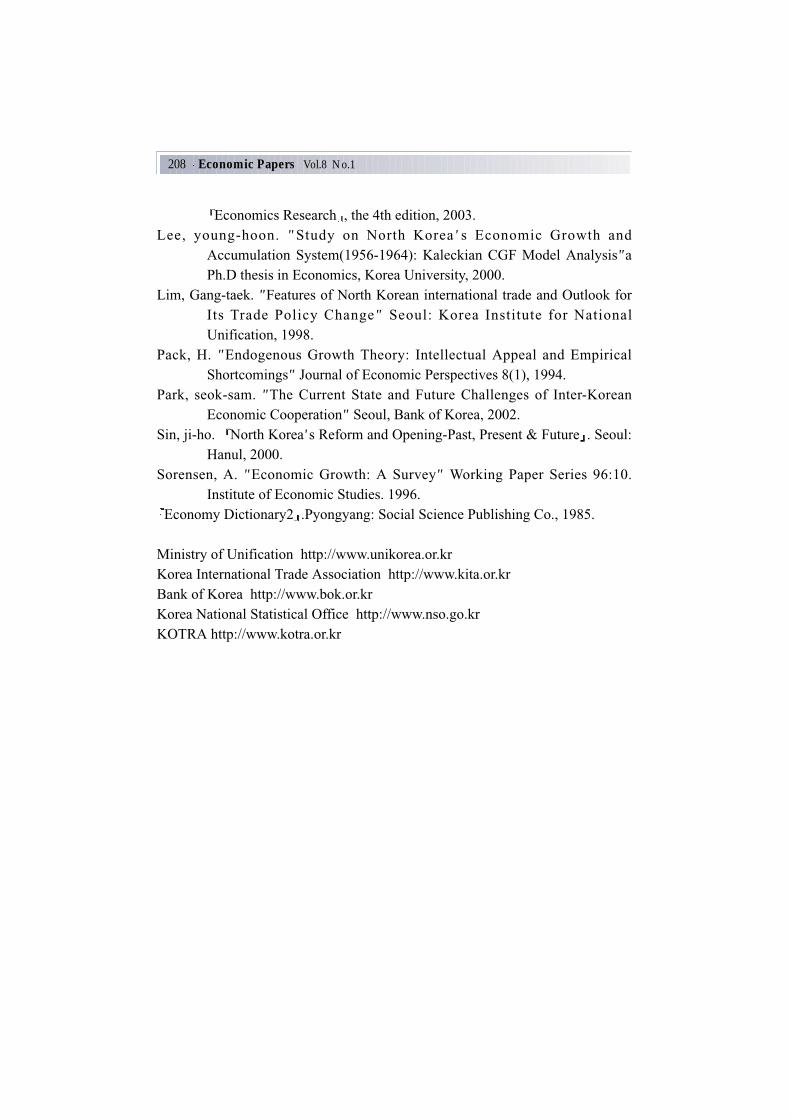
South Korea' s assistance to North Korea recorded $270million, accounting for
most of the non-commercial transactions. Within it, purely humanitarian aid
such as fertilizer provision, and food aid amounted to $160million and
21) Commission-processing trade is a sort of labor trade so that its record can not be compared with that of generaltrade by equal standards. Although revenues from toll processing is, in fact, the only gains that North Koreaearns from commission-processing trade, it appears that there are a great deal of commodity exchanges becauseinflow and outflow are recorded respectively. For instance, if South Korea send $100 worth raw materials toNorth Korea and pay a processing fee of $20 to produce finished goods in North Korea and they are sent back toSouth Korea, the entire process is recorded as $220 in inter-Korean trade.
Inflow & Outflow of Commission-Processing TradeTable 2-11
An Analysis of the Effect of North Korea’s International and Inter-Korean Trade on Its Economic Growth 191
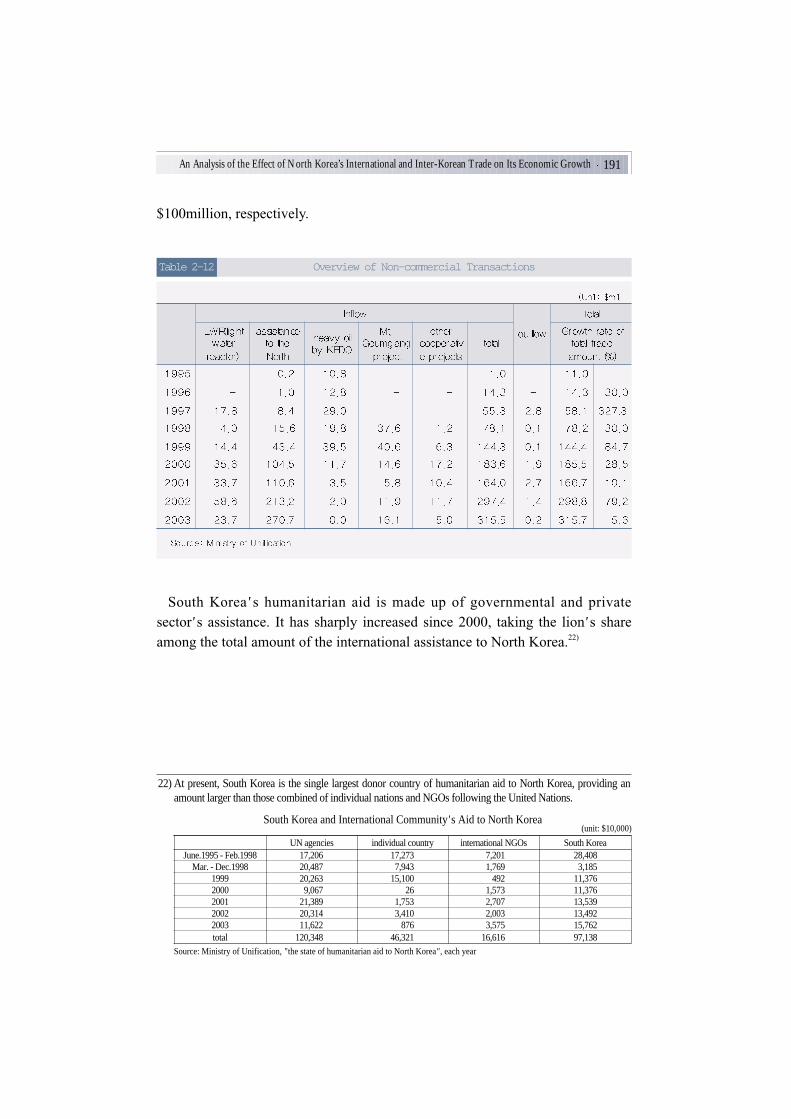
$100million, respectively.
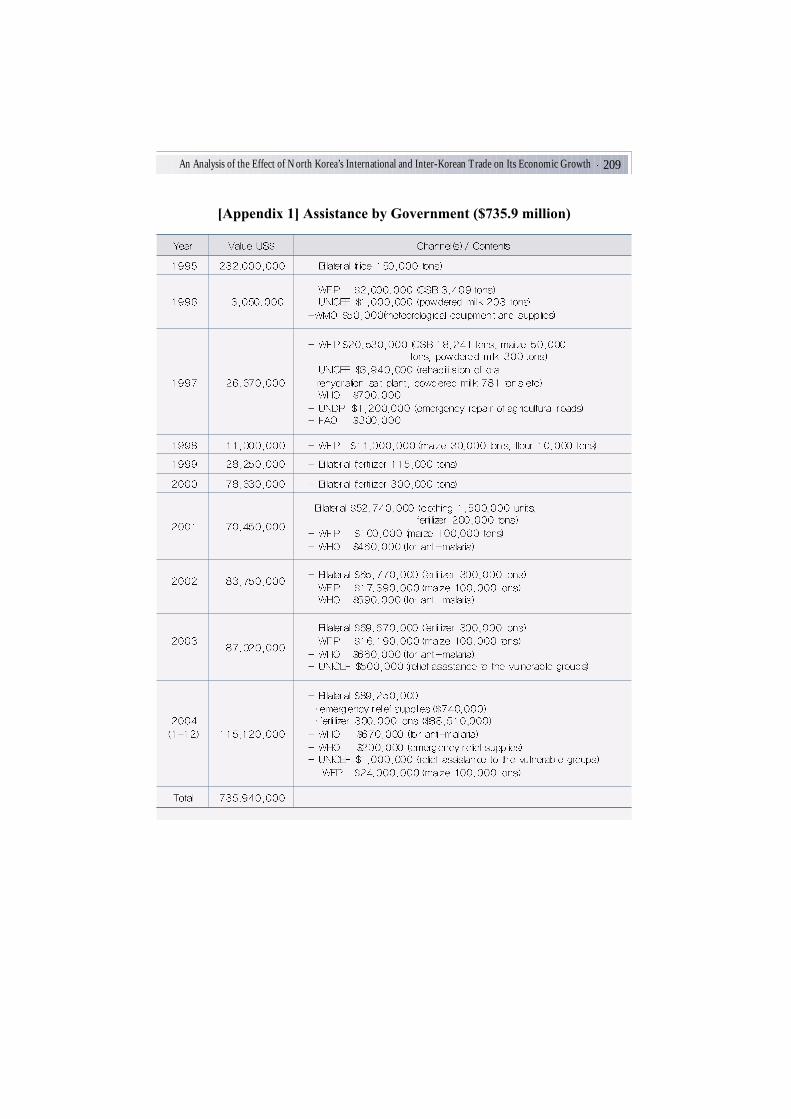
South Korea' s humanitarian aid is made up of governmental and private
sector' s assistance. It has sharply increased since 2000, taking the lion' s share
among the total amount of the international assistance to North Korea.22)
22) At present, South Korea is the single largest donor country of humanitarian aid to North Korea, providing anamount larger than those combined of individual nations and NGOs following the United Nations.
South Korea and International Community' s Aid to North Korea
UN agencies individual country international NGOs South KoreaJune.1995 - Feb.1998 17,206 17,273 7,201 28,408
Source: Ministry of Unification, " the state of humanitarian aid to North Korea" , each year
Overview of Non-commercial TransactionsTable 2-12
192 Economic Papers Vol.8 No.1
3. Comparison Between International Trade and Inter-KoreanTrade
We can draw the following conclusions from the statistics and analysis of
North Korea' s trade and inter-Korean trade mentioned above:
First, North Korea' s trade has been so far directed by the policy for the
construction of a self-supporting national economy which pursues inner-directed
and import-substitute development. Accordingly, imports were allowed only for
a minimum amount of producer' s goods while exports were used as a means to
earn foreign currency. Specifically, in the composition of North Korea' s import
& export items, factors of production such as machinery, transport equipment,
resources and other raw materials dominate the import list while the share of
consumers' goods is very low.
The export list mainly consists of primary products such as non-steel metals,
textile and marine products, and commission-processing products. Due to North
Korea' s economic hardships since the 1990s, an increasing amount of grain as
assistance and textile raw materials for process-on-commission have been
imported while exports of non-steel metals have fallen. Exports of textile and
marine products have been on the rise.
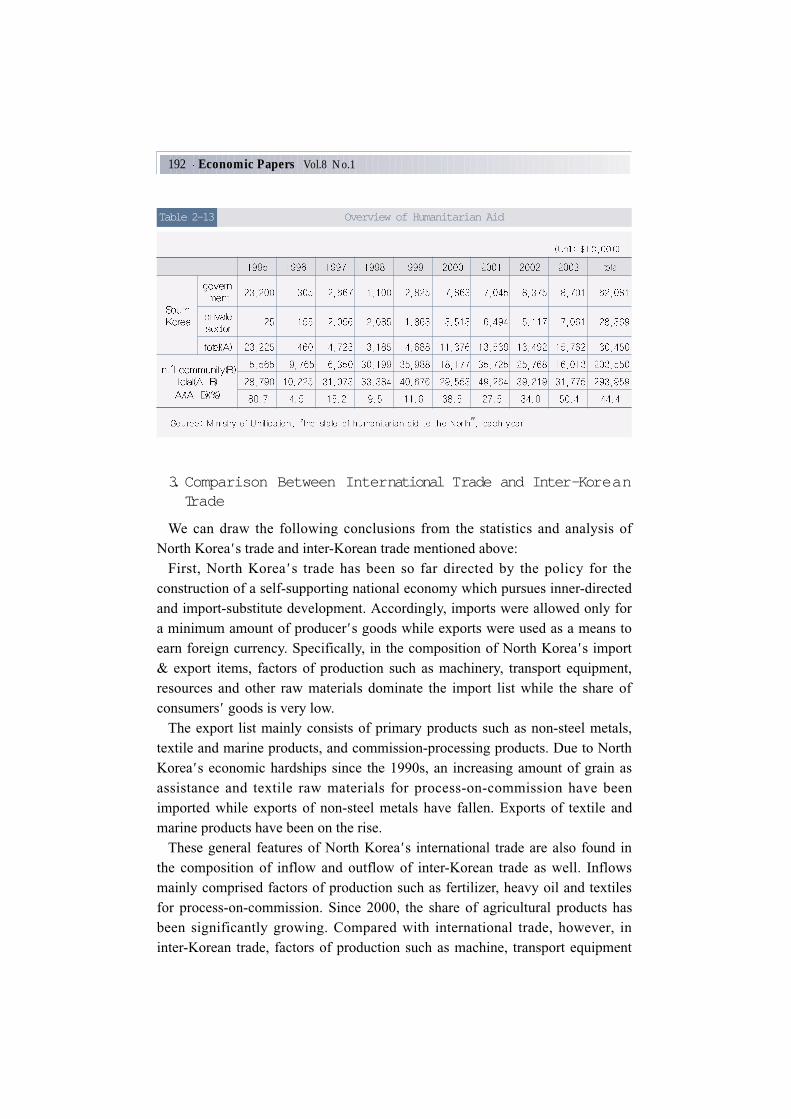
These general features of North Korea' s international trade are also found in
the composition of inflow and outflow of inter-Korean trade as well. Inflows
mainly comprised factors of production such as fertilizer, heavy oil and textiles
for process-on-commission. Since 2000, the share of agricultural products has
been significantly growing. Compared with international trade, however, in
inter-Korean trade, factors of production such as machine, transport equipment
Overview of Humanitarian Aid
"
Table 2-13
An Analysis of the Effect of North Korea’s International and Inter-Korean Trade on Its Economic Growth 193
and raw materials make up a small share while agricultural products account for
a relatively larger share of imports. Initially, outflows were mainly comprised of
steel and metal, but the share of textile and marine products has gradually been
increasing in total outflow.
Second, North Korea' s trade has developed based on the principle of politico-
economical linkage that political purposes precede economic purposes. This is
clearly demonstrated in the fluctuation of its trade with socialist countries seen
before the 1990s. However, countries with which North Korea can trade for
political purposes no longer exist since the collapse of the communist block in
the 1990s. Nevertheless, political reasons still have considerable influence upon
its international trade. This is not North Korea' s own intention, but a reflection
of the political interests of its neighboring countries, including China, which
want to strengthen their political and military influence over North Korea.
On the same note, inter-Korean trade is vulnerable to non-economic factors as
well as economic ones mainly due to the territorial division of the Korean
peninsula. North Korea pursued economic interests more while South Korea
placed priority on improving inter-Korean relations, eventually establishing
peace for the Korean peninsula. Despite their different perspectives, both sides
were able to meet halfway following the introduction of " Sunshine Policy"
towards North Korea. This has led to a sharp increase in inter-Korean trade since
1998 and South Korea has emerged as the North' s second largest trade partner
since 2002, following China.
Third, the significantly large share of non-commercial transactions shows the
strong political nature of North Korea' s trade. Since the nation' s liberation from
Japanese colonial rule, North Korea has heavily relied upon non-commercial
transactions receiving grant-type aid & socialist countries' loan provision aiming
at helping the North in its economic hardships and applying the friendship price
system. Since it opened its door to aid from the international community in
1995, the share of grant-type aid has grown again.
Non-commercial transactions account for about 70% of total inflow from
South Korea in inter-Korean trade, which is much greater than that with other
countries. South Korea is the single largest donor of humanitarian aid to North
Korea in the world. In general, South Korea provides fertilizer and food to the
North in the form of grant or loans and the amount has sharply increased since
the mid 1990s.
Fourth, North Korea has always run a trade deficit except in 1978 and 1979.
Its trade deficits have snowballed to the extent that imports are nearly twice
exports. This has brought North Korea to the verge of a foreign exchange crisis.
194 Economic Papers Vol.8 No.1
North Korea runs a trade deficit in inter-Korean trade, half of which consists
of non-commercial transactions. When it comes to commercial transactions
which involves foreign exchange transactions, however, it runs a trade surplus
every year. Between 1990 and 2003, North Korea recorded a $1.6billion trade
surplus with South Korea, the largest surplus. On general trade, North Korea has
recorded a bigger surplus with South Korea than any other country. Moreover,
South Korea has recently outstripped Japan in commission-processing trade on
which North Korea has concentrated its efforts since the 1990s.
To sum up, inter-Korean trade shows the bigger share of non-commercial
transactions, compared with trade with other countries. In addition, inter-Korean
trade is the largest source of foreign currency among commercial transactions to
North Korea so that currently it is the most helpful to the North Korean
economy.
III. Analysis of International and Inter-Korean Trade' sEffects on Economic Growth
1. Overview
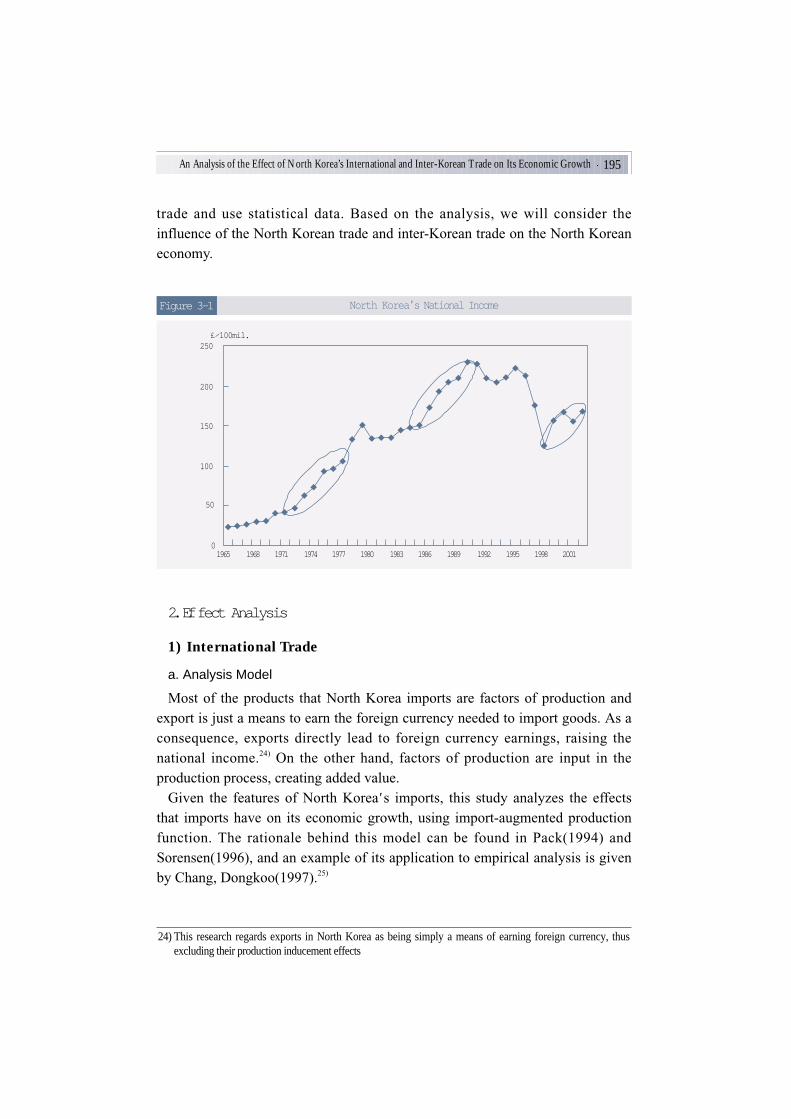
North Korea' s trade dependency was around 20% until the turn of the 1990s
and since then the figure has dropped to around the 10% level. Nevertheless, the
national income grew when trade volume, especially the flow of aid to North
Korea, grew: in the mid to late 1950s when assistance from socialists countries
including the Soviet Union was concentrated23)
; in the early 1970s when imports
and loans from advanced Western countries were concentrated; in the late 1980s
when non-commercial transactions increased sharply due to loan provision by
the Soviet Union and the friendship price system, and notably since the late
1990s when the inter-Korean economic cooperations began in earnest and the
international community began providing foreign aid.
In this regard, this study provides an empirical analysis of the effects of
international and inter-Korean trade on North Korea' s economic growth. To that
end, it is necessary to develop a model that reflects the features of North Korean
23) Owing to the national income statistics based on dollar-denominated standards for the 1950s, [Figure3-1] doesnot include statistics prior to 1965, According to North Korea' s report, however, North Korea' s annual averagegrowth rate was 30.1% between 1954 and 1956, 21.0% between 1957 and 1960, and 9.9% between 1961 and1965. Chung-Ang Nyun-Gam(North Korea' s Central Annual Report) each year
An Analysis of the Effect of North Korea’s International and Inter-Korean Trade on Its Economic Growth 195
trade and use statistical data. Based on the analysis, we will consider the
influence of the North Korean trade and inter-Korean trade on the North Korean
economy.
2. Effect Analysis
1) International Trade
a. Analysis Model
Most of the products that North Korea imports are factors of production and
export is just a means to earn the foreign currency needed to import goods. As a
consequence, exports directly lead to foreign currency earnings, raising the
national income.24)
On the other hand, factors of production are input in the
production process, creating added value.
Given the features of North Korea' s imports, this study analyzes the effects
that imports have on its economic growth, using import-augmented production
function. The rationale behind this model can be found in Pack(1994) and
Sorensen(1996), and an example of its application to empirical analysis is given
by Chang, Dongkoo(1997).25)
24) This research regards exports in North Korea as being simply a means of earning foreign currency, thusexcluding their production inducement effects
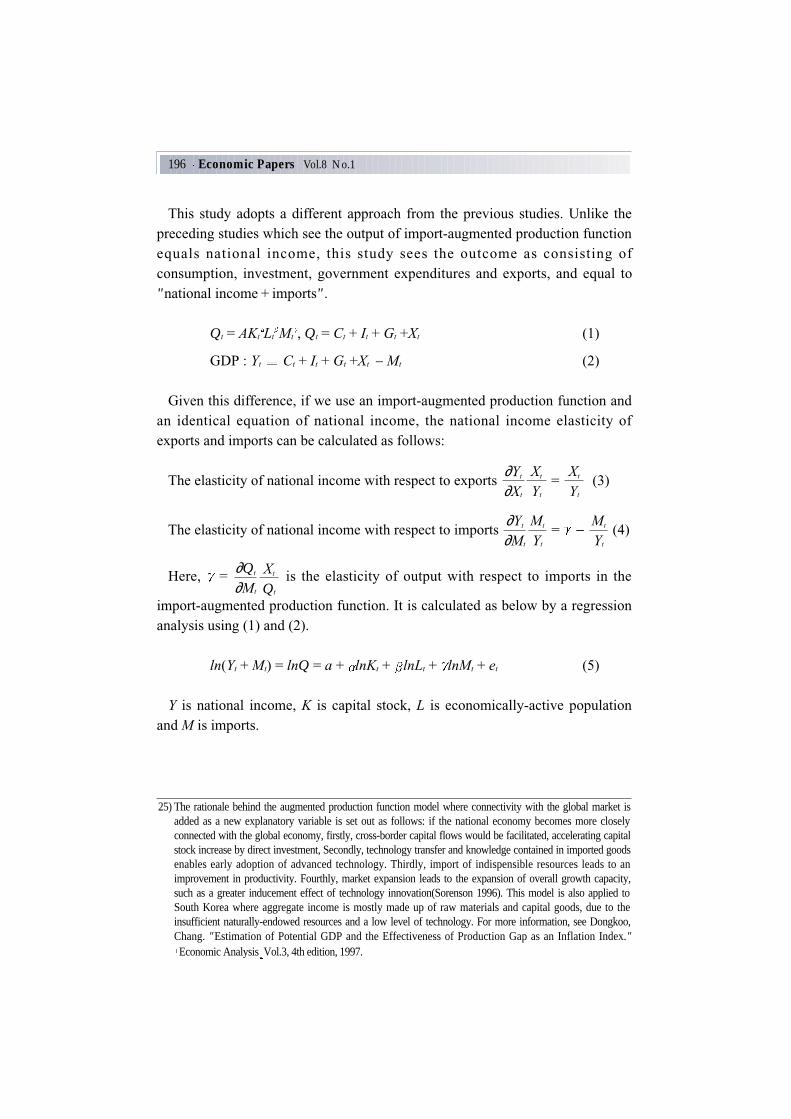
This study adopts a different approach from the previous studies. Unlike the
preceding studies which see the output of import-augmented production function
equals national income, this study sees the outcome as consisting of
consumption, investment, government expenditures and exports, and equal to
" national income + imports" .
Qt = AKt Lt Mt , Qt = Ct + It + Gt +Xt (1)
GDP : Yt Ct + It + Gt +Xt Mt (2)
Given this difference, if we use an import-augmented production function and
an identical equation of national income, the national income elasticity of
exports and imports can be calculated as follows:
The elasticity of national income with respect to exports = (3)
The elasticity of national income with respect to imports = (4)
Here, = is the elasticity of output with respect to imports in the
import-augmented production function. It is calculated as below by a regression
analysis using (1) and (2).
ln(Yt + Mt) = lnQ = a + lnKt + lnLt + lnMt + et (5)
Y is national income, K is capital stock, L is economically-active population
and M is imports.
Xt
Qt
∂Qt
∂Mt
Mt
Yt
Mt
Yt
∂Yt
∂Mt
Xt
Yt
Xt
Yt
∂Yt
∂Xt
25) The rationale behind the augmented production function model where connectivity with the global market isadded as a new explanatory variable is set out as follows: if the national economy becomes more closelyconnected with the global economy, firstly, cross-border capital flows would be facilitated, accelerating capitalstock increase by direct investment, Secondly, technology transfer and knowledge contained in imported goodsenables early adoption of advanced technology. Thirdly, import of indispensible resources leads to animprovement in productivity. Fourthly, market expansion leads to the expansion of overall growth capacity,such as a greater inducement effect of technology innovation(Sorenson 1996). This model is also applied toSouth Korea where aggregate income is mostly made up of raw materials and capital goods, due to theinsufficient naturally-endowed resources and a low level of technology. For more information, see Dongkoo,Chang. " Estimation of Potential GDP and the Effectiveness of Production Gap as an Inflation Index."Economic Analysis Vol.3, 4th edition, 1997.
An Analysis of the Effect of North Korea’s International and Inter-Korean Trade on Its Economic Growth 197
b. Data
Data used in this study include North Korea' s GDP, exports & imports, the
national economy expense26)
, and the economically-active population. This
analysis focuses on the period between 1965 and 2002. Sources cited in this
study are South and North Korean Economic Index Guide (1995) published
by Korea Institute for National Unification(KINU), North Korean Economic
Index (1996) published by KDI, " Features of North Korean International Trade
and Outlook for Its Trade Policy Change" (1998) published by Lim Gang-taek
and on-line data of the Bank of Korea, the Ministry of Unification and KOTRA.
However, since data on capital stock were not available, ' basic construction
investment' 27), which is equivalent to investment in North Korea, was used in the
calculation, instead. This study estimates annual capital stock on the assumption
that depreciation rates are 5%, using capital stock of 1954 and annual basic
construction investment which were estimated on the basis of research of Kim,
Seok-jin(2000).28)
Where capital stock and investment are K and I respectively,
and depreciation rate is , the capital stock of the period t is written as follows:
Kt = It + (1 )Kt 1
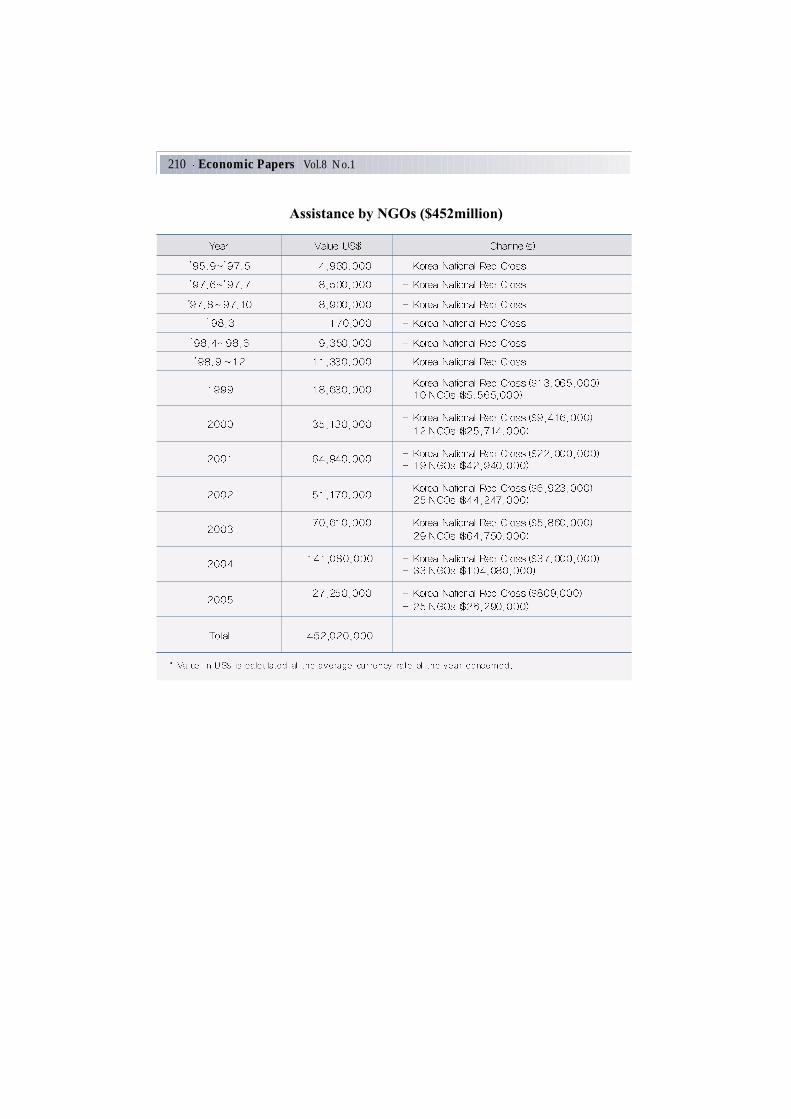
However, the national economy expense, which is needed to estimate North
Korea' s basic construction investment, was not released between 1995 and 1999,
and thus, we estimated the national economy expense for this period using the
methods devised by Kaplan- Moorsteen29)
.
As a result of the regression analysis of level(trans-log) variables, the
relationship between labor and output was negative30)
, and more significantly, the
t value turned out very low. Therefore, we conducted the regression analysis by
using per-capita variables of the economically-active population.
26) The national economy expense refers to capital spent for the national economy, consisting of basic constructioninvestment, circulating fund, large-scale repairing work fund and etc. Economics Dictionary 2 p,683.
27) Basic construction investment is a part of the national economy price referring to capital expenditures for newlybuilding or expanding a fixed asset. Economics Dictionary p.279
28) The 1954 capital stock was calculated on the assumption that capital coefficient is 0.7 and depreciation rate is0.05 as of 1954. Basic construction investment for the period when the figure was not released, was estimatedbased on the assumption which reflects then conditions. For example, basic construction investment since 1977was calculated based on the assumption that it accounts for 50% of the national economy expense and militaryexpenditures. For more information, see " The growth and crisis of the North Korean economy" Kim, seok-jin, aPh.D thesis in Economics at Seoul National University. 2002.
29) see [Appendix 2]30) It seems that the negative relationship between labor and national income reflects specificity of North Korean
labor structure, i.e. overemployment resulting from the full employment policy.
198 Economic Papers Vol.8 No.1
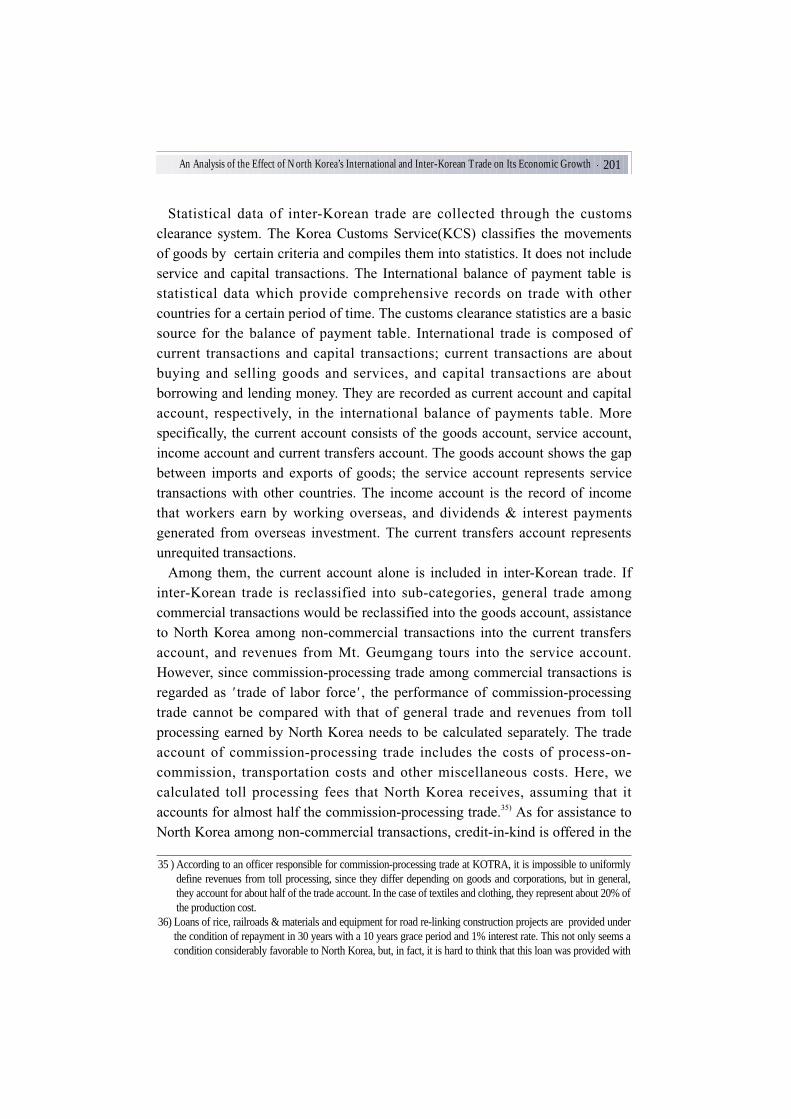
Moreover, each of these variables are unstable time series with unit roots.31)
Yet, overall, there exists co-integration among level variables(trans-log)32)
thus,
we used the level variables in the regression analysis.
c. The Result of the Analysis
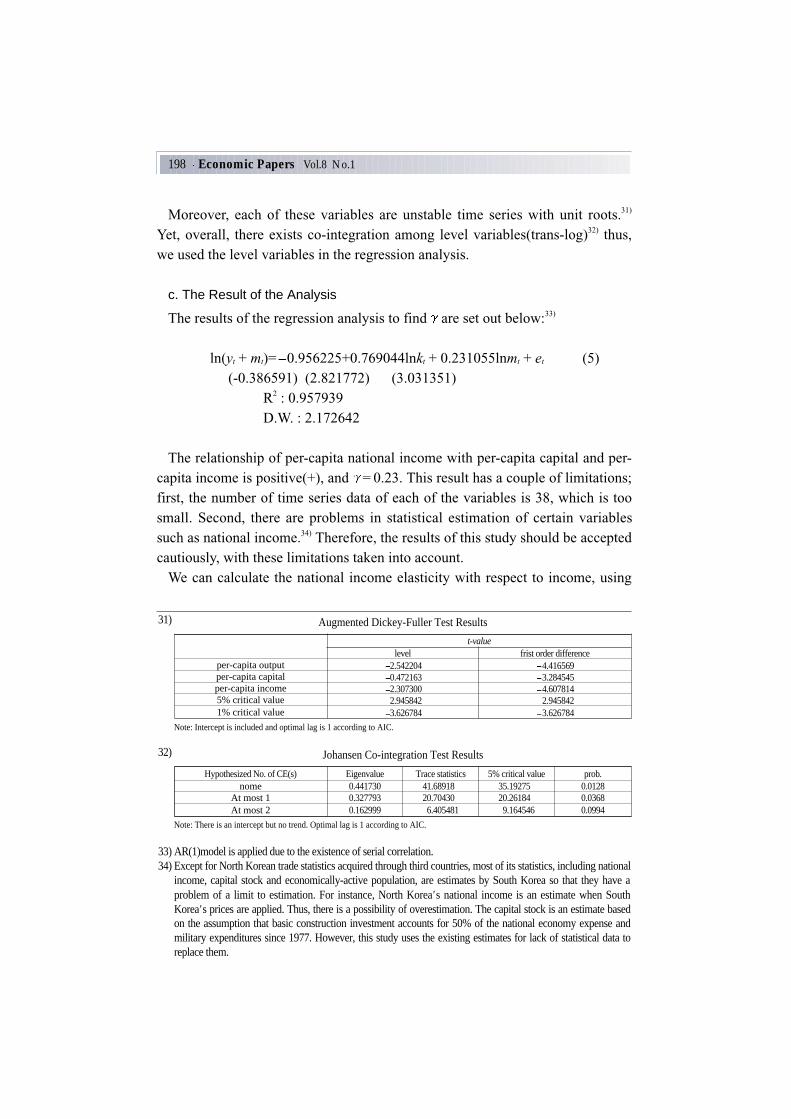
The results of the regression analysis to find are set out below:33)
ln(yt + mt)= 0.956225+0.769044lnkt + 0.231055lnmt + et (5)
(-0.386591) (2.821772) (3.031351)
R2
: 0.957939
D.W. : 2.172642
The relationship of per-capita national income with per-capita capital and per-
capita income is positive(+), and = 0.23. This result has a couple of limitations;
first, the number of time series data of each of the variables is 38, which is too
small. Second, there are problems in statistical estimation of certain variables
such as national income.34)
Therefore, the results of this study should be accepted
cautiously, with these limitations taken into account.
We can calculate the national income elasticity with respect to income, using
33) AR(1)model is applied due to the existence of serial correlation.34) Except for North Korean trade statistics acquired through third countries, most of its statistics, including national
income, capital stock and economically-active population, are estimates by South Korea so that they have aproblem of a limit to estimation. For instance, North Korea' s national income is an estimate when SouthKorea' s prices are applied. Thus, there is a possibility of overestimation. The capital stock is an estimate basedon the assumption that basic construction investment accounts for 50% of the national economy expense andmilitary expenditures since 1977. However, this study uses the existing estimates for lack of statistical data toreplace them.
31) Augmented Dickey-Fuller Test Results
t-valuelevel frist order difference
per-capita output 2.542204 4.416569per-capita capital 0.472163 3.284545per-capita income 2.307300 4.6078145% critical value 2.945842 2.9458421% critical value 3.626784 3.626784
Note: Intercept is included and optimal lag is 1 according to AIC.
32) Johansen Co-integration Test Results
Hypothesized No. of CE(s) Eigenvalue Trace statistics 5% critical value prob.nome 0.441730 41.689181 35.192751 0.0128
At most 1 0.327793 20.704301 20.261841 0.0368At most 2 0.162999 16.405481 19.164546 0.0994
Note: There is an intercept but no trend. Optimal lag is 1 according to AIC.
An Analysis of the Effect of North Korea’s International and Inter-Korean Trade on Its Economic Growth 199
the result of the analysis. From the expression(4), it is (0.23 )%. Now we
can calculate the national income elasticity with respect to exports and imports,
using statistics of exports, imports and national income of each given year. The
results are presented in the following table:
According to [Table 3-1], national income elasticity with respect to exports is
0.04 from 1990 through 2003 while national income elasticity with respect to
imports is 0.15, almost three times larger than that of exports.
Mt
Yt
National Income Elasticity with Respect to Exports and ImportsTable 3-1
Xt
Yt
Mt
Yt
Effect of North Korea’s Trade on Its Economic GrowthTable 3-2
( )
∂Yt
Yt
∂Yt
Yt
Xt
Yt
∂Yt
Yt
∂Mt
Mt
Mt
Yt
200 Economic Papers Vol.8 No.1
Now let us estimate the effect of exports & imports on national income, using
the elasticity. It is affected by the elasticity and growth rates of exports and
imports. The effect of exports on economic growth and that of imports can be
calculated by = (3) and = (4), respectively. The
results are presented in [Table 3-2].
According to [Table 3-2], the annual average growth rate by trade is a negative
2.1%(-2.1%) during the period between 1990 and 1998 when the North Korean
economy suffered a downturn. This figure is more than half of negative 3.8%,
the annual average growth rate estimated by the BOK. On the other hand, the
annual average growth rate by trade is 2.4%, which is close to the 2.8% of the
BOK' s estimate.
The high contribution of international trade to North Korea' s economic growth
is attributable to low productivity stemming from its obsolete production
facilities, lack of energy and investment resources needed for plant operations,
and inherent problems of Socialist production systems. Moreover, it is concluded
that the greater effect of international trade on the economy during the recovery
phase than in the slowdown is also attributable to the fact that North Korea' s
internal economic problems, such as obsolete production facilities, have
worsened.
2) Inter-Korean Trade
The history of inter-Korean trade is short and its structure unique as general
trade accounts for merely one quarter of the total inter-Korean trade. Unlike in
other countries' trade with North Korea, about half of the inter-Korean trade
invloves non-commercial transactions, such as fertilizer and food provision.
Moreover, commission-processing trade accounts for almost half of commercial
transactions. Against this backdrop, it is inappropriate to use the same analytical
method used previously. Rather, we need to develop an analytical method that
can reveal the unique features of inter-Korean trade in detail.
To that end, this study first estimates North Korea' s national income growth
rates by inter-Korean trade, using the international balance of payment table, in
order to see the effect of inter-Korean trade on North Korea' s economic growth.
The international balance of payment table clearly shows the nature and
features of various transaction types in inter-Korea trade within a general
framework. Using the trade balance in the table, we can obtain national income
growth rates by inter-Korean trade.
Mt
Yt
Mt
Yt
∂Yt
∂Mt
Yt
Yt
Yt
Yt
∂Xt
∂Xt
An Analysis of the Effect of North Korea’s International and Inter-Korean Trade on Its Economic Growth 201
Statistical data of inter-Korean trade are collected through the customs
clearance system. The Korea Customs Service(KCS) classifies the movements
of goods by certain criteria and compiles them into statistics. It does not include
service and capital transactions. The International balance of payment table is
statistical data which provide comprehensive records on trade with other
countries for a certain period of time. The customs clearance statistics are a basic
source for the balance of payment table. International trade is composed of
current transactions and capital transactions; current transactions are about
buying and selling goods and services, and capital transactions are about
borrowing and lending money. They are recorded as current account and capital
account, respectively, in the international balance of payments table. More
specifically, the current account consists of the goods account, service account,
income account and current transfers account. The goods account shows the gap
between imports and exports of goods; the service account represents service
transactions with other countries. The income account is the record of income
that workers earn by working overseas, and dividends & interest payments
generated from overseas investment. The current transfers account represents
unrequited transactions.
Among them, the current account alone is included in inter-Korean trade. If
inter-Korean trade is reclassified into sub-categories, general trade among
commercial transactions would be reclassified into the goods account, assistance
to North Korea among non-commercial transactions into the current transfers
account, and revenues from Mt. Geumgang tours into the service account.
However, since commission-processing trade among commercial transactions is
regarded as ' trade of labor force' , the performance of commission-processing
trade cannot be compared with that of general trade and revenues from toll
processing earned by North Korea needs to be calculated separately. The trade
account of commission-processing trade includes the costs of process-on-
commission, transportation costs and other miscellaneous costs. Here, we
calculated toll processing fees that North Korea receives, assuming that it
accounts for almost half the commission-processing trade.35)
As for assistance to
North Korea among non-commercial transactions, credit-in-kind is offered in the
35 ) According to an officer responsible for commission-processing trade at KOTRA, it is impossible to uniformlydefine revenues from toll processing, since they differ depending on goods and corporations, but in general,they account for about half of the trade account. In the case of textiles and clothing, they represent about 20% ofthe production cost.
36) Loans of rice, railroads & materials and equipment for road re-linking construction projects are provided underthe condition of repayment in 30 years with a 10 years grace period and 1% interest rate. This not only seems acondition considerably favorable to North Korea, but, in fact, it is hard to think that this loan was provided with
202 Economic Papers Vol.8 No.1
form of loans but, in fact, they are close to grants.36)
Therefore, credit-in-kind is
classified into the current transfers account. Meanwhile, the trade of materials
for inter-Korean cooperative projects is excluded from North Korea' s national
income since it is the movements of materials to South Korean corporations
doing business in North Korea. [Table 3-3] includes North Korea' s trade account
broken down by inter-Korean trade.
The direct growth rates of North Korea' s income from inter-Korean trade are
calculated as " goods account + service account + commission-processing trade" .
The indirect growth rates are added values created by inputting assistance to
North Korea(non-commercial transactions) into production processes. Yet, it is
difficult to apply specific production functions to each factor of production in
the premise of North Korea' s repayment, considering North Korea' s dire economic conditions and the currentlevel of inter-Korean relations.
North Korea's Trade Account Broken Down by Inter-Korean Trade (as of 2003)
Table 3-3
An Analysis of the Effect of North Korea’s International and Inter-Korean Trade on Its Economic Growth 203
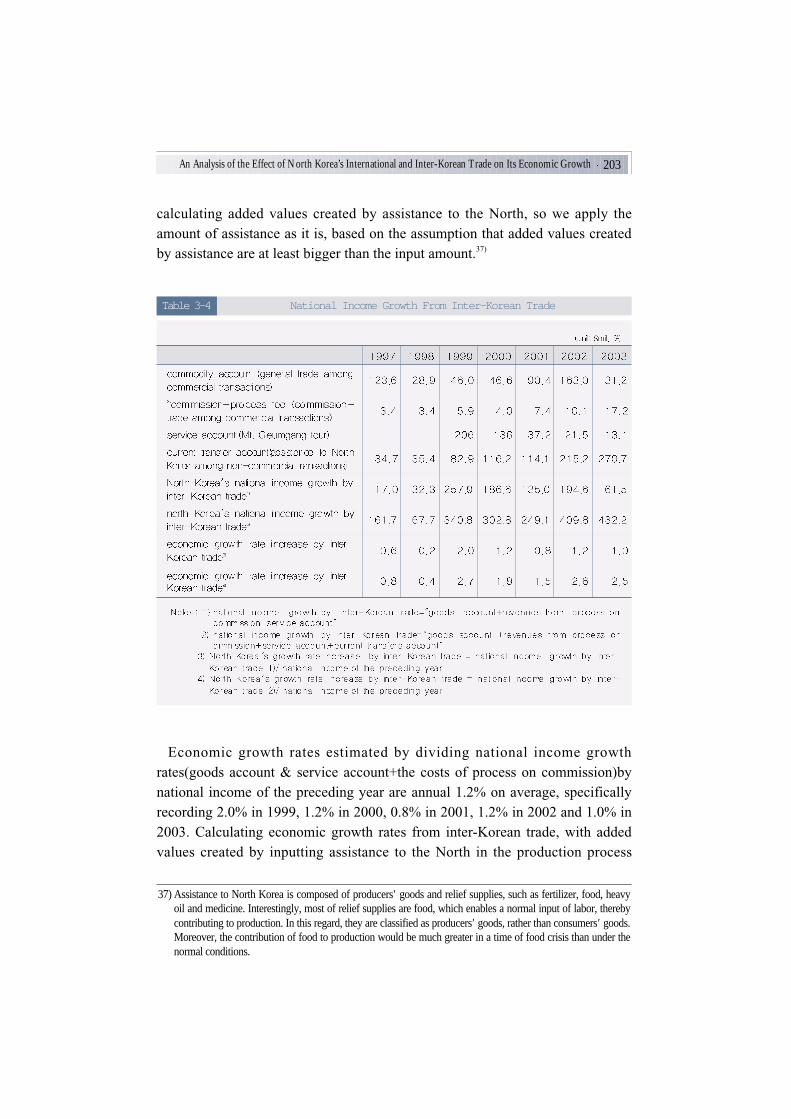
calculating added values created by assistance to the North, so we apply the
amount of assistance as it is, based on the assumption that added values created
by assistance are at least bigger than the input amount.37)
Economic growth rates estimated by dividing national income growth
rates(goods account & service account+the costs of process on commission)by
national income of the preceding year are annual 1.2% on average, specifically
recording 2.0% in 1999, 1.2% in 2000, 0.8% in 2001, 1.2% in 2002 and 1.0% in
2003. Calculating economic growth rates from inter-Korean trade, with added
values created by inputting assistance to the North in the production process
37) Assistance to North Korea is composed of producers' goods and relief supplies, such as fertilizer, food, heavyoil and medicine. Interestingly, most of relief supplies are food, which enables a normal input of labor, therebycontributing to production. In this regard, they are classified as producers' goods, rather than consumers' goods.Moreover, the contribution of food to production would be much greater in a time of food crisis than under thenormal conditions.
National Income Growth From Inter-Korean Trade Table 3-4
204 Economic Papers Vol.8 No.1
gives an annual average of 2.3%, specifically, 2.7% in 1999, 1.9% in 2000, 1.5%
in 2001, 2.6% in 2002 and 2.5% in 2003. since North Korea' s annual average
growth rate during the period between 1999 and 2003 stood at 2.8%, it may be
concluded that inter-Korean trade plays a very significant role in maintaining the
positive growth of the North Korean economy.
After the nine-years of negative growth in the 1990s, North Korea has posted
positive growth since 1999. Now it is evaluated as entering a the recovery phase.
And international trade(inter-Korean trade included) played a very critical role
to North Korea' s economic rebound. Annual average growth rate by inter-
Korean trade is about 1.2% and if added values created by assistance to the
North are included, it is around 2.3%. Given BOK' s estimate of 2.8% for the
same time frame, we can not exclude the possibility that the North Korean
economy would still post a negative growth without an increase in international
trade (inter-Korean trade included).38)
IV. Conclusions
We have so far analyzed the effects of North Korea' s international trade and
inter-Korean trade on its economic growth.
North Korea' s trade has been shaped by the policy for the construction of a
self-supporting national economy, an economic development strategy which
pursues an inner-directed and import-substitute development. Accordingly, most
imports are factors of production while exports are used as a means to earn
foreign currency which is needed to import goods and most of the imported
factors of production are machines, transport equipment and raw materials, with
a very small share of consumer goods.
In this study, we have used an ' import-augmented production function' and
national income elasticity with respect to imports and exports, to analyze the
effects of North Korea' s trade on its economic growth. The results of the
analysis may be summarized as follows: First, the effect of imports is three times
bigger than that of exports during the period from 1990 through 2003. This is
attributable to its import-oriented trade structure. Second, from 1990 through
1998 when North Korea suffered a downturn due to trade reduction, its annual
38) North Korea' s international trade and inter-Korean trade are quiet different in history and features so that wehave employed separate methodologies in analyzing their effects. Therefore, the results of the analysis should beviewed considering the difference in analytic methodologies.
An Analysis of the Effect of North Korea’s International and Inter-Korean Trade on Its Economic Growth 205
average growth rate was negative 2.1%(-2.1%), which represents more than half
of negative 3.8%(-3.8%), the figure estimated by BOK. On the other hand, from
1999 through 2003 when the North Korean economy rebounded backed by a
pick-up in trade, its annual average growth rate was 2.4%, which is very close to
2.8%, a figure estimated by BOK.
Inter-Korean trade, as national internal trade, increased sharply after the
introduction of " the Sunshine Policy" in 1998. South Korea has become North
Korea' s second largest trading partner, trailing only China, since 2002. Recently,
compared with that of other countries, the share of non-commercial transactions
has been very large in inter-Korean trade, accounting for half of the inter-Korean
trade and about 70% of total inflow into North Korea. In addition, North Korea
is running deficits in its trade with most countries while it enjoys its largest trade
surplus with South Korea. In a nutshell, inter-Korean trade is highly conducive
to the recovery of the North Korean economy.
We estimated the effects of inter-Korean trade on North Koreas' growth using
the international balance of payment table as follows: First, we divided the
growth rates of national income from inter-Korean trade(goods and service
account+revenues from process-on-commission) by the national income of the
preceding year, in order to calculate annual average growth rates between 1999
and 2003. The outcome was about 1.2%, and if added values created by
assistance to the North(current transfers account) are included, it is about 2.3%.
Given that North Korea' s annual average growth was 2.8% during the same
period of time, inter-Korean trade plays a very important role in maintaining the
positive growth. Considering that its annual average growth rate was 2.8%
between 1999 and 2003, North Korea would still have posted a negative growth
without this increase in international trade since 1999. Certainly, the results of
this study should be accepted cautiously since there are problems in the
statistical estimation of certain variables such as national income. In particular,
considering the high possibility that the estimated national income of North
Korea is an overestimation, we can conclude that the effect of North Korea' s
trade on its economic growth may be, in fact, much greater than this study has
estimated.
Based on these results, we can draw some implications for policies.
First, trade including inter-Korean trade has had a tremendous effect on the
recent economic rebound of North Korea. The high contribution of international
trade to North Korea' s economic growth is attributable to the low productivity
stemming from obsolete production facilities, lack of energy needed for plant
operations and investment resources, and inherent problems of the socialist
206 Economic Papers Vol.8 No.1
production system.
Second, as inter-Korean trade is growing steadily, the North Korean economy
is becoming more dependent upon South Korea. And its dependency is expected
to grow further through inter-Korean cooperative projects, such as the four major
inter-Korean agreements on economic cooperations, the construction of Geasung
industrial complex and the re-connection of North-South railways and roads.
Under these circumstances, even a temporary suspension of inter-Korean trade
would pose a serious threat to the North Korean economy.
Third, there is a limit in using trade including inter-Korean trade, as a major
driver of North Korea' s economic growth. First of all, as we can see from the
fact that North Korea ' s exports are led by maritime products, export
competitiveness of North Korean products is so low that it is very hard for them
to sharply grow, thereby causing hard currency shortages. This has set a limit to
importing produces' goods such as machines & facility, and raw materials. In
addition, North Korea runs deficits with most of its trading partners, apart from
that with South Korea. Therefore, hard currency shortages are worsening.
Moreover, inter-Korean trade is so greatly affected by political factors, such as
the North Korean nuclear issue, that there is a limit to expanding inter-Korean
trade.
Fourth, it is inevitable for North Korea to open its door to foreign capital and
technology which are indispensible to overcome the current economic hardships.
To attract foreign capital and technology, North Korea should change itself. The
longer the replacement and repair of production facilities is delayed, the more
rapidly these facilities deteriorate, lowering the possibility of economic recovery.
An Analysis of the Effect of North Korea’s International and Inter-Korean Trade on Its Economic Growth 207
References
Bazhanova, Natalia. translated by Yang, Jun-yong. Between dead dogmas and
practical requirements: the realities revealed through international
economic cooperation Seoul: the Korea Economic Daily, 1992.
Chang, Dongkoo. " Estimation of Potential GDP and Study on the Effectiveness
of Output Gap as an Inflation Indicator" Economic Analysis Vol. 3,
4th edition, 1997.
Cho, Myung-chul " Assessment of North Korea' s External Economic Policy of
10 years and its Challenges" Seoul, Korea Institute for International
Economic Policy, 2001.
Choi, Hae-bum. " Examination of Correlation between Export and Growth in
Korea" Collection of Economic Papers Vol.10, 1st edition, June, 2001.
Choi, Yo-chul. " Analysis of Relations between Korea' s Export and Growth"
Economic Analysis Vol.8, 3rd edition. Bank of Korea, 2002.
FAO/WFP. " Special Report: FAO/WEP Crop and Food Supply Assessment to
the Democratic Republic of Korea" October, 2003.
_______. " Special Report: FAO/WEP Crop and Food Supply Assessment
Mission to the Democratic People' s Republic of Korea" July, 2002.
Hyundai Asan. " Hyundai Asan Inter-Korean Economic Cooperation Projects"
July, 2004.
Kim, chul-hwan. " The Analysis of correlation between Korea' s export and
growth review"
Kim, chul-yong. " Understanding of export trade' s economic effectiveness in a
socialist society" , Economy Research , the 1st edition, 1999.
Kim, seok-jin. " Growth and Crisis of the North Korean Economy" a Ph.D thesis
in Economics, Seoul National University, 2002.
Korea Development Institute(KDI). North Korean Economic Index , 1996.
Korea Institute for National Unification(KINU). South and North Korean
Economic Index Guide , 1995.
Korea International Trade Association(KITA). " Survey on the state of
corporations
____________________________. " Results of Research on the state of North-