89

An Analysis of the First Destination of University Graduates
A report by the Higher Education Authority | January 2018
?WHAT DO GRADUATES DO
The Class of 2016

AcknowledgementsThe Higher Education Authority wishes to thank the staff of the following higher education institutions who carried out the First Destination Survey on their graduate cohorts and provided comprehensive datasets for this report:
Dublin City University
University of Limerick
Trinity College Dublin
University College Cork
University College Dublin
Maynooth University
National University of Ireland Galway
Dublin Institute of Technology
St Patrick’s College, Drumcondra
St Angela’s College Sligo
Mater Dei Institute of Education
This document is also available to download from the publications section of the HEA website.
ISBN 1-905135-59-9
For further information, please contact: Dr Miriam Liston (Data and Policy Analyst), Mr Victor Pigott (Senior Statistics Manager), Ms Denise Frawley and Dr Dawn Carroll (Data and Policy Analysts) at [email protected]
WH
AT DO
GR
AD
UATES D
O? TH
E CLASS O
F 2016
1

WH
AT D
O G
RA
DU
ATES
DO
? TH
E CL
ASS
OF
2016
2
ForewordThis edition of What Do Graduates Do? The Class of 2016 - An Analysis of the First Destination of University Graduates, is the 36th survey of graduates. The results of this survey are an important guide to graduate outcomes providing key information to a wide variety of stakeholders, including policy makers, academics, students and employers.
Over 18,200 students that graduated with level 8-10 qualifications in 2016 participated in this survey. Data was collected in March 2017 from these graduates to determine their situation nine months after graduation.
Employment rates for all graduates are up in 2017, with increases observed in both employment in Ireland and employment overseas. As expected, higher qualifications are associated with higher employment rates and often higher earning potential. Consistent with previous years, graduates in the Education field tend to fare best in terms of labour market outcomes. Many of these graduates emerge from Initial Teacher Education programmes and a large proportion are employed in Ireland. However, despite some improvements, such graduates find it difficult to secure permanent positions. Labour market outcomes for ICT graduates also continue to be favourable, with higher rates of employment and higher average salaries than most other graduates, nine months after graduation. ICT graduates also have the highest proportion of Honours Bachelor Degree graduates, and are amongst the highest proportion of Masters's and Doctorate graduates, employed in Ireland. This is in line with the objectives of the Action Plan for Jobs 2017, the ICT Skills Action Plan 2014-2018 and the National Skills Strategy 2025 to meet demand for the domestic supply of ICT graduates and to continue making Ireland the most attractive location in the world for ICT skills and ability. Lower rates of employment and lower earning potential are evident in the Arts and Humanities and Natural Sciences, Mathematics and Statistics fields for level 8 graduates, but employment prospects improving considerably for graduates in these fields who obtain level 9 and 10 qualifications.
Specifically, 62% of Honours Bachelor Degree graduates are in employment, which is the same figure as that of 2015. The proportion of Honours Bachelor Degree graduates seeking employment has increased to 5% in 2016 from 4% in 2015 and those unavailable for work/study has increased to 5% in 2016 from 4% in 2015. The proportion of Higher and Postgraduate Diploma graduates in employment has dropped to 73% in 2016 compared to 78% in 2015. This is most likely due to the overall drop in Higher and Postgraduate Diploma graduate numbers with the replacement of the Professional Diploma in Education with the Professional Master of Education. In years previous, most of these Professional Diploma in Education graduates were in employment, nine months after graduation. 81% of Master's and Doctorate graduates are in employment, this compares to 80% for the class of 2015. In general, there has been an improvement in rates of employment for the class of 2016 compared to recent previous classes. A comparison to CSO labour market data also shows the benefits of obtaining a third level qualification. Based on 2017 Q2 CSO Quarterly National Household Survey data, the unemployment rate for those with an Honours Bachelor Degree or higher was 3.1%. This figure was 8.5% for those with an Upper Secondary education and 12.5% for those with a Lower Secondary education.
Finally, I would like to take this opportunity to thank our graduates for taking the time to respond to the survey. I would also like to thank the careers officers and their colleagues for collating and returning this data to the HEA. This publication would not be possible without your continued participation and support. We very much look forward to continuing to work together on the new graduate outcomes survey.
Dr Graham Love Chief Executive, Higher Education Authority
WH
AT DO
GR
AD
UATES D
O? TH
E CLASS O
F 2016
3

Key PointsThe key points from each section of the report are summarised below:
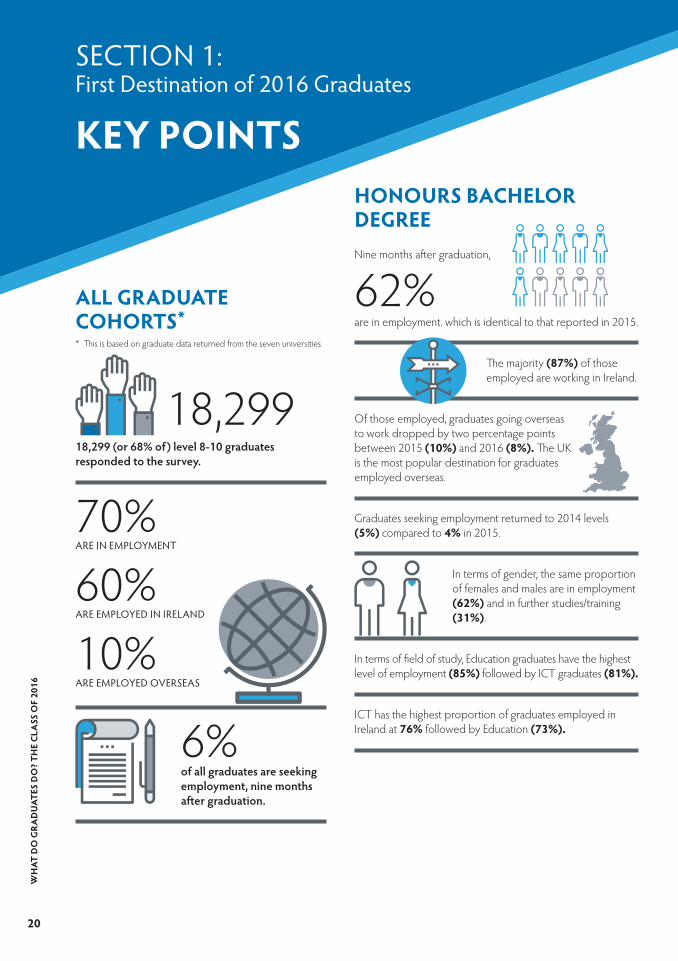
Section 1: First Destination of 2016 GraduatesAll Graduate Cohorts:
� 18,229 (or 68% of ) level 8-10 graduates responded to the survey.
� Overall, 70% are in employment, of which 60% are employed in Ireland and 10% are employed overseas.
� 6% of all graduates are seeking employment, nine months after graduation.
Honours Bachelor Degree:� Nine months after graduation, 62% are in employment which is identical
to that reported in 2015.
� The majority (87%) of those employed are working in Ireland.
� Of those employed, graduates going overseas to work dropped by two percentage points between 2015 (10%) and 2016 (8%).
� The UK is the most popular destination for graduates employed overseas.
� Graduates seeking employment returned to 2014 levels (5%) compared to 4% in 2015.
� In terms of gender, the same proportion of females and males are in employment (62%) and in further studies/training (31%).
� In terms of field of study, Education graduates have the highest level of employment (85%) followed by ICT graduates (81%).
� ICT has the highest proportion of graduates employed in Ireland at 76% followed by Education (73%).
� Graduates awarded a second class (2H2) degree demonstrate the highest levels of employment at 67%. Similar to previous years, those who received a first class (1H) degree had the lowest levels of employment (59%). The reverse is true for rates of progression into further study. While this is an unusual finding, it may be due to the quality of award that is required for entry into postgraduate study, with those who obtain a 1H more likely to go on to further study.
Higher and Postgraduate Diploma:� Employment dropped from 78% in 2015 to 73% in 2016. It should be noted that there
was an overall drop in Higher and Postgraduate Diploma graduate numbers most likely due to the replacement of the Professional Diploma in Education with the Professional Master of Education.
� The percentage of graduates going overseas remained at 2015 levels (3%).
� 5% of this 2016 cohort are seeking employment, up one percentage point from 2015.
� Of those surveyed, 77% of females are employed compared to 66% of males. Additionally, 63% of males are employed in Ireland compared to 74% of females.
WH
AT D
O G
RA
DU
ATES
DO
? TH
E CL
ASS
OF
2016
4
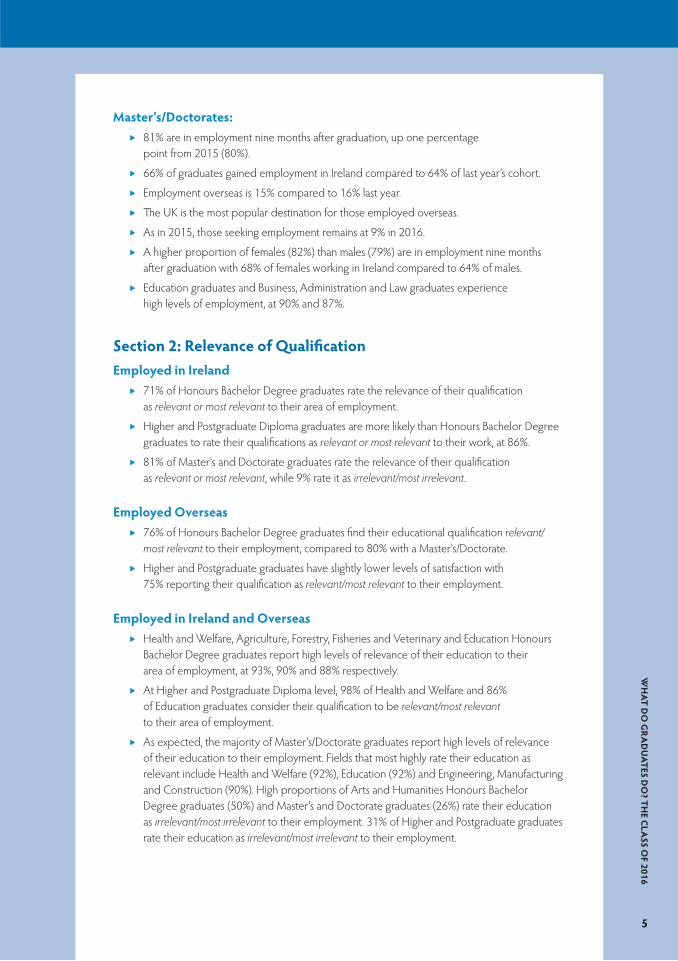
Master's/Doctorates:� 81% are in employment nine months after graduation, up one percentage
point from 2015 (80%).
� 66% of graduates gained employment in Ireland compared to 64% of last year’s cohort.
� Employment overseas is 15% compared to 16% last year.
� The UK is the most popular destination for those employed overseas.
� As in 2015, those seeking employment remains at 9% in 2016.
� A higher proportion of females (82%) than males (79%) are in employment nine months after graduation with 68% of females working in Ireland compared to 64% of males.
� Education graduates and Business, Administration and Law graduates experience high levels of employment, at 90% and 87%.
Section 2: Relevance of QualificationEmployed in Ireland
� 71% of Honours Bachelor Degree graduates rate the relevance of their qualification as relevant or most relevant to their area of employment.
� Higher and Postgraduate Diploma graduates are more likely than Honours Bachelor Degree graduates to rate their qualifications as relevant or most relevant to their work, at 86%.
� 81% of Master's and Doctorate graduates rate the relevance of their qualification as relevant or most relevant, while 9% rate it as irrelevant/most irrelevant.
Employed Overseas� 76% of Honours Bachelor Degree graduates find their educational qualification relevant/
most relevant to their employment, compared to 80% with a Master's/Doctorate.
� Higher and Postgraduate graduates have slightly lower levels of satisfaction with 75% reporting their qualification as relevant/most relevant to their employment.
Employed in Ireland and Overseas� Health and Welfare, Agriculture, Forestry, Fisheries and Veterinary and Education Honours
Bachelor Degree graduates report high levels of relevance of their education to their area of employment, at 93%, 90% and 88% respectively.
� At Higher and Postgraduate Diploma level, 98% of Health and Welfare and 86% of Education graduates consider their qualification to be relevant/most relevant to their area of employment.
� As expected, the majority of Master's/Doctorate graduates report high levels of relevance of their education to their employment. Fields that most highly rate their education as relevant include Health and Welfare (92%), Education (92%) and Engineering, Manufacturing and Construction (90%). High proportions of Arts and Humanities Honours Bachelor Degree graduates (50%) and Master's and Doctorate graduates (26%) rate their education as irrelevant/most irrelevant to their employment. 31% of Higher and Postgraduate graduates rate their education as irrelevant/most irrelevant to their employment.
WH
AT DO
GR
AD
UATES D
O? TH
E CLASS O
F 2016
5

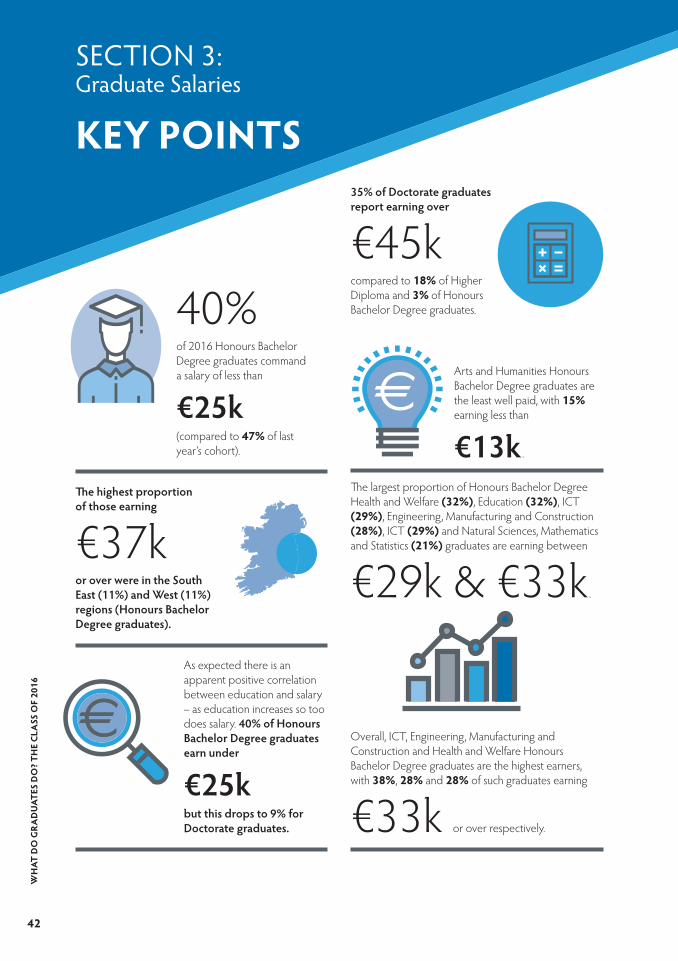
Section 3: Graduate Salaries� 40% of 2016 Honours Bachelor Degree graduates command a salary of less
than €25k (compared to 47% of last year’s cohort).
� The highest proportion of those earning €37k or over are in the South East (11%) and West (11%) regions (Honours Bachelor Degree graduates).
� As expected there is an apparent positive correlation between education and salary – as education increases so too does salary. 40% of Honours Bachelor Degree graduates earn under €25k but this drops to 9% for Doctorate graduates.
� 35% of Doctorate graduates report earning over €45k compared to 18% of Higher Diploma and 3% of Honours Bachelor Degree graduates.
� Arts and Humanities Honours Bachelor Degree graduates are the least well paid, with 15% earning less than €13k.
� The largest proportion of Honours Bachelor Degree Health and Welfare (32%), Education (32%), ICT (29%), Engineering, Manufacturing and Construction (28%), ICT (29%) and Natural Sciences, Mathematics and Statistics (21%) graduates are earning between €29k and €33k.
� Overall, ICT, Engineering, Manufacturing and Construction and Health and Welfare Honours Bachelor Degree graduates are the highest earners, with 38%, 28% and 28% of such graduates earning €33k or over respectively.
Section 4: Regional Distribution of Employed Graduates� Dublin is the region with the most employment opportunities, for all graduates.
� 42% of Honours Bachelor Degree, 30% of Higher Diploma and 35% of Postgraduate Diploma graduates found employment there.
� Moreover, Dublin employs 46% of Taught Master's, 33% of Doctorate and 35% of Research Master's graduates.
� The South-West is also a popular region for 17% of Honours Bachelor Degree, 23% of Higher Diploma, 19% of Postgraduate Diploma, 14% Taught Master's, 26% Research Master's and 19% of Doctorate graduates.
Section 5: Sectoral Distribution of Employed GraduatesEmployed in the Republic of Ireland
� The most common sector of employment for Honours Bachelor Degree graduates is the Non-Market Services sector at 30%, followed by Business, Finance and Insurance Services at 26%.
� Non-Market Services sector is also the most popular sector of employment for all other levels of qualification: Higher Diploma (45%), Postgraduate Diploma (80%), Taught Master's (35%), Research Master's (37%) and Doctorate graduates (62%).
� Generally, there appears to be a strong relationship between field of study and sector of employment, as expected.
WH
AT D
O G
RA
DU
ATES
DO
? TH
E CL
ASS
OF
2016
6

Employed Overseas� Non-Market sector is most popular for graduates employed overseas, with 46% of Honours
Bachelor Degree, 77% of Higher Diploma, 39% of Postgraduate Diploma, 29% of Taught Master's, 83% of Research Master's and 77% of Doctorate graduates employed here.
� Non-Market sector is the most popular sector for graduates employed overseas in four of the ten fields of study. The greatest percentage of graduates from Agriculture, Forestry and Fishing; Business, Administration and Law; Engineering, Manufacturing and Construction; and ICT disciplines are also predominantly working overseas in a sector of employment strongly related to their field of study. For Services and Social Sciences, Journalism and Information graduates, the most popular employment sector overseas is in Other Industries.
Section 6: Education1
Honours Bachelor Degree in Education (Second Level Teaching)� The majority of such graduates are in employment (88%), 5% are in further study
or training, 5% are seeking employment and 2% are not available for work.
� In terms of employment type, 85% are employed in Ireland with 35% employed in temporary whole-time teaching while a further 14% are employed on a part-time basis in Ireland. 7% of Honours Bachelor Degree graduates are employed in permanent teaching in Ireland.
� Of those employed overseas, 7% are also employed in permanent teaching positions. 5% are employed in temporary whole-time teaching abroad and 3% did not specify their type of employment.
Professional Master of Education (Second Level Teaching)� The findings show that the majority (90%) of such graduates are in employment, 90% of
which are employed in Ireland. 7% are employed on a permanent basis, 38% are employed in temporary whole-time teaching and 17% are working on a part-time basis.
� Additionally, 10% of such graduates are working overseas, with 3% on permanent contracts.
Section 7: International Graduates� Nine months after graduation, 62% of Honours Bachelor Degree international graduates
are in employment, with 37% working in Ireland and 25% working overseas.
� 59% of Higher and Postgraduate Diploma international graduates are employed in 2016, 51% of which are working in Ireland and 8% overseas. 5% of Higher and Postgraduate females are seeking employment compared to 13% of males.
� 73% of Master's and Doctorate international graduates are employed (41% in Ireland; 33% overseas). 74% of females found employment compared to 73% of males.
1 This year’s report does not provide an analysis of primary level teaching graduates. Some Colleges of Education took part in the pilot study for the Graduate Outcomes Survey commencing in 2018 and so were not part of this year’s Final Destination Survey. As a result, data that is available is not reflective of the entire primary level teaching graduate cohort for 2016.
WH
AT DO
GR
AD
UATES D
O? TH
E CLASS O
F 2016
7
Table of ContentsAcknowledgements 1
Foreword 3
Key Points 4
Introduction 13
Section 1: First Destination of 2016 Graduates 19
1.1 Honours Bachelor Degree Graduates 22
1.2 Higher and Postgraduate Diploma Graduates 23
1.3 Master's and Doctorate Graduates 24
1.4 Overview of First Destination of Graduates by Level of Award 26
1.5 Comparing the First Destination Survey (FDR) and the Central Statistics Office (CSO) ‘Seeking Employment’ Rates 2014-2017 27
1.6 Where overseas? The Top 5 Destinations for Honours Bachelor Degree, Master's and Doctorate Graduates 28
1.7 First Destination of Graduates by Field of Study 29
1.7.1 Honours Bachelor Degree Graduates 29
1.7.2 Master's and Doctorate Graduates 30
1.8 First Destination of Honours Bachelor Degree Graduates by Level of Award 31
Section 2: Relevance of Qualification 33
2.1 Relevance of Qualification 36
2.1.1 Relevance of Qualification to Employment for Graduates Employed in Ireland 36
2.1.2 Relevance of Qualification to Employment for Graduates in Employment Overseas 37
2.2 Relevance of Qualification by Field of Study, 2016 Graduates 38
Section 3: Graduate Salaries 41
3.1 Graduate Salaries by Level of Qualification 43
3.2 Salaries by Field of Study for Honours Bachelor Degree Graduates 44
3.3 Salaries by Grade of Honours Bachelor Degree Graduates 45
3.4 Salaries by Region of Employment of Honours Bachelor Degree Graduates 45
3.5 Salaries by Gender for Honours Bachelor Degree Graduates 49
WH
AT D
O G
RA
DU
ATES
DO
? TH
E CL
ASS
OF
2016
8

Section 4: Regional Distribution of Employed Graduates 53
4.1 Regional Distribution of Employed Graduates 55
Section 5: Sectoral Distribution of Employed Graduates 59
5.1 Sector of Employment by Level of Qualification 61
5.2 Sector of Employment by Field of Study for Honours Bachelor Degree Graduates 63
Section 6: Education 67
6.1 Honours Bachelor Degree in Education (Second Level Teaching) 69
6.2 Professional Master of Education (Second Level Teaching) 70
Section 7: First Destination of International Graduates 73
7.1 Honours Bachelor Degree International Graduates, 2016 75
7.2 Higher and Postgraduate Diploma International Graduates 76
7.3 Master's and Doctorate International Graduates 77
Conclusion 78
Bibliography 80
Appendices 81
Appendix A: Classification of Regions used for Statistical Reporting in the Republic of Ireland (NUTS 3 Regions) 81
WH
AT DO
GR
AD
UATES D
O? TH
E CLASS O
F 2016
9

List of TablesTable 1.1: First Destination of Honours Bachelor Degree Graduates, 2016 and 2015 22
Table 1.2: First Destination of Honours Bachelor Degree Graduates by Gender, 2016 22
Table 1.3: First Destinations of Honours Bachelor Degree Graduates 2011-2016 (7 Universities) 23
Table 1.4: First Destination of Higher & Postgraduate Diploma Graduates, 2016 and 2015 24
Table 1.5: First Destination of Higher & Postgraduate Diploma Graduates by Gender, 2016 24
Table 1.6: First Destination of Master's and Doctorate Graduates, 2016 and 2015 25
Table 1.7: First Destination of Master's and Doctorate Graduates by Gender, 2016 25
Table 1.8: First Destination of Master's and Doctorate Graduates, 2011-2016 26
Table 1.9: The Top 5 Overseas Destinations for Graduates, Class of 2016 28
Table 1.10: First Destination of Undergraduate Honours Bachelor Degree, 2016, By Field of Study 29
Table 1.11: First Destination of Master's and Doctorate Graduates, 2016, By Field of Study 30
Table 2.1: Relevance of Qualification to Employment for Graduates in Employment Overseas, 2016 37
Table 2.2: Relevance of Qualification by Field of Study, 2016 Graduates 39
Table 3.1: 2016 Graduate Salaries by Level of Qualification Compared to 2015 Graduate Salaries 43
Table 3.2: Honours Bachelor Degree by Field of Study, 2016 Graduates 44
Table 3.3 Salaries for Honours Bachelor Degree Graduates by Gender and Field of Study, 2016 50
Table 5.1: Key Employment Sectors by Level of Qualification for Graduates Employed in the Republic of Ireland, 2016 61
Table 5.2: Key Employment Sectors by Level of Qualification for Graduates Employed Overseas, 2016 62
Table 5.3: Key Employment Sectors by Field of Study for Honours Bachelor Degree Graduates Employed in the Republic of Ireland, 2016 64
Table 5.4: Key Employment Sectors by Field of Study for Honours Bachelor Degree Graduates Employed Overseas, 2016 65
Table 6.1: First Destination of Honours Bachelor Degree in Education (Second Level Teaching) Graduates, 2016 69
Table 6.2: Honours Bachelor Degree Education (Second Level Teaching) Graduates by Type of Employment, 2016 69
Table 6.3: First Destination of Professional Master of Education (Second Level Teaching) Graduates, 2016 70
Table 6.4: Professional Master of Education (Second Level Teaching) Graduates by Type of Employment, 2016 70
Table 6.5: First Destination of Professional Master of Education (Second Level Teaching) Graduates by Primary Field of Study, 2016 71W
HAT
DO
GR
AD
UAT
ES D
O?
THE
CLA
SS O
F 20
16
10

Table 7.1: First Destination of Honours Bachelor Degree International Graduates, 2016 75
Table 7.2: First Destination of Honours Bachelor Degree International Graduates by Gender, 2016 75
Table 7.3: First Destination of Higher & Postgraduate Diploma International Graduates, 2016 76
Table 7.4: First Destination of Higher & Postgraduate Diploma International Graduates by Gender, 2016 76
Table 7.5: First Destination of Master's and Doctorate International Graduates, 2016 77
Table 7.6: First Destination of Master's and Doctorate International Graduates by Gender, 2016 77
List of FiguresFigure 1.1: Overview of First Destination of Graduates, 2016, by Level of Qualification 26
Figure 1.2: First Destination Survey (FDR) Class of 2016 vs Central Statistics Office (CSO) Seeking Employment Rates 2014-2017 27
Figure 1.3: Unemployment Rate (%) in Ireland by Highest Level of Education, 2017 28
Figure 1.4: First Destination of Honours Bachelor Degree Graduates by Award Class, 2016 31
Figure 2.1: Relevance of Qualification to Employment, Honours Bachelor Degree and Higher & Postgraduate Diploma, 2016 Graduates in Employment in Ireland 36
Figure 2.2: Relevance of Qualification to Employment, Master's and Doctorate, 2016 Graduates 37
Figure 2.3: Relevance of Employment for those Employed in Ireland vs those Employed Overseas by Programme Type, 2016 38
Figure 3.1: Graduates in Employment – Salary Range and Qualification, 2016 43
Figure 3.2: Salaries by Grade, Level 8 Honours Bachelor Degree Graduates, 2016 45
Figure 3.3: Salaries by Region of Employment for Honours Bachelor Degree Graduates, 2016 46
Figure 3.4: Salaries by Gender for Honours Bachelor Degree Graduates, 2016 49
Figure 4.1: Region of Employment of Honours Bachelor Degree Graduates, 2016 55
Figure 4.2: Region of Employment of Higher & Postgraduate Diploma Graduates, 2016 56
Figure 4.3: Region of Employment of Taught Master's, Research Master's and Doctorate Graduates, 2016 56
WH
AT DO
GR
AD
UATES D
O? TH
E CLASS O
F 2016
11

WH
AT D
O G
RA
DU
ATES
DO
? TH
E CL
ASS
OF
2016
12

IntroductionWhat Do Graduates Do? The Class of 2016. An Analysis of the First Destination of University Graduates offers insights into the first destination of graduates in Ireland, nine months after graduation. Graduate surveys are widely used to measure higher education output because they provide concrete information that is useful for a wide variety of stakeholders, including policy makers, higher education institutions and prospective students. Furthermore, the results of graduate surveys can be used for benchmarking institutional performance over time and against other similar institutions2.
While graduate surveys have many positive attributes, the limitations of cross-sectional approaches (or one point in time) have been heavily criticised (e.g. Unger and Raggautz, 20113). With this is mind and given the large proportion of the Irish adult population (26-64 year olds) with tertiary education (43% compared to EU average of 34%) as reported by the OECD4 in their Education at a Glance 2017 report (2015 data), it is timely that the HEA undertook a review of the current survey. Following on from a successful pilot in 2017, the new Graduate Outcomes Survey will commence in 2018. The survey extends the participation of institutions not currently taking part in the survey (to include the Institutes of Technology and private colleges, should they wish to participate), and situate the survey data within a new relational database that will allow for greater data accuracy and linking of survey data across its systems. The new survey will provide the following:
� Data on graduate qualifications and employment both within Ireland and overseas,
� Relevance of employment to area of study,
� Data on graduate further study,
� Data on graduate unemployment and unavailability for work,
� Career progression of graduates through longitudinal data.
In terms of this longitudinal aspect, the HEA is working with the Central Statistics Office on the production of a report on longitudinal graduate outcomes using administrative data, in order to capture longer term data on higher education outcomes. The report will provide an in-depth analysis of the outcomes of graduates from higher education institutions, in terms of activities following graduation such as employment and further education, the industry sectors in which graduates work and the earnings of graduates over time. A high level of coverage of the graduate cohort is made possible by linking of administrative data across a wide range of educational and personal parameters, as well as the assembly of longitudinal profiles of graduate categories. In the report, graduate outcomes will be analysed in the years subsequent to their graduation through both panel and cohort studies.
The first section of this current report will present findings from the seven Irish universities, with a focus on level 8-10 graduates. As can be seen from the National Framework of Qualifications chart, level 8 refers to Undergraduate Honours Bachelor Degrees and Higher Diplomas; level 9 refers to Postgraduate Diplomas and Master's Degrees; while level 10 refers to those with Doctoral Degrees. Analysis has been carried out on whether graduates are in employment (in Ireland or overseas), seeking employment, involved in work experience schemes or in further study. The seeking employment rate for levels 8-10 graduates, continues to drop in 2017 to 4.2% (FDR data) compared to 6.6% nationally (CSO data). Section 2 looks at the question of how relevant graduates rated their qualification to the employment gained. The data is examined by discipline and level of qualification. Section 3 outlines self-reported salaries of employed graduates, nine months after graduation. Section 4 discusses the location of graduate employment by exploring regional distributions for qualification levels 8-10. Section 5 gives an overview of the employment sector of working graduates by level, employed in Ireland and overseas, nine months
2 Denise Frawley and Valerie Harvey. Graduate Surveys: Review of International Practice (Dublin: Higher Education Authority, 2015). 3 Martin Unger and Andreas Raggautz, “Long-term career tracking of graduates using the social science security system”, Employability
of Graduates & Higher Education Management Systems conference, Dehems, Vienna 22/23.9.2011.4 OECD, Education at a Glance 2017: OECD Indicators (Paris: OECD Publishing, 2017).
WH
AT DO
GR
AD
UATES D
O? TH
E CLASS O
F 2016
13

after graduation. Section 6 focuses on second-level graduates from Initial Teacher Education (ITE) programmes. This incorporates graduates who completed concurrent (Honours Bachelor Degree) and consecutive (Professional Master of Education) programmes. An analysis of primary school ITE graduates is not included in this year’s report as some teacher training colleges took part in the Graduate Outcomes Survey pilot and so were not involved in the Final Destinations Survey 2016. Data would therefore not accurately reflect the primary-level teaching graduates for 2016. As with previous years, most graduates from both Honours Bachelor Degree and Professional Master of Education second level teaching programmes are in employment nine months after graduation. Noticeably, there is an increase in the proportion of both cohorts of graduates in permanent teaching positions in Ireland. In the recent past, it was broadly accepted that there is an excessive reliance in the Irish education system on fixed-term and part-time employment contracts for teachers5 and so this finding appears to be a positive one. Finally, Section 7 looks at the first destination of international graduates (levels 8-10).
National Framework of Qualifications
AWARDING BODIESQuality and Qualifi cations Ireland (QQI) makes awards in further and
higher education and training
SEC - State Examinations Commission (Department of Education and Skills)
Institutes of Technology
Universities
For further Information consult: www.nfq.ie www.QQI.ie ©QQI 2014
AWARDS IN THE FRAMEWORKThere are four classes of award in the National Framework of Qualifi cations:
Major Awards: named in the outer rings, are the principal class of awards made at a level
Minor Awards: are for partial completion of the outcomes for a Major Award
Supplemental Awards: are for learning that is additional to a Major Award
Special Purpose Awards: are for relatively narrow or purpose-specifi c achievement
Source: QQI, 2014.
5 Peter Ward. Report to the Minister for Education and Skills of the Chairperson of the Expert Group on Fixed-Term and Part-Time Employment in Primary and Secondary Level Education in Ireland, 2014. Available at: https://www.ictu.ie/download/pdf/ward_report.pdf.
WH
AT D
O G
RA
DU
ATES
DO
? TH
E CL
ASS
OF
2016
14

MethodologyDataThe data for this report was gathered from a survey of all graduates in the universities6. Fieldwork was conducted in March 2017 on behalf of 2016 graduates, approximately nine-months after their graduation.
The main graduate questionnaire contains questions on the following:
� Details of qualification. Questions relating to course title, level of study, faculty of primary degree (for Professional Master of Education graduates) and current situation (in employment, in further study or training, seeking employment, on work experience scheme, not available for employment or study);
� Employment section (if applicable). Questions relate to employment type, salary, job title, location, sector, type of school and contract type (for teachers) and course attendance (i.e. full-time, part-time);
� Further study or training section (if applicable). This section asks about institute name/location, course title and level of award sought;
� Seeking employment section (if applicable). This section is used by institutions to gather information on supplementary local questions, such as ‘relevance of qualification to employment’.
LimitationsIt is important to note the limitations of the current report.
In parts of the report, data is missing for certain institutions and therefore data analysis was conducted on a smaller sample. For this reason, certain sections will not match the first destination data outlined in section one. Furthermore, response rates for certain sections of the report were relatively poor (salary data, for example). Where applicable, the issues around missing data and low response rates are further highlighted and explained in the body of the report.
6 Data was also returned for one institution of technology (IoT). Due to the sectoral limitations of including only one IoT, analysis of this data is not included in this report.
WH
AT DO
GR
AD
UATES D
O? TH
E CLASS O
F 2016
15

Definition of Terms
FDRFirst Destinations Report: ‘First Destination’ is defined as the position of a graduate nine months after graduation.
Full-timeA full-time student is defined as a student attending an intramural day course at a third-level institution extending over at least a full academic year and leading to a third-level (or higher) award, and devoting their entire working time to their academic studies so far as is known.
Part-timePart-time students include students (other than full-time students) attending intramural courses extending over at least a full academic year and leading to a third-level (or higher) award.
Academic YearThe Academic Year generally extends from late autumn to early summer, though the specific dates between institutions vary.
GraduateA graduate is a former student who has successfully completed a course of study in the previous academic year (it includes students who have completed their final exams/thesis submission but who have yet to formally receive their parchment from their institution).
RegionWhile graduates indicate their county of origin and (for employed graduates) their county of employment, in many cases a breakdown by county of results is misleading due to small populations in certain counties. To ameliorate this some tables and graphs aggregate county data to regional data. The regions match those used by the Central Statistics Office (CSO).
Field of StudyField of study represents a broad discipline a graduate completed a course in, such as Arts and Humanities.
OccupationOccupation describes the nature of the work an employed graduate performs, such as Teaching Professional or Business Professional.
Employment SectorEmployment Sector describes which part of the labour market employed the graduate, such as Business, Finance and Insurance Services, or Personal and Recreational Services.
Honours Bachelor Degree Awards (Level 8)These awards are the equivalent of Primary Degrees (e.g. B.A. Hons, BSc. Hons) available prior to the introduction of the National Qualifications Framework.
WH
AT D
O G
RA
DU
ATES
DO
? TH
E CL
ASS
OF
2016
16

Postgraduate Diplomas and Higher DiplomasPostgraduate and Higher Diplomas are conversion courses, usually of one year’s duration, aimed at Honours Bachelor Degree graduates. They are often vocational in nature (thereby providing students with training directly applicable to the labour market). They are a method of addressing skills shortages in various employment sectors.
Higher Degree AwardsRecipients of Master's and PhD level awards.
Unavailable for work/further studyGraduates in the above category cannot pursue a career or further study due to taking time out to travel, for domestic circumstances, due to illness, etc.
Award ClassAward Class refers to the quality of award earned by a student. Pass is the lowest award, followed by 2H2, 2H1, and H1 (when considering Primary Degrees). A small amount of other award classes exist; these have either been integrated into the above classes or excluded.
WH
AT DO
GR
AD
UATES D
O? TH
E CLASS O
F 2016
17

SECTION 1: FIRST DESTINATION OF 2016 GRADUATES

FIRST DESTINATION OF 2016 GRADUATES
This section examines the first destination of 2016 graduates by level of award. First destination trends over the last six years are analysed, in addition to graduate characteristics, such as gender and level of award.
19
HONOURS BACHELOR DEGREENine months after graduation,
62%are in employment. which is identical to that reported in 2015.
The majority (87%) of those employed are working in Ireland.
Of those employed, graduates going overseas to work dropped by two percentage points between 2015 (10%) and 2016 (8%). The UK is the most popular destination for graduates employed overseas.
Graduates seeking employment returned to 2014 levels (5%) compared to 4% in 2015.
In terms of gender, the same proportion of females and males are in employment (62%) and in further studies/training (31%).
In terms of field of study, Education graduates have the highest level of employment (85%) followed by ICT graduates (81%).
ICT has the highest proportion of graduates employed in Ireland at 76% followed by Education (73%).
ALL GRADUATE COHORTS*
* This is based on graduate data returned from the seven universities
18,29918,299 (or 68% of) level 8-10 graduates responded to the survey.
70%ARE IN EMPLOYMENT
60%ARE EMPLOYED IN IRELAND
10%ARE EMPLOYED OVERSEAS
6%of all graduates are seeking employment, nine months after graduation.
KEY POINTS
SECTION 1:First Destination of 2016 Graduates
WH
AT D
O G
RA
DU
ATES
DO
? TH
E CL
ASS
OF
2016
20

HIGHER & POSTGRADUATE DIPLOMA
78% ä 73% 2015 2016Employment dropped from 78% in 2015 to 73% in 2016. It should be noted that there was an overall drop in Higher & Postgraduate Diploma graduate numbers most likely due to the replacement of the Professional Diploma in Education with the Professional Master of Education.
The percentage of graduates going overseas remained at 2015 levels (3%).
5% of this 2016 cohort are seeking employment, up one percentage point from 2015.
77% 66%Of those surveyed, 77% of females are employed compared to 66% of males. Additionally, 63% of males are employed in Ireland compared to 74% of females.
MASTER'S/ DOCTORATES
81%are in employment nine months after graduation, up one percentage point from 2015 (80%).
66%of graduates gained employment in Ireland compared to 64% of last year’s cohort.
15%Employment overseas is 15% compared to 16% last year.
The UK is the most popular destination for those employed overseas.
As in 2015, those seeking employment remains at 9% in 2016.
A higher proportion of females (82%) than males (79%) are in employment 9 months after graduation with 68% of females working in Ireland compared to 64% of males.
Education graduates and Business, Administration & Law graduates experience high levels of employment, at 90% and 87%.
WH
AT DO
GR
AD
UATES D
O? TH
E CLASS O
F 2016
21

1.1 Honours Bachelor Degree GraduatesThe overall results of the first destination of undergraduate Honours Bachelor Degree graduates are outlined in Table 1.1. Of the 2016 university graduate cohort, 70% responded to the survey, compared to 76% of last year’s graduate cohort.
Table 1.1: First Destination of Honours Bachelor Degree Graduates, 2016 and 2015
ALL 7 UNIVERSITIES 2016 2015
In employment 62% 62%
In employment in Ireland 54% 53%
In employment overseas 8% 10%
Further Studies/Training 31% 31%
Seeking Employment 5% 4%
Unavailable for Work Study 3% 2%
Nine months after graduation, 62% are in employment, the same percentage as that in 2015. There has been a one percentage point increase in 2016 graduates employed in Ireland (54%) compared to 2015 (53%). As a consequence, only 8% of graduates report being employed overseas. Graduates engaged in further studies/training remains at 31%. The proportion of graduates seeking employment increased by one percentage point slightly from 4% in 2015 to 5% in 2016. Graduate proportions unavailable to work or study increased from 2% in 2015 to 3% in 2016.
Table 1.2: First Destination of Honours Bachelor Degree Graduates by Gender, 2016
ALL 7 UNIVERSITIES MALE FEMALE
In employment 62% 62%
In employment in Ireland 54% 53%
In employment overseas 8% 9%
Further Studies/Training 31% 31%
Seeking Employment 5% 4%
Unavailable for Work Study 3% 3%
As evident in Table 1.2, 62% of males and females who responded to the survey, report being in employment. 54% of males are employed in Ireland, while 8% are employed abroad. 53% of females are employed in Ireland and 9% are employed overseas. 31% of females and males are engaged in further study. Only 5% of males and 4% of females are seeking employment, while 3% of both males and females are unavailable for work or study.
Table 1.3 shows the pattern of first destination of Honours Bachelor Degree graduates over the last six years, from 2011 to 20167.
7 Calendar years refer to the year of graduation. Survey data presents the situation of graduates as of March 31st of the following year.
WH
AT D
O G
RA
DU
ATES
DO
? TH
E CL
ASS
OF
2016
22
SECTION 1: FIRST DESTINATION OF 2016 GRADUATES

Table 1.3: First Destinations of Honours Bachelor Degree Graduates 2011-2016 (7 Universities)
HONOURS BACHELOR DEGREE 2011 2012 2013 2014 2015 2016
In employment 48% 52% 51% 58% 62% 62%
In employment in Ireland 39% 42% 39% 48% 53% 54%
In employment overseas 9% 10% 12% 10% 10% 8%
Further Studies/Training 41% 37% 40% 35% 31% 31%
Seeking Employment 7% 7% 6% 5% 4% 5%
Unavailable for Work Study 4% 3% 3% 2% 2% 3%
As can be seen from Table 1.3, employment prospects of Honours Bachelor Degree graduates improved between 2011 and 2012 (48% to 52%) with a slight fall in those employed between 2012 and 2013 (52% to 51%). However, 2014 witnessed a further increase, with 58% of graduates reporting to be in employment and this figure rose again in 2015 to 62%, where it has remained in 2016.
Of those employed, there had been a gradual increase between 2011 and 2013 in the proportions working overseas. While 9% of 2011 graduates were employed overseas, this increased to 12% for 2013 graduates. 2014 and 2015 witnessed a reduction to 2012 levels, with 10% employed overseas, and in 2016, this figure dropped further to 8%. Consequently, graduates gaining employment in Ireland increased steadily each year from 2013 and the most recent figure shows that 54% of 2016 graduates are employed in Ireland 9 months after graduation. Those seeking employment has fallen over the period 2011 (7%) to 2015 (4%) but has increased by one percentage point in 2016 to 5%.
1.2 Higher and Postgraduate Diploma GraduatesTable 1.4 illustrates the first destination results for Higher and Postgraduate Diploma graduates, for 2016 and 2015. The response rate is 64% for 2016 graduates, down two percentage points from 66% in 2015. Employment dropped from 78% in 2015 to 73% in 2016. The proportion of graduates employed in Ireland also decreased from 75% in 2015 to 70% in 2016. It should be noted that there is an overall drop in Higher and Postgraduate Diploma graduate numbers most likely due to the replacement of the Professional Diploma in Education (one year initial teacher education programme) with the Professional Master of Education (two year initial teacher education programme). For example, in 2014, 92% of Higher and Postgraduate respondents in the field of Education were graduates from the Professional Diploma in Education. 81% of these graduates gained employment, 66% in Ireland and 15% overseas. In 2016, such graduates are now returned as Master's graduates. 3% of Higher and Postgraduate Diploma graduates were employed overseas in 2015 and remained unchanged in 2016. Those engaged in further studies has increased from 16% in 2015 to 20% in 2016. The proportion of graduates seeking employment has increased by one percentage point to 5% in 2016 from 4% in 2015. There has been a slight decrease in those unavailable for work or study – from 2% in 2015 to 1% in 2016.
WH
AT DO
GR
AD
UATES D
O? TH
E CLASS O
F 2016
23

Table 1.4: First Destination of Higher & Postgraduate Diploma Graduates, 2016 and 2015
ALL 7 UNIVERSITIES 2016 2015
In employment 73% 78%
In employment in Ireland 70% 75%
In employment overseas 3% 3%
Further Studies/Training 20% 16%
Seeking Employment 5% 4%
Unavailable for Work Study 1% 2%
In terms of gender, Table 1.5 illustrates that 66% of males who responded to the survey are in employment, compared to 77% of female respondents with a Higher and Postgraduate Diploma. Additionally, 63% of males are employed in Ireland compared to 74% of females. 3% of females and males are employed overseas. 23% of males and 19% of females are in further study or training, while 9% of males and 3% of females are seeking employment. Only 1% of males and 1% of females are unavailable for work or study.
Table 1.5: First Destination of Higher & Postgraduate Diploma Graduates by Gender, 2016
ALL 7 UNIVERSITIES MALE FEMALE
In employment 66% 77%
In employment in Ireland 63% 74%
In employment overseas 3% 3%
Further Studies/Training 23% 19%
Seeking Employment 9% 3%
Unavailable for Work Study 1% 1%
1.3 Master's and Doctorate GraduatesThe overall results of the 2016 First Destination Survey of Master's and Doctorate graduates are outlined in Table 1.6. The survey achieved a response rate of 68% among Master's and Doctorate graduates, up from 63% last year. A very high proportion, 81%, of this graduate cohort are in employment 9 months after graduation, an improvement on the previous year (80%). There has only been a slight change in the proportion of those employed overseas – at 15% in 2016 and 16% in 2015. These relatively large proportions of Master's and Doctorate graduates gaining employment overseas is to be expected – part of the career progression path, for research graduates in particular, involves gaining employment experience overseas. The percentage of graduates who continued to further study remained at 8% in 2016. Similarly, the percentage of Master's and Doctorate graduates seeking employment is the same as that in 2015 (9%). The proportion of those unavailable for work or study has also remained steady this year at 2%.
WH
AT D
O G
RA
DU
ATES
DO
? TH
E CL
ASS
OF
2016
24
SECTION 1: FIRST DESTINATION OF 2016 GRADUATES

Table 1.6: First Destination of Master's and Doctorate Graduates, 2016 and 2015
ALL 7 UNIVERSITIES 2016 2015
In employment 81% 80%
In employment in Ireland 66% 64%
In employment overseas 15% 16%
Further Studies/Training 8% 8%
Seeking Employment 9% 9%
Unavailable for Work Study 2% 2%
In terms of gender, Table 1.7 shows that 79% of males and 82% females are in employment nine months after graduation. 64% of males and 68% of females are employed in Ireland compared to 15% of males and 14% of females who are employed overseas. A similar proportion of males (8%) and females (7%) are engaged in further study. One in ten males are seeking employment, compared to 8% of females. A small proportion of males (2%) and females (2%) are unavailable for work or study.
Table 1.7: First Destination of Master's and Doctorate Graduates by Gender, 2016
ALL 7 UNIVERSITIES MALE FEMALE
In employment 79% 82%
In employment in Ireland 64% 68%
In employment overseas 15% 14%
Further Studies/Training 8% 7%
Seeking Employment 10% 8%
Unavailable for Work Study 2% 2%
Table 1.8 shows the graduate destination trends from 2011 to 2016. The table shows a steady increase since 2011 in the proportions of graduates gaining employment, rising from 71% in 2011 to 81% in 2016. While there was a three percentage point drop in those employed in Ireland between 2012 (61%) and 2013 (58%), this increased by two percentage points each year thereafter.
Additionally, there has been a gradual increase in the proportion of those with a Master's or Doctorate working overseas between 2012 (11%) and 2015 (16%). This figure dropped back slightly by one percentage point in 2016 to 15%. There has been a drop for graduates partaking in further training, reducing from 13% in 2011 to 8% in 2016. While such graduates seeking employment increased between 2011 and 2012 (from 12% to 13%), it has reduced from 11% in 2013 to 10% for the 2014 cohort and 9% for the 2015 and 2016 cohort. Those unavailable for work or study has also reduced over the last six years, from 4% in 2011 to 2% in 2016. At a descriptive level, the data point to a general improvement in employment outcomes among this particular cohort of graduates.
WH
AT DO
GR
AD
UATES D
O? TH
E CLASS O
F 2016
25
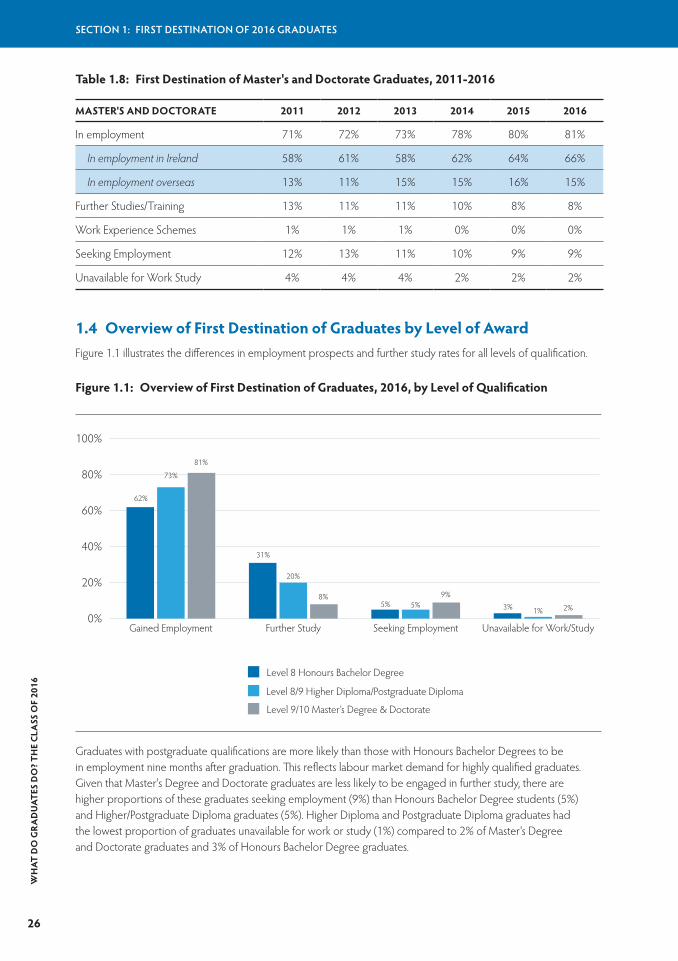
Table 1.8: First Destination of Master's and Doctorate Graduates, 2011-2016
MASTER'S AND DOCTORATE 2011 2012 2013 2014 2015 2016
In employment 71% 72% 73% 78% 80% 81%
In employment in Ireland 58% 61% 58% 62% 64% 66%
In employment overseas 13% 11% 15% 15% 16% 15%
Further Studies/Training 13% 11% 11% 10% 8% 8%
Work Experience Schemes 1% 1% 1% 0% 0% 0%
Seeking Employment 12% 13% 11% 10% 9% 9%
Unavailable for Work Study 4% 4% 4% 2% 2% 2%
1.4 Overview of First Destination of Graduates by Level of AwardFigure 1.1 illustrates the differences in employment prospects and further study rates for all levels of qualification.
Figure 1.1: Overview of First Destination of Graduates, 2016, by Level of Qualification
0%
20%
40%
60%
80%
100%
Unavailable for Work/StudySeeking EmploymentFurther StudyGained Employment
62%
73%
81%
3% 1% 2%5% 5%9%
31%
20%
8%
Level 9/10 Master’s Degree & Doctorate
Level 8 Honours Bachelor Degree
Level 8/9 Higher Diploma/Postgraduate Diploma
Graduates with postgraduate qualifications are more likely than those with Honours Bachelor Degrees to be in employment nine months after graduation. This reflects labour market demand for highly qualified graduates. Given that Master's Degree and Doctorate graduates are less likely to be engaged in further study, there are higher proportions of these graduates seeking employment (9%) than Honours Bachelor Degree students (5%) and Higher/Postgraduate Diploma graduates (5%). Higher Diploma and Postgraduate Diploma graduates had the lowest proportion of graduates unavailable for work or study (1%) compared to 2% of Master's Degree and Doctorate graduates and 3% of Honours Bachelor Degree graduates.
WH
AT D
O G
RA
DU
ATES
DO
? TH
E CL
ASS
OF
2016
26
SECTION 1: FIRST DESTINATION OF 2016 GRADUATES

1.5 Comparing the First Destination Survey (FDR) and the Central Statistics Office (CSO) ‘Seeking Employment’ Rates 2014-2017
Figure 1.2 demonstrates the national unemployment rate (CSO) compared to the rate of graduates seeking employment8 between 2014 and 2017.
From 2014 to 2017, it can be seen that both higher education graduates and the general labour force experienced reductions in unemployment rates. However, the overall unemployment figures have fallen more sharply, having been at a much higher rate back in 2014 (12.1%). The gap was widest in 2014 with only 7.3% of higher education graduates seeking employment. By 2017, the overall unemployment figures had fallen to 6.6% compared to 4.2% for higher education graduates. The lower levels of graduate unemployment compared to national unemployment rates highlight the continued demand for higher education graduates in the Irish economy.
Figure 1.2: First Destination Survey (FDR) Class of 2016 vs Central Statistics Office (CSO) Seeking Employment Rates 2014-20179
0.00
2.00
4.00
6.00
8.00
10.00
12.00
14.00
2017201620152014
7.36.8
5.9
4.2
12.1
9.9
8.3
6.6
FDR (Level 8, 9 & 10) CSO (QNHS)
8 The seeking employment rate represents the percentage of total respondents (excluding those employed overseas) seeking employment for level 8,9 and 10 university graduates.
9 CSO unemployment rates from 2014-2017 are based on Quarterly National Household Survey (QNHS) March estimates. FDR seeking employment rates are based on collection census date (31st March 2014-2017).
WH
AT DO
GR
AD
UATES D
O? TH
E CLASS O
F 2016
27
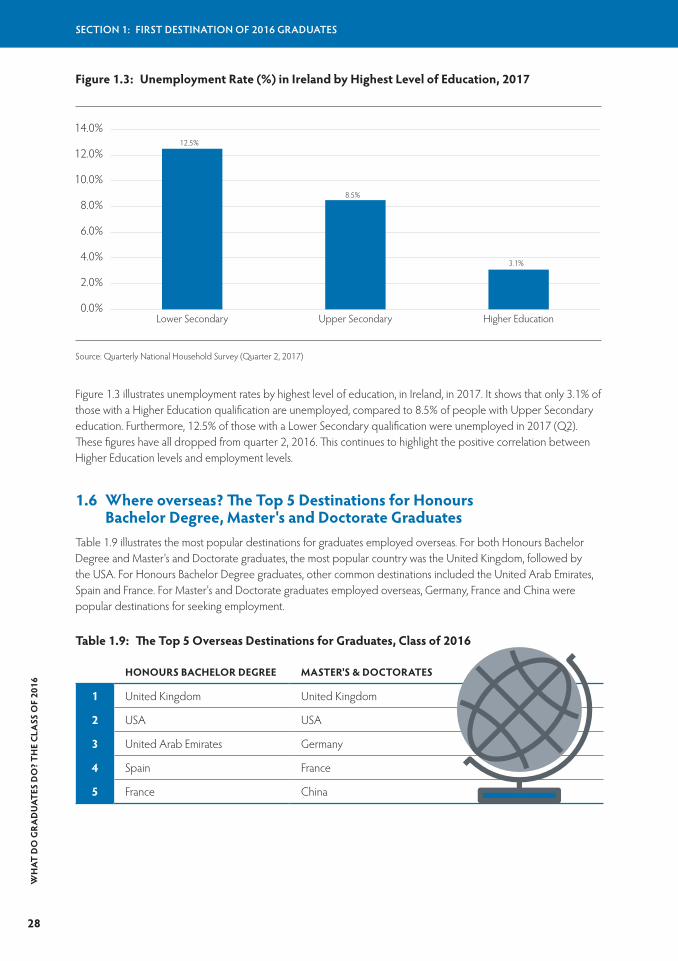
Figure 1.3: Unemployment Rate (%) in Ireland by Highest Level of Education, 2017
0.0%
2.0%
4.0%
6.0%
8.0%
10.0%
12.0%
14.0%
Higher EducationUpper SecondaryLower Secondary
12.5%
3.1%
8.5%
Source: Quarterly National Household Survey (Quarter 2, 2017)
Figure 1.3 illustrates unemployment rates by highest level of education, in Ireland, in 2017. It shows that only 3.1% of those with a Higher Education qualification are unemployed, compared to 8.5% of people with Upper Secondary education. Furthermore, 12.5% of those with a Lower Secondary qualification were unemployed in 2017 (Q2). These figures have all dropped from quarter 2, 2016. This continues to highlight the positive correlation between Higher Education levels and employment levels.
1.6 Where overseas? The Top 5 Destinations for Honours Bachelor Degree, Master's and Doctorate Graduates
Table 1.9 illustrates the most popular destinations for graduates employed overseas. For both Honours Bachelor Degree and Master's and Doctorate graduates, the most popular country was the United Kingdom, followed by the USA. For Honours Bachelor Degree graduates, other common destinations included the United Arab Emirates, Spain and France. For Master's and Doctorate graduates employed overseas, Germany, France and China were popular destinations for seeking employment.
Table 1.9: The Top 5 Overseas Destinations for Graduates, Class of 2016
HONOURS BACHELOR DEGREE MASTER'S & DOCTORATES
1 United Kingdom United Kingdom
2 USA USA
3 United Arab Emirates Germany
4 Spain France
5 France China
WH
AT D
O G
RA
DU
ATES
DO
? TH
E CL
ASS
OF
2016
28
SECTION 1: FIRST DESTINATION OF 2016 GRADUATES
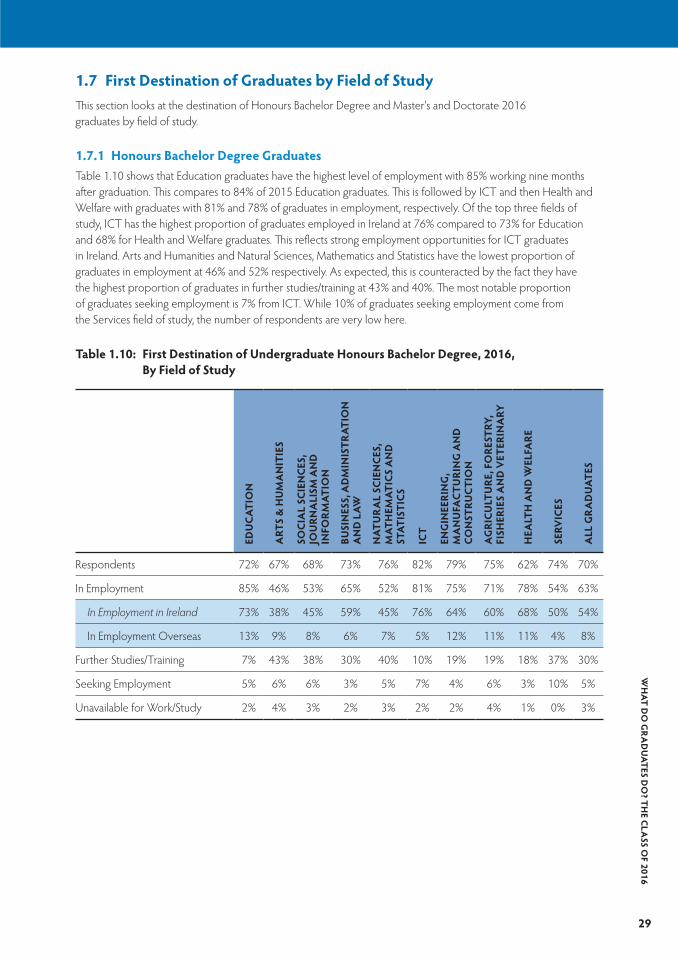
1.7 First Destination of Graduates by Field of StudyThis section looks at the destination of Honours Bachelor Degree and Master's and Doctorate 2016 graduates by field of study.
1.7.1 Honours Bachelor Degree GraduatesTable 1.10 shows that Education graduates have the highest level of employment with 85% working nine months after graduation. This compares to 84% of 2015 Education graduates. This is followed by ICT and then Health and Welfare with graduates with 81% and 78% of graduates in employment, respectively. Of the top three fields of study, ICT has the highest proportion of graduates employed in Ireland at 76% compared to 73% for Education and 68% for Health and Welfare graduates. This reflects strong employment opportunities for ICT graduates in Ireland. Arts and Humanities and Natural Sciences, Mathematics and Statistics have the lowest proportion of graduates in employment at 46% and 52% respectively. As expected, this is counteracted by the fact they have the highest proportion of graduates in further studies/training at 43% and 40%. The most notable proportion of graduates seeking employment is 7% from ICT. While 10% of graduates seeking employment come from the Services field of study, the number of respondents are very low here.
Table 1.10: First Destination of Undergraduate Honours Bachelor Degree, 2016, By Field of Study
EDU
CAT
ION
ART
S &
HU
MA
NIT
IES
SOCI
AL
SCIE
NCE
S,
JOU
RNA
LISM
AN
D
INFO
RM
ATIO
N
BUSI
NES
S, A
DM
INIS
TRAT
ION
A
ND
LAW
NAT
UR
AL
SCIE
NCE
S,
MAT
HEM
ATIC
S A
ND
ST
ATIS
TICS
ICT
ENG
INEE
RIN
G,
MA
NU
FACT
URI
NG
AN
D
CON
STRU
CTIO
N
AG
RICU
LTU
RE, F
ORE
STRY
, FI
SHER
IES
AN
D V
ETER
INA
RY
HEA
LTH
AN
D W
ELFA
RE
SERV
ICES
ALL
GR
AD
UAT
ES
Respondents 72% 67% 68% 73% 76% 82% 79% 75% 62% 74% 70%
In Employment 85% 46% 53% 65% 52% 81% 75% 71% 78% 54% 63%
In Employment in Ireland 73% 38% 45% 59% 45% 76% 64% 60% 68% 50% 54%
In Employment Overseas 13% 9% 8% 6% 7% 5% 12% 11% 11% 4% 8%
Further Studies/Training 7% 43% 38% 30% 40% 10% 19% 19% 18% 37% 30%
Seeking Employment 5% 6% 6% 3% 5% 7% 4% 6% 3% 10% 5%
Unavailable for Work/Study 2% 4% 3% 2% 3% 2% 2% 4% 1% 0% 3%
WH
AT DO
GR
AD
UATES D
O? TH
E CLASS O
F 2016
29

1.7.2 Master's and Doctorate GraduatesTable 1.11 outlines the first destination of Master's and Doctorate graduates by field of study. Education graduates have the highest proportion of employment at 90%, with 82% employed in Ireland. Business, Administration and Law and Engineering, Agriculture, Forestry, Fisheries and Veterinary10, Engineering Manufacturing and Construction and ICT graduates also experienced high levels of employment at 87%, 83%, 82% and 81% respectively, with 67%, 83%, 66% and 71% employed in Ireland. Postgraduates from five fields of study experienced below average (i.e. 81%) employment: Arts and Humanities (65%), Social Sciences, Journalism and Information (77%), Natural Sciences, Mathematics and Statistics (77%), Services (77%) and Health and Welfare (80%). 15% of Arts and Humanities graduates are still ‘seeking employment’ nine months after graduation. A similar figure is reported for Service graduates in this category. However, it must be noted that there was a relatively low number of respondents in this cohort.
Table 1.11: First Destination of Master's and Doctorate Graduates, 2016, By Field of StudyED
UC
ATIO
N
ART
S &
HU
MA
NIT
IES
SOCI
AL
SCIE
NCE
S,
JOU
RNA
LISM
AN
D
INFO
RM
ATIO
N
BUSI
NES
S, A
DM
INIS
TRAT
ION
A
ND
LAW
NAT
UR
AL
SCIE
NCE
S,
MAT
HEM
ATIC
S A
ND
ST
ATIS
TICS
ICT
ENG
INEE
RIN
G,
MA
NU
FACT
URI
NG
AN
D
CON
STRU
CTIO
N
AG
RICU
LTU
RE, F
ORE
STRY
, FI
SHER
IES
AN
D V
ETER
INA
RY
HEA
LTH
AN
D W
ELFA
RE
SERV
ICES
ALL
GR
AD
UAT
ES
Respondents 63% 59% 65% 68% 67% 68% 70% 55% 61% 71% 65%
In Employment 90% 65% 77% 87% 77% 81% 82% 83% 80% 77% 81%
In employment in Ireland 82% 53% 59% 67% 64% 71% 66% 83% 71% 63% 66%
In employment overseas 8% 12% 17% 20% 13% 11% 16% 0% 9% 15% 15%
Further Studies/Training 1% 14% 8% 4% 12% 5% 10% 17% 12% 8% 8%
Seeking Employment 7% 15% 11% 8% 9% 12% 7% 0% 6% 15% 9%
Unavailable for Work/Study 1% 6% 3% 1% 2% 2% 2% 0% 1% 0% 2%
10 Note that the number of respondents in the Agriculture, Forestry, Fisheries and Veterinary field of study is very low.
WH
AT D
O G
RA
DU
ATES
DO
? TH
E CL
ASS
OF
2016
30
SECTION 1: FIRST DESTINATION OF 2016 GRADUATES

1.8 First Destination of Honours Bachelor Degree Graduates by Level of Award
This section reviews the first destination of graduates by level of award for five universities11. Figure 1.4 illustrates relatively high levels of employment for all award levels of Honours Bachelor Degree graduates. Those graduates awarded with a second class honours degree demonstrate the highest levels of employment at 67% whereas those who received a first class (1H) degree have the lowest levels of employment at 59%. The reverse is true for rates of progression into further study; 35% of graduates with a 1H degree continue to further study, compared to 24% of those with a 2H2 degree. 24% of graduates with a pass degree also progress to further study. One potential factor influencing this trend is the quality of award that is required to gain entry into postgraduate study.
Figure 1.4: First Destination of Honours Bachelor Degree Graduates by Award Class, 2016
0%10%20%30%40%50%60%70%80%90%
100%
All GraduatesAll OtherAward Classes
Pass2H22H11H
59% 63% 67% 64% 66% 63%
35%30% 24% 24% 25% 29%
4% 5% 7% 7% 9% 5%
2% 3% 3% 5% 1% 3%
Employed Studying Seeking Employment Unavailable for Work
11 This analysis does not include NUIG or TCD, as such data was either not provided or a high proportion of blank data was returned.
WH
AT DO
GR
AD
UATES D
O? TH
E CLASS O
F 2016
31

SECTION 2: RELEVANCE OF QUALIFICATION

RELEVANCE OF QUALIFICATION
33
This section looks at the question of how relevant graduates rated their qualification to employment gained. The data is examined by field of study.

EMPLOYED IN IRELAND
71%of Honours Bachelor Degree graduates rate the relevance of their qualification as relevant or most relevant to their area of employment.
Higher and Postgraduate Diploma graduates are more likely than Honours Bachelor Degree graduates to rate their qualifications as relevant or most relevant to their work, at
86%.
81%of Master's and Doctorate graduates rate the relevance of their qualification as relevant or most relevant, while
9%rate it as irrelevant/most irrelevant.
EMPLOYED OVERSEAS
76%of Honours Bachelor Degree graduates find their educational qualification relevant/most relevant to their employment, compared to
80% with a Master's/Doctorate.
Higher & Postgraduate graduates have slightly lower levels of satisfaction with
75%reporting their qualification as relevant/most relevant to their employment.
KEY POINTS
SECTION 2:Relevance of Qualification
WH
AT D
O G
RA
DU
ATES
DO
? TH
E CL
ASS
OF
2016
34

EMPLOYED IN IRELAND AND OVERSEAS
Health & Welfare, Agriculture, Forestry, Fisheries & Veterinary and Education Honours Bachelor Degree graduates report high levels of relevance of their education to their area of employment, at 93%, 90% and 88% respectively.
93% Health & Welfare
90% Agriculture, Forestry, Fisheries & Veterinary
88% Education
At Higher and Postgraduate Diploma level,
98%of Health & Welfare and 86% of Education graduates consider their qualification to be relevant/most relevant to their area of employment.
92%Health and Welfare
92%Education
90%Engineering, Manufacturing & Construction.
As expected, the majority of Master's/Doctorate graduates report high levels of relevance of their education to their employment. Fields that most highly rate their education as relevant include Health and Welfare (92%), Education (92%) and Engineering, Manufacturing & Construction (90%).
High proportions of Arts and Humanities Honours Bachelor Degree graduates (50%) and Master & Doctorate graduates (26%) rate their education as irrelevant/most irrelevant to their employment. 31% of Higher & Postgraduate graduates rate their education as irrelevant/most irrelevant to their employment.
WH
AT DO
GR
AD
UATES D
O? TH
E CLASS O
F 2016
35

2.1 Relevance of QualificationSurvey respondents12 who found employment were asked to rate the relevance of their educational qualification to their area of employment on 1-5 scale: 1. Most Relevant, 2. Relevant, 3. Unsure, 4. Irrelevant, 5. Most Irrelevant. Relevance data was returned on behalf of six universities only. Therefore, it is important to note that the employment data in this section does not correspond to section one.
2.1.1 Relevance of Qualification to Employment for Graduates Employed in IrelandIn analysing the available data, 55% of Honours Bachelor Degree, 70% of Higher and Postgraduate Diploma and 69% of Master's and Doctorate graduates found employment in Ireland.
Figure 2.1 outlines the relevance of qualification to employment across all graduate levels.
Figure 2.1: Relevance of Qualification to Employment, Honours Bachelor Degree and Higher & Postgraduate Diploma, 2016 Graduates in Employment in Ireland
Honours Bachelor Degree – Relevance of Qualification to Employment Gained
Higher and Postgraduate Diploma – Relevance of Qualification to Employment Gained
71%
9%
20%
Relevant/Most Relevant
Irrelevant/Most Irrelevant
Unsure
86%
6%
8%
Relevant/Most Relevant
Irrelevant/Most Irrelevant
Unsure
Of those employed in Ireland, 71% of Honours Bachelor Degree graduates rate the relevance of their qualification as relevant or most relevant to their area of employment. A total of 20% rate their qualification as irrelevant/most irrelevant and 9% were unsure. Perhaps not surprisingly, Higher and Postgraduate Diploma graduates were more likely than Honours Bachelor Degree graduates to rate their qualifications as relevant and most relevant to their work, with 86% of graduates in this category. In addition, 8% rate their qualifications as irrelevant/most irrelevant while 6% remain unsure.
Figure 2.2 outlines how Master's and Doctorate graduates (employed in Ireland) rate the relevance of their qualification to employment. 81% of such graduates rate their qualification as relevant or most relevant, while 9% rate their educational qualification as irrelevant/most irrelevant. A further 10% remain unsure as to the relevance of their qualification.
12 Data available for six universities only (excluding TCD).
WH
AT D
O G
RA
DU
ATES
DO
? TH
E CL
ASS
OF
2016
36
SECTION 2: RELEVANCE OF QUALIFICATION

Figure 2.2: Relevance of Qualification to Employment, Master's and Doctorate, 2016 Graduates
Master's & Doctorate – Relevance of Qualification to Employment Gained
81%
10%
9%
Relevant/Most Relevant
Irrelevant/Most Irrelevant
Unsure
The finding that postgraduates are more likely than graduates to consider their qualification relevant/most relevant to their employment is not unexpected, given that postgraduate qualifications are more specialised in most cases. Such differences are most pronounced between Honours Bachelor Degree and Higher/Postgraduate Diploma graduates.
2.1.2 Relevance of Qualification to Employment for Graduates in Employment OverseasThis section looks at the relevance of qualification for those who found employment overseas13. In analysing available data, 7% of Honours Bachelor Degree, 3% of Higher and Postgraduate Diploma and 13% of Master's/Doctorate graduates found employment overseas.
Table 2.1: Relevance of Qualification to Employment for Graduates in Employment Overseas, 2016
HONOURS BACHELOR
DEGREE
HIGHER & POSTGRADUATE
DIPLOMA
MASTER'S/ DOCTORATE
Total % in Employment – Overseas 7% 3% 13%
Relevant/Most Relevant 76% 75% 80%
Irrelevant/Most Irrelevant 13% 4% 5%
Unsure 11% 21% 14%
13 Data based on six universities only (excluding TCD).
WH
AT DO
GR
AD
UATES D
O? TH
E CLASS O
F 2016
37
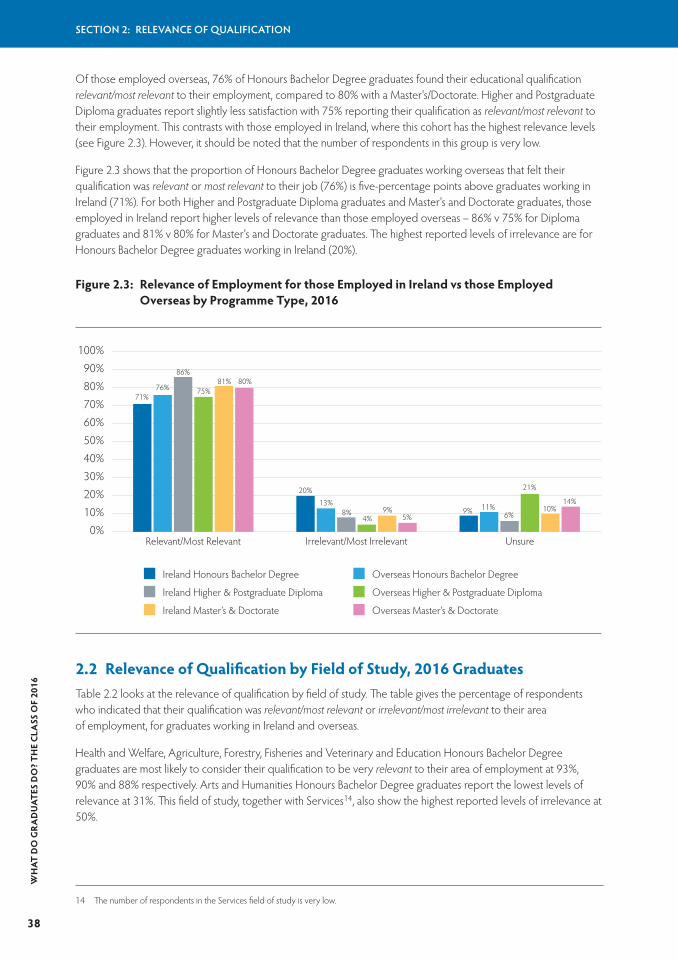
Of those employed overseas, 76% of Honours Bachelor Degree graduates found their educational qualification relevant/most relevant to their employment, compared to 80% with a Master's/Doctorate. Higher and Postgraduate Diploma graduates report slightly less satisfaction with 75% reporting their qualification as relevant/most relevant to their employment. This contrasts with those employed in Ireland, where this cohort has the highest relevance levels (see Figure 2.3). However, it should be noted that the number of respondents in this group is very low.
Figure 2.3 shows that the proportion of Honours Bachelor Degree graduates working overseas that felt their qualification was relevant or most relevant to their job (76%) is five-percentage points above graduates working in Ireland (71%). For both Higher and Postgraduate Diploma graduates and Master's and Doctorate graduates, those employed in Ireland report higher levels of relevance than those employed overseas – 86% v 75% for Diploma graduates and 81% v 80% for Master's and Doctorate graduates. The highest reported levels of irrelevance are for Honours Bachelor Degree graduates working in Ireland (20%).
Figure 2.3: Relevance of Employment for those Employed in Ireland vs those Employed Overseas by Programme Type, 2016
0%10%20%30%40%50%60%70%80%90%
100%
UnsureIrrelevant/Most IrrelevantRelevant/Most Relevant
71%76%
86%
75%81% 80%
9% 11%6%
21%
10%14%
20%13%
8%4%
9%5%
Ireland Honours Bachelor Degree Overseas Honours Bachelor Degree
Ireland Higher & Postgraduate Diploma Overseas Higher & Postgraduate Diploma
Ireland Master’s & Doctorate Overseas Master’s & Doctorate
2.2 Relevance of Qualification by Field of Study, 2016 GraduatesTable 2.2 looks at the relevance of qualification by field of study. The table gives the percentage of respondents who indicated that their qualification was relevant/most relevant or irrelevant/most irrelevant to their area of employment, for graduates working in Ireland and overseas.
Health and Welfare, Agriculture, Forestry, Fisheries and Veterinary and Education Honours Bachelor Degree graduates are most likely to consider their qualification to be very relevant to their area of employment at 93%, 90% and 88% respectively. Arts and Humanities Honours Bachelor Degree graduates report the lowest levels of relevance at 31%. This field of study, together with Services14, also show the highest reported levels of irrelevance at 50%.
14 The number of respondents in the Services field of study is very low.
WH
AT D
O G
RA
DU
ATES
DO
? TH
E CL
ASS
OF
2016
38
SECTION 2: RELEVANCE OF QUALIFICATION

At Higher and Postgraduate Diploma level, Health and Welfare graduates and Education graduates report the high levels of relevance at 98% and 86% respectively. Arts and Humanities graduates report the lowest levels of relevance at 50%. 31% of Social Sciences, Journalism and Information graduates report that their qualification is irrelevant to their employment.
As expected, the majority of Master's/Doctorate graduates reported high levels of relevance of their education to their employment. Health and Welfare and Education graduates report the highest level of relevance among Master's and Doctorate students, with 92% of such graduates reporting their education as relevant/most relevant to their employment. Other fields of study that rated their education as relevant/most relevant include Engineering, Manufacturing and Construction graduates (90%) and ICT graduates (87%). While 100% of Agriculture, Forestry, Fisheries and Veterinary graduates reported that their education was relevant/most relevant, the number of respondents was extremely low. 63% of Arts and Humanities graduates report relevant/most relevant, with 26% reporting irrelevant/most irrelevant.
Table 2.2: Relevance of Qualification by Field of Study, 2016 Graduates
HONOURS BACHELOR DEGREE
HIGHER & POSTGRADUATE
DIPLOMA
MASTER'S & DOCTORATE
RELEVANT/MOST
RELEVANT
IRRELEVANT/MOST
IRRELEVANT
RELEVANT/MOST
RELEVANT
IRRELEVANT/MOST
IRRELEVANT
RELEVANT/MOST
RELEVANT
IRRELEVANT/MOST
IRRELEVANT
Education 88% 6% 86% 10% 92% 4%
Arts & Humanities 31% 50% 50% 28% 63% 26%
Social Sciences, Journ. & Info. 41% 46% 60% 31% 74% 16%
Business, Admin. & Law 79% 11% 66% 18% 75% 5%
Natural Sciences, Math. & Stat. 69% 21% 73% 7% 83% 11%
ICT 83% 9% 83% 9% 87% 5%
Engin., Manufact. & Const. 80% 12% 76% 8% 90% 6%
Agri., Forestry, Fish. & Vet. 90% 8% N/A N/A 100% 0%
Health & Welfare 93% 4% 98% 2% 92% 5%
Services 39% 50% 91% 0% 81% 11%
All Graduates 71% 20% 86% 8% 81% 8%
WH
AT DO
GR
AD
UATES D
O? TH
E CLASS O
F 2016
39

SECTION 3: GRADUATE SALARIES
GRADUATE SALARIES
41
This section outlines the reported salaries of employed graduates nine months after graduation. Salaries are self-reported and the response rates vary by level and field of study. As a consequence, caution should be shown when interpreting the findings.
KEY POINTS
SECTION 3:Graduate Salaries
WH
AT D
O G
RA
DU
ATES
DO
? TH
E CL
ASS
OF
2016
42
40%of 2016 Honours Bachelor Degree graduates command a salary of less than
€25k(compared to 47% of last year’s cohort).
The highest proportion of those earning
€37kor over were in the South East (11%) and West (11%) regions (Honours Bachelor Degree graduates).
As expected there is an apparent positive correlation between education and salary – as education increases so too does salary. 40% of Honours Bachelor Degree graduates earn under
€25kbut this drops to 9% for Doctorate graduates.
35% of Doctorate graduates report earning over
€45kcompared to 18% of Higher Diploma and 3% of Honours Bachelor Degree graduates.
Arts and Humanities Honours Bachelor Degree graduates are the least well paid, with 15% earning less than
€13k .
The largest proportion of Honours Bachelor Degree Health and Welfare (32%), Education (32%), ICT (29%), Engineering, Manufacturing and Construction (28%), ICT (29%) and Natural Sciences, Mathematics and Statistics (21%) graduates are earning between
€29k & €33k.
Overall, ICT, Engineering, Manufacturing and Construction and Health and Welfare Honours Bachelor Degree graduates are the highest earners, with 38%, 28% and 28% of such graduates earning
€33k or over respectively.

3.1 Graduate Salaries by Level of QualificationThis section outlines the reported salaries of employed graduates, nine months after graduation. The salary data is reported by graduates themselves and it is important to note that the response rates for this section of the graduate survey are low.
Table 3.1 gives the salary range of 2016 and 2015 graduates in employment by qualification type. There has been an increase in salary for Honours Bachelor Degree graduates in 2016. 40% of 2016 Honours Bachelor Degree graduates command an initial salary of less than €25,000, compared to 47% for the 2015 cohort. Likewise, a higher proportion (56%) are earning between €25,000 and €45,000, when compared to the previous year (50%). The proportions gaining initial salaries between €25,000 and €45,000 have increased at all levels of qualification in 2016.
Table 3.1: 2016 Graduate Salaries by Level of Qualification Compared to 2015 Graduate Salaries
SALARY BANDS
LEVEL OF QUALIFICATION < €25,000 €25,000-€45,000 > €45,000
2016 2015 2016 2015 2016 2015
Honours Bachelor Degree 40% 47% 56% 50% 3% 3%
Higher Diploma 24% 41% 57% 54% 18% 5%
Postgraduate Diploma 8% 12% 55% 54% 37% 34%
Master's Taught 29% 30% 59% 56% 12% 14%
Master's Research 15% 30% 67% 44% 18% 26%
Doctorate 9% 15% 57% 54% 35% 31%
Figure 3.1: Graduates in Employment – Salary Range and Qualification, 2016
0%10%20%30%40%50%60%70%80%90%
100%
DoctorateMaster’sResearch
Master’sTaught
PostgraduateDiploma
HigherDiploma
HonoursBachelorDegree
40% 24% 8% 29% 15% 9%
56%57%
55%
59% 67%
57%
3% 18% 37% 12% 18% 35%
< €25,000 €25,000-€45,000 > €45,000
WH
AT DO
GR
AD
UATES D
O? TH
E CLASS O
F 2016
43

As one would expect, Figure 3.1 shows an apparent correlation between education and salary – as education increases so too does salary. 40% of Honours Bachelor Degree graduates earn under €25,000 but this drops to 9% for Doctorate graduates. 35% of Doctorate graduates report earning over €45,000 compared to 3% of Honours Bachelor Degree graduates. The largest proportion earning over €45,000 is 37% of Postgraduate Diploma graduates.
3.2 Salaries by Field of Study for Honours Bachelor Degree GraduatesTable 3.2 highlights the most commonly reported initial salaries of Honours Bachelor Degree graduates by field of study. The most common salary band for those who graduated from Health and Welfare, Education, ICT, Engineering, Manufacturing and Construction and Natural Sciences, Mathematics and Statistics is €29,000-€32,999, with 32%, 38%, 29%, 28% and 21% of graduates indicating this salary bracket. 25% of Arts and Humanities graduates report earning between €21,000 and €24,999 but this cohort are also the least well paid, with 15% earning less than €12,999. For those who graduated in 2016 from Social Sciences, Journalism and Information and Business, Administration and Law, the most common salary is between €21,000 and €24,999 (32% and 39% respectively).
For Agriculture, Forestry, Fisheries and Veterinary 2016 graduates, 24% reported earning between €21,000 and €24,999 and a further 24% reported earning between €25,000 and €28,999, nine months after graduation. Overall, ICT, Engineering, Manufacturing and Construction and Health and Welfare Honours Bachelor Degree graduates are the highest earners, with 38%, 28% and 28% of such graduates earning €33k or over respectively.
Table 3.2: Honours Bachelor Degree by Field of Study, 2016 Graduates
SALARY BANDS EDU
CAT
ION
ART
S &
HU
MA
NIT
IES
SOCI
AL
SCIE
NCE
S,
JOU
RNA
LISM
&
INFO
RM
ATIO
N
BUSI
NES
S,
AD
MIN
ISTR
ATIO
N
& L
AW
NAT
UR
AL
SCIE
NCE
S,
MAT
HEM
ATIC
S &
ST
ATIS
TICS
INFO
RM
ATIO
N &
CO
MM
UN
ICAT
ION
TE
CHN
OLO
GIE
S (I
CTS)
ENG
INEE
RIN
G,
MA
NU
FACT
URI
NG
&
CON
STRU
CTIO
N
AG
RICU
LTU
RE,
FORE
STRY
, FIS
HER
IES
& V
ETER
INA
RY
HEA
LTH
&
WEL
FARE
SERV
ICES
<€12,999 9% 15% 11% 2% 7% 3% 2% 1% 3% 9%
€13,000-€16,999 9% 11% 8% 3% 6% 1% 1% 2% 2% 30%
€17,000-€20,999 10% 18% 16% 7% 10% 4% 6% 8% 5% 22%
€21,000-€24,999 15% 25% 32% 39% 14% 8% 14% 24% 8% 26%
€25,000-€28,999 18% 18% 18% 23% 19% 18% 21% 24% 16% 13%
€29,000-€32,999 32% 5% 8% 14% 21% 29% 28% 15% 38% 0%
€33,000-€36,999 6% 3% 2% 5% 13% 18% 15% 15% 16% 0%
€37,000-€40,999 0% 2% 1% 3% 5% 6% 7% 5% 5% 0%
€41,000-€44,999 0% 0% 1% 2% 2% 4% 2% 0% 2% 0%
€45,000+ 1% 1% 3% 3% 3% 9% 4% 5% 4% 0%
Total 100% 100% 100% 100% 100% 100% 100% 100% 100% 100%
Total Respondents (excl. unknown) 177 630 374 1,155 609 386 454 169 1,025 23
Total Graduates 354 3,407 1,491 3,079 2,276 692 1,035 373 3,200 70
% Response Rate 50% 18% 25% 38% 27% 56% 44% 45% 32% 33%WH
AT D
O G
RA
DU
ATES
DO
? TH
E CL
ASS
OF
2016
44
SECTION 3: GRADUATE SALARIES

3.3 Salaries by Grade of Honours Bachelor Degree GraduatesFigure 3.2 outlines the most common reported salary by grade for Honours Bachelor Degree graduates, who are employed nine months after graduation. The data15 shows salaries for graduates with first class honours peak in the €21,000 to €24,999 salary bracket. Similarly, those graduates with a second class honours grade one also peak in this salary bracket while it peaks at €25,000 to €28,999 for graduates with a second class honours grade two. 39% of Pass degree16 graduates earn greater than €37,000 nine months after graduation followed next by first class honours degree (H1) graduates at 26%.
Figure 3.2: Salaries by Grade, Level 8 Honours Bachelor Degree Graduates, 2016
0%
5%
10%
15%
20%
25%
30%
€17,000-€20,999
€13,000-€16,999
€21,000-€24,999
€25,000-€28,999
€29,000-€32,999
€33,000-€36,999
€37,000-€40,999
€41,000-€44,999
€45,000+<€12,999
H1 2H1 2H2 Pass Other
3.4 Salaries by Region of Employment of Honours Bachelor Degree GraduatesFigure 3.3 presents the reported salaries of Honours Bachelor Degree graduates, nine months after graduation, in different regions throughout the Republic of Ireland17. At national level (based on all responses where region data is returned), 22% report earning between €21,000 and €24,999, while a further 22% report earning between €29,000 and €32,999. The figures show that the largest proportion of graduates earning between €21,000 and €24,999 are employed in the Dublin (24%) and South East (21%) regions. The salaries of graduates employed in Dublin are most likely to fall into the €21,000-€24,999 (24%) and €29,000 and €32,999 (22%) brackets. The highest proportion of those earning €37,000 or over are in the South East and West (both 11%) regions. The Border region has the highest proportion of graduates earning less than €12,999 (10%).
15 This analysis does not include NUIG or TCD, as such data was not provided or the data returned was predominately blank data.16 The number of respondents in this category is relatively low.17 This analysis does not include TCD, as such data was not provided.
WH
AT DO
GR
AD
UATES D
O? TH
E CLASS O
F 2016
45
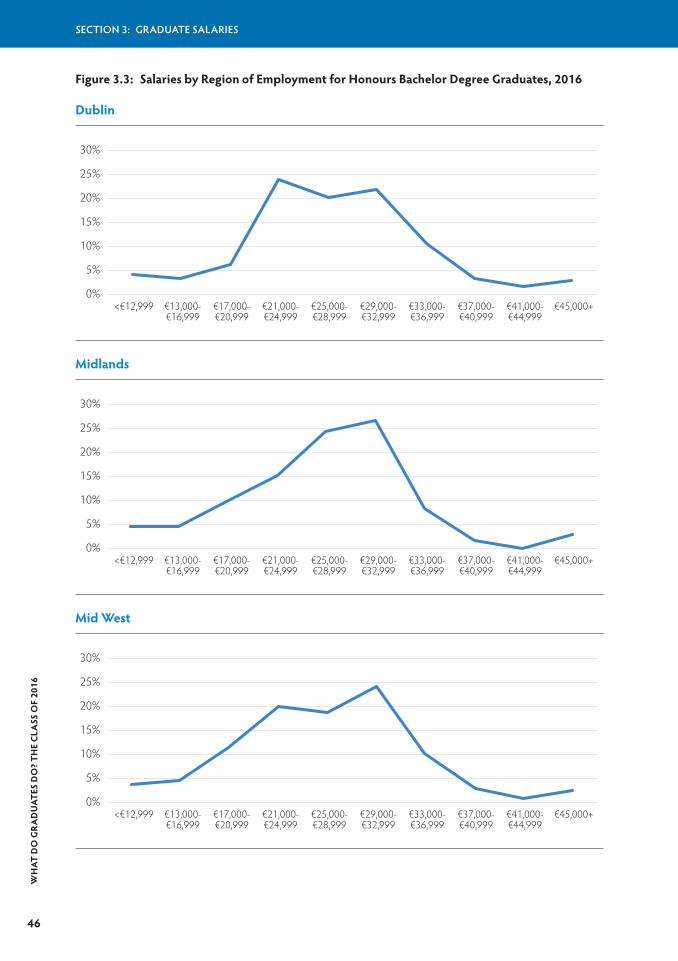
Figure 3.3: Salaries by Region of Employment for Honours Bachelor Degree Graduates, 2016
Dublin
0%
5%
10%
15%
20%
25%
30%
€17,000-€20,999
€13,000-€16,999
€21,000-€24,999
€25,000-€28,999
€29,000-€32,999
€33,000-€36,999
€37,000-€40,999
€41,000-€44,999
€45,000+<€12,999
Midlands
0%
5%
10%
15%
20%
25%
30%
€17,000-€20,999
€13,000-€16,999
€21,000-€24,999
€25,000-€28,999
€29,000-€32,999
€33,000-€36,999
€37,000-€40,999
€41,000-€44,999
€45,000+<€12,999
Mid West
0%
5%
10%
15%
20%
25%
30%
€17,000-€20,999
€13,000-€16,999
€21,000-€24,999
€25,000-€28,999
€29,000-€32,999
€33,000-€36,999
€37,000-€40,999
€41,000-€44,999
€45,000+<€12,999
WH
AT D
O G
RA
DU
ATES
DO
? TH
E CL
ASS
OF
2016
46
SECTION 3: GRADUATE SALARIES

South East
0%
5%
10%
15%
20%
25%
30%
€17,000-€20,999
€13,000-€16,999
€21,000-€24,999
€25,000-€28,999
€29,000-€32,999
€33,000-€36,999
€37,000-€40,999
€41,000-€44,999
€45,000+<€12,999
South West
0%
5%
10%
15%
20%
25%
30%
€17,000-€20,999
€13,000-€16,999
€21,000-€24,999
€25,000-€28,999
€29,000-€32,999
€33,000-€36,999
€37,000-€40,999
€41,000-€44,999
€45,000+<€12,999
West
0%
5%
10%
15%
20%
25%
30%
€17,000-€20,999
€13,000-€16,999
€21,000-€24,999
€25,000-€28,999
€29,000-€32,999
€33,000-€36,999
€37,000-€40,999
€41,000-€44,999
€45,000+<€12,999
WH
AT DO
GR
AD
UATES D
O? TH
E CLASS O
F 2016
47

Border
0%
5%
10%
15%
20%
25%
30%
€17,000-€20,999
€13,000-€16,999
€21,000-€24,999
€25,000-€28,999
€29,000-€32,999
€33,000-€36,999
€37,000-€40,999
€41,000-€44,999
€45,000+<€12,999
Mid East
0%
5%
10%
15%
20%
25%
30%
€17,000-€20,999
€13,000-€16,999
€21,000-€24,999
€25,000-€28,999
€29,000-€32,999
€33,000-€36,999
€37,000-€40,999
€41,000-€44,999
€45,000+<€12,999
National
0%
5%
10%
15%
20%
25%
30%
€17,000-€20,999
€13,000-€16,999
€21,000-€24,999
€25,000-€28,999
€29,000-€32,999
€33,000-€36,999
€37,000-€40,999
€41,000-€44,999
€45,000+<€12,999
WH
AT D
O G
RA
DU
ATES
DO
? TH
E CL
ASS
OF
2016
48
SECTION 3: GRADUATE SALARIES

3.5 Salaries by Gender for Honours Bachelor Degree GraduatesFigure 3.4 shows salary by gender for 2016 Honours Bachelor Degree graduates. 7% of females who responded to the salary question reported earning less than €12,999, compared to 4% of males. Females were most likely to report earning between €21,000 and €24,999 while males were most likely to report between €29,000 and €32,999. Despite relatively low numbers, it is interesting that 7% of males earn over €41,000, compared to just 3% of female respondents.
Figure 3.4: Salaries by Gender for Honours Bachelor Degree Graduates, 2016
0%
5%
10%
15%
20%
25%
€17,000-€20,999
€13,000-€16,999
€21,000-€24,999
€25,000-€28,999
€29,000-€32,999
€33,000-€36,999
€37,000-€40,999
€41,000-€44,999
€45,000+<€12,999
Males Females
The most common reported salary bands for each field of study are highlighted in Table 3.3. The most common initial salaries fell into the same bands for both males and females in six of the ten faculties – the exceptions being Arts and Humanities, Natural Sciences, Mathematics and Statistics, Agriculture, Forestry, Fisheries and Veterinary and Services. The greatest proportion of graduates who earn less than €12,99918 are females from Arts and Humanities (16%) while 13% of their male counterparts earned the same. 34% of male Health and Welfare graduates reported earning €29,000-€32,999 compared to 40% of their female counterparts. However, 45% of male Health and Welfare graduates report earning more than €33,000 compared to 22% of female graduates. Caution must be shown when interpreting the results due to the varying, and often low, response rates for certain fields of study.
18 Note that the numbers in the Services field of study are too low to report here.
WH
AT DO
GR
AD
UATES D
O? TH
E CLASS O
F 2016
49

Tabl
e 3.
3: S
alar
ies f
or H
onou
rs B
ache
lor D
egre
e G
radu
ates
by
Gen
der a
nd F
ield
of S
tudy
, 201
6
SALA
RY B
AN
DS
EDUCATION
ARTS & HUMANITIES
SOCIAL SCIENCES, JOURNALISM & INFORMATION
BUSINESS, ADMINISTRATION & LAW
NATURAL SCIENCES, MATHEMATICS & STATISTICS
INFORMATION & COMMUNICATION TECHNOLOGIES (ICTS)
ENGINEERING, MANUFACTURING & CONSTRUCTION
AGRICULTURE, FORESTRY, FISHERIES & VETERINARY
HEALTH & WELFARE
SERVICES
MF
MF
MF
MF
MF
MF
MF
MF
MF
MF
<€12
,999
9%10
%13
%16
%11
%11
%3%
2%4%
9%3%
3%1%
3%1%
1%2%
3%0%
29%
€13,
000-
€16,
999
8%11
%11
%11
%6%
9%2%
4%4%
8%1%
0%1%
1%0%
3%2%
3%25
%43
%
€17,
000-
€20,
999
14%
6%22
%16
%15
%16
%6%
9%10
%11
%3%
6%5%
6%11
%6%
5%5%
31%
0%
€21,
000-
€24,
999
14%
15%
19%
28%
25%
38%
36%
41%
12%
15%
8%10
%13
%17
%23
%26
%6%
9%25
%29
%
€25,
000-
€28,
999
20%
14%
20%
18%
21%
16%
23%
23%
17%
21%
19%
13%
18%
33%
28%
20%
7%19
%19
%0%
€29,
000-
€32,
999
28%
37%
6%5%
10%
7%16
%12
%25
%17
%28
%34
%29
%25
%16
%15
%34
%40
%0%
0%
€33,
000-
€36,
999
8%5%
2%3%
4%0%
6%4%
14%
13%
19%
15%
17%
9%9%
20%
21%
15%
0%0%
€37,
000-
€40,
999
0%0%
3%1%
2%0%
4%2%
8%2%
6%7%
8%5%
5%4%
11%
3%0%
0%
€41,
000-
€44,
999
0%0%
0%0%
1%1%
2%2%
3%2%
4%6%
3%0%
0%0%
4%1%
0%0%
€45,
000+
0%2%
2%1%
5%1%
3%2%
4%2%
10%
6%4%
0%7%
4%9%
3%0%
0%
Tota
l10
0%10
0%10
0%10
0%10
0%10
0%10
0%10
0%10
0%10
0%10
0%10
0%10
0%10
0%10
0%10
0%10
0%10
0%10
0%10
0%
Tota
l Res
pond
ents
(exc
l. unk
now
n)93
8421
741
317
020
459
156
428
832
131
868
359
9575
9426
576
016
7
Tota
l Gra
duat
es17
018
41,
287
2,12
066
782
41,
589
1,49
01,
109
1,16
756
712
581
222
316
620
783
52,
365
4822
% R
espo
nse
Rate
55%
46%
17%
19%
25%
25%
37%
38%
26%
28%
56%
54%
44%
43%
45%
45%
32%
32%
33%
32%
WH
AT D
O G
RA
DU
ATES
DO
? TH
E CL
ASS
OF
2016
50
SECTION 3: GRADUATE SALARIES

WH
AT DO
GR
AD
UATES D
O? TH
E CLASS O
F 2016
51
SECTION 4: REGIONAL DISTRIBUTION OF EMPLOYED GRADUATES
REGIONAL DISTRIBUTION OF EMPLOYED
GRADUATES
53
This section analyses the location of graduate employment for qualification levels 8-1019.
19 This analysis does not include TCD, as data provided identified Ireland as country of employment but the region was not specified.
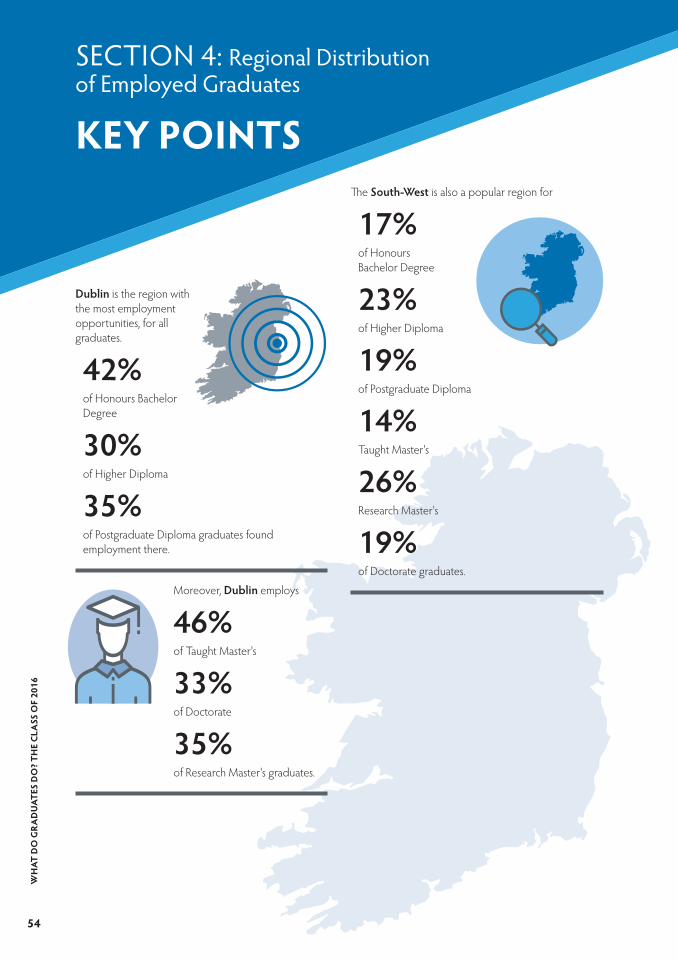
Dublin is the region with the most employment opportunities, for all graduates.
42%of Honours Bachelor Degree
30%of Higher Diploma
35%of Postgraduate Diploma graduates found employment there.
Moreover, Dublin employs
46%of Taught Master's
33%of Doctorate
35%of Research Master's graduates.
The South-West is also a popular region for
17%of Honours Bachelor Degree
23%of Higher Diploma
19%of Postgraduate Diploma
14%Taught Master's
26%Research Master's
19%of Doctorate graduates.
KEY POINTS
SECTION 4: Regional Distribution of Employed Graduates
WH
AT D
O G
RA
DU
ATES
DO
? TH
E CL
ASS
OF
2016
54

4.1 Regional Distribution of Employed GraduatesFigure 4.1 shows the regions of employment for Honours Bachelor Degree graduates, nine months after graduation. Dublin is the region with the most employment opportunities, with 42% of graduates employed there. South West (17%) and Mid-West (9%) are the next two most popular destinations for employed graduates20.
Figure 4.1: Region of Employment of Honours Bachelor Degree Graduates, 2016
0%
5%
10%
15%
20%
25%
30%
35%
40%
45%
DublinSouthWest
WestSouthEast
MidWest
MidEast
MidlandsBorderNorthernIreland
UnknownIreland
Overseas
8%
42%
17%
9%
4%
9%
5%2%3%
1%1%
Under €25,000
Figure 4.2 outlines the region of employment for those who graduated with a Higher and Postgraduate Diploma in 2016. The most common destinations of Higher Diploma and Postgraduate Diploma graduates is Dublin, with 30% and 35% of such graduates finding employment in this region. 23% of Higher Diploma graduates found employment in the South West region, while 22% are employed in the West region. Popular destinations for Postgraduate Diploma graduates are the South West (19%), the Mid-West (15%) and the West (12%) regions.
20 Unknown Ireland data is much lower than last year’s report on 2015 graduates due to the removal of TCD from analysis in this section.
WH
AT DO
GR
AD
UATES D
O? TH
E CLASS O
F 2016
55
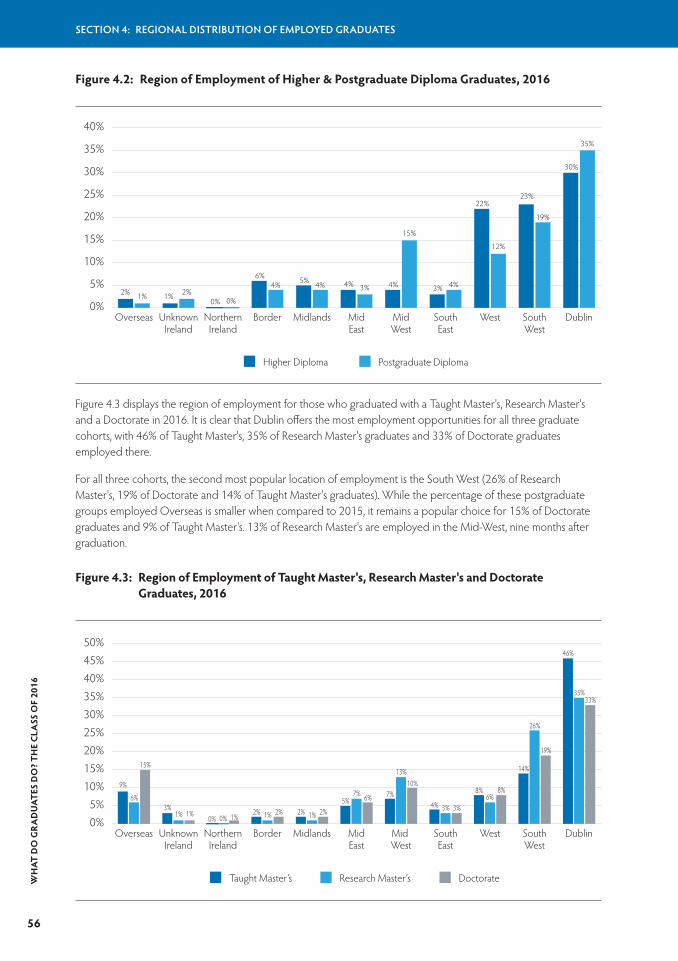
Figure 4.2: Region of Employment of Higher & Postgraduate Diploma Graduates, 2016
0%
5%
10%
15%
20%
25%
30%
35%
40%
DublinSouthWest
WestSouthEast
MidWest
MidEast
MidlandsBorderNorthernIreland
UnknownIreland
Overseas
2% 1% 1% 2%0% 0%
6%4% 5% 4% 4% 3% 4%
15%
3% 4%
22%
12%
23%
19%
30%
35%
Higher Diploma Postgraduate Diploma
Figure 4.3 displays the region of employment for those who graduated with a Taught Master's, Research Master's and a Doctorate in 2016. It is clear that Dublin offers the most employment opportunities for all three graduate cohorts, with 46% of Taught Master's, 35% of Research Master's graduates and 33% of Doctorate graduates employed there.
For all three cohorts, the second most popular location of employment is the South West (26% of Research Master's, 19% of Doctorate and 14% of Taught Master's graduates). While the percentage of these postgraduate groups employed Overseas is smaller when compared to 2015, it remains a popular choice for 15% of Doctorate graduates and 9% of Taught Master's. 13% of Research Master's are employed in the Mid-West, nine months after graduation.
Figure 4.3: Region of Employment of Taught Master's, Research Master's and Doctorate Graduates, 2016
0%5%
10%15%20%25%30%35%40%45%50%
DublinSouthWest
WestSouthEast
Mid West
MidEast
MidlandsBorderNorthernIreland
UnknownIreland
Overseas
9%
6%
15%
3%1% 1%
0% 0% 1%2% 1% 2% 2% 1% 2%
5%7% 6% 7%
13%10%
4% 3%6%
3%
8% 8%
14%
26%
19%
46%
35%33%
Taught Master’s Research Master’s DoctorateWH
AT D
O G
RA
DU
ATES
DO
? TH
E CL
ASS
OF
2016
56
SECTION 4: REGIONAL DISTRIBUTION OF EMPLOYED GRADUATES

WH
AT DO
GR
AD
UATES D
O? TH
E CLASS O
F 2016
57
SECTION 5: SECTORAL DISTRIBUTION OF EMPLOYED GRADUATES

SECTORAL DISTRIBUTION OF EMPLOYED
GRADUATES
59
This section examines the employment sector of those graduates in employment by level of qualification nine months after graduation. The employment sector is broken down by those employed in Ireland and those employed overseas.

EMPLOYED IN THE REPUBLIC OF IRELAND
The most common sector of employment for Honours Bachelor Degree graduates is the Non-Market Services sector at
30%followed by Business, Finance and Insurance Services at
26%.
Non-Market Services sector is also the most popular sector of employment for all other levels of qualification: Higher Diploma (45%), Postgraduate Diploma (80%), Taught Master's (35%), Research Master's (37%) and Doctorate graduates (62%).
Generally, there appears to be a strong relationship between field of study and sector of employment, as expected.
EMPLOYED OVERSEAS
Non-Market sector is most popular for graduates employed overseas, with 46% of Honours Bachelor Degree, 77% of Higher Diploma, 39% of Postgraduate Diploma, 29% of Taught Master's, 83% of Research Master's and 77% of Doctorate graduates employed here.
Non-Market sector is the most popular sector for graduates employed overseas in four of the ten fields of study. The greatest percentage of graduates from Agriculture, Forestry and Fishing; Business, Administration and Law; Engineering, Manufacturing and Construction; and ICT disciplines are also predominantly working overseas in a sector of employment strongly related to their field of study. For Services and Social Sciences, Journalism and Information graduates, the most popular employment sector overseas is in Other Industries.
KEY POINTS
SECTION 5: Sectoral Distribution of Employed Graduates
WH
AT D
O G
RA
DU
ATES
DO
? TH
E CL
ASS
OF
2016
60
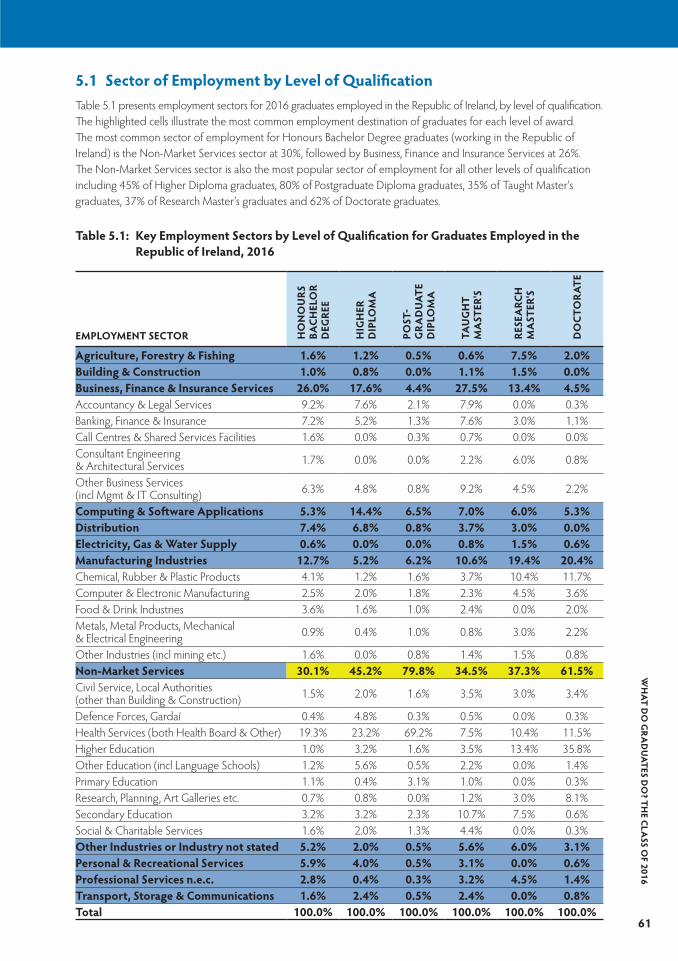
5.1 Sector of Employment by Level of QualificationTable 5.1 presents employment sectors for 2016 graduates employed in the Republic of Ireland, by level of qualification. The highlighted cells illustrate the most common employment destination of graduates for each level of award. The most common sector of employment for Honours Bachelor Degree graduates (working in the Republic of Ireland) is the Non-Market Services sector at 30%, followed by Business, Finance and Insurance Services at 26%. The Non-Market Services sector is also the most popular sector of employment for all other levels of qualification including 45% of Higher Diploma graduates, 80% of Postgraduate Diploma graduates, 35% of Taught Master's graduates, 37% of Research Master's graduates and 62% of Doctorate graduates.
Table 5.1: Key Employment Sectors by Level of Qualification for Graduates Employed in the Republic of Ireland, 2016
EMPLOYMENT SECTOR HO
NO
URS
BA
CHEL
OR
DEG
REE
HIG
HER
D
IPLO
MA
POST
-G
RA
DU
ATE
DIP
LOM
A
TAU
GH
T M
AST
ER'S
RESE
ARC
H
MA
STER
'S
DO
CTO
RAT
E
Agriculture, Forestry & Fishing 1.6% 1.2% 0.5% 0.6% 7.5% 2.0%Building & Construction 1.0% 0.8% 0.0% 1.1% 1.5% 0.0%Business, Finance & Insurance Services 26.0% 17.6% 4.4% 27.5% 13.4% 4.5%Accountancy & Legal Services 9.2% 7.6% 2.1% 7.9% 0.0% 0.3%Banking, Finance & Insurance 7.2% 5.2% 1.3% 7.6% 3.0% 1.1%Call Centres & Shared Services Facilities 1.6% 0.0% 0.3% 0.7% 0.0% 0.0%Consultant Engineering & Architectural Services 1.7% 0.0% 0.0% 2.2% 6.0% 0.8%
Other Business Services (incl Mgmt & IT Consulting) 6.3% 4.8% 0.8% 9.2% 4.5% 2.2%
Computing & Software Applications 5.3% 14.4% 6.5% 7.0% 6.0% 5.3%Distribution 7.4% 6.8% 0.8% 3.7% 3.0% 0.0%Electricity, Gas & Water Supply 0.6% 0.0% 0.0% 0.8% 1.5% 0.6%Manufacturing Industries 12.7% 5.2% 6.2% 10.6% 19.4% 20.4%Chemical, Rubber & Plastic Products 4.1% 1.2% 1.6% 3.7% 10.4% 11.7%Computer & Electronic Manufacturing 2.5% 2.0% 1.8% 2.3% 4.5% 3.6%Food & Drink Industries 3.6% 1.6% 1.0% 2.4% 0.0% 2.0%Metals, Metal Products, Mechanical & Electrical Engineering 0.9% 0.4% 1.0% 0.8% 3.0% 2.2%
Other Industries (incl mining etc.) 1.6% 0.0% 0.8% 1.4% 1.5% 0.8%Non-Market Services 30.1% 45.2% 79.8% 34.5% 37.3% 61.5%Civil Service, Local Authorities (other than Building & Construction) 1.5% 2.0% 1.6% 3.5% 3.0% 3.4%
Defence Forces, Gardaí 0.4% 4.8% 0.3% 0.5% 0.0% 0.3%Health Services (both Health Board & Other) 19.3% 23.2% 69.2% 7.5% 10.4% 11.5%Higher Education 1.0% 3.2% 1.6% 3.5% 13.4% 35.8%Other Education (incl Language Schools) 1.2% 5.6% 0.5% 2.2% 0.0% 1.4%Primary Education 1.1% 0.4% 3.1% 1.0% 0.0% 0.3%Research, Planning, Art Galleries etc. 0.7% 0.8% 0.0% 1.2% 3.0% 8.1%Secondary Education 3.2% 3.2% 2.3% 10.7% 7.5% 0.6%Social & Charitable Services 1.6% 2.0% 1.3% 4.4% 0.0% 0.3%Other Industries or Industry not stated 5.2% 2.0% 0.5% 5.6% 6.0% 3.1%Personal & Recreational Services 5.9% 4.0% 0.5% 3.1% 0.0% 0.6%Professional Services n.e.c. 2.8% 0.4% 0.3% 3.2% 4.5% 1.4%Transport, Storage & Communications 1.6% 2.4% 0.5% 2.4% 0.0% 0.8%Total 100.0% 100.0% 100.0% 100.0% 100.0% 100.0%
WH
AT DO
GR
AD
UATES D
O? TH
E CLASS O
F 2016
61
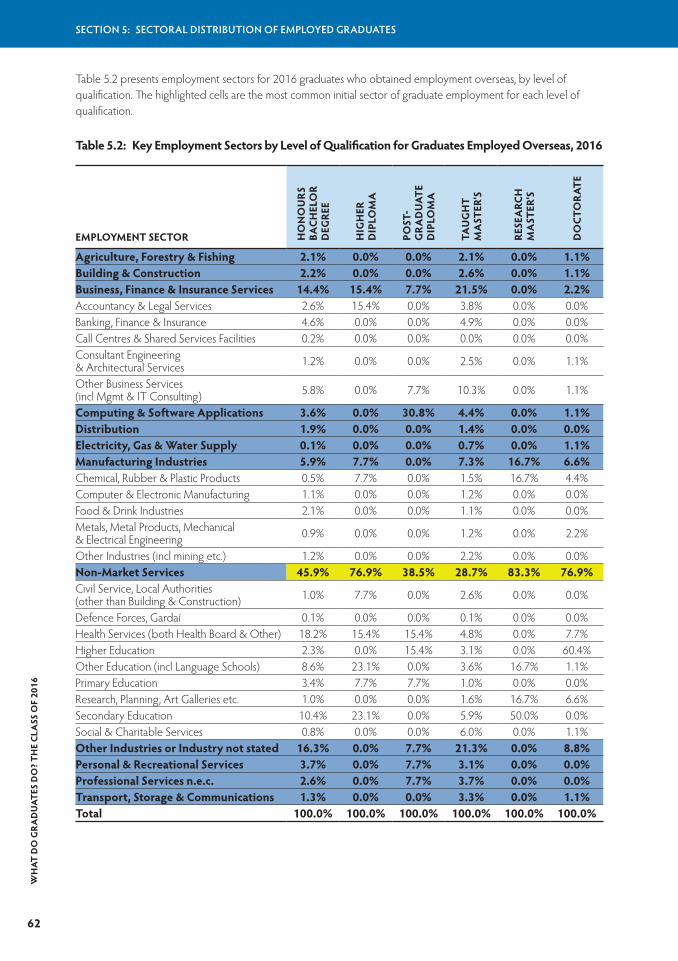
Table 5.2 presents employment sectors for 2016 graduates who obtained employment overseas, by level of qualification. The highlighted cells are the most common initial sector of graduate employment for each level of qualification.
Table 5.2: Key Employment Sectors by Level of Qualification for Graduates Employed Overseas, 2016
EMPLOYMENT SECTOR HO
NO
URS
BA
CHEL
OR
DEG
REE
HIG
HER
D
IPLO
MA
POST
-G
RA
DU
ATE
DIP
LOM
A
TAU
GH
T M
AST
ER'S
RESE
ARC
H
MA
STER
'S
DO
CTO
RAT
E
Agriculture, Forestry & Fishing 2.1% 0.0% 0.0% 2.1% 0.0% 1.1%Building & Construction 2.2% 0.0% 0.0% 2.6% 0.0% 1.1%Business, Finance & Insurance Services 14.4% 15.4% 7.7% 21.5% 0.0% 2.2%Accountancy & Legal Services 2.6% 15.4% 0.0% 3.8% 0.0% 0.0%Banking, Finance & Insurance 4.6% 0.0% 0.0% 4.9% 0.0% 0.0%Call Centres & Shared Services Facilities 0.2% 0.0% 0.0% 0.0% 0.0% 0.0%Consultant Engineering & Architectural Services 1.2% 0.0% 0.0% 2.5% 0.0% 1.1%
Other Business Services (incl Mgmt & IT Consulting) 5.8% 0.0% 7.7% 10.3% 0.0% 1.1%
Computing & Software Applications 3.6% 0.0% 30.8% 4.4% 0.0% 1.1%Distribution 1.9% 0.0% 0.0% 1.4% 0.0% 0.0%Electricity, Gas & Water Supply 0.1% 0.0% 0.0% 0.7% 0.0% 1.1%Manufacturing Industries 5.9% 7.7% 0.0% 7.3% 16.7% 6.6%Chemical, Rubber & Plastic Products 0.5% 7.7% 0.0% 1.5% 16.7% 4.4%Computer & Electronic Manufacturing 1.1% 0.0% 0.0% 1.2% 0.0% 0.0%Food & Drink Industries 2.1% 0.0% 0.0% 1.1% 0.0% 0.0%Metals, Metal Products, Mechanical & Electrical Engineering 0.9% 0.0% 0.0% 1.2% 0.0% 2.2%
Other Industries (incl mining etc.) 1.2% 0.0% 0.0% 2.2% 0.0% 0.0%Non-Market Services 45.9% 76.9% 38.5% 28.7% 83.3% 76.9%Civil Service, Local Authorities (other than Building & Construction) 1.0% 7.7% 0.0% 2.6% 0.0% 0.0%
Defence Forces, Gardaí 0.1% 0.0% 0.0% 0.1% 0.0% 0.0%Health Services (both Health Board & Other) 18.2% 15.4% 15.4% 4.8% 0.0% 7.7%Higher Education 2.3% 0.0% 15.4% 3.1% 0.0% 60.4%Other Education (incl Language Schools) 8.6% 23.1% 0.0% 3.6% 16.7% 1.1%Primary Education 3.4% 7.7% 7.7% 1.0% 0.0% 0.0%Research, Planning, Art Galleries etc. 1.0% 0.0% 0.0% 1.6% 16.7% 6.6%Secondary Education 10.4% 23.1% 0.0% 5.9% 50.0% 0.0%Social & Charitable Services 0.8% 0.0% 0.0% 6.0% 0.0% 1.1%Other Industries or Industry not stated 16.3% 0.0% 7.7% 21.3% 0.0% 8.8%Personal & Recreational Services 3.7% 0.0% 7.7% 3.1% 0.0% 0.0%Professional Services n.e.c. 2.6% 0.0% 7.7% 3.7% 0.0% 0.0%Transport, Storage & Communications 1.3% 0.0% 0.0% 3.3% 0.0% 1.1%Total 100.0% 100.0% 100.0% 100.0% 100.0% 100.0%
WH
AT D
O G
RA
DU
ATES
DO
? TH
E CL
ASS
OF
2016
62
SECTION 5: SECTORAL DISTRIBUTION OF EMPLOYED GRADUATES

As with graduates employed in Ireland, the sectoral distribution of graduates employed overseas shows that the Non-Market sector is the most popular employment sector for all graduates, with 46% of Honours Bachelor Degree leavers employed in this sector. 77% of Higher Diploma, 39% of Postgraduate Diploma, 29% of Taught Master's, 83% of Research Master's and 77% of Doctorate graduates are employed in the Non-Market sector. This finding that Irish graduates, of all award levels, are finding employment overseas in the Non-Market Services sector (which includes Education and Health Services) emphasises the value of Irish qualifications abroad.
5.2 Sector of Employment by Field of Study for Honours Bachelor Degree Graduates
Table 5.3 shows the employment sectors of Honours Bachelor Degree graduates employed in the Republic of Ireland by field of study. The highlighted cells are the most common initial sector of graduate employment, for each field of study. Generally, there appears to be a strong relationship between the field of study and the employment sector. Education graduates are predominantly employed in Non-Market Services (90%), with the majority of these in the secondary education and primary education subsector. Likewise, the majority of Health and Welfare graduates are finding employment in relevant employment sectors (81% employed in Health Services). 27% of Agriculture, Forestry, Fisheries and Veterinary graduates are employed in Agriculture, Forestry and Fishing while 21% of Arts and Humanities graduates, 64% of Business, Administration and Law graduates and 31% of Social Sciences, Journalism and Information graduates are employed in Business, Finance and Insurance Services. 45% of ICT graduates are employed in Computing and Software Applications. A further 25% of ICT graduates are employed in the Business, Finance and Insurance Services sector, thus providing evidence of the demand for ICT graduates across various sectors. 40% of Engineering, Manufacturing and Construction and 34% of Natural Sciences, Mathematics and Statistics graduates find employment in Manufacturing Industries, nine months after graduation.
There is more variation for Agriculture, Forestry and Fishing, Arts and Humanities, Natural Sciences, Mathematics and Statistics and Social Sciences, Journalism and Information graduates. 26% of Agriculture, Forestry and Fishing graduates are employed in Non-Market Services, 18% of Arts and Humanities graduates are employed in Distribution, 22% of Natural Sciences, Mathematics and Statistics graduates are employed in Business, Finance and Insurance Services while 21% of Social Sciences, Journalism and Information graduates are employed in Non-Market Services, nine months after graduation.
Table 5.4 shows the employment sectors of Honours Bachelor Degree 2016 graduates employed overseas, by original field of study. The highlighted cells are the most common initial sector of graduate employment for each field of study.
With a few exceptions, the distribution of graduates by field of study across the employment sectors overseas is quite similar to the pattern in Ireland. This is the case in six of the nine fields of study (Agriculture, Forestry and Fishing, Business, Administration and Law, Education, Engineering, Manufacturing and Construction, Health and Welfare and ICT). 54% of Arts and Humanities graduates are employed overseas in Non-Market services compared to just 14% in Ireland. 42% of Natural Sciences, Mathematics and Statistics graduates are employed overseas in Non-Market Services while the majority of graduates employed in Ireland from this field of study are in Manufacturing Industries. While the greatest proportion of graduates employed in Ireland from Social Sciences, Journalism and Information are employed in Business, Finance and Insurance Services, 27% of graduates from this discipline are employed overseas in Other Industries.
WH
AT DO
GR
AD
UATES D
O? TH
E CLASS O
F 2016
63
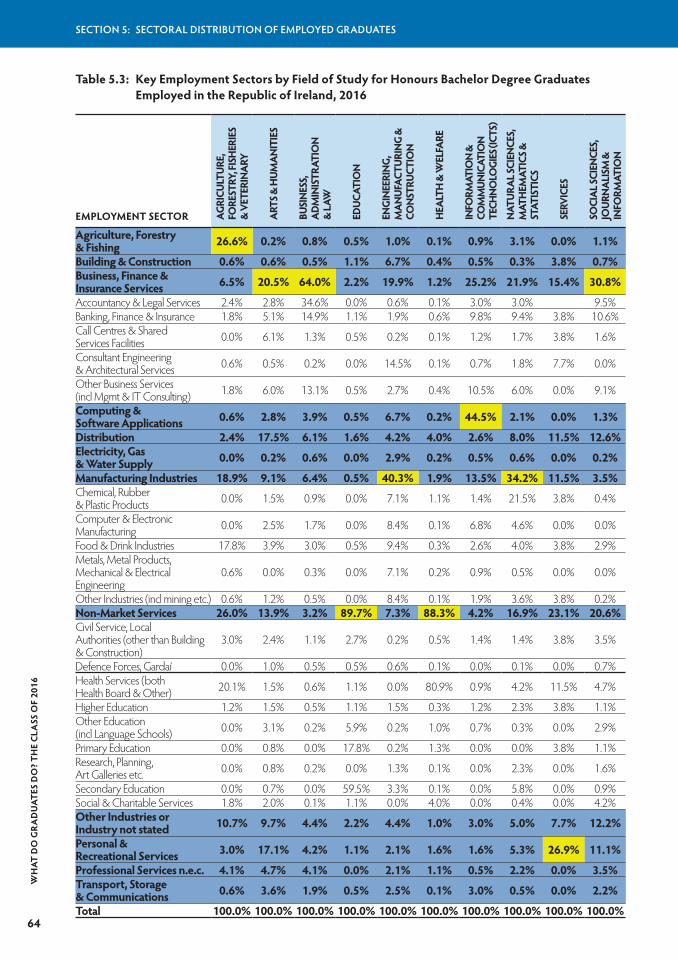
Table 5.3: Key Employment Sectors by Field of Study for Honours Bachelor Degree Graduates Employed in the Republic of Ireland, 2016
EMPLOYMENT SECTOR AGRI
CULT
URE,
FO
REST
RY, F
ISH
ERIE
S &
VET
ERIN
ARY
ARTS
& H
UMAN
ITIE
S
BUSI
NES
S,
ADM
INIS
TRAT
ION
&
LAW
EDUC
ATIO
N
ENGI
NEE
RIN
G,
MAN
UFAC
TURI
NG
&
CON
STRU
CTIO
N
HEA
LTH
& W
ELFA
RE
INFO
RMAT
ION
&
COM
MUN
ICAT
ION
TE
CHN
OLO
GIES
(ICT
S)
NAT
URAL
SCIE
NCE
S,
MAT
HEM
ATIC
S &
STAT
ISTI
CS
SERV
ICES
SOCI
AL SC
IEN
CES,
JO
URN
ALIS
M &
IN
FORM
ATIO
N
Agriculture, Forestry & Fishing 26.6% 0.2% 0.8% 0.5% 1.0% 0.1% 0.9% 3.1% 0.0% 1.1%
Building & Construction 0.6% 0.6% 0.5% 1.1% 6.7% 0.4% 0.5% 0.3% 3.8% 0.7%Business, Finance & Insurance Services 6.5% 20.5% 64.0% 2.2% 19.9% 1.2% 25.2% 21.9% 15.4% 30.8%
Accountancy & Legal Services 2.4% 2.8% 34.6% 0.0% 0.6% 0.1% 3.0% 3.0% 9.5%Banking, Finance & Insurance 1.8% 5.1% 14.9% 1.1% 1.9% 0.6% 9.8% 9.4% 3.8% 10.6%Call Centres & Shared Services Facilities 0.0% 6.1% 1.3% 0.5% 0.2% 0.1% 1.2% 1.7% 3.8% 1.6%
Consultant Engineering & Architectural Services 0.6% 0.5% 0.2% 0.0% 14.5% 0.1% 0.7% 1.8% 7.7% 0.0%
Other Business Services (incl Mgmt & IT Consulting) 1.8% 6.0% 13.1% 0.5% 2.7% 0.4% 10.5% 6.0% 0.0% 9.1%
Computing & Software Applications 0.6% 2.8% 3.9% 0.5% 6.7% 0.2% 44.5% 2.1% 0.0% 1.3%
Distribution 2.4% 17.5% 6.1% 1.6% 4.2% 4.0% 2.6% 8.0% 11.5% 12.6%Electricity, Gas & Water Supply 0.0% 0.2% 0.6% 0.0% 2.9% 0.2% 0.5% 0.6% 0.0% 0.2%
Manufacturing Industries 18.9% 9.1% 6.4% 0.5% 40.3% 1.9% 13.5% 34.2% 11.5% 3.5%Chemical, Rubber & Plastic Products 0.0% 1.5% 0.9% 0.0% 7.1% 1.1% 1.4% 21.5% 3.8% 0.4%
Computer & Electronic Manufacturing 0.0% 2.5% 1.7% 0.0% 8.4% 0.1% 6.8% 4.6% 0.0% 0.0%
Food & Drink Industries 17.8% 3.9% 3.0% 0.5% 9.4% 0.3% 2.6% 4.0% 3.8% 2.9%Metals, Metal Products, Mechanical & Electrical Engineering
0.6% 0.0% 0.3% 0.0% 7.1% 0.2% 0.9% 0.5% 0.0% 0.0%
Other Industries (incl mining etc.) 0.6% 1.2% 0.5% 0.0% 8.4% 0.1% 1.9% 3.6% 3.8% 0.2%Non-Market Services 26.0% 13.9% 3.2% 89.7% 7.3% 88.3% 4.2% 16.9% 23.1% 20.6%Civil Service, Local Authorities (other than Building & Construction)
3.0% 2.4% 1.1% 2.7% 0.2% 0.5% 1.4% 1.4% 3.8% 3.5%
Defence Forces, Gardaí 0.0% 1.0% 0.5% 0.5% 0.6% 0.1% 0.0% 0.1% 0.0% 0.7%Health Services (both Health Board & Other) 20.1% 1.5% 0.6% 1.1% 0.0% 80.9% 0.9% 4.2% 11.5% 4.7%
Higher Education 1.2% 1.5% 0.5% 1.1% 1.5% 0.3% 1.2% 2.3% 3.8% 1.1%Other Education (incl Language Schools) 0.0% 3.1% 0.2% 5.9% 0.2% 1.0% 0.7% 0.3% 0.0% 2.9%
Primary Education 0.0% 0.8% 0.0% 17.8% 0.2% 1.3% 0.0% 0.0% 3.8% 1.1%Research, Planning, Art Galleries etc. 0.0% 0.8% 0.2% 0.0% 1.3% 0.1% 0.0% 2.3% 0.0% 1.6%
Secondary Education 0.0% 0.7% 0.0% 59.5% 3.3% 0.1% 0.0% 5.8% 0.0% 0.9%Social & Charitable Services 1.8% 2.0% 0.1% 1.1% 0.0% 4.0% 0.0% 0.4% 0.0% 4.2%Other Industries or Industry not stated 10.7% 9.7% 4.4% 2.2% 4.4% 1.0% 3.0% 5.0% 7.7% 12.2%
Personal & Recreational Services 3.0% 17.1% 4.2% 1.1% 2.1% 1.6% 1.6% 5.3% 26.9% 11.1%
Professional Services n.e.c. 4.1% 4.7% 4.1% 0.0% 2.1% 1.1% 0.5% 2.2% 0.0% 3.5%Transport, Storage & Communications 0.6% 3.6% 1.9% 0.5% 2.5% 0.1% 3.0% 0.5% 0.0% 2.2%
Total 100.0% 100.0% 100.0% 100.0% 100.0% 100.0% 100.0% 100.0% 100.0% 100.0%
WH
AT D
O G
RA
DU
ATES
DO
? TH
E CL
ASS
OF
2016
64
SECTION 5: SECTORAL DISTRIBUTION OF EMPLOYED GRADUATES

Table 5.4: Key Employment Sectors by Field of Study for Honours Bachelor Degree Graduates Employed Overseas, 2016
EMPLOYMENT SECTOR AGRI
CULT
URE,
FO
REST
RY, F
ISH
ERIE
S &
VET
ERIN
ARY
ARTS
& H
UMAN
ITIE
S
BUSI
NES
S,
ADM
INIS
TRAT
ION
&
LAW
EDUC
ATIO
N
ENGI
NEE
RIN
G,
MAN
UFAC
TURI
NG
&
CON
STRU
CTIO
N
HEA
LTH
& W
ELFA
RE
INFO
RMAT
ION
&
COM
MUN
ICAT
ION
TE
CHN
OLO
GIES
(ICT
S)
NAT
URAL
SCIE
NCE
S,
MAT
HEM
ATIC
S &
STAT
ISTI
CS
SERV
ICES
SOCI
AL SC
IEN
CES,
JO
URN
ALIS
M &
IN
FORM
ATIO
N
Agriculture, Forestry & Fishing 29.0% 0.5% 0.8% 3.1% 0.0% 0.5% 0.0% 4.9% 0.0% 1.2%
Building & Construction 0.0% 1.0% 0.8% 0.0% 11.6% 0.0% 0.0% 2.4% 0.0% 3.5%Business, Finance & Insurance Services 3.2% 9.7% 37.1% 0.0% 17.9% 0.0% 25.8% 17.1% 0.0% 24.7%
Accountancy & Legal Services 0.0% 1.5% 12.1% 0.0% 1.1% 0.0% 3.2% 0.0% 0.0% 3.5%Banking, Finance & Insurance 0.0% 2.0% 9.1% 0.0% 2.1% 0.0% 22.6% 8.9% 0.0% 9.4%Call Centres & Shared Services Facilities 0.0% 0.5% 0.8% 0.0% 0.0% 0.0% 0.0% 0.0% 0.0% 0.0%
Consultant Engineering & Architectural Services 0.0% 0.0% 0.0% 0.0% 12.6% 0.0% 0.0% 0.0% 0.0% 0.0%
Other Business Services (incl Mgmt & IT Consulting) 3.2% 5.6% 15.2% 0.0% 2.1% 0.0% 0.0% 8.1% 0.0% 11.8%
Computing & Software Applications 0.0% 1.0% 4.5% 0.0% 10.5% 0.0% 48.4% 1.6% 0.0% 0.0%
Distribution 0.0% 4.6% 4.5% 0.0% 0.0% 0.0% 0.0% 0.8% 0.0% 2.4%Electricity, Gas & Water Supply 0.0% 0.0% 0.0% 0.0% 1.1% 0.0% 0.0% 0.0% 0.0% 0.0%
Manufacturing Industries 9.7% 2.6% 7.6% 0.0% 22.1% 0.0% 0.0% 11.4% 0.0% 4.7%Chemical, Rubber & Plastic Products 0.0% 0.0% 0.8% 0.0% 0.0% 0.0% 0.0% 2.4% 0.0% 1.2%
Computer & Electronic Manufacturing 0.0% 0.0% 1.5% 0.0% 7.4% 0.0% 0.0% 1.6% 0.0% 0.0%
Food & Drink Industries 9.7% 1.5% 3.0% 0.0% 0.0% 0.0% 0.0% 3.3% 0.0% 2.4%Metals, Metal Products, Mechanical & Electrical Engineering
0.0% 0.0% 1.5% 0.0% 6.3% 0.0% 0.0% 0.8% 0.0% 0.0%
Other Industries (incl mining etc.) 0.0% 1.0% 0.8% 0.0% 4.2% 0.0% 0.0% 3.3% 0.0% 1.2%Non-Market Services 12.9% 54.1% 19.7% 87.5% 14.7% 84.0% 9.7% 41.5% 0.0% 20.0%Civil Service, Local Authorities (other than Building & Construction)
0.0% 1.0% 3.8% 0.0% 0.0% 0.5% 3.2% 0.0% 0.0% 1.2%
Defence Forces, Gardaí 0.0% 0.0% 0.8% 0.0% 0.0% 0.0% 0.0% 0.0% 0.0% 0.0%Health Services (both Health Board & Other) 12.9% 0.5% 0.8% 0.0% 1.1% 77.0% 0.0% 2.4% 0.0% 1.2%
Higher Education 0.0% 5.1% 2.3% 0.0% 2.1% 0.9% 0.0% 4.1% 0.0% 0.0%Other Education (incl Language Schools) 0.0% 20.9% 7.6% 9.4% 5.3% 0.9% 3.2% 5.7% 0.0% 10.6%
Primary Education 0.0% 8.7% 0.8% 6.3% 0.0% 0.9% 0.0% 2.4% 0.0% 3.5%Research, Planning, Art Galleries etc. 0.0% 1.5% 0.0% 0.0% 0.0% 0.5% 3.2% 4.1% 0.0% 0.0%
Secondary Education 0.0% 15.3% 3.0% 71.9% 6.3% 2.3% 0.0% 22.8% 0.0% 0.0%Social & Charitable Services 0.0% 1.0% 0.8% 0.0% 0.0% 0.9% 0.0% 0.0% 0.0% 3.5%Other Industries or Industry not stated 25.8% 14.8% 16.7% 3.1% 15.8% 14.6% 9.7% 17.1% 50.0% 27.1%
Personal & Recreational Services 0.0% 8.7% 2.3% 3.1% 1.1% 0.5% 0.0% 3.3% 50.0% 9.4%
Professional Services n.e.c. 19.4% 2.0% 2.3% 3.1% 2.1% 0.5% 6.5% 0.0% 0.0% 5.9%Transport, Storage & Communications 0.0% 1.0% 3.8% 0.0% 3.2% 0.0% 0.0% 0.0% 0.0% 1.2%
Total 100.0% 100.0% 100.0% 100.0% 100.0% 100.0% 100.0% 100.0% 100.0% 100.0%
WH
AT DO
GR
AD
UATES D
O? TH
E CLASS O
F 2016
65

SECTION 6: EDUCATION
EDUCATION
67
This section relates directly to those graduating from qualifications specifically designed for the second level teaching profession21. It examines 1. Honours Bachelor Degree graduates in Education (qualified to teach at second level); and 2. Professional Master of Education graduates (qualified for teaching at second level, following the completion of an Honours Bachelor’s Degree in various disciplines). The data for this section has been gathered from the seven universities22.
21 This year’s report does not provide an analysis of primary level teaching graduates. Some colleges took part in the pilot study for the Graduate Outcomes Survey commencing in 2018 and so were not part of this year’s First Destination Survey. As a result, data that is available is not reflective of the entire primary level teaching graduate cohort in 2016.
22 UCD only provide Initial Teacher Education at postgraduate level while Trinity College Dublin did not return data on their Professional Master of Education (second-level teaching) programme.
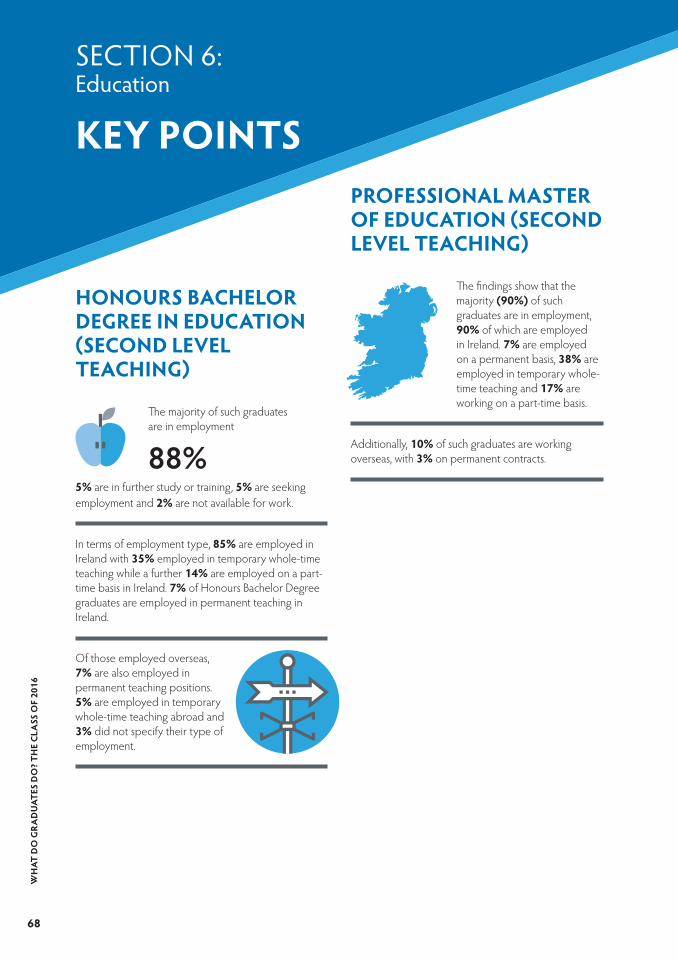
KEY POINTS
SECTION 6:Education
WH
AT D
O G
RA
DU
ATES
DO
? TH
E CL
ASS
OF
2016
68
HONOURS BACHELOR DEGREE IN EDUCATION (SECOND LEVEL TEACHING)
The majority of such graduates are in employment
88%5% are in further study or training, 5% are seeking employment and 2% are not available for work.
In terms of employment type, 85% are employed in Ireland with 35% employed in temporary whole-time teaching while a further 14% are employed on a part-time basis in Ireland. 7% of Honours Bachelor Degree graduates are employed in permanent teaching in Ireland.
Of those employed overseas, 7% are also employed in permanent teaching positions. 5% are employed in temporary whole-time teaching abroad and 3% did not specify their type of employment.
PROFESSIONAL MASTER OF EDUCATION (SECOND LEVEL TEACHING)
The findings show that the majority (90%) of such graduates are in employment, 90% of which are employed in Ireland. 7% are employed on a permanent basis, 38% are employed in temporary whole-time teaching and 17% are working on a part-time basis.
Additionally, 10% of such graduates are working overseas, with 3% on permanent contracts.
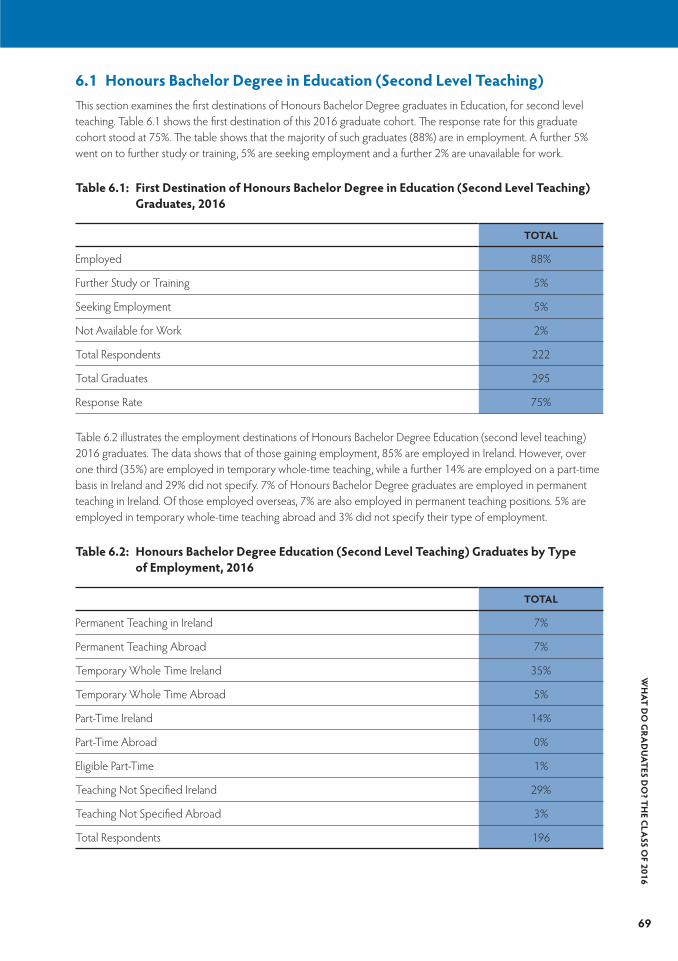
6.1 Honours Bachelor Degree in Education (Second Level Teaching) This section examines the first destinations of Honours Bachelor Degree graduates in Education, for second level teaching. Table 6.1 shows the first destination of this 2016 graduate cohort. The response rate for this graduate cohort stood at 75%. The table shows that the majority of such graduates (88%) are in employment. A further 5% went on to further study or training, 5% are seeking employment and a further 2% are unavailable for work.
Table 6.1: First Destination of Honours Bachelor Degree in Education (Second Level Teaching) Graduates, 2016
TOTAL
Employed 88%
Further Study or Training 5%
Seeking Employment 5%
Not Available for Work 2%
Total Respondents 222
Total Graduates 295
Response Rate 75%
Table 6.2 illustrates the employment destinations of Honours Bachelor Degree Education (second level teaching) 2016 graduates. The data shows that of those gaining employment, 85% are employed in Ireland. However, over one third (35%) are employed in temporary whole-time teaching, while a further 14% are employed on a part-time basis in Ireland and 29% did not specify. 7% of Honours Bachelor Degree graduates are employed in permanent teaching in Ireland. Of those employed overseas, 7% are also employed in permanent teaching positions. 5% are employed in temporary whole-time teaching abroad and 3% did not specify their type of employment.
Table 6.2: Honours Bachelor Degree Education (Second Level Teaching) Graduates by Type of Employment, 2016
TOTAL
Permanent Teaching in Ireland 7%
Permanent Teaching Abroad 7%
Temporary Whole Time Ireland 35%
Temporary Whole Time Abroad 5%
Part-Time Ireland 14%
Part-Time Abroad 0%
Eligible Part-Time 1%
Teaching Not Specified Ireland 29%
Teaching Not Specified Abroad 3%
Total Respondents 196
WH
AT DO
GR
AD
UATES D
O? TH
E CLASS O
F 2016
69

6.2 Professional Master of Education (Second Level Teaching)This section examines the first destination of graduates of the Professional Master of Education. Graduates of this two-year postgraduate course are qualified to teach at second level. 71% of such graduates responded to the survey. Table 6.3 shows the first destination of this 2016 graduate cohort. The data shows that the majority of such graduates (90%) are in employment. A further 7% are seeking employment, while just 1% went on to further study or training.
Table 6.3: First Destination of Professional Master of Education (Second Level Teaching) Graduates, 2016
TOTAL
Employed 90%
Further Study or Training 1%
Seeking Employment 7%
Not Available for Work 1%
Total Respondents 508
Total Graduates 803
Response Rate 63%
Table 6.4 illustrates the employment destinations of Professional Master of Education (second level teaching) graduates, nine months after graduation. The data shows that of those gaining employment, 90% are employed in Ireland. However, 38% are employed in temporary whole-time teaching, while a further 17% are employed on a part-time basis in Ireland. Only 7% of such graduates are employed in permanent teaching in Ireland. Moreover, 10% of employed graduates are working overseas, only 3% of which are in permanent employment.
Table 6.4: Professional Master of Education (Second Level Teaching) Graduates by Type of Employment, 2016
TOTAL
Permanent Teaching in Ireland 7%
Permanent Teaching Abroad 3%
Temporary Whole Time Ireland 38%
Temporary Whole Time Abroad 3%
Part-Time Ireland 17%
Part-Time Abroad 0%
Eligible Part-Time 1%
Teaching Not Specified Ireland 27%
Teaching Not Specified Abroad 3%
Total Respondents 458
WH
AT D
O G
RA
DU
ATES
DO
? TH
E CL
ASS
OF
2016
70
SECTION 6: EDUCATION

Table 6.4 outlines the original field of study23 of employed Professional Master of Education graduates. Of those employed and where data was available, 62% held an Arts, Social Science and Humanities degree with 11% gaining permanent teaching contracts in Ireland and 51% gaining temporary whole-time contracts in Ireland. 12% of graduates who responded held a Science degree, with 82% employed in Ireland and 18% employed overseas. Of the 84% employed in Ireland, 13% had permanent teaching positions in Ireland and a further 44% were employed on temporary whole-time contracts. 8% of Professional Master of Education graduates came from Commerce and Business Studies fields of study. Only 5% of these graduates held permanent contracts in Ireland, 9 months after graduation. The remaining 19% of Professional Master of Education graduates came from the ‘Other’ category comprising of mostly of ‘unknown’ field of study.
Table 6.5: First Destination of Professional Master of Education (Second Level Teaching) Graduates by Primary Field of Study, 2016
ARTS, SOCIAL SCIENCE &
HUMANITIESSCIENCE COMMERCE &
BUSINESS STUDIES OTHER
Permanent Teaching in Ireland 11% 13% 5% 10%
Permanent Teaching Abroad 4% 3% 0% 8%
Temporary Whole Time Ireland 51% 44% 41% 53%
Temporary Whole Time Abroad 4% 9% 5% 6%
Part-Time Ireland 25% 16% 36% 14%
Part-Time Abroad 0% 3% 0% 0%
Eligible Part-Time 1% 0% 5% 2%
Teaching Not Specified Ireland 5% 9% 9% 6%
Teaching Not Specified Abroad 1% 3% 0% 2%
Total Respondents 169 32 22 51
% of Graduates 62% 12% 8% 19%
23 UCC, Maynooth University and Trinity College Dublin did not return data on primary field of study.
WH
AT DO
GR
AD
UATES D
O? TH
E CLASS O
F 2016
71

SECTION 7: FIRST DESTINATION OF INTERNATIONAL GRADUATES
FIRST DESTINATION OF INTERNATIONAL
GRADUATES
This section examines the first destination of 2016 International graduates.
73

Nine months after graduation
62%of Honours Bachelor Degree international graduates were in employment, with
37%working in Ireland and
25% working overseas.
59% of Higher and Postgraduate Diploma international graduates were employed in 2016, 51% of which were working in Ireland and 8% overseas. 5% of Higher and Postgraduate females are seeking employment compared 13% of males.
73%of Master's and Doctorate international graduates were employed (41% in Ireland; 33% overseas*). 74% of females found employment compared to 73% of males. * Rounding accounts for sub-
totals not equalling totals.
KEY POINTS
SECTION 7: First Destination of International Graduates
WH
AT D
O G
RA
DU
ATES
DO
? TH
E CL
ASS
OF
2016
74

7.1 Honours Bachelor Degree International Graduates, 2016The overall first destinations of undergraduate Honours Bachelor Degree International graduates are outlined in Table 7.1. Of the 2016 international university graduate cohort, 51% responded to the survey.
Table 7.1: First Destination of Honours Bachelor Degree International Graduates, 2016
ALL 7 UNIVERSITIES 2016
In employment 62%
In employment in Ireland 37%
In employment overseas 25%
Further Studies/Training 32%
Work Experience Schemes 0%
Seeking Employment 4%
Unavailable for Work/Study 2%
Nine months after graduation, 62% of international Honours Bachelor Degree graduates are in employment, with 37% working in Ireland and 25% working overseas. A further 32% of graduates went on to further studies/training. The proportion of international graduates seeking employment is 1 percentage point lower than the figure for the general population (5% – outlined in section one).
Table 7.2: First Destination of Honours Bachelor Degree International Graduates by Gender, 2016
ALL 7 UNIVERSITIES MALE FEMALE
In employment 59% 65%
In employment in Ireland 35% 38%
In employment overseas 23% 26%
Further Studies/Training 34% 30%
Work Experience Schemes 0% 0%
Seeking Employment 6% 2%
Unavailable for Work Study 1% 2%
As evident in Table 7.2, 59% of international males who responded to the survey report being in employment. This compares to 65% of international females who responded to the survey. 35% of international males are employed in Ireland, while 23% are employed abroad. 38% of international females are employed in Ireland and 26% are employed overseas. A greater proportion of international males (34%) than females (30%) are engaged in further study. Only 2% of international females compared to 6% of such males are seeking employment, while only 1% of males and 2% of females are unavailable for work or study.
WH
AT DO
GR
AD
UATES D
O? TH
E CLASS O
F 2016
75
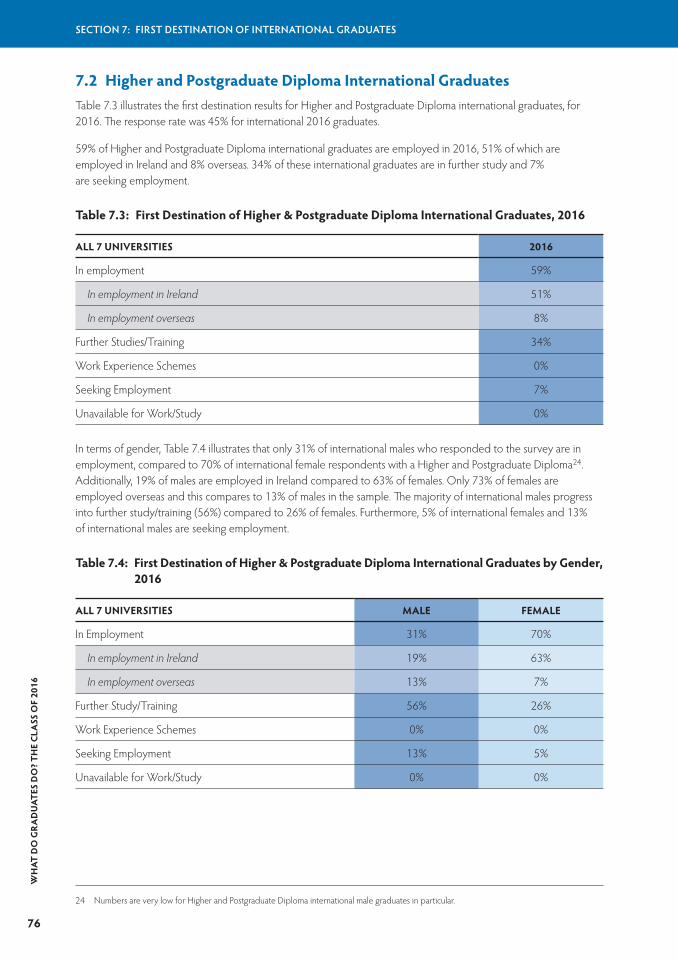
7.2 Higher and Postgraduate Diploma International GraduatesTable 7.3 illustrates the first destination results for Higher and Postgraduate Diploma international graduates, for 2016. The response rate was 45% for international 2016 graduates.
59% of Higher and Postgraduate Diploma international graduates are employed in 2016, 51% of which are employed in Ireland and 8% overseas. 34% of these international graduates are in further study and 7% are seeking employment.
Table 7.3: First Destination of Higher & Postgraduate Diploma International Graduates, 2016
ALL 7 UNIVERSITIES 2016
In employment 59%
In employment in Ireland 51%
In employment overseas 8%
Further Studies/Training 34%
Work Experience Schemes 0%
Seeking Employment 7%
Unavailable for Work/Study 0%
In terms of gender, Table 7.4 illustrates that only 31% of international males who responded to the survey are in employment, compared to 70% of international female respondents with a Higher and Postgraduate Diploma24. Additionally, 19% of males are employed in Ireland compared to 63% of females. Only 73% of females are employed overseas and this compares to 13% of males in the sample. The majority of international males progress into further study/training (56%) compared to 26% of females. Furthermore, 5% of international females and 13% of international males are seeking employment.
Table 7.4: First Destination of Higher & Postgraduate Diploma International Graduates by Gender, 2016
ALL 7 UNIVERSITIES MALE FEMALE
In Employment 31% 70%
In employment in Ireland 19% 63%
In employment overseas 13% 7%
Further Study/Training 56% 26%
Work Experience Schemes 0% 0%
Seeking Employment 13% 5%
Unavailable for Work/Study 0% 0%
24 Numbers are very low for Higher and Postgraduate Diploma international male graduates in particular.
WH
AT D
O G
RA
DU
ATES
DO
? TH
E CL
ASS
OF
2016
76
SECTION 7: FIRST DESTINATION OF INTERNATIONAL GRADUATES

7.3 Master's and Doctorate International GraduatesThe overall results of the 2016 First Destination Survey of Master's and Doctorate international graduates are outlined in Table 7.5. The survey achieved a response rate of 55% among Master's and Doctorate international graduates. A high proportion, 73%, of this graduate cohort are in employment nine months after graduation, 41% of which are employed in Ireland and 33% employed overseas. A further 11% of international postgraduates are in further study, 14% are seeking employment and 1% are unavailable for work or study.
Table 7.5: First Destination of Master's and Doctorate International Graduates, 2016
ALL 7 UNIVERSITIES 2016
In employment 73%
In employment in Ireland 41%
In employment overseas 33%
Further Studies/Training 11%
Work Experience Schemes 0%
Seeking Employment 14%
Unavailable for Work/Study 1%
In terms of gender, Table 7.6 shows that 73% of international postgraduate males and 74% of females are in employment, nine months after graduation. Of international postgraduates in employment, 39% of males and 41% of females are employed in Ireland, compared to 33% of both males and females employed overseas25. A similar proportion of males (12%) and females (11%) are engaged in further study. A further 14% of males and females are seeking employment. Only a small proportion of international postgraduate males and females (1% of both) are unavailable for work or study.
Table 7.6: First Destination of Master's and Doctorate International Graduates by Gender, 2016
ALL 7 UNIVERSITIES MALE FEMALE
In employment 73% 74%
In employment in Ireland 39% 41%
In employment overseas 33% 33%
Further Studies/Training 12% 11%
Work Experience Schemes 0% 0%
Seeking Employment 14% 14%
Unavailable for Work/Study 1% 1%
25 Rounding accounts for sub-totals not equalling totals.
WH
AT DO
GR
AD
UATES D
O? TH
E CLASS O
F 2016
77

ConclusionThis year’s report, What Do Graduates Do? The Class of 2016. An Analysis of the First Destination of University Graduates, has illustrated the first destination of 2016 university graduates, nine months after graduation. In total 18,229, or 68%, of level 8-10 graduates responded to the survey.
The findings of this report highlight many positive employment outcomes for the 2016 graduate cohort. There is an increase in all graduates employed in Ireland to 60% in 2016 from 57% in 2015. There is a one percentage point increase to 54% of Honours Bachelor Degree graduates in employment in Ireland in 2016 (compared to 53% in 2015). Unlike in 2015, however, the proportion of Higher and Postgraduate Diploma graduates in employment dropped five percentage points from 78% in 2015 to 73% in 2016. This finding may be attributed to the lower number of graduates from the Education field of study following the replacement of the Professional Diploma in Education with the Professional Master of Education. In previous years, many Postgraduate Diploma graduates came from the Professional Diploma in Education with the majority of such graduates in employment nine months after graduation. In 2016, such graduates are now returned as Master's graduates. Master's and Doctorate graduates also experience relatively high levels of employment, at 81% – an improvement of one percentage point on the previous year. With the exception of Higher and Postgraduate Diploma graduates, employment levels have slightly increased from 2015.
The survey asks graduates to indicate how relevant his/her education is to his/her current area of employment. There appears to be a relationship between education level and relevance – while 71% of Honours Bachelor Degree graduates rate their qualification as relevant to their employment, a greater proportion of Higher and Postgraduate Diploma graduates (86%) and Master's and Doctorate graduates (81%) report the same. When comparing graduates employed in Ireland with those employed overseas, Higher and Postgraduate Diploma graduates and Master's and Doctorate graduates in Ireland report more relevance of their qualification to their employment than graduates employed overseas. Interestingly, the opposite was true of Honours Bachelor Degree graduates – 76% of such graduates employed overseas report that their qualification was relevant/most relevant to their employment compared to 71% employed in Ireland.
Another notable finding is in terms of salary. As expected, there is an apparent correlation between education and salary. 40% of Honours Bachelor Degree graduates earn under €25,000 (seven percentage points down from 2015) but this drops to 9% of Doctorate graduates (six percentage points down from 2015). Furthermore, 35% of Doctorate graduates reported earning over €45,000, again showing improvements from the year previous (31%). There is some evidence in this report that males earn slightly higher salaries than females, nine months after graduation. While the findings should be interpreted with caution due to varying response rates across salary bands, they are supported by the most recent statistics from Eurostat in 2014 who report that a gender pay gap of 13.9% exists in Ireland26. Eurostat also claim that the gender pay gap is generally much lower for new labour market entrants and tends to widen with age.
26 Eurostat, Gender pay gap in unadjusted form by NACE Rev. 2 activity – structure of earnings survey methodology, http://appsso.eurostat.ec.europa.eu/nui/show.do?dataset=earn_gr_gpgr2&lang=en, accessed 27th November 2017.
WH
AT D
O G
RA
DU
ATES
DO
? TH
E CL
ASS
OF
2016
78

Similar to last year’s report, Dublin is still the region with the most employment opportunities for graduates, followed by the South-West region. The report also highlights that the most common sector of employment for Honours Bachelor Degree graduates (employed both in Ireland and overseas) is the Non-Market Services sector.
In terms of second-level teaching, while high levels of employment are evident for both Honours Bachelor Degree (88%) and Professional Master of Education (90%) graduates, only 7% of both cohorts have permanent contracts in Ireland. Of those that responded to the survey, it is clear that temporary whole time teaching in Ireland is most common for both Honours Bachelor Degree (35%) and Professional Master of Education (38%) graduates.
Lastly, this report examined the first destination of international graduates. Similar to findings in 2015, of those employed – across all levels – larger proportions of such graduates are choosing to stay in Ireland rather than move overseas, nine months after graduation. By retaining international graduates, the evidence suggests that Ireland continues to be a popular destination of employment.
As outlined earlier in the report, the forthcoming changes to the First Destination Survey along with the inclusion of the Institutes of Technology sector will ensure a more holistic view of graduate outcomes.
WH
AT DO
GR
AD
UATES D
O? TH
E CLASS O
F 2016
79
BibliographyFrawley, Denise and Valerie Harvey. Graduate Surveys: Review of International Practice. Dublin: Higher Education Authority, 2015.
OECD. Education at a Glance 2017: OECD Indicators. Paris: OECD Publishing, 2017.
Unger, Martin and Andreas Raggautz. “Long-term career tracking of graduates using the social science security system”, Employability of Graduates & Higher Education Management Systems conference. Dehems, Vienna 22/23.9.2011.
Ward, P. Report to the Minister for Education and Skills of the Chairperson of the Expert Group on Fixed-Term and Part-Time Employment in Primary and Secondary Level Education in Ireland, 2014. Available at: https://www.ictu.ie/download/pdf/ward_report.pdf.
WH
AT D
O G
RA
DU
ATES
DO
? TH
E CL
ASS
OF
2016
80

AppendicesAppendix A: Classification of Regions used for Statistical Reporting in the Republic of Ireland (NUTS 3 Regions)
BORDER MIDLANDS WEST
Cavan Laois Galway
Donegal Offaly Mayo
Leitrim Westmeath Roscommon
Louth Longford
Monaghan
Sligo
DUBLIN MID-EAST MID-WEST SOUTH-EAST SOUTH-WEST
Dublin Kildare Clare Carlow Cork
Meath Limerick Kilkenny Kerry
Wicklow North Tipperary South Tipperary
Waterford
Wexford
WH
AT DO
GR
AD
UATES D
O? TH
E CLASS O
F 2016
81

WH
AT D
O G
RA
DU
ATES
DO
? TH
E CL
ASS
OF
2016
82

WH
AT DO
GR
AD
UATES D
O? TH
E CLASS O
F 2016
83

WH
AT D
O G
RA
DU
ATES
DO
? TH
E CL
ASS
OF
2016
84


Contact Us3 Shelbourne Buildings, Crampton Avenue Shelbourne Road, Ballsbridge, Dublin 4 DO4 C2Y6, Ireland
Email: [email protected] Phone: +353 1 231 7100 Lo-Call Number: 1890 200 637 Fax: +353 1 231 7172


