28
An analysis of the global marine insurance market 2018
An analysis of the global marine insurance market 2018
IUMI Stats 2018 1
In this document we present data on the global marine insurance market set in the context of world economic performance, trade and the shipping industry. We also offer commentary and opinion based on the data we have collected.
The International Union of Marine Insurance (IUMI) represents 42 national and marine market insurance and reinsurance asso ciations. Its Fact & Figures Committee compiles and analyses data submitted by national insurance associations and cooperates with other data providers.
Our thanks go to those IUMI member associations for their continued support, and to the other data providers, in particular Clarksons Research, IHS Markit, Lloyds List Intelligence and Swiss Re Economic Research, for supporting IUMI with extensive and up to date information on the relevant trends that impact the marine industry. Special thanks are offered to the Nordic Association of Marine Insurers (Cefor) for annually compiling global marine insurance data on behalf of IUMI and supporting IUMI with uptodate hull trend analyses from the Nordic Marine Insurance Statistics database. Donald Harrell, IUMI Facts & Figures Committee Chair Lars Lange, IUMI Secretary General
Introduction
IUMI Stats 2018 2
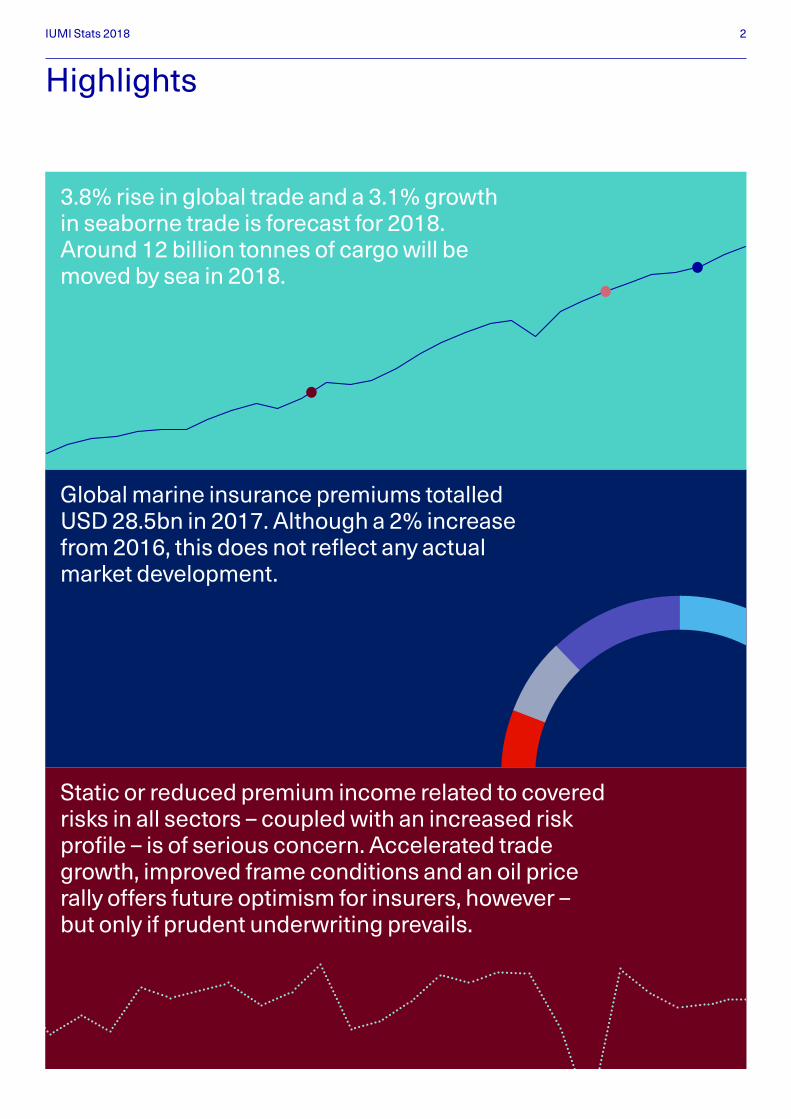
3.8% rise in global trade and a 3.1% growth in seaborne trade is forecast for 2018. Around 12 billion tonnes of cargo will be moved by sea in 2018.
Static or reduced premium income related to covered risks in all sectors – coupled with an increased risk profile – is of serious concern. Accelerated trade growth, improved frame conditions and an oil price rally offers future optimism for insurers, however – but only if prudent underwriting prevails.
Global marine insurance premiums totalled USD 28.5bn in 2017. Although a 2% increase from 2016, this does not reflect any actual market development.
Highlights

IUMI Stats 2018 3
Global hull insurance achieved premiums of USD 6.9bn in 2017, down 2.3%. An increasing divergence of fleet growth and premium income continues to drive down performance. The rise in loss ratios shows a growing gap between declining income and expected claims costs – even with the current scarcity of large, costly losses – and this is a concern. But various factors including reduced capacity and pressured broker facilities are beginning to reverse this worrying situation.
Premium income for global marine cargo under writing reached USD 16.1bn, a 6% increase on 2017 representing real growth in volumes. Results were strongly impacted by outlier and natcat losses. The increasing likelihood of large event/accumulation losses remains a growing concern.
Offshore energy underwriting achieved USD 3.6bn in premiums, down 5% on 2016. Reduced offshore activity is the chief culprit but attritional losses alone are increasingly eroding the premium base – a significant concern. Reacti v ation of offshore facilities will increase the risk profile going forward. However, a modest uptick in optimism for this sector is expected.
IUMI Stats 2018 4
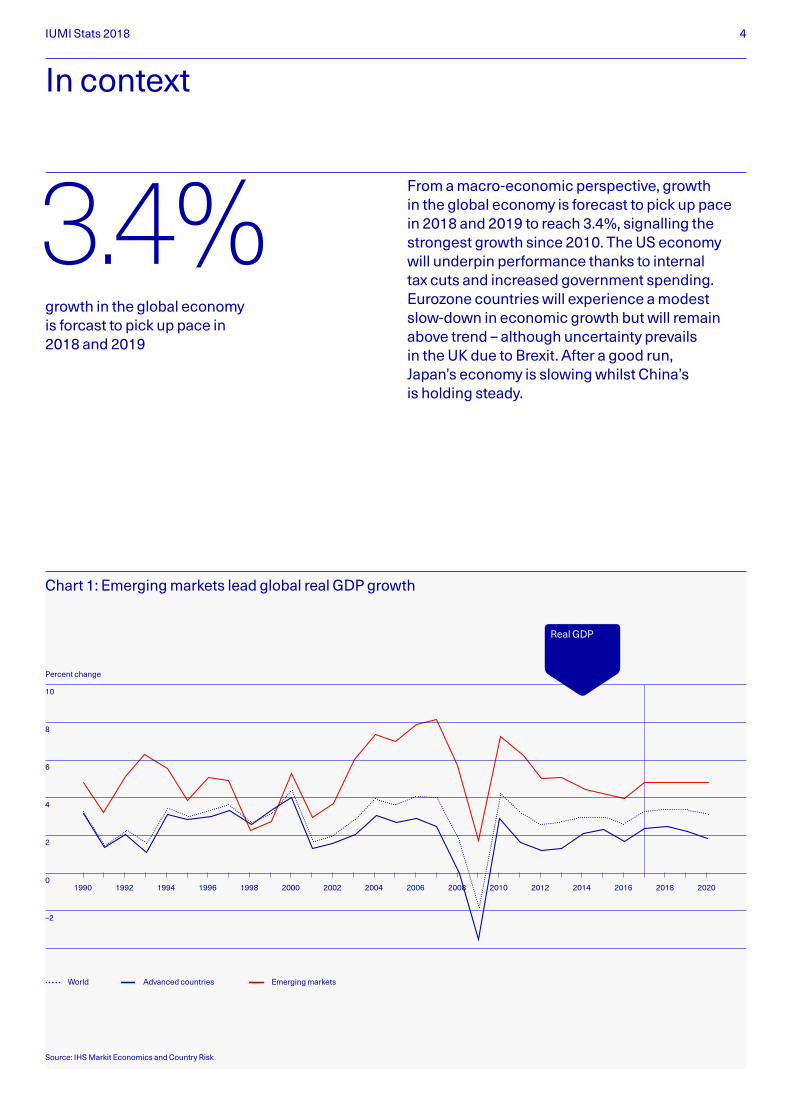
From a macroeconomic perspective, growth in the global economy is forecast to pick up pace in 2018 and 2019 to reach 3.4%, signalling the strongest growth since 2010. The US economy will underpin performance thanks to internal tax cuts and increased government spending. Eurozone countries will experience a modest slowdown in economic growth but will remain above trend – although uncertainty prevails in the UK due to Brexit. After a good run, Japan’s economy is slowing whilst China’s is holding steady.
growth in the global economy is forcast to pick up pace in 2018 and 2019
In context
Percent change
Source: IHS Markit Economics and Country Risk
10
8
6
4
2
0
–2
1990 1992 1994 1996 1998 2000 2002 2004 2006 2008 2010 2012 2014 2016 2018 2020
Chart 1: Emerging markets lead global real GDP growth
Emerging marketsWorld Advanced countries
3.4%
Real GDP
IUMI Stats 2018 5
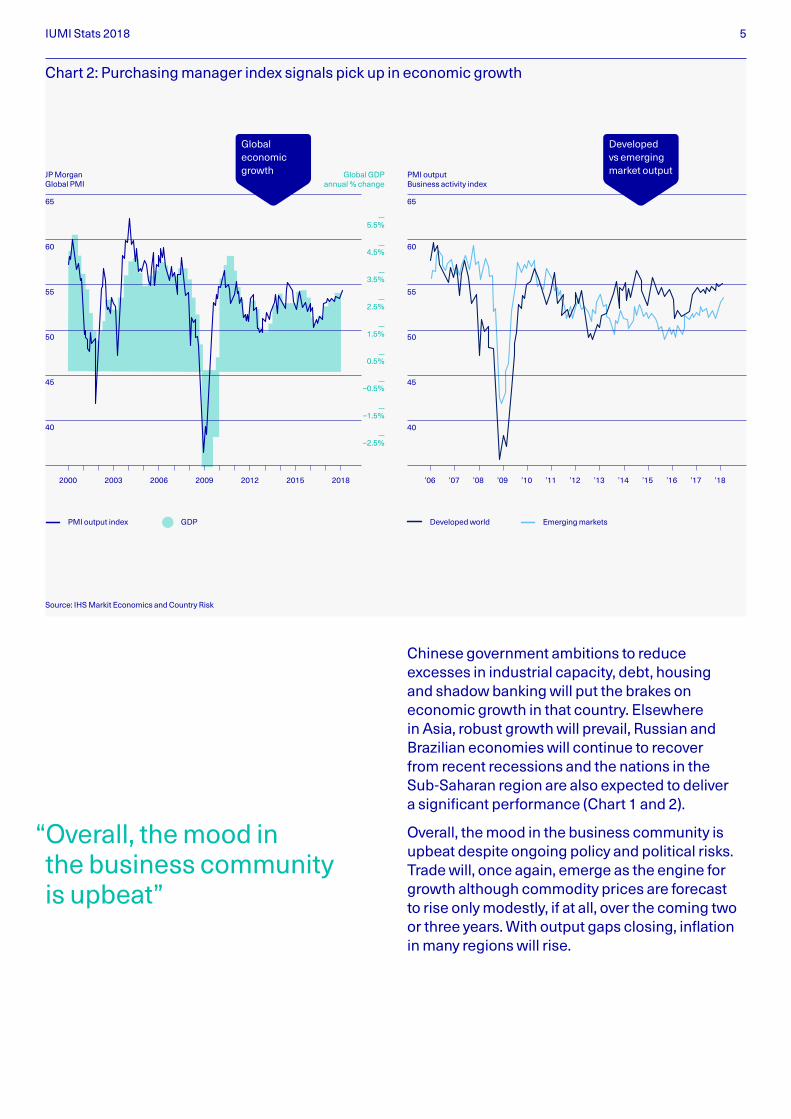
Chinese government ambitions to reduce excesses in industrial capacity, debt, housing and shadow banking will put the brakes on economic growth in that country. Elsewhere in Asia, robust growth will prevail, Russian and Brazilian economies will continue to recover from recent recessions and the nations in the SubSaharan region are also expected to deliver a significant performance (Chart 1 and 2).
Overall, the mood in the business community is upbeat despite ongoing policy and political risks. Trade will, once again, emerge as the engine for growth although commodity prices are forecast to rise only modestly, if at all, over the coming two or three years. With output gaps closing, inflation in many regions will rise.
60
65
JP Morgan Global PMI
4.5%
5.5%
3.5%
2.5%
1.5%
0.5%
–0.5%
–1.5%
–2.5%
Global GDP annual % change
PMI output Business activity index
55
50
45
40
60
65
55
50
45
40
2000 ’06 ’07 ’08 ’09 ’10 ’11 ’12 ’13 ’14 ’15 ’16 ’17 ’18201820152012200920062003
Chart 2: Purchasing manager index signals pick up in economic growth
Emerging marketsDeveloped worldPMI output index GDP
Source: IHS Markit Economics and Country Risk
“Overall, the mood in the business community is upbeat”
Global economic growth
Developed vs emerging market output
IUMI Stats 2018 6
12%
13
12
11
10
9
8
7
6
5
4
3
2
1
8%
4%
0%
–4%
Chart 3: Growth – seaborne trade vs world GDP
Chart 4: Seaborne trade per capita
1988
1990
1992
1994
1996
1998
2000
2002
2004
2006
2008
2010
2012
2014
2016
2018
(f)
bn tonnes
1.7
1.6
1.5
1.4
1.3
1.2
1.1
1.0
0.9
0.8
0.7
0.6
0.5
tonnes pp
1996
1997
1998
1999
2000
2001
2002
2003
2004
2005
2006
2007
2008
2009
2010
2011
2012
2013
2014
2015
2016
2017
e
2018
(f)
Trade per capita (right axis)
World GDP growth
Source: Clarksons Research
Source: Clarksons Research, September 2018
Seaborne trade (left axis)
Seaborne trade growth
Milestone 3
2017: Trade reaches
1.5 tonnes per person
Milestone 2
2013: Trade reaches
10bn tonnes
Milestone 1
2000: Trade passes
1 tonne per person
IUMI Stats 2018 7
The US dollar – the universal indicator of global wealth – is likely to strengthen in the nearterm before weakening as America’s growing current account deficit begins to make itself known. The 40% growth in oil price seen over the past 12 months has reset prices and these should remain relatively stable into 2019.
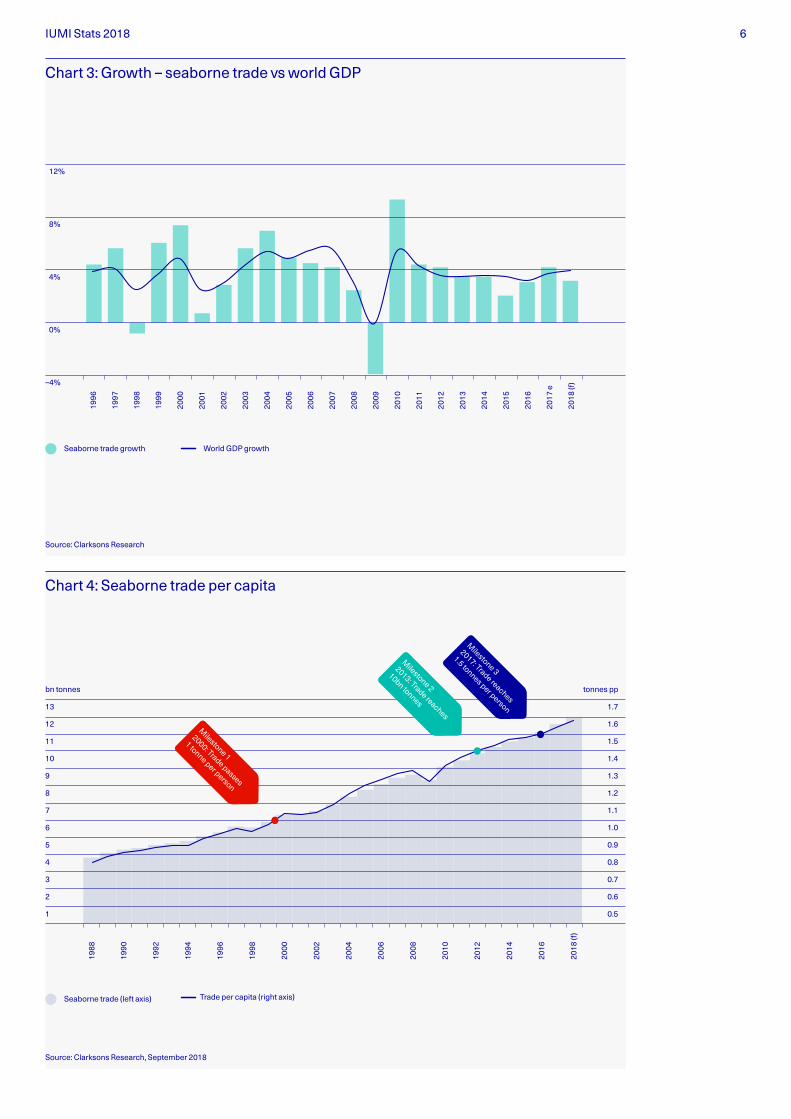
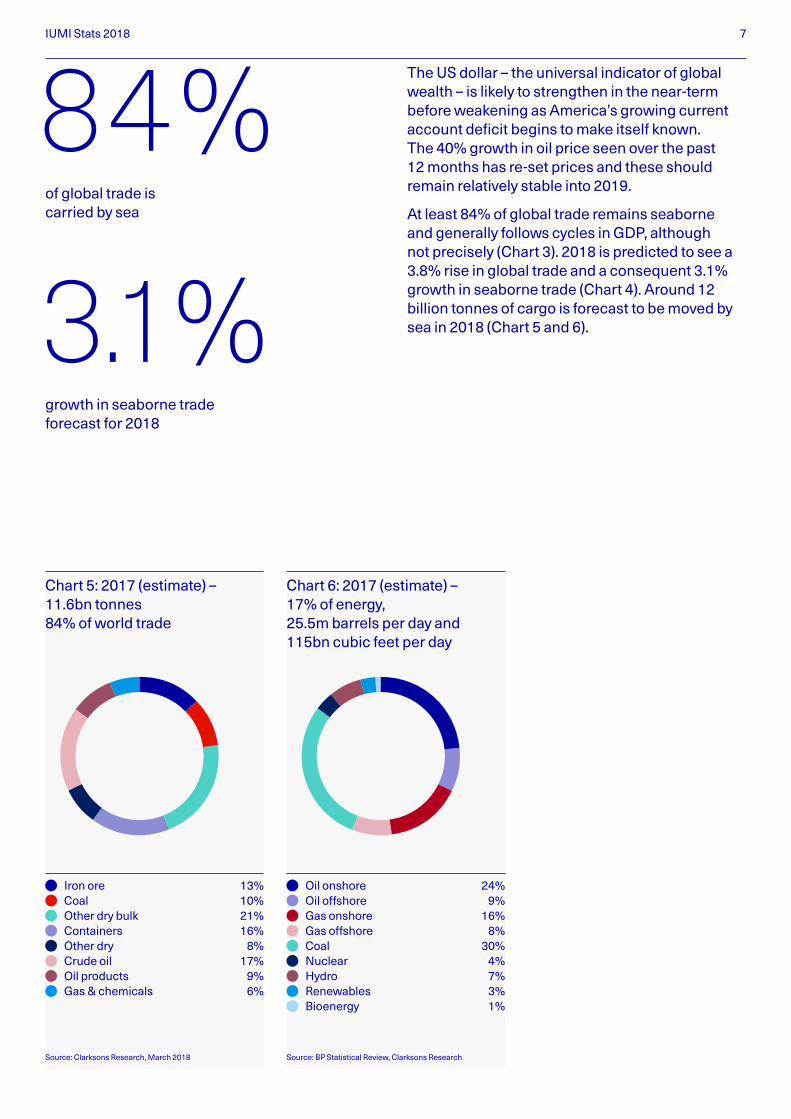
At least 84% of global trade remains seaborne and generally follows cycles in GDP, although not precisely (Chart 3). 2018 is predicted to see a 3.8% rise in global trade and a consequent 3.1% growth in seaborne trade (Chart 4). Around 12 billion tonnes of cargo is forecast to be moved by sea in 2018 (Chart 5 and 6).
Source: BP Statistical Review, Clarksons ResearchSource: Clarksons Research, March 2018
Chart 5: 2017 (estimate) – 11.6bn tonnes 84% of world trade
Chart 6: 2017 (estimate) – 17% of energy, 25.5m barrels per day and 115bn cubic feet per day
Iron ore 13% Coal 10% Other dry bulk 21% Containers 16% Other dry 8% Crude oil 17% Oil products 9% Gas & chemicals 6%
Oil onshore 24% Oil offshore 9% Gas onshore 16% Gas offshore 8% Coal 30% Nuclear 4% Hydro 7% Renewables 3% Bioenergy 1%
of global trade is carried by sea
growth in seaborne trade forecast for 2018
84 %
3.1%
IUMI Stats 2018 8
Marine insurance
Source: IUMI Global Marine Insurance ReportSource: IUMI Global Marine Insurance Report
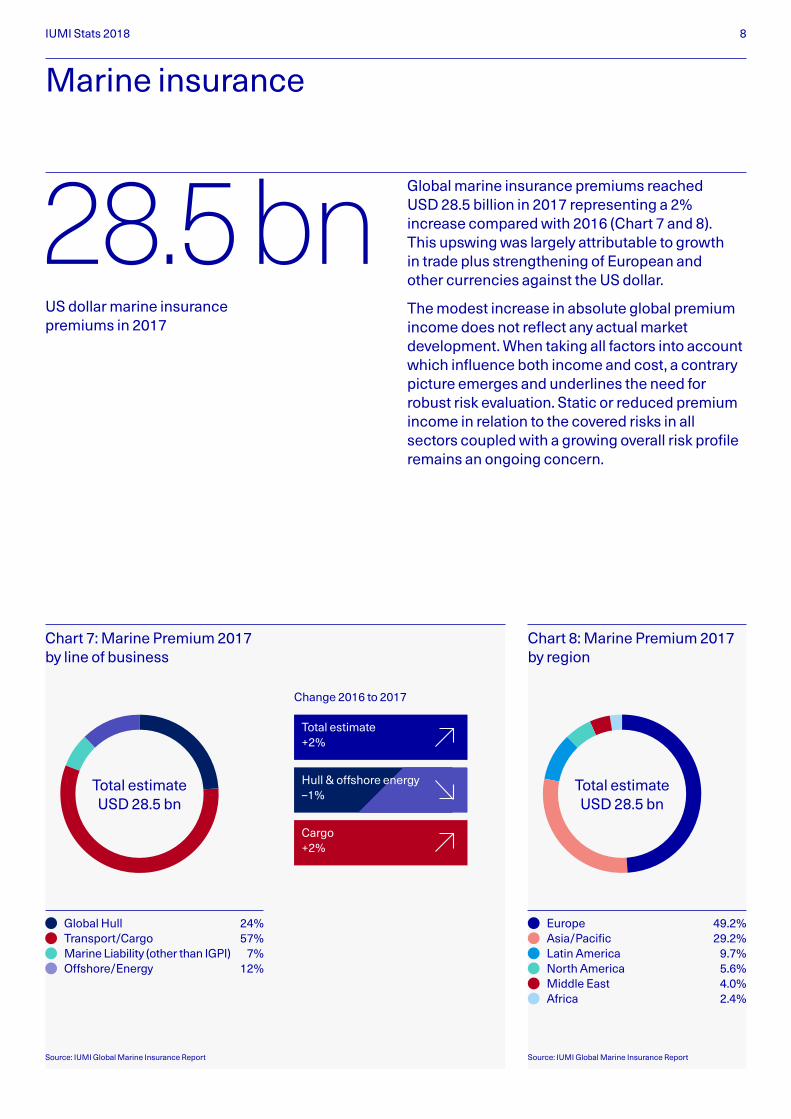
Chart 7: Marine Premium 2017 by line of business
Chart 8: Marine Premium 2017 by region
Global Hull 24% Transport/Cargo 57% Marine Liability (other than IGPI) 7% Offshore/Energy 12%
Europe 49.2% Asia/Pacific 29.2% Latin America 9.7% North America 5.6% Middle East 4.0% Africa 2.4%
Total estimate USD 28.5 bn
Total estimate USD 28.5 bn
Total estimate +2%
Cargo +2%
Change 2016 to 2017
Hull & offshore energy –1%
Global marine insurance premiums reached USD 28.5 billion in 2017 representing a 2% increase compared with 2016 (Chart 7 and 8). This upswing was largely attributable to growth in trade plus strengthening of European and other currencies against the US dollar.
The modest increase in absolute global premium income does not reflect any actual market develop ment. When taking all factors into account which influence both income and cost, a contrary picture emerges and underlines the need for robust risk evaluation. Static or reduced premium income in relation to the covered risks in all sectors coupled with a growing overall risk profile remains an ongoing concern.
US dollar marine insurance premiums in 2017
28.5 bn
IUMI Stats 2018 9
However, accelerating trade growth and a general improvement in several frame conditions, together with the rally in oil price, create a more positive outlook for underwriters – if these opportunities are coupled with prudent underwriting.
In general, the statistics clearly illustrate the need for sustainable underwriting by understanding the simple – and sometimes not so simple – mathematics of evaluating the risks and expected costs associated with a prudent marine portfolio. In this context, one aim of the IUMI Facts and Figures Committee is to provide up to date information on relevant trends in the global economy, the marine industry, and the marine insurance market specifically, and illustrate how these influence both income and cost and their combined effect on marine insurance results.
“The statistics clearly illustrate the need for sustainable underwriting”
IUMI Stats 2018 10
The hull sector recorded a global underwriting income of USD 6.9 billion representing a decrease of 2.3% on the 2016 result. Exchange rates exert less influence on the hull market due to the global nature of the hull portfolio. The downward trend in global hull premiums appeared more severe when compared with world fleet numbers and vessel values. Whilst the global fleet continues to grow in numbers and in average vessel sizes, the average insured values have reduced yearonyear since the financial crash of 2008. This, together with depressed freight rates, has affected premium income.
After two years with twodigit drops in vessel values in the bulk and offshore fleet, 2017 saw a slight rally in vessel values in the bulk market and 2018 is likely to see values increase for the offshore fleet. Under the current frame conditions, vessel values are set to stabilize further but, in the main, the figures show an increasing mismatch between fleet growth and premium income
Global marine hull insurance
US dollar underwriting income was recorded by the hull sector in 2017
6.9 bnSources: No.Ships/tonnage: IHS, Av.Ins.Vessel value: Nordic Marine Insurance Statistics, Hull premium, graph and analysis: IUMI
225%
200%
175%
150%
125%
100%
2005 2006 2007 2008 2009 2010 2011 2012 2013 2014 2015 2016 2017 2018
Chart 9: Hull premium / world fleet Index of evolution 2005 = 100%
Gross tonnage (> 300 GT) No. Ships (> 300 GT) Global Marine Hull Premium* Av. insured vessel value (Renewals & newbuilds – Cefor)
World fleet continues to grow, especially in tonnage
Hull premium deteriorates in line with ship values
Increasing mismatch between fleet / vessel growth and income
IUMI Stats 2018 11
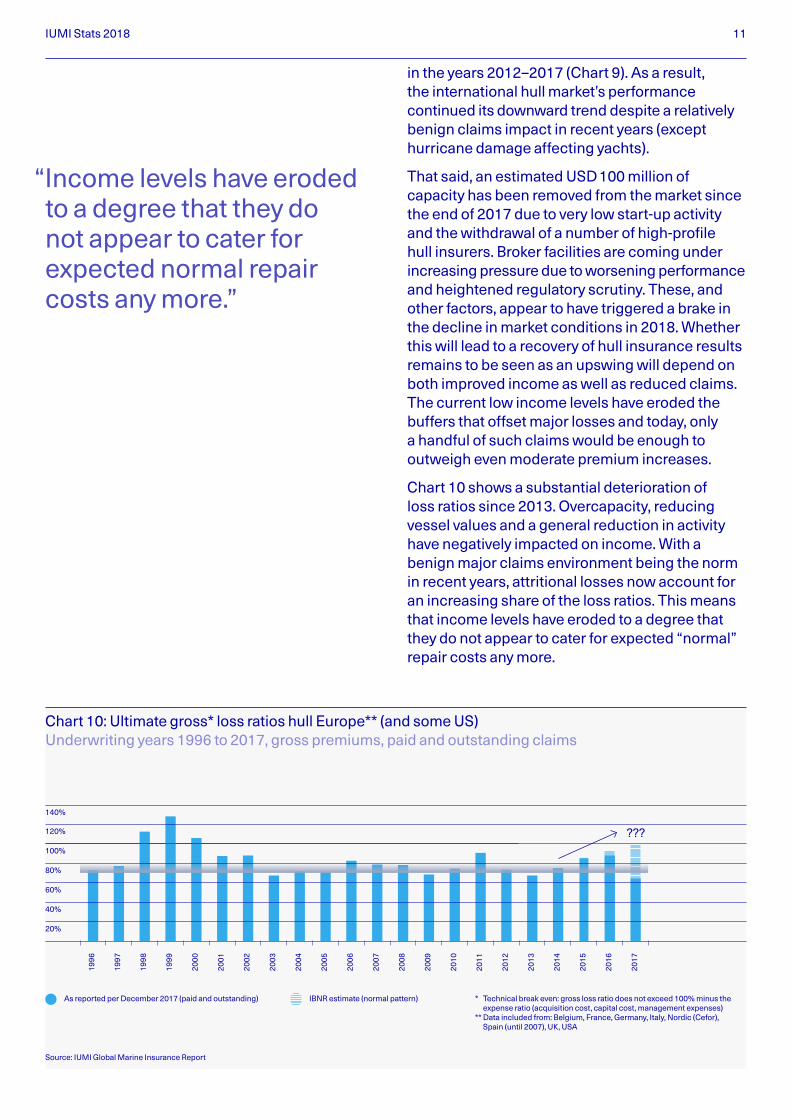
in the years 2012–2017 (Chart 9). As a result, the international hull market’s performance continued its downward trend despite a relatively benign claims impact in recent years (except hurricane damage affecting yachts).
That said, an estimated USD 100 million of capacity has been removed from the market since the end of 2017 due to very low startup activity and the withdrawal of a number of highprofile hull insurers. Broker facilities are coming under increasing pressure due to worsening performance and heightened regulatory scrutiny. These, and other factors, appear to have triggered a brake in the decline in market conditions in 2018. Whether this will lead to a recovery of hull insurance results remains to be seen as an upswing will depend on both improved income as well as reduced claims. The current low income levels have eroded the buffers that offset major losses and today, only a handful of such claims would be enough to outweigh even moderate premium increases.
Chart 10 shows a substantial deterioration of loss ratios since 2013. Overcapacity, reducing vessel values and a general reduction in activity have negatively impacted on income. With a benign major claims environment being the norm in recent years, attritional losses now account for an increasing share of the loss ratios. This means that income levels have eroded to a degree that they do not appear to cater for expected “normal” repair costs any more.
“Income levels have eroded to a degree that they do not appear to cater for expected normal repair costs any more.”
140%
120%
80%
100%
60%
40%
20%
Chart 10: Ultimate gross* loss ratios hull Europe** (and some US) Underwriting years 1996 to 2017, gross premiums, paid and outstanding claims
???
1996
1997
1998
1999
2000
2001
2002
2003
2004
2005
2006
2007
2008
2009
2010
2011
2012
2013
2014
2015
2016
2017
Source: IUMI Global Marine Insurance Report
* Technical break even: gross loss ratio does not exceed 100% minus the expense ratio (acquisition cost, capital cost, management expenses)
** Data included from: Belgium, France, Germany, Italy, Nordic (Cefor), Spain (until 2007), UK, USA
As reported per December 2017 (paid and outstanding) IBNR estimate (normal pattern)
IUMI Stats 2018 12
% of world fleet
0.4%
0.3%
0.2%
0.1%
18
16
14
12
10
8
6
4
2
2005
2005
2004
2004
2003
2003
2002
2001 20022000
2001
1999
2006
2006
2007
2007
2008
2008
2009
2009
2010
2010
2011
2011
2012
2012
2013
2013
2014
2014
2015
2015
2016
2016
2017
2017
Chart 11: Total losses, as a % of world fleet Vessels > 500GT
Chart 12: Total losses, by number Vessels > 500GT
in % of Vessels
Bulkers
in % of gross tonnes
Tankers Containerships NonCargo
Passenger Specialised Fishing General Cargo
Sources: Fleet number: Clarksons Research, Losses: LU, total losses as reported in Lloyds List
Source: LLI: total losses as reported in Lloyds List
90
80
70
60
50
40
30
20
10
General cargo vessels

IUMI Stats 2018 13
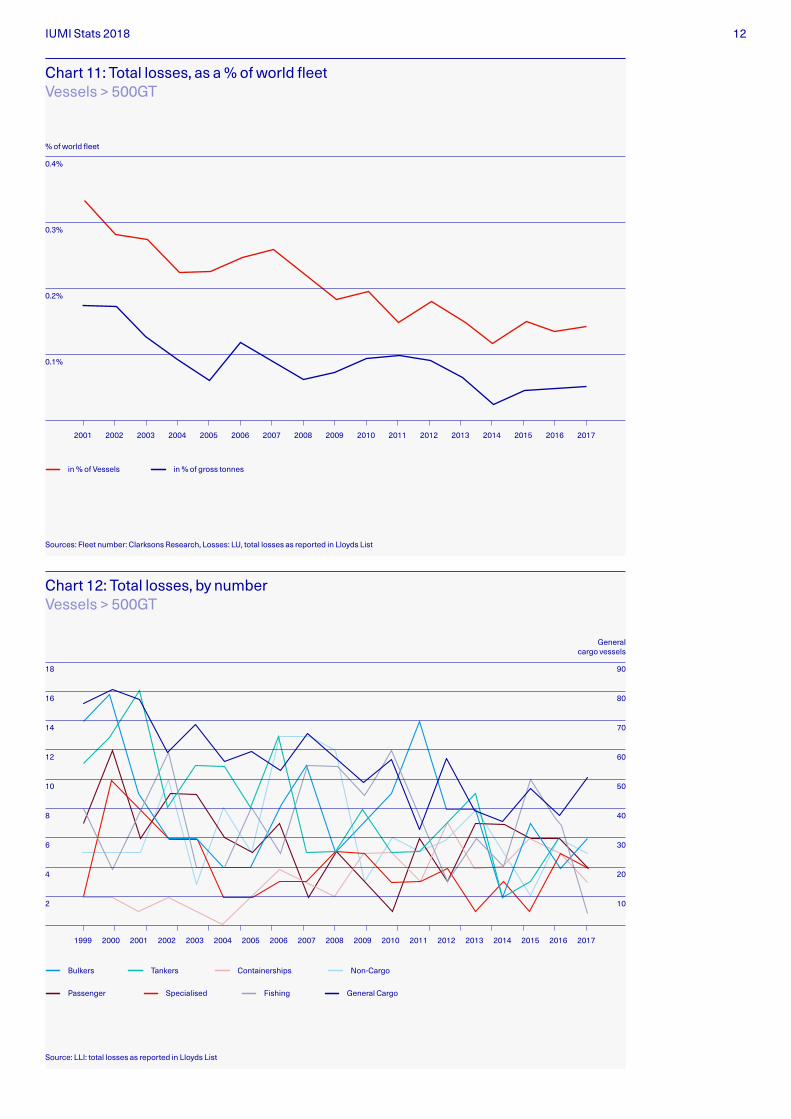
There continues to be a longterm downward trend in the frequency of hull claims in general and for total losses specifically. The positive trend for total losses is a probable effect of an improving risk environment and better safety measures. The frequency of total losses seems to have reached its possible minimum with a recent fluctuation between 0.05% – 0.1%. The reduction in vessel values increases the probability of constructive total losses as the cost of repair is more likely to exceed an accepted percentage of the reduced vessel value.
Chart 11 illustrates the longterm trend of a reduction in the total loss frequency. There was a slight spike in 2014 which has been carried forward in subsequent years, but in general total loss frequency seems to have stabilized at a historically low level of around 0.1%. The 2017 figures include the hurricane season in the USA.
Total losses for all vessel types are trending downwards except for bulkers and general cargo ships which spiked in 2017 (Chart 12).
Major losses have not significantly impacted the sector for some years, but as the annual statistics released by the Nordic Association of Marine Insurers (Cefor) in April 2018 illustrate, the most costly 1% of all claims account for a minimum of 30% of the total claims cost in any given year. Moreover, the risk of a single major loss incurring unprecedented cost remains significant in light of larger and more sophisticated vessels entering the market and new, more risky trading areas such as polar waters being exploited.
In short, despite a recently benign claims environment – except hurricane damage on yachts – the rise in loss ratios clearly shows an increasing gap between a declining income and expected claims cost, even without the impact of costly major losses. This is a significant cause for concern.
“The positive trend for total losses is a probable effect of an improving risk environment and better safety measures.”
“The rise in loss ratios clearly shows an increasing gap between a declining income and expected claims cost.”
IUMI Stats 2018 14
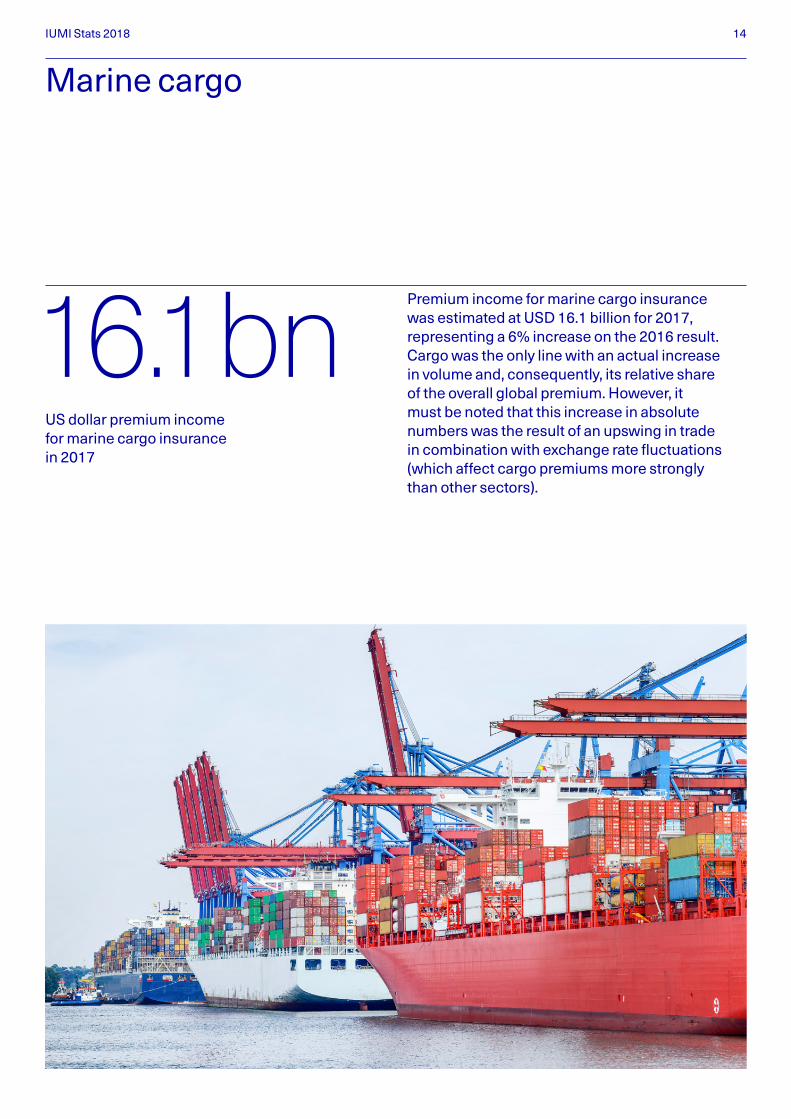
Marine cargo
Premium income for marine cargo insurance was estimated at USD 16.1 billion for 2017, representing a 6% increase on the 2016 result. Cargo was the only line with an actual increase in volume and, consequently, its relative share of the overall global premium. However, it must be noted that this increase in absolute numbers was the result of an upswing in trade in combination with exchange rate fluctuations (which affect cargo premiums more strongly than other sectors).
US dollar premium income for marine cargo insurance in 2017
16.1bn

IUMI Stats 2018 15
Global seaborne trade is continuing to grow throughout 2018, this trend has been evident since the global drop in trade value in 2009.
Energy commodities and the metals industry contribute the largest share to seaborne trade which reached 11.25 billion tonnes in 2017 and is forecast to achieve 12 billion this year (Chart 13).
tonnes of seaborne trade is forecast for 2018
12 bn
Chart 13: Global seaborne trade by commodity
Source: Clarksons Research, March 2018
Trade exceeds 10 mt
1.5 tonnes /person
1 tonne /person
yoy % Change (RHS)
14 12%
10%
8%
6%
4%
2%
0%
–4%
–2%
12
10
8
6
4
2
2000 2001 2002 2003 2004 2005 2006 2007 2008 2009 2010 2011 2012 2013 2014 2015 2016 2017 2018 (f)
year over year change (RHS)bn tonnes
CAGR 2000–2017 +3.6%
Other dry Gas & chemicals Oil products Crude oil Containers
Minor bulk Grain Coal Iron ore
IUMI Stats 2018 16
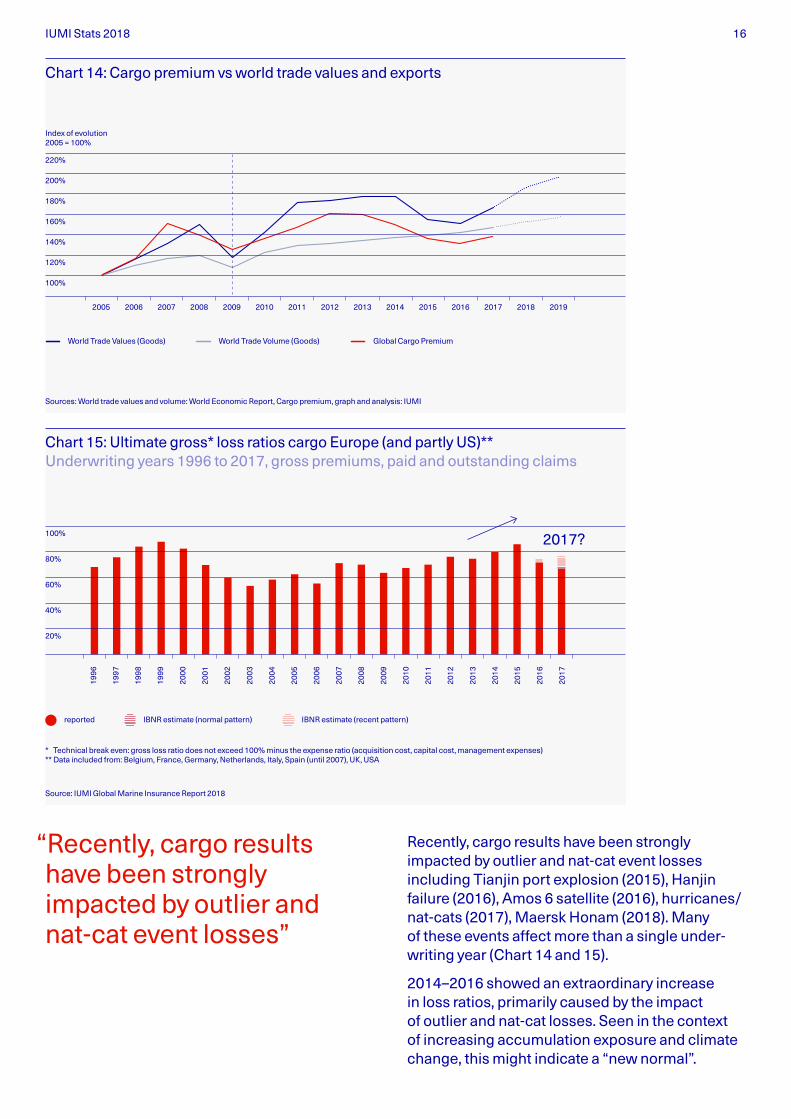
Recently, cargo results have been strongly impacted by outlier and natcat event losses including Tianjin port explosion (2015), Hanjin failure (2016), Amos 6 satellite (2016), hurricanes/natcats (2017), Maersk Honam (2018). Many of these events affect more than a single underwriting year (Chart 14 and 15).
2014–2016 showed an extraordinary increase in loss ratios, primarily caused by the impact of outlier and natcat losses. Seen in the context of increasing accumulation exposure and climate change, this might indicate a “new normal”.
Chart 14: Cargo premium vs world trade values and exports
Chart 15: Ultimate gross* loss ratios cargo Europe (and partly US)** Underwriting years 1996 to 2017, gross premiums, paid and outstanding claims
220%
200%
180%
160%
140%
120%
100%
Index of evolution 2005 = 100%
World Trade Values (Goods) World Trade Volume (Goods) Global Cargo Premium
2005 2006 2007 2008 2009 2010 2011 2012 2013 2014 2015 2016 2017 2018 2019
Sources: World trade values and volume: World Economic Report, Cargo premium, graph and analysis: IUMI
Source: IUMI Global Marine Insurance Report 2018
80%
100%
60%
40%
20%
2017?
1996
1997
1998
1999
2000
2001
2002
2003
2004
2005
2006
2007
2008
2009
2010
2011
2012
2013
2014
2015
2016
2017
* Technical break even: gross loss ratio does not exceed 100% minus the expense ratio (acquisition cost, capital cost, management expenses)** Data included from: Belgium, France, Germany, Netherlands, Italy, Spain (until 2007), UK, USA
reported IBNR estimate (normal pattern) IBNR estimate (recent pattern)
“Recently, cargo results have been strongly impacted by outlier and natcat event losses”

IUMI Stats 2018 17
2017 continued this recent trend and is expected to be affected more than average due to a number of natcat events including hurricanes, the Mexican earthquake, flooding in Bangladesh and the Californian wildfires. Underwriting year results always deteriorate due to the lag in registering and paying claims. When all claims attaching to the 2017 underwriting year are known, a final gross loss ratio of around 80% is likely to be reported.
Of special concern is the increasing risk of a large event loss (either natcat or manmade) in the cargo sector due to increasing value accumulations on single sites or vessels, in combination with stronger natcat impact. This demonstrates clearly the need for the sector to improve its control of such risk accumulations and develop risk adequate premiums taking all aspects into account.
Whilst there are geographical differences, the global cargo insurance market remains highly competitive with an abundance of capacity. Following the 2017 natcat incidents there has been a firming of market conditions for cargo accounts impacted by these events and on loss affected business (Chart 16).
$2,500,000,000
$2,000,000,000
$500,000,000
$1,000,000,000
$1,500,000,000
Source: RMS Risk Management Solutions
Nagoya, Ja
pan
Guangzhou, C
hina
Plaquemines, LA, U
.S.
Bremerh
aven, G
ermany
New Orle
ans, LA, U
.S.
Pascagoula, MS, U
.S.
Beaumont, TX, U
.S.
Baton Rouge, L
A, U.S.
Houston, T
X, U.S.
Le Havre
, Fra
nce
Chart 16: Marine top risk accumulation in ports
The modeling takes into account: cargo type (e.g. autos, bulk grains, electronics specie), precise storage location (e.g. coastal, estuarine, waterside or within dock complex), storage type (e.g. open air, warehouse, container – stacked or ground level), dwell time (which can vary due to port automation, labor relations and import / export ratios)
Ports at risk for highest losses due to natural perils
final gross loss ratio likely to be reported in 2017
80 %
IUMI Stats 2018 18
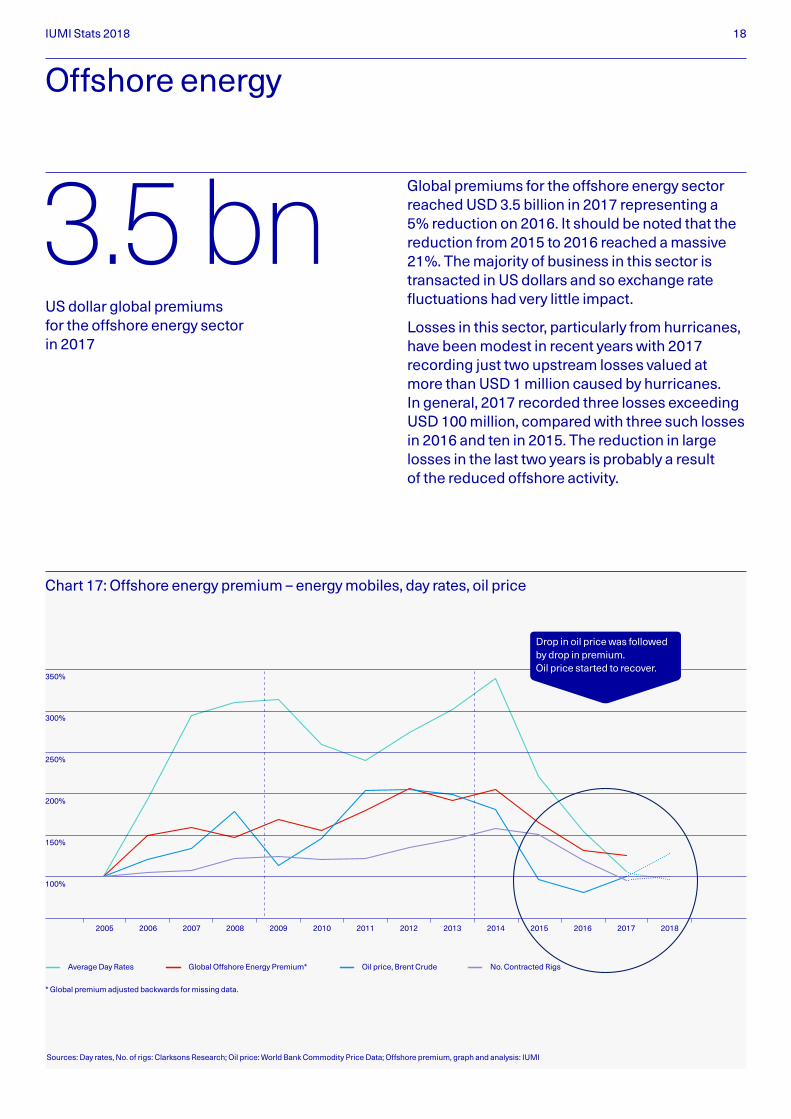
Offshore energy
Global premiums for the offshore energy sector reached USD 3.5 billion in 2017 representing a 5% reduction on 2016. It should be noted that the reduction from 2015 to 2016 reached a massive 21%. The majority of business in this sector is transacted in US dollars and so exchange rate fluctuations had very little impact.
Losses in this sector, particularly from hurricanes, have been modest in recent years with 2017 recording just two upstream losses valued at more than USD 1 million caused by hurricanes. In general, 2017 recorded three losses exceeding USD 100 million, compared with three such losses in 2016 and ten in 2015. The reduction in large losses in the last two years is probably a result of the reduced offshore activity.
US dollar global premiums for the offshore energy sector in 2017
3.5 bn
2005 2006 2007 2008 2009 2010 2011 2012 2013 2014 2015 2016 2017 2018
Chart 17: Offshore energy premium – energy mobiles, day rates, oil price
350%
300%
250%
200%
150%
100%
Sources: Day rates, No. of rigs: Clarksons Research; Oil price: World Bank Commodity Price Data; Offshore premium, graph and analysis: IUMI
* Global premium adjusted backwards for missing data.
Average Day Rates Global Offshore Energy Premium* Oil price, Brent Crude No. Contracted Rigs
Drop in oil price was followed by drop in premium. Oil price started to recover.
IUMI Stats 2018 19
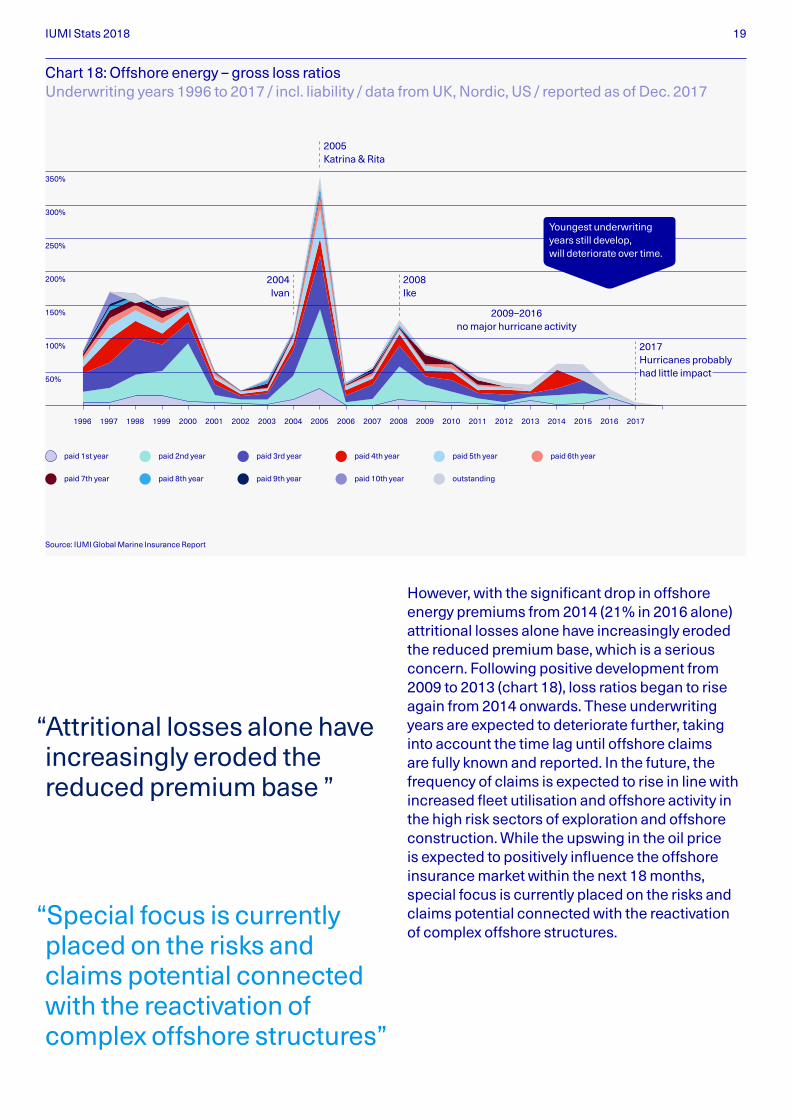
However, with the significant drop in offshore energy premiums from 2014 (21% in 2016 alone) attritional losses alone have increasingly eroded the reduced premium base, which is a serious concern. Following positive development from 2009 to 2013 (chart 18), loss ratios began to rise again from 2014 onwards. These underwriting years are expected to deteriorate further, taking into account the time lag until offshore claims are fully known and reported. In the future, the frequency of claims is expected to rise in line with increased fleet utilisation and offshore activity in the high risk sectors of exploration and offshore construction. While the upswing in the oil price is expected to positively influence the offshore insurance market within the next 18 months, special focus is currently placed on the risks and claims potential connected with the reactivation of complex offshore structures.
Chart 18: Offshore energy – gross loss ratios Underwriting years 1996 to 2017 / incl. liability / data from UK, Nordic, US / reported as of Dec. 2017
350%
300%
250%
200%
150%
100%
50%
1996 1997 1998 1999 2000 2001 2002 2003 2004 2005 2006 2007 2008 2009 2010 2011 2012 2013 2014 2015 2016 2017
paid 1st year
paid 7th year
paid 2nd year
paid 8th year
paid 3rd year
paid 9th year
paid 4th year
paid 10th year
paid 5th year
outstanding
paid 6th year
Source: IUMI Global Marine Insurance Report
Youngest underwriting years still develop, will deteriorate over time.
2004 Ivan
2008 Ike
2009–2016 no major hurricane activity
2005 Katrina & Rita
“Attritional losses alone have increasingly eroded the reduced premium base ”
“Special focus is currently placed on the risks and claims potential connected with the reactivation of complex offshore structures”
2017 Hurricanes probably had little impact
IUMI Stats 2018 20
70%
50%
60%
100%
90%
80%
% Utilisation
Number of active rigs
800
100
200
300
400
500
600
700
Jan
’80
Jan
’81
Jan
’82
Jan
’83
Jan
’84
Jan
’85
Jan
’86
Jan
’87
Jan
’88
Jan
’89
Jan
’90
Jan
’91
Jan
’92
Jan
’93
Jan
’94
Jan
’95
Jan
’96
Jan
’97
Jan
’98
Jan
’99
Jan
’00
Jan
’01
Jan
’02
Jan
’03
Jan
’04
Jan
’05
Jan
’06
Jan
’07
Jan
’08
Jan
’09
Jan
’10
Jan
’11
Jan
’12
Jan
’13
Jan
’14
Jan
’15
Jan
’16
Jan
’17
Jan
’18
Jan
’19
Jan
’20
Chart 19: Rig utilisation – a longer term view
Source: Clarksons Research
Demand and utilisation forcast
Demand Utilisation
Current utilisation Jackups: 71% Floaters: 69%
$/bblNumber of deliveries
Source: Clarksons Research
Floater orderbook Floater fleet Jackup orderbook Jackup fleet
80
70
60
50
40
30
20
10
140
120
100
80
60
40
20
1957
1970
1975
1980
1985
1990
1995
2000
2005
2010
2015
2020
+
Chart 20: Rig age profile
Large orderbook but slippage likely
2nd generation
4th generation
5th generation
6th generation3rd generation
Oil price ($ per barrel)
IUMI Stats 2018 21
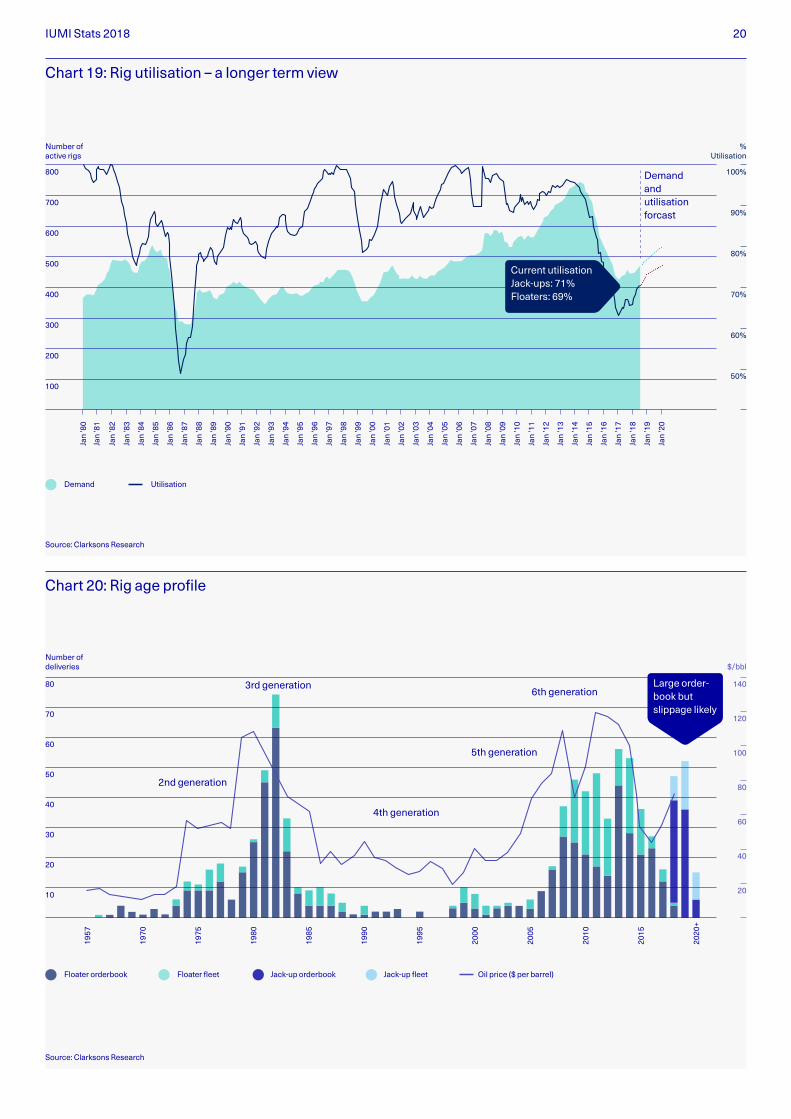
The strong decrease in income from 2014 driven by the falling oil price started to flatten out from 2017 as oil prices began to rally. Oil prices have steadily risen by 40% since 2017 and this is starting to drive activity in the oil and gas sector. Capital expenditure in the sector is forecast to grow by around 6% each year with the majority being in North America, Africa and Latin America.
Both production and consumption of oil is expected to continue to rise for the foreseeable future. Here we need to apply some caution as the margins between supply and demand are thin but these small margins can create volatility in the market. OPEC and Russia’s ongoing discussions could impact the price of a barrel of oil significantly as could geopolitical considerations in countries such as Venezuela and Iran. That said, there are enough positive factors for offshore energy underwriters to view the immediate future with slightly more optimism that they have been able to do for the past two or three years.
Demand and utilisation/supply are all increasing since their lowest levels in December 2016. Forecasts for 2019 and 2020 show a similar, positive trend (Chart 19). A large orderbook exists for 2018 and 2019, particularly for jackup rigs. There is likely to be some slippage, however (Chart 19).
“Offshore energy underwriters to view the immediate future with slightly more optimism”

IUMI Stats 2018 22
More information The graphs in this report are extracted from the following IUMI publications:
— 2018 Report on World Merchant Fleet and World Trade
— 2018 Global Marine Insurance Report
— 2018 Cargo, Ocean Hull and Offshore Energy Factsheets
These and additional information such as marine premiums by country, loss ratio triangulations for cargo, hull and offshore energy, and hull and cargo inflation indices are available from the statistics section of IUMI’s website www.iumi.com/statistics
Data sources Information sources are clearly stated at the foot of each chart. IUMI thanks its partners who have kindly supplied charts or data for this document.
IUMI data IUMI’s total worldwide premium includes data from all relevant marine insurance markets including Asia, Latin America and Africa. Care should be taken when making comparisons with earlier published figures as data coverage varies in different years and a number of figures will be updated retrospectively. Similarly, “global” loss ratios for hull, energy and cargo do not encompass all regions, and underwriting year results do develop over a couple of years due to a time lag in claims reporting and payments. Since 2017, IUMI has been able to show accounting year loss ratios originating from major Asian and Latin American markets (not included here, see IUMI’s Global Marine Insurance Report), in addition to the underwriting year loss ratios reported from primarily major European marine insurance markets. When interpreting statistics, caution should always be applied regarding what the data actually relates to.
All figures released by IUMI are global market sums or averages. While these reflect the average performance of the marine insurance market, individual companies’ or countries’ results may differ substantially. As with all averages, individual underwriting units may over or underperform compared with the average. IUMI does not make any statements about what actual applied premium rates were or should be. The aim of IUMI is solely to provide data as available and raise awareness for the importance of a critical evaluation of the risks covered.
Notes
IUMI Stats 2018 23
Disclaimer This publication provides general information only and should not be relied upon for business, investment or any other purpose. Whilst every effort has been made to ensure that the information provided is accurate, this information is provided without any representation or warranty of any kind about its accuracy and IUMI, its officers or representatives cannot be held responsible for any mistakes or omissions. Information, views and opinions expressed are those of IUMI and are not attributed to any individual committee member or officer of IUMI.
Copyright Copyright © 2018 International Union of Marine Insurance/ All rights reserved.
About IUMI The International Union of Marine Insurance (IUMI) represents 42 national and marine market insurance and reinsurance associations. Operating at the forefront of marine risk, it gives a unified voice to the global marine insurance market through effective representation and lobbying activities. As a forum for the exchange of ideas and best practice, IUMI works to raise standards across the industry and provides opportunities for education and the collection and publication of industry statistics. IUMI is headquartered in Hamburg and traces its roots back to 1874.
IUMI Stats 2018 24
Facts & Figures Committee
Dave Matcham, Policy Forum Liaison, IUA (International Underwriting Association)
Andrea Mazza, Swiss Re International SE
Emiel Paaij, DUPI Underwriting Agencies BV
Erika Schoch, Swiss Reinsurance America Corp.
Atsushi Tabata, Sompo Jappan Nipponkoa Insurance Inc.
Li Zhang, China Property & Casualty Reinsurance
Donald Harrell, Chair, Aspen Insurance
Astrid Seltmann, Vice Chair, Cefor (The Nordic Association of Marine Insurers)
Philip Graham, Vice Chair, Chaucer Syndicate 1084
Marika Svalskulla, Secretary, Sirius International Insurance
Javier Alonso, Mapfre Re
Ben Chung, Bank of China Group Insurance Company Limited
Robert Copp, Axis Reinsurance
Mathieu Daubin, Axa Corporate Solutions
Paul Hackett, Canopius
Stephan Klein, General Reinsurance AG, Gen Re
Lars Lange, IUMI Secretary General
Jun Lin, Gard
IUMI Stats 2018 3
At the forefront of marine risk
International Union of Marine Insurance Grosse Elbstrasse 36 D22767 Hamburg, Germany Telephone +49 40 2000 7470 Email [email protected]
iumi.com


