AN ANALYSIS OF THE PRESIDENT’S BUDGET FOR FISCAL YEAR 2006 3 rd Floor Main Building House of Representatives Constitution Hills, Quezon City Tel. Nos. 931-6032 or 931-9392 www.geocities.com/cpbo_hor 3F Main Bldg. January 2006 CONGRESSIONAL PLANNING AND BUDGET DEPARTMENT
Transcript
AN ANALYSIS OF THE PRESIDENT’S BUDGET FOR FISCAL YEAR 2006
3rd Floor Main Building House of Representatives Constitution Hills, Quezon City Tel. Nos. 931-6032 or 931-9392 www.geocities.com/cpbo_hor 3F Main Bldg.
January 2006
CONGRESSIONAL PLANNING AND BUDGET DEPARTMENT
AN ANALYSIS OF THE PRESIDENT’S BUDGET
FOR FISCAL YEAR 2006
TABLE OF CONTENTS
Pages
PART 1 CHAPTER 1: FRAMEWORK AND ORGANIZATION OF THE REPORT 1 CHAPTER 2: THE MACROECONOMIC PERSPECTIVE
Macroeconomic Overview 6 Economic Growth and Sectoral Analysis 12 Growth Assumptions by Expenditure Shares 14 Economic and Fiscal Scenarios 16
Sensitivity Analysis 18 CHAPTER 3: REVENUE PROGRAM Revenue Performance 23 2006 Revenue Program 27 CHAPTER 4: EXPENDITURE PROGRAM Sectoral Appropriations 32 Object of Expenditures 35 Sources of Appropriations 37 Regional Allocation 38 Allocation by Department and Special Purpose Funds 38 Cash vs. Obligation Budget 44 CHAPTER 5: DEFICIT FINANCING PROGRAM
NG Borrowing Program 47 NG Deficit and Debt 51 Consolidating the Public Sector 53 Debt Sustainability 55 PART 2 CHAPTER 6: INFRASTRUCTURE
Public Sector Infrastructure Budget 61 Public Infrastructure Expenditure by Type 63
The Bigger Task Ahead: Combating Corruption 74
CHAPTER 7: AGRICULTURE Agricultural Performance 77 Challenges to Agricultural Productivity and Rural Welfare 81 Public Investment in Agriculture 84
CHAPTER 8: BASIC EDUCATION Increasing Demand for Education 91
Education Outcomes 92 Achieving Medium-Term Targets 96 Expenditures on Education 98 Closing the Resource Gaps 102
Health Status and Trends 119 Factors Behind Poor Health Indicators 123 Age Structure and Dependency Ratio 125 Refocusing Health Interventions to Vulnerable Age Groups 127 Health Spending in the Economy 128 NG Share to Total Health Spending 131 Tracking the Goals, Identifying Lapses and Estimating Costs 132 MTPDP Concerns 133 MDG Concerns 134 Resource Requirements 135 Analysis of FY 2006 Proposed Health Budget 137
CHAPTER 11: HOUSING
Housing Need 141 Significant Supply But Short Still of Demand 142
NG Budget for Housing 143 Policy and Institutional Issues 146 MTPDP Goals and Action Plans 149
CHAPTER 12: CONCLUDING REMARKS 151 LIST OF TABLES Table 2.1 Philippine GDP Growth Prospects 7 Table 2.2 Cross-Country Comparison, GDP Growth Rates 9 Table 2.3 Factors Affecting Economic Outlook 11 Table 2.4 Sectoral Growth Assumptions, GDP by Industrial Origin 13 Table 2.5 Sectoral Growth Assumptions, GDP by Expenditures Share 15 Table 2.6 Growth Assumptions and Concomitant Effort 16 Table 2.7 Economic Growth and Fiscal Scenarios 17 Table 2.8 Sensitivity Indicators, 2006 21 Table 2.9 GNP and GDP, Actual and CPBD Growth Scenarios 22
LIST OF TABLES Table 3.1 Revenue Effort of Selected Asian Countries 24 Table 3.2 VAT Collection Efficiency 25 Table 3.3 Revenue Collections 27 Table 3.4 Estimated Yield of New Measures 28 Table 3.5 2006 CPBD Revenue Estimates 29 Table 3.6 2006 DBCC Targets and CPBD Revenue Projections 29 Table 4.1 NG Expenditure Program By Sector, 2004-2006 32 Table 4.2 Economic Services Expenditure Program, 2004-2006 33 Table 4.3 Social Services Expenditure Program, 2004-2006 34 Table 4.4 Public Services Expenditure Program, 2004-2006 35 Table 4.5 Expenditure Program by Object 2004-2006 36 Table 4.6 Budget Level By Source of Appropriations 37 Table 4.7 NG Regional Expenditure Program, 2006 39 Table 4.8 NG Expenditure Program By Department 40 Table 4.9 NG Expenditure Program By Special Purpose Fund 42 Table 4.10 Comparative Obligation Budget 45 Table 4.11 Gainers and Losers Under a 2005 Re-Enacted Budget 45 Table 5.1 Borrowing Mix, 2004-2005 49 Table 5.2 Deficit History 51 Table 5.3 Debt Ratios 52 Table 5.4 Consolidated Public Sector Fiscal Position 53 Table 5.5 Fiscal Position of 14-Monitored GOCCs 54 Table 5.6 Consolidated Public Sector Debt 55 Table 5.7 External Debt Ratios (in %) 57 Table 6.1 Philippine Infrastructure Competitiveness Ranking 60 Table 6.2 International Comparison on Infrastructure 61 Table 6.3 Philippine Infrastructure Allocation 62 Table 6.4 National Government Infrastructure Budget 63 Table 6.5 Philippine Road Indicators 64 Table 6.6 Regional Public Investments in Roads and Bridges 65 Table 6.7 2003 DPWH Infrastructure Program 66 Table 6.8 Number of Waterless Communities/Households 67 Table 6.9 2005 Regional Allocation of the P3W Fund (1st Batch) 68 Table 6.10 Status of Energization 70 Table 6.11 E-Government Readiness Ranking 72 Table 6.12 E-Government Fund Projects 73 Table 6.13 NG Budget Allocation for Ports and Airports 74 Table 7.1 Agricultural Labor Productivity 83 Table 7.2 Infrastructure Outlay Under AFMP, 2002-2006 86 Table 7.3 Appropriations by Programs 88
LIST OF TABLES Table 8.1 Performance Indicator in Basic Education 93 Table 8.2 Minimum Basic Needs Indicators 94 Table 8.3 Achievement Rates, SY 2002-2003 96 Table 8.4 MDG Rate of Progress in Elementary Education 96 Table 8.5 Education Targets, 2005 and 2010 98 Table 8.6 Public Expenditure on Education 99 Table 8.7 DepEd Budget, By Object of Expenditures 100 Table 8.8 Per Capita Spending in Basic Education 101 Table 8.9 Elementary Achievement Rate Vis-à-vis Per Capita Spending 101 Table 8.10 Textbooks and Teacher Gaps, FY 2005 102 Table 8.11 Closing the Classroom Gap, 2004-2010 103 Table 9.1 Educational Attainment, By Gender/Income (2000) 111 Table 10.1 Seven Leading Causes of Morbidity 122 Table 10.2 Life Expectancy at Birth, Selected Asian Countries 123 Table 10.3 Projected Dependency Ratio 125 Table 10.4 Projected Philippine Population 128 Table 10.5 Health Expenditure in Asian Countries 129 Table 10.6 Total Health Expenditures 129 Table 10.7 Health Expenditure Per Capita 130 Table 10.8 Share of NG to Total Health Spending 131 Table 10.9 NG Health Expenditure Per Capita 131 Table 10.10 Health Progress vis-à-vis MTPDP and MDG Targets 133 Table 10.11 DOH Estimated Funding Gap for 2006 135 Table 10.12 Estimated Breakdown of 2006 Resource Requirement for Basic Health 136 Table 10.13 Resource Requirement to Meet MDG on Basic Health 137 Table 10.14 NG Allocation to Health 138 Table 10.15 NG Allocation to DOH by Expense Class 139 Table 11.1 Housing Need, 2005-2010 142 Table 11.2 Housing Targets and Accomplishments 142 Table 11.3 Program for Slum Dwellers 143 Table 11.4 NG Allocation to Housing and Community Development 144 Table 11.5 Total NG Budgetary Support to Shelter Agencies 144 Table 11.6 2006 Comparative Resource Requirement of Gov't Shelter Program 145 Table 11.7 Rate of Change in Housing Price in Selected Asian Cities 148 Table 11.8 Incidence of Housing Subsidies 149
LIST OF FIGURES Figure 2.1 Quarterly Real GDP Growth 6 Figure 2.2 Real Annual GDP Growth 8 Figure 3.1 Revenue Effort 25 Figure 5.1 NG Deficit and Financing Program, FY 2006 48 Figure 5.2 Actual vs. Program Borrowing 50 Figure 6.1 Infrastructure Competitiveness Ranking 60 Figure 6.2 Public Sector Infrastructure Budget 63 Figure 7.1 GVA in Agriculture, Fishery and Forestry 78 Figure 7.2 Cereal Production, 2000-2004 79 Figure 7.3 Poverty in the Agriculture Sector, 1997-2003 80 Figure 7.4 Labor Productivity, 2003 82 Figure 7.5 Percentage share of Crops to Total Crop Production 84 Figure 7.6 Public Expenditures in Agriculture 85 Figure 8.1 School-Age Population, 1995-2015 92 Figure 8.2 Regional Performance Indicators 95 Figure 8.3 Children Reaching Grade 5, 2001-2002 97 Figure 8.4 Share of Education in Social Service Spending 99 Figure 9.1 Gross Enrollment Ratio in Tertiary Level, Selected Countries 109 Figure 9.2 Number of SUCs, Main and Satellite Campuses 110 Figure 9.3 Enrollment Distribution of Higher Education 110 Figure 9.4 Performance Indicator in Higher Education 112 Figure 9.5 Receipts of SUCs 113 Figure 9.6 SUCs Nominal Budget and Growth Rates 114 Figure 10.1 U5MR for Selected Asian Countries, 2003 120 Figure 10.2 Maternal Mortality Ratio 121 Figure 10.3 Physician Per 100,000 People, Selected Asian Countries 122 Figure 10.4 Philippine Life Expectancy at Birth 123 Figure 10.5 Average Annual Population Growth Rate, Selected Asian Countries 124 Figure 10.6 Total Fertility Rates, Selected Asian Countries 124 Figure 10.7 Share of Health Expenditure to GNP and GDP 129 Figure 10.8 Health of Expenditure by Source of Funds 130 Figure 10.9 Local Government Health Spending Vis-à-Vis IRA 132 Figure 10.10 Comparison of DOH and LGU Health Spending, 2003 132 Figure 10.11 Share of Health Spending to Total NG Budget and GDP 138 This report was prepared under the supervision of Dr. Romulo Emmanuel Miral, Jr. by a core team composed of Novel Bangsal, Manuel Aquino and Dina de Jesus-Pasagui. Inputs were provided by Genalyn Villaseñor, Elsie Gutierrez, Pamela Diaz-Manalo, Flor Mamhot, Leni Lebrilla, Eleanor Mamaril, Jaime Singson, Ricardo Mira and Aurea Sempio. The following staff rendered research assistance: John Paul Quieta, Prince Cal Mamhot, Ruben Caesar Beltran, Diomedes Goboleo, and Agnes Barte. Lay-out was done by Arlene Lopez-Tuazon and Rommel Asuncion. The report benefited from the insights of Director-General Rodolfo Vicerra. The CPBO acknowledges the assistance of the House Printing and Reproduction Service.
PART
MACRO ASSESSMENT OF THE PRESIDENT’S BUDGET
1
Chapter
FRAMEWORK AND
ORGANIZATION OF THE REPORT The P1.053 trillion proposed National Budget for fiscal year 2006 is envisioned by the
Executive Branch to be a potent weapon for the permanent upliftment of the large mass of
the Filipino people from poverty. It is intended to put into action the 10-point agenda of the
President, laid out in the Medium Term Philippine Development Plan, namely: job
opportunities and credit, education for the poor, balanced budget, electricity and water supply
to towns and barangays, transport and digital networks, decongestion of Metro Manila,
development of service and logistics centers in Clark and Subic, automation of electoral
process, and successful conclusion of the peace process.
The fiscal problem, however, remains as one of the major challenges facing the government.
With the projected deficit of P124.9 billion in 2006, the national government would be
running a budgetary deficit for nine consecutive years since 1998. This raises a major issue of
whether the government’s deficit spending and borrowing program is sustainable.
One way to assess the sustainability of the budget deficit is to consider its consistency with
the other macroeconomic targets, such as the real growth rate of GDP or GNP, inflation rate,
interest rate and exchange rate. A good starting point to understand this relationship is
through the national income accounting identity, which states that the government’s
budgetary deficit must be financed by domestic private sector savings and/or foreign savings.
Borrowing from the domestic financial markets increases the demand for domestic loanable
funds. This puts pressure on interest rate to rise. High interest rate in turn reduces the
number of viable projects and discourages private investments. Thus, the budget deficit can
11
FRAMEWORK AND ORGANIZATION OF THE REPORT 22
be regarded prudent or sustainable if its implied domestic borrowing requirement will not
cause interest rates to rise beyond the targeted interest rate that is consistent with the desired
level of private investment.
External borrowing or borrowing from foreign savings can allow the government to run
sizeable budget deficits without causing domestic interest rates to rise. The sustainability of
external deficit financing can be assessed with regard to the targeted ratio of gross external
debt to exports or the desired ratio of foreign reserves to import. By ensuring that the debt-
servicing ratios are within the desired levels, the government can maintain its external credit
worthiness.
A sustainable fiscal deficit is also defined as one that leads to a declining debt-to-GDP ratio.
For this to be realized the government must eventually post a primary surplus, that is a
positive balance between government revenues and expenditures excluding interest payments.
The primary surplus ensures that current revenues cover at least the part of the interest on
current debt resulting in declining debt-to-GDP ratio. The only exception to this requirement
is if the growth rate of the economy—and of public revenues—persistently exceeds the real
interest rate on public debt, which assumes highly efficient and effective use of resources. In
general, however, it is not possible for the rate of economic growth to be consistently higher
than the interest rate.
In addition to the promotion of economic stability, the national budget could be an effective
instrument for effecting structural changes that enhance efficiency and equity, and promote
poverty alleviation. In this regard attention is given to the composition and structure of
government revenues and expenditures. The allocation and composition of the budget—by
sector, by function, by type and object of expenditure, by agency and by region—and
corresponding trends, should reflect the government’s priorities. The President’s 10-point
agenda spells out the government’s priorities that should find support in the allocation of the
national budget.
Part I of the report is largely devoted to the assessment of the national budget and its implied
fiscal targets (i.e. revenue, expenditure, deficit and financing requirements) in terms of
consistency to the macroeconomic targets or assumptions. Specifically, Chapter 2 on
macroeconomic perspective reviews the underlying macroeconomic assumptions of the
national budget including possible effects of potential downside risks factors on the fiscal
targets. It also provides alternative fiscal scenarios arising from different sets of
macroeconomic projections. Chapter 3 on financing the budget examines in-depth the
composition and trends in national government revenues. It analyzes the causes of the decline
CONGRESSIONAL PLANNING AND BUDGET DEPARTMENT 33
in the tax effort and assesses the likelihood of meeting the government’s targeted revenues
for the current and ensuing fiscal year. The section also provides a brief discussion on the
government’s priority revenue measures.
Chapter 4 on government expenditures discusses the size, trend and composition of
government expenditures. It highlights the squeeze on the budget brought about by the huge
debt-servicing requirements. Chapter 5 on deficit spending and government debt presents the
magnitude of the deficits and the public sector borrowing requirements for fiscal year 2006
and the recent years. It examines the sustainability of the current fiscal deficit and reviews the
medium-term fiscal targets of the government.
Part 2 focuses on budgetary allocation to specific sectors specifically the sectors that are
critical to the 10-point agenda of the government namely: infrastructure, agriculture,
education, health, and housing. Each chapter presents the strategic importance and current
situation of the sector, and the sector’s budgetary allocation vis-à-vis past allocation and its
resource requirement. The last chapter summarizes the findings and recommendations of the
study.
Chapter
MACROECONOMIC PERSPECTIVE UPDATE1: The 2006 Budget Amid Risks and Uncertainty
Amid vulnerabilities, robust and effective reforms are imperative in enhancing the quality of economic growth and the tax effort, which both impact tremendously on the government’s revenue and deficit targets. Reforms would boost resource availability that could support the government’s commitment to poverty alleviation and sustainable development, only if efficiently allocated and protected from undue leakages. Lower GDP growth performance would result in lower tax take. While uptick in non-tax revenues would contribute in addressing deficit concerns, enhancing the tax effort would still be a better and sustainable option in mitigating the impact of lower growth assumptions.
The President’s fiscal budget hinges on macroeconomic assumptions and, in itself, is bound
to influence aggregate demand. The national obligation budget2 proposal of P1.053 trillion
for fiscal year 2006 submitted by the President to Congress is roughly 17.2% of projected
nominal gross domestic product (GDP)3 in the same year.
The Executive is targeting tax collections of P874.3 billion (or 14.3% of GDP) to support
almost 80% of the proposed disbursement program of P1.093.5 trillion while P94.3 billion
from non-tax sources is intended to shore up approximately 8.6% of disbursements. The
balance in the disbursement schedule amounting to P124.9 billion (roughly 2.0% of GDP) is
expected to be deficit-financed.
1 Text revised February 2006. CPBD updated simulations and forecasts as of 31 January 2006 using the national accounts data released by the NSCB on 30 January 2006 (which include Q32005 revisions). Incorporates 2005 annual averages of certain economic indicators.
2 Obligation basis budgeting accounts for current year’s expenditure requirements only. On the other hand, cash budgeting reports expenses as they are paid regardless of the period when the obligation was made.
3 Based on CPBD nominal 2006 GDP estimate of P6,112.3 billion using the official target of 5.7% real GDP growth and 7.5% low-end inflation assumption in the BESF and by the BSP.
22
MACROECONOMIC PERSPECTIVE UPDATE 66
The overall level of expenditures serves as the hard budget constraint that gives rise to trade-
offs, imputation of opportunity costs, and valuation of proposals (Campos 2002). The efficient
allocation of scarce resources is all the more pressing given the range of public priorities and
objectives in the midst of competing preferences and claims.
Hence, germane to an analysis of the national expenditure program is a review of the
underlying macroeconomic assumptions/targets and expected resource availability, more so
amid risks and uncertainty. This has become all the more imperative for an economy that is
highly vulnerable to downside risks, political controversies, and “boom-bust-cycles”. MACROECONOMIC OVERVIEW
Economic Performance. The Philippine economy has performed distinctly below4 East
Asia’s average growth rates. Nonetheless, it tracked5 Emerging East Asia’s cyclical peak and
surpassed expectations in 2004 by growing 6.03%—well above the government’s revised
Sources: National Statistical Coordination Board and WB East Asia Update April and November 2005.
4 On a quarterly basis from 1999:3-2005:2, the average difference is 1.7 percentage points while on an annual
basis from 1998-2004, the Philippine economy was off East Asia on the average by 1.6 percentage points. 5 The real GDP quarterly growth rates of the Philippines from 1999:3-2005:2 are highly positively correlated to
East Asia’s growth rates with a coefficient of 0.80. On an annual basis, the correlation coefficient is 0.96. 6 This 5.8% target in the BESF was already scaled down from the prior 5.7%-6.3% target range contained in the
MTPDP 2001-2004.
CONGRESSIONAL PLANNING AND BUDGET DEPARTMENT 77
In January 2006, the National Statistical Coordination Board released National Accounts data
indicating a 5.1% GDP expansion in 2005—roughly off the low-end 5.3% GDP growth
target. As of December 2005, even the National Economic Development Authority (NEDA)
had already conceded that its GDP growth forecast has been downgraded to 4.8%-5.1%.
Comparative Economic Forecast. Notwithstanding the implementation of reforms in
the value added tax, concerns still persist over the Philippine economy’s undergoing a phase
of “muddling through” in the medium term. Significant domestic and global developments
seem to impede the attainment of government’s aim of sustainable and higher growth path.
Adverse circumstances in global markets and geopolitics, unfavorable weather, risks of
calamities and disease, intermittent noise and unfinished business in the political arena, and
inadequate reforms would continue to weigh down on the 2006 economic outlook.
The government has nonetheless maintained its 2006 economic growth target range of 5.7%-
6.3%, which has already been scaled down as of end-September 2005 from the 6.3%-7.4%
target in the MTPDP and the BESF.
TABLE 2.1
PHILIPPINE GDP GROWTH PROSPECTS (%)
PARTICULARS 2005 2006
NSCB Release (January 2006) 5.13
MTPDP / BESF 2005 5.3 – 6.3 6.3 – 7.3
BESF 2006 5.3 – 6.1 6.3 – 7.4
NEDA (September 2005)1 5.3 5.7 – 6.3
NEDA (December 2005) 4.8 – 5.1
CPBD (October 2004) 4.5 – 5.3
CPBD (September 2005) 4.7 – 5.0 4.5 – 5.0
CPBD (January 2006) 4.5 – 5.1
Multilateral Institutions
ADB (September /December 2005) 4.7u 4.8u
IMF (September 2005) 4.7u 4.8u
WB (November 2005) 4.8u 5.0
1 NEDA Presentation before the Committee on Appropriations (26 September 2005) Sources: NSCB National Accounts as of January 2006; BESF 2005 & 2006; DOF; ADO Update
and IMF World Economic Outlook (Sept. 2005) World Bank East Asia Regional Economic Update (Novemberl 2005); ADB Asian Economic Mointor (December 2005)
Note: u – update
MACROECONOMIC PERSPECTIVE UPDATE 88
In contrast, the forecasts by the CPBD and other institutions have been more conservative7.
As of January 2006, the CPBD still reckons 2006 GDP growth to hover between a moderate
range of 4.5%-5.1%. Multilateral institutions have likewise been restrained in their 2006
growth scenarios, remaining cautious in their prognoses—with both the International
Monetary Fund and the Asian Development Bank expecting 4.8% 2006 GDP growth and the
World Bank anticipating a 5.0% expansion.
FIGURE 2.2
Real Annual GDP Growth ( 1998-2006 in % )
-2.0-1.0
0.01.02.03.0
4.05.06.07.08.09.0
1998 1999 2000 2001 2002 2003 2004 2005 2006
Gro
wth
Ra
tes
RP GDPgr East Asia Advanced Economies
Sources: National Statistical Coordination Board / IMF - World Economic
Outlook (September 2005) / World Bank East Asia Regional Update( April 2005) CPBD 2005-2006 midpoint estimates
Cross-Country Comparison. The multilateral institutions are projecting the Philippines to
post the lowest growth among the ASEAN-4 in 2006. Indonesia is expected to continue its
rebound, growing by about a full percentage point higher than the forecasts for the
Philippines. Vietnam is predicted to be on course its 7+% trajectory. China would still be
full steam ahead, though relatively cooler than the 9.5% realized in 2004.
Understandably, the East Asian NIEs (Hong Kong, Taiwan, Singapore, and Korea) would
likely post lower growth rates than the Philippines. The IMF is projecting the growth rate in
Singapore to fall considerably to 3.9% in 2005 from a peak of 8.4% in 2004. In 2005, growth
in Taiwan would decelerate by 2.3 percentage points, in Hong Kong by 1.8 percentage points,
and in Korea by 0.8 percentage point. In 2006, Korea, Singapore, and Taiwan are forecast to
7 The CPBD’s year-old GDP growth forecast of 4.5%-5.3% for 2005 was updated to a tighter range of 4.7%-
5.0%7 in September 2005. The release by the National Statistical Coordination Board of 2005 3rd quarter national accounts data and updated 2nd quarter figures prompted the CPBD to update its 2005 forecast range as of December 2005 to 4.6%-4.8%7, but which was not officially released. In Jamuary 2006, the NSCB released the revised 3rd quarter 2005 data.
CONGRESSIONAL PLANNING AND BUDGET DEPARTMENT 99
expand the pace of growth to 5.0%, 4.5%, and 4.3%, respectively, while Hong Kong would
continue to slow down but still at a comparable 4.5%. (IMF World Economic Outlook September 2005)
Altogether, the world’s advanced economies are estimated to slow down from the cyclical
peak of 3.3% in 2004 to 2.5% in 2005, before a slight upturn of 2.7% in 2006. The U.S. is
projected to trail its 2004 growth of 4.2% with 3.5% in 2005 and 3.3% in 2006. From a high
of 2.7% in 2004, Japan is predicted to post annual growth rate of 2.0% each in 2005 and
2006. The Euro area is forecast to slow down to 1.2% in 2005 prior to a probable up tick of
1.8% in 2006. (IMF World Economic Outlook September 2005)
TABLE 2.2 CROSS-COUNTRY COMPARISON
GDP GROWTH RATES (%), 2004-2006
2004 2005 2006 ECONOMIES Actual ADB IMF WB ADB IMF WB
Philippines
Indonesia
Malaysia
Thailand
Vietnam
China
Korea
Singapore
Taiwan
Hong Kong
Advanced Economies
U.S.
Japan
Euro area
6.0
5.1
7.1
6.1
7.7
9.5
4.6
8.4
5.7
8.1
3.3
4.2
2.7
2.0
4.7
5.5
5.1
4.5
7.6
9.3
4.0
5.2
3.7
5.4
3.6*
2.3
1.4*
4.7
5.8
5.5
3.5
7.5
9.0
3.8
3.9
3.4
6.3
2.5
3.5
2.0
1.2
4.8
5.7
5.0
4.2
7.5
9.3
3.8
4.1
3.6
5.5
3.5
2.3
1.1
4.8
5.9
5.3
5.0
7.6
8.9
5.0
6.0
4.1
4.3
3.4*
2.6
1.9*
4.8
5.8
6.0
5.0
7.0
8.2
5.0
4.5
4.3
4.5
2.7
3.3
2.0
1.8
5.0
6.0
5.3
5.0
7.5
8.7
4.6
4.7
4.1
4.4
3.5
1.8
1.4
Sources: ADB-ADO Update (September 2005) / ADB Asia Economic Monitor (December 2005) / IMF - World Economic Outlook (September 2005) / World Bank East Asia Regional Update (November 2005) *Consensus Economic Forecasts December 2005 cited in ADB Asia Economic Monitor
Factors Affecting the Economic Outlook. Key assumptions are bound to affect the
economic outlook upon which hinges the proposed budget for fiscal year 2006.
Ä Inflation. General price movements have been quite volatile and averaged 7.6% for
the whole of 2005. The original 2005 respective inflation target (4.0%-5.0%) in the
BESF 2005 and forecast (5.5%-6.0%) by the CPBD have been breached on account
of supply-side constraints, in particular, record spikes in global oil prices. However,
MACROECONOMIC PERSPECTIVE UPDATE 1010
easing oil prices toward the end of 2005, sharp appreciation of the peso, and delayed
implementation of E-VAT contributed in muting the anticipated full extent of revised
inflation projections.
While inflationary pressures have started to ease, closer scrutiny of the commodity
basket has prompted the CPBD to update its 2006 inflation forecast (cited in an earlier version
of this paper). The effects of E-VAT and lingering tight oil supply worries would still
preclude abatement of average inflation to 6.0%-6.8% (without the 2% E-VAT). Rather, the
imposition by February 2006 of the additional 2% E-VAT on specific commodity
groups would instead correspondingly hike forecast inflation to range 7.7%-7.9%.
The BESF documents specify an inflation forecast of 7.5% in 2006. Recent
statements from BSP Governor Tetangco indicate an inflation range update of 7.5%-
8.2% in 2006.
Ä Dubai Oil Price. An assessment of oil prices is critical considering the Philippines’
oil dependence, with the oil import bill to GDP having grown from 7.7% in 1995 to
22% in 2004, which pales in comparison with China’s 2.3% or the U.S. energy (to
include oil) bill of 6.0%, according to Energy Undersecretary Peter Anthony Abaya.
Moreover, oil shocks feed inflationary expectations and upset growth prospects.
In 2005, Dubai Crude FOB, which the country uses as a benchmark, averaged $49.32
per barrel. For 2006, the outlook from the BSP Governor notes that “oil prices are
still likely to remain high relative to their historical trend given limited production
capacity.”
Apart from capacity constraints, oil prices would continue to remain volatile due to
the vagaries of the weather, geopolitical concerns in the oil producing areas, and the
anticipated growth in the U.S. and China.
Expectations of oil price volatility could be gleaned from emerging scenarios (from the
macroeconomic assumptions of the BSP). In November 2005, the emerging 2006 Dubai price
scenario by the BSP was $54.46. A month later, the BSP was already assuming $57.88
per barrel. Moreover, comparative Dubai prices likewise reflect such volatility—while
December 2005 prices averaged $53.20 per barrel, January 2006 prices have already
averaged sharply at $58.44.
Hence, the government’s 2006 consensus projection of $56.00-$60.00 Dubai price per
Sources and Notes: a – cited in Bangko Sentral ng Pilipinas as of 01/09/06; b – BSP and NEDA Presentations before the Committee on Appropriations as of 26 September 2005; S05 – Forecast as of September 2005; N05 – Update as of November 2005; J06 – update as of January 2006
Ä 91-Day Treasury Bill Rate. The BESF has basically assumed 91-day Treasury bill
rates to range 7.5%-8.5% over the period 2005-2006. Recent assessment by the BSP
that ample liquidity resulted in the easing of domestic interest rates has been evinced
by the trend in 91-day T-bill rates, which began at 7.7% in January 2005 and averaged
6.4% for the whole year.
Former DOF Undersecretary Romeo Bernardo noted that domestic interest rates
have bucked forecasts, declining in spite of rising inflation and global interest rates.
The better-than-expected fiscal performance (in terms of the deficit bottom line)
compared to program may also have contributed in tempering domestic interest rates.
The BSP Governor announced that interest rates would likely remain stable at current
levels during 2006 on account of improving fiscal performance, ample liquidity,
moderate credit growth, and prospects of better sovereign credit rating. However, he
also reiterated that the “BSP will deny any breeding ground for any incipient
inflationary pressures especially coming from the demand side.”
As such, the exercise by the BSP of its policy tools would determine interest rate
outcomes. Nonetheless, in 2006, the CPBD expects benign rates at 6.2%, while the
possibility of 8.0% hangs with a more aggressive inflation-targeting BSP and rising
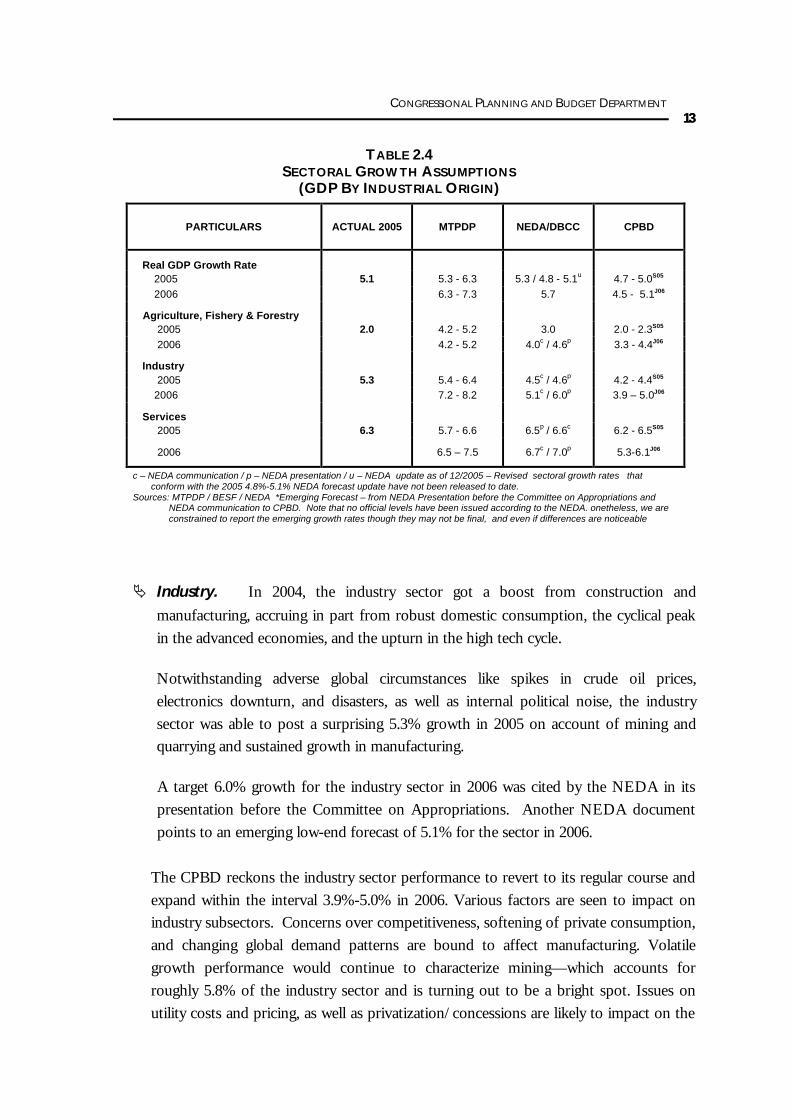
c – NEDA communication / p – NEDA presentation / u – NEDA update as of 12/2005 – Revised sectoral growth rates that conform with the 2005 4.8%-5.1% NEDA forecast update have not been released to date.
Sources: MTPDP / BESF / NEDA *Emerging Forecast – from NEDA Presentation before the Committee on Appropriations and NEDA communication to CPBD. Note that no official levels have been issued according to the NEDA. onetheless, we are constrained to report the emerging growth rates though they may not be final, and even if differences are noticeable
Ä Industry. In 2004, the industry sector got a boost from construction and
manufacturing, accruing in part from robust domestic consumption, the cyclical peak
in the advanced economies, and the upturn in the high tech cycle.
Notwithstanding adverse global circumstances like spikes in crude oil prices,
electronics downturn, and disasters, as well as internal political noise, the industry
sector was able to post a surprising 5.3% growth in 2005 on account of mining and
quarrying and sustained growth in manufacturing.
A target 6.0% growth for the industry sector in 2006 was cited by the NEDA in its
presentation before the Committee on Appropriations. Another NEDA document
points to an emerging low-end forecast of 5.1% for the sector in 2006.
The CPBD reckons the industry sector performance to revert to its regular course and
expand within the interval 3.9%-5.0% in 2006. Various factors are seen to impact on
industry subsectors. Concerns over competitiveness, softening of private consumption,
and changing global demand patterns are bound to affect manufacturing. Volatile
growth performance would continue to characterize mining—which accounts for
roughly 5.8% of the industry sector and is turning out to be a bright spot. Issues on
utility costs and pricing, as well as privatization/concessions are likely to impact on the
MACROECONOMIC PERSPECTIVE UPDATE 1414
performance of the electricity, gas, and water subsectors for sometime. Growth in
construction, which has started to decelerate year-on-year in 2005, would benefit
immensely from anticipated increased public infrastructure spending.
Ä Services. Year-on-year quarterly growth in the service sector decelerated in the first
three quarters of 2005 but almost all sub-sectors rebounded in the 4th quarter. Finance,
which expanded 15.4% annually, surpassed the performance of erstwhile growth driver
transport, communications, and storage.
In 2006, the government is looking forward to a 7.0% stellar performance of the service
sector to propel growth. However, the 7.1% peak in the sector’s growth occurred in
2004, when the economy rode the crest of the global cycle. In the years 2002-2005,
services grew 6.1% on the average. If such average performance could serve as a gauge,
the CPBD projects at most 6.1% growth for the service sector in 2006.
Competition in value added services in telecommunications, such as VOIP (voice-over-
internet protocol), is presumed to contribute to growth. Financing services may be
dampened by increases in monetary policy rates, owing to prevailing inflationary
pressures. Though new malls were planned to boost retail trade, softening of overall
personal consumption would be more likely due to price expectations and perceptions
of possible instability that could arise from unresolved issues in the political arena.
Transport services may bear the brunt of continuing tight oil markets.
GROWTH ASSUMPTIONS BY EXPENDITURE SHARES
Ä Personal Consumption. After robust consumption reaching as high as 5.8% in
2004, accounting for almost 79% of gross domestic product, and driving economic
growth, the CPBD gathers that personal consumption expenditure is still bound to
soften in 2006 with expected growth range of 4.6%-5.0%.
Ä Government Consumption. Quarterly year-on-year growth in government
consumption has been usually erratic with a surprising 15.7% expansion in second
quarter of 2005 and a subsequent 4.2% decline in the fourth quarter. Hence, a 2.7%
annual growth in government expenditure was posted in 2005. The CPBD surmises
that increased spending by local government units, coupled with the maintenance and
operating expenditures of the national government will continue to prop up
government consumption in 2006, ranging from 3.3%-5.3%.
Sources: Actual 2005 from National Accounts of the Philippines January 2006; MTPDP targets from MTPDP 2004-2010. Notes: MTPDP targets may have already been revised in view of the emerging 5.7% GDP growth assumption for 2006, but the new rates by expenditure shares have not yet been released and that no official levels have been issued as these still have to be approved by the DBCC, according to the NEDA. Estimates
S05 – refer to CPBD estimates as of September 2005 while Update
J06 – refers to CPBD updates as of January 2006.
Ä Capital Formation. Increased government infrastructure outlay would augur well
for capital formation in 2006, after an expected slump in overall investment in 2005.
Ä Exports. Adjustment and downswing in the global high tech electronics industry
and record world oil prices have adversely affected the economy’s exports in 2005.
The growing concern is over the country’s export competitiveness—especially so
amid expensive power rates, a strengthening peso, and a more open global trading
arena under the WTO. On a positive note, continued expansion in China (though at a slower
pace within the 8% range) would still be beneficial to intra-regional trade and a projected slight
uptick in the advanced economies in 2006 would enhance export growth.
Ä Imports. After a probable lethargic year, imports could spring a rebound in 2006 in
support of export expansion, subject to global market conditions.
Ä Net Factor Income from Abroad. Remittances from overseas Filipinos would
continue to expand, especially with enhanced quality of employment opportunities.
However, the pace would decelerate in 2006 compared with 2005.
MACROECONOMIC PERSPECTIVE UPDATE 1616
ECONOMIC AND FISCAL SCENARIOS Emerging Official Fiscal Assumptions. The Executive’s budget submission to Congress
is contained in the Budget of Expenditures and Sources of Financing (BESF) 2006. The
proposal assumes GDP growth targets of 6.3%-7.4% in 2006, which are but enunciation of
the Medium Term Philippine Development Plan. In the last week of September, the
assumptions were revised to the emerging low-end 5.7% target for 2006.
The resulting 2006 deficit target of P124.9 billion has so far remained unchanged—what
varied are the concomitant effort. With the release of actual 2005 GDP data and the
unavailability of official forecast 2006 nominal GDP levels, the CPBD recomputed the
various effort (ratios relative to GDP) by estimating 2006 nominal GDP based on official real
GDP growth targets (6.3% vs. 5.7%) and inflation assumption (7.5%) while maintaining the
announced target collection levels by the Department of Finance.
TABLE 2.6
GROWTH ASSUMPTIONS AND CONCOMITANT EFFORT (%) - 2006
PARTICULARS BESF
Original 6.3%
BESF Emerging
5.7%
6.3% Growth Recomputed
Effort*
5.7% Growth Recomputed
Effort*
Tax Effort 14.6 15.1 14.2 14.3
BIR Effort 11.3 11.7 11.0 11.0
Revenue Effort 16.1 16.8 15.8 15.8
Note: * Sans official target levels, recomputed efforts are CPBO estimates based on nominal GDP levels using official growth and inflation assumptions.
CPBD Fiscal Scenarios. The CPBD conjured two sets of scenarios. The first compares
fiscal estimates arising from CPBD’s own low-high GDP growth forecasts of 4.5%-5.1% in
2006 vis-à-vis the BESF updated low-end growth target of 5.7%. The CPBD-
recomputed effort targets—14.3% tax effort, 11.0% BIR effort, and 15.8% revenue effort—
are then applied on the updated CPBD-computed nominal GDP levels.
Scenario 1.1 – GDP Growth Rate of 4.5% in 2006. The CPBD’s low 4.5%
economic growth assumption for 2006 is estimated to result in a deficit estimate of
P136.3 billion (2.3% of GDP), which is P11.4 billion higher than the official deficit
target of P124.9 billion.
CONGRESSIONAL PLANNING AND BUDGET DEPARTMENT 1717
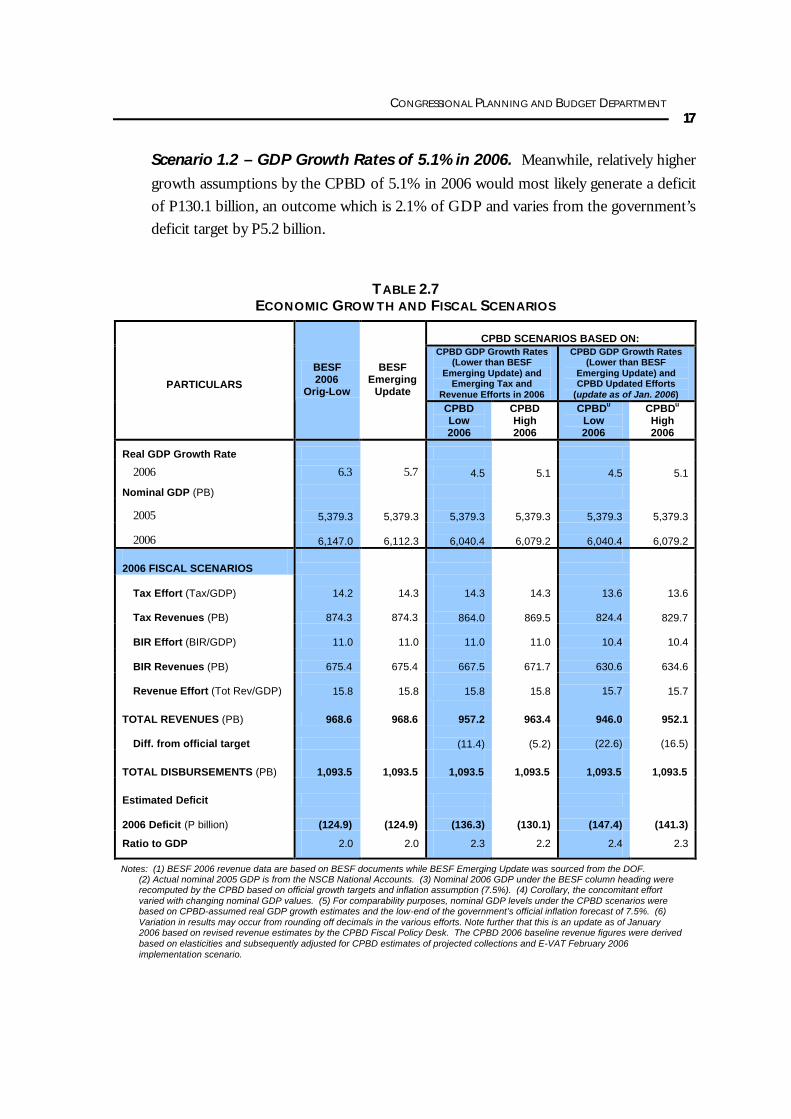
Scenario 1.2 – GDP Growth Rates of 5.1% in 2006. Meanwhile, relatively higher
growth assumptions by the CPBD of 5.1% in 2006 would most likely generate a deficit
of P130.1 billion, an outcome which is 2.1% of GDP and varies from the government’s
deficit target by P5.2 billion.
TABLE 2.7 ECONOMIC GROWTH AND FISCAL SCENARIOS
CPBD SCENARIOS BASED ON: CPBD GDP Growth Rates
(Lower than BESF Emerging Update) and
Emerging Tax and Revenue Efforts in 2006
CPBD GDP Growth Rates (Lower than BESF
Emerging Update) and CPBD Updated Efforts
(update as of Jan. 2006) PARTICULARS
BESF 2006
Orig-Low
BESF Emerging
Update CPBD Low 2006
CPBD High 2006
CPBDu Low 2006
CPBDu
High 2006
Real GDP Growth Rate
2006 6.3 5.7 4.5 5.1 4.5 5.1
Nominal GDP (PB)
2005
5,379.3
5,379.3
5,379.3
5,379.3 5,379.3
5,379.3
2006
6,147.0
6,112.3
6,040.4
6,079.2 6,040.4
6,079.2
2006 FISCAL SCENARIOS
Tax Effort (Tax/GDP)
14.2
14.3
14.3
14.3 13.6
13.6
Tax Revenues (PB) 874.3 874.3
864.0
869.5 824.4
829.7
BIR Effort (BIR/GDP)
11.0
11.0
11.0
11.0 10.4
10.4
BIR Revenues (PB) 675.4 675.4
667.5
671.7 630.6
634.6
Revenue Effort (Tot Rev/GDP)
15.8
15.8
15.8
15.8 15.7
15.7
TOTAL REVENUES (PB) 968.6 968.6
957.2
963.4 946.0
952.1
Diff. from official target
(11.4)
(5.2) (22.6) (16.5)
TOTAL DISBURSEMENTS (PB) 1,093.5 1,093.5 1,093.5 1,093.5 1,093.5 1,093.5
Estimated Deficit
2006 Deficit (P billion) (124.9) (124.9)
(136.3)
(130.1) (147.4)
(141.3)
Ratio to GDP 2.0 2.0 2.3 2.2 2.4 2.3
Notes: (1) BESF 2006 revenue data are based on BESF documents while BESF Emerging Update was sourced from the DOF. (2) Actual nominal 2005 GDP is from the NSCB National Accounts. (3) Nominal 2006 GDP under the BESF column heading were recomputed by the CPBD based on official growth targets and inflation assumption (7.5%). (4) Corollary, the concomitant effort varied with changing nominal GDP values. (5) For comparability purposes, nominal GDP levels under the CPBD scenarios were based on CPBD-assumed real GDP growth estimates and the low-end of the government’s official inflation forecast of 7.5%. (6) Variation in results may occur from rounding off decimals in the various efforts. Note further that this is an update as of January 2006 based on revised revenue estimates by the CPBD Fiscal Policy Desk. The CPBD 2006 baseline revenue figures were derived based on elasticities and subsequently adjusted for CPBD estimates of projected collections and E-VAT February 2006 implementation scenario.
MACROECONOMIC PERSPECTIVE UPDATE 1818
The second set of scenarios employ CPBD’s GDP growth projections but now assume
different tax and BIR efforts relative to the recomputed effort concomitant to the retained
levels of collection. For this scenario, the following updated CPBD target efforts for 2006
were used: 13.6% tax effort, 10.4% BIR effort, and 15.7% revenue effort.8
Scenario 2.1 – CPBD-Estimated 4.5% Growth Rate and 13.6% Tax Effort. The CPBD’s low economic growth assumption for 2006, coupled with the estimated
tax effort aforementioned are bound to produce a P147.4 billion deficit, which is 2.4%
of GDP and higher than the official deficit target by P22.5 billion.
Note that CPBD’s growth scenario 1.1 results in total revenues of P957.2 billion while
scenario 2.1, which also considers changes in tax and revenue efforts, ends up with
P946.0 billion in total revenues. The decline by P11.2 billion in total revenues and
correspondingly a worsening in the deficit, therefore, accrues from lower BIR and tax
effort.
Scenario 2.2 – CPBD 2006 5.1% Growth Scenario and CPBD-Assumed Efforts. The deficit outcome from these assumptions would turn out to be P141.3 or
2.3% of CPBD-projected GDP, which differs from the government’s target by P16.4
billion. SENSITIVITY ANALYSIS
Changes in certain macroeconomic assumptions impact on fiscal targets. The following
sensitivity analysis delves into the fiscal effects of non-realization of assumptions, or changes
in target variables—tax effort, GDP growth, interest rates and inflation.
Tax Effort. The Executive’s proposed tax effort assumption for the 2006 budget was
originally 14.6%, which was then re-estimated by the Department of Finance at 15.1% under
the emerging 5.7% GDP growth assumption. With the release of 2005 actual GDP data,
CPBD reckons that with an official 5.7% growth scenario and 7.5% inflation rate, a 14.3% tax
effort is in the offing in 2006, assuming targeted tax revenue is maintained at P874.3 billion.
8 The rationale for the updated CPBD assumptions on efforts is tackled in Chapter 3 by the CPBD Fiscal Policy
Desk. The 2006 baseline revenue figures were derived based on elasticities and then subsequently adjusted for CPBD estimates of projected collections.
CONGRESSIONAL PLANNING AND BUDGET DEPARTMENT 1919
Improving tax collection efficiency is imperative. For every 0.1 percentage point tax effort
deviation from target, tax revenues would be off the mark by roughly P6.1 billion. (Note that
rounding off decimals in the tax effort greatly affects outcomes. Hence, results may vary.)
GDP Growth. The Department of Finance estimates that a one percentage point increase
in real GDP translates to P6.17 billion expansion in revenues, or a reduction in the deficit by
the same amount.
Relative to official targets, the more conservative CPBD GDP growth forecast of 4.5% for
2006 would result in an P11.4 billion revenue shortfall, as mentioned earlier in the section on
growth scenarios. Meanwhile, a more moderate assumption of 5.1% in 2006 would cause a
P5.2 billion difference from official revenue and deficit targets.
Treasury Bill Rates, Foreign Exchange, and Inflation. Sensitivity indicators provided by
the Executive (through the DOF) indicate that changes of 100 basis points in Treasury bill
rates of all maturities are deficit neutral while a P1.00 depreciation in the local currency vis-a-
vis the dollar is also almost neutral given the slight P20 million increase in the deficit. The
Executive’s analysis points out, however, that a one percentage point increase in inflation
would jack up revenues by an estimated P5.67 billion while also hiking disbursements to the
tune of P2.3 billion, thereby leading to a net decrease in the deficit by about P3.37 billion.
CONCLUSION AND RECOMMENDATIONS Improving the tax effort should be an utmost concern because fiscal stability and debt
sustainability have become very important decisions for investing in the country. Further,
economic growth and tax effort both impact immensely on the government’s revenue and
deficit targets.
Critical economic reforms in support of sustained and high growth path must be pursued and
effectively implemented. The CPBD surmises that if its relatively cautious growth forecasts
for 2006 ensue instead of the government’s growth targets, additional potential revenue
shortfall in 2006 ranging from P5.2 billion to P11.4 billion could materialize. Hiking revenue
effort could mitigate lower tax take from low growth assumptions. However, while increasing
non-tax revenues contributes to addressing deficit concerns, enhancing the tax effort would
still be a better and sustainable option.
MACROECONOMIC PERSPECTIVE UPDATE 2020
Ensuring macroeconomic stability is crucial especially in light of vulnerability to downside
risks. The IMF advocates “strong up-front actions” necessary to improve growth prospects
and insulate the economy from adverse shocks while the World Bank espouses “strong front-
loaded adjustment” to signal government’s commitment to serious reforms.
Both the International Monetary Fund and the World Bank maintain that invigorating and
sustaining economic growth entails the pursuit of strong fiscal and structural reforms that
would curb vulnerabilities, improve the business climate and competition, increase
investments, and enhance productivity.
Even the Medium Term Philippine Development Plan recognizes that accelerating growth
necessitates squarely addressing the fiscal problem while enhancing competitiveness through
measures to boost productivity, improve infrastructure, reduce corruption, and simplify
business procedures. Indeed, macroeconomic reforms should be supplemented with micro
reforms that eliminate barriers to productivity and boost economic growth. Growth sectors
in the economy (such as in telecommunications, transportation, and retail trade) benefited
from policy reforms in the past.
Robust and effective reforms are crucial in enhancing the tax effort and the quality of
economic growth. In turn, these could boost resource availability, which when efficiently
allocated and shielded from unwarranted leakages, would support the government in fulfilling
its commitment to sustainable economic development and poverty alleviation.
CONGRESSIONAL PLANNING AND BUDGET DEPARTMENT 2121
BOX 2.1
SENSITIVITY OF THE BUDGET TO MACROECONOMIC ASSUMPTIONS
AS PROVIDED BY THE EXECUTIVE*
The fiscal program is highly sensitive to the movement of four major macroeconomic indicators – exchange rates, interest rates, imports and real GDP growth. The table below summarizes the impact of each variable to revenues and disbursements and, consequently, to the budget deficit.
TABLE 2.8 SENSITIVITY INDICATORS, 2006
(IN BILLION PESOS)
Particulars Revenues Disbursements Deficit/1
P1 depreciation in Foreign Exchange 2.20 2.22 (0.02)
1% point (100 bps) increase in T-bill Rate2 5.14 5.14 0.00
1% point decrease in imports (3.70) 0.0 (3.70)
1% point increase in inflation 5.67 2.30 3.37
1% point increase in real GDP 6.17 0.0 6.17
1/ A positive figure indicates a decrease in the deficit while a negative figure means an increase in the deficit. 2/ All maturities Source: Department of Finance
Foreign Exchange Rate. The depreciation of the peso against the dollar has both positive and negative effects on the economy. It makes the country’s exports more competitive while it makes imports more expensive. On the fiscal side, it increases revenues from the higher peso proceeds from import taxes but also raises expenditures through higher debt payments and increases in other foreign exchange sensitive expenditures. DOF estimates show that a peso depreciation in foreign exchange will increase revenues by P2.2 billion and raise expenditures by P2.22 billion, with a net outcome of P20 million, which is close to being deficit-neutral. Interest Rate. Higher T-bill rate, likewise, affects the fiscal position in two ways. It increases revenues through higher withholding tax on interest income but also raises disbursements through higher interest payments from domestic borrowing. Estimates show that a one-percentage point (100 basis points) increase in the T-bill rate of all maturities would increase both revenues and disbursements each by P5.14 billion, thereby on the net leaves the deficit unaffected. Imports. Revenues derived from international trade through import duties and taxes account for almost 20% of total revenues. Thus, a decline in imports would have adverse impact on total revenue collections. Estimates show that a one-percentage point decrease in imports would reduce revenue collections by P3.7 billion, thereby increasing the deficit by the same amount. Gross Domestic Product. The GDP is used as general indicator of a revenue base. When it increases, revenues would also rise assuming a constant revenue effort. Estimates show that a one-percentage point increase in real GDP growth rate would increase revenues by P6.17 billion, thereby reducing the deficit by the same amount.
MACROECONOMIC PERSPECTIVE UPDATE 2222
TABLE 2.9 UPDATE GROSS NATIONAL PRODUCT AND GROSS DOMESTIC PRODUCT
(BY INDUSTRIAL ORIGIN AT CONSTANT 1985 PRICES, 2002-2006) ACTUAL CPBD Growth Scenarios
2006 Forecast* PARTICULARS 2002 2003 2004 2005
Low High
In billions of pesos
Agriculture, fisheries and forestry 207.5 214.1 224.7 229.2 236.7 239.3
Net income from abroad 71.6 81.8 88.8 101.0 106.1 109.8
Gross national product 1,105.7 1,162.5 1,234.6 1,305.5 1,364.4 1,379.4
Annual percentage change
Consumption 3.4 5.1 5.3 4.8 4.5 5.0
Private 4.1 5.3 5.8 4.9 4.6 5.0
Government -3.8 2.6 0.0 2.7 3.3 5.3
Investment -4.3 1.5 9.5 -4.3 4.0 6.2
Domestic demand 1.8 4.4 6.1 3.0 4.4 5.2
Exports of goods and services 4.0 3.7 14.1 2.3 4.5 6.4
Imports of goods and services 5.6 8.9 5.9 1.8 2.5 4.1
Gross domestic product 4.4 4.5 6.0 5.1 4.5 5.1
Net income from abroad 0.5 14.3 8.5 13.8 5.1 8.7
Gross national product 4.2 5.1 6.2 5.7 4.5 5.7
Sources: NSCB National Accounts of the Philippines as of January 2006 Notes: Reformatted tables from IMF-STIFP. *Forecasts for 2006 are CPBD-MISG Staff estimates based on combination of forecasting, sectoral analysis, and programming techniques. CPBD update as of January 2006.
Chapter
FINANCING THE 2006 BUDGET
Given a projected cash disbursement of P1,093.5 billion in 2006, the National Government
needs to ensure that recently-approved tax measures1 as well as the existing ones are properly
enforced to contain the NG budget deficit. Otherwise, NG may have to choose between two
bitter options or do both—cut back an already constricted budget and sacrifice long-term
growth in the process and/or borrow above program levels and expose the economy to more
downside risks (i.e. higher interest rate, higher debt service and balance of payment problem).
REVENUE PERFORMANCE
The country’s revenue performance over the years has been far from encouraging. From a
revenue effort (ratio of total revenue collections to GDP) of 19.4% in 1997, government
revenues slipped to 14.8% of GDP in 2004. Even among its Asian neighbors, the Philippines
remains a laggard in terms of revenue performance. For two consecutive years (2003-2004),
the Philippines consistently had the lowest revenue effort. Note that Philippine revenue
effort (15.3%) in 2000 was slightly higher than that of China (15.0%) but the latter managed
to improve its revenue collection over time. By the end of 2004, China’s revenue effort got
better at 19.3% while that of the Philippines got worse at 14.8% (see Table 3.1).
1 New tax measures include the following: excise tax reforms on automobiles, tobacco, and alcohol products;
lateral attrition for BIR and BOC personnel; and rationalization of documentary stamp tax. The new VAT Law (RA 9337) includes the 20% VAT rate increase, lifting of VAT exemptions, 70% cap on input VAT credit, five-year spread out of input VAT on capital equipment, and corporate tax rate increase, among others.
33
REVENUE PROGRAM 2424
TABLE 3.1 REVENUE EFFORT OF SELECTED ASIAN COUNTRIES
(2000-2004) COUNTRY 2000 2001 2002 2003 2004
South Korea
Vietnam
Malaysia
Hongkong
Thailand
China
Indonesia
Philippines
20.9
20.4
18.0
17.5
15.4
15.0
14.7
15.3
20.3
21.4
23.8
13.8
15.0
16.8
17.8
15.5
20.3
22.6
23.1
14.2
15.8
18.0
15.8
14.6
21.0
24.4
23.5
17.0
16.6
18.5
16.7
14.9
20.2
24.1
22.2
18.4
17.6
19.3
20.3
14.8
Sources: BESF and Asian Development Outlook
BIR Performance. Poor revenue performance was primarily due to the drop in collections
of the Bureau Internal Revenue (BIR) which accounts for almost 70% of total NG revenues.
From a tax effort — measured as tax collections as a ratio of GDP — of 13% in 1997, BIR tax take
nose-dived to 9.9% of GDP in 2004 despite the implementation of a comprehensive tax
reform package in 1998 (see Figure 3.1). Note that this was the bureau’s lowest collection
effort in eleven years. Among the reasons given for poor BIR performance are as follows: (a)
rampant tax evasion; (b) limited VAT base; (c) non-indexation of excise tax rates to inflation;
and (d) alleged corrupt practices abetted by some BIR functionaries.
Data from the National Tax Research Center (NTRC) indicates that in 2002 alone, tax gap –
difference between actual vis-a-vis potential revenue collections – among individual business income
earners and professionals was as high as 76%. Conversely, this would mean that only 24% of
potential tax dues was collected from this taxpayer group. Corporate income tax gap for the
same year was estimated at 32% while that of the value added tax (VAT) was at 33%. These
tax leakages were attributed to under-reporting of sales/receipts and over-claim of
deductions/tax credits.
In addition to VAT evasion, the Department of Finance claims that the exemption and zero-
rating of certain sectors (e.g. electric power industry, oil products, doctors, lawyers, etc.) limits the VAT
base and disrupts the audit trail (i.e., the input of one sector becomes the output of the other and vise-
versa). Upon recommendation of the Executive Branch, Congress passed a new VAT Law to
remove the exemption and zero-rating of these sectors, among other things.
CONGRESSIONAL PLANNING AND BUDGET DEPARTMENT 2525
FIGURE 3.1 REVENUE EFFORT
(IN PERCENT)
13.0
3.9
12.7
2.9
11.5
2.9
10.8
2.8
10.7
2.6
10.2
2.5
10.1
2.5
9.9
2.6
0.0
2.0
4.0
6.0
8.0
10.0
12.0
14.0
16.0
18.0
20.0
1997 1998 1999 2000 2001 2002 2003 2004
BIR BOC Other Offices Non Tax
Source of Data: Cash Operations Report, BTr
In the case of excise taxes, the form of tax that was adopted in 1997 (i.e., specific tax which is
computed based on number of units produced instead of price per unit) was not responsive to the
movement in selling price of excisable goods. While values of goods subject to excise tax
have increased many times over, the tax rate remained the same. To correct the situation,
Congress approved RA 9334 which provides the schedule for increase in tax rates every two
years starting 2005 until 2011.
TABLE 3.2
VAT COLLECTION EFFICIENCY (IN PERCENT)
YEAR Domestic Imports Total
1998 80.5 92.8 85.5
1999 87.7 98.3 92.0
2000 70.0 98.4 80.9
2001 66.7 84.3 73.7
2002 67.8 85.5 74.7
2003 69.0 82.4 74.0
Source: Manasan, Rosario (PIDS)
BOC Performance. From a tax effort of 3.9% in 1997, Customs collections continued to
decline to as low as 2.5% in 2003 with partial recovery the following year. Decline in the
collections of the Bureau of Custom (BOC) can be partly explained by the tariff reduction
program that was implemented in the 1990s in compliance with the country’s commitment to
the General Agreement on Trade and Tariff under the World Trade Organization.
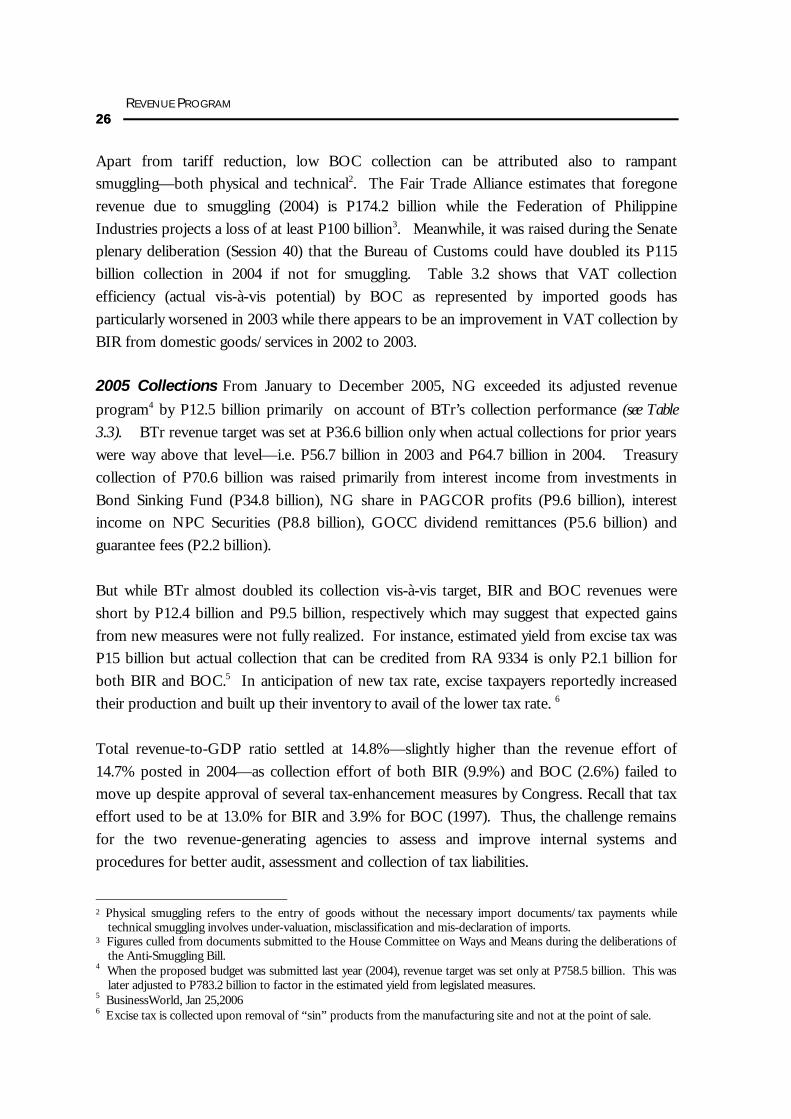
REVENUE PROGRAM 2626
Apart from tariff reduction, low BOC collection can be attributed also to rampant
smuggling—both physical and technical2. The Fair Trade Alliance estimates that foregone
revenue due to smuggling (2004) is P174.2 billion while the Federation of Philippine
Industries projects a loss of at least P100 billion3. Meanwhile, it was raised during the Senate
plenary deliberation (Session 40) that the Bureau of Customs could have doubled its P115
billion collection in 2004 if not for smuggling. Table 3.2 shows that VAT collection
efficiency (actual vis-à-vis potential) by BOC as represented by imported goods has
particularly worsened in 2003 while there appears to be an improvement in VAT collection by
BIR from domestic goods/services in 2002 to 2003. 2005 Collections From January to December 2005, NG exceeded its adjusted revenue
program4 by P12.5 billion primarily on account of BTr’s collection performance (see Table
3.3). BTr revenue target was set at P36.6 billion only when actual collections for prior years
were way above that level—i.e. P56.7 billion in 2003 and P64.7 billion in 2004. Treasury
collection of P70.6 billion was raised primarily from interest income from investments in
Bond Sinking Fund (P34.8 billion), NG share in PAGCOR profits (P9.6 billion), interest
income on NPC Securities (P8.8 billion), GOCC dividend remittances (P5.6 billion) and
guarantee fees (P2.2 billion).
But while BTr almost doubled its collection vis-à-vis target, BIR and BOC revenues were
short by P12.4 billion and P9.5 billion, respectively which may suggest that expected gains
from new measures were not fully realized. For instance, estimated yield from excise tax was
P15 billion but actual collection that can be credited from RA 9334 is only P2.1 billion for
both BIR and BOC.5 In anticipation of new tax rate, excise taxpayers reportedly increased
their production and built up their inventory to avail of the lower tax rate. 6
Total revenue-to-GDP ratio settled at 14.8%—slightly higher than the revenue effort of
14.7% posted in 2004—as collection effort of both BIR (9.9%) and BOC (2.6%) failed to
move up despite approval of several tax-enhancement measures by Congress. Recall that tax
effort used to be at 13.0% for BIR and 3.9% for BOC (1997). Thus, the challenge remains
for the two revenue-generating agencies to assess and improve internal systems and
procedures for better audit, assessment and collection of tax liabilities. 2 Physical smuggling refers to the entry of goods without the necessary import documents/tax payments while
technical smuggling involves under-valuation, misclassification and mis-declaration of imports. 3 Figures culled from documents submitted to the House Committee on Ways and Means during the deliberations of
the Anti-Smuggling Bill. 4 When the proposed budget was submitted last year (2004), revenue target was set only at P758.5 billion. This was
later adjusted to P783.2 billion to factor in the estimated yield from legislated measures. 5 BusinessWorld, Jan 25,2006 6 Excise tax is collected upon removal of “sin” products from the manufacturing site and not at the point of sale.
To improve taxpayer consciousness, BIR initiated administrative reforms that include the
Run-After Tax Evaders (RATE) Program or the filing of tax evasion cases against high-
profile personalities. Meanwhile, the Tax Compliance Verification Drive (TCVD) generated
P86 million from penalties and an additional P204.3 million from income and business taxes
(2003-2004). Graft cases have also been filed against erring officials/employees under the
Revenue Integrity Protection Service (RIPS). For 2004 alone, 73 cases were filed involving 80
personnel which resulted in 22 dismissals from service, 21 suspensions and 25 reprimands.
Four others were meted fines while eight were exonerated.
2006 REVENUE PROGRAM DBCC Targets. To finance the 2006 proposed budget, NG aims to generate a total of P968.6
billion revenues. This amount is P185.4 billion (23.7%) higher than the 2005 estimated
revenues of P783.2 billion. The spike in revenue collection target is partly due to the
inclusion of P123 billion projected yield from new tax/administrative measures and from
non-tax sources (see Table 3.4). In terms of source, close to 70% (P675.4 billion) will have to
be collected by the BIR while around 20% (P190.4 billion) will come from the BOC. Other
tax collecting agencies (e.g. LTO, CHED, DENR and Bureau of Immigration) are expected to
contribute P8.5 billion while a total of P94.3 billion is projected to come from non-tax
sources, largely from the Bureau of Treasury.
REVENUE PROGRAM 2828
TABLE 3.4 ESTIMATED YIELD OF NEW MEASURES
(IN BILLION PESOS) MEASURES Estimated Yield
Tax Measures
Restructuring of the Excise Tax on Automobiles
Rationalization of the Documentary Stamp Tax
Restructuring the Excise Tax on “Sin” Products
New E-VAT
Administrative Measures
BIR
BOC
Other Offices (Road User)
Non-Tax
TOTAL
103.55
0.49
5.33
15.15
82.57
9.84
5.95
3.88
2.83
6.83
123.04
* may not add up due to rounding-off Source: 2006 BESF
Based on the original GDP (low-end) target of P5,999.1 billion, the proposed revenue
program is equivalent to 16.1% or 1.4 percentage points higher than the estimated revenue
effort of 14.7% in 2005. With the recent release of year-end national income accounts,
GDP forecast for 2006 is placed at P6,112.3 billion resulting in lower-revenue-to-GDP ratio
of 15.8%.
CPBD Projection. The CPBD projects that GDP will grow by 4.5%-5.1% instead of 5.7%-
6.3% as targeted by the DBCC. A much lower GDP growth for 2006 is assumed considering
recent developments that could adversely affect the productivity of the taxable sector—e.g.,
geo-political conditions among suppliers of crude oil, risks of calamities and diseases, and
political noise over Charter Change and possible re-filing of impeachment charges by mid-
year. At 4.5% growth, nominal GDP will amount to P6,040.4 billion 7 which is P71.9 billion
lower than emerging DBCC target of P6,112.3.
Table 3.5 shows that CPBD’s baseline revenue projection for 2006 amounts to P832.0 billion.
This was arrived at using the estimated elasticity or the responsiveness of tax and non-tax
revenue collection to GDP growth for the period 2003-2005. Assuming a VAT rate increase
from 10% to 12% by February 1, and lower collection efficiency for documentary stamp tax
(at 72%) and excise tax on “sin” products (at 70%), CPBD expects total revenues for 2006 to
reach P946.1 billion or P15.7% of GDP (based on CPBD low-end estimate).
7 CPBD projects that nominal GDP for 2006 ranges between P6,040.4 billion and P6,079.2 billion.
CONGRESSIONAL PLANNING AND BUDGET DEPARTMENT 2929
TABLE 3.5 2006 CPBD REVENUE ESTIMATES
(IN BILLION PESOS)
2006 Projection PARTICULARS
2006
Baseline Collection * Effort (%)
Tax Revenues
BIR
BOC
Other Taxes
Non-Tax
TOTAL Revenues
717.2
559.5
149.1
8.6
114.8
832.0
824.4
630.6
182.4
11.4
121.7
946.1
13.6
10.4
3.0
0.2
2.0
15.7
Source of Basic Data: BESF; may not add up due to rounding-off
* including estimated yield of new measures
Table 3.6 shows that at 15.7% revenue effort (based on CPBD low-end GDP projection),
NG is likely to miss its revenue program of P968.6 billion by P22.5 billion or 2.3% due to
lower economic growth and lower yield from new tax measures (as projected by CPBD). The
projected shortfall may be attributed to BIR (P44.8 billion) and BOC (P8.0 billion)—but the
estimated excess collection of P27.4 billion from non-tax sources will likely compensate for
losses in tax revenues. Excess collection from non-tax sources will again largely come from
BTr income because of its rather low revenue goal of P51.9 billion—compared to actual
collections during the last two years (P64.7 billion in 2004 and P70.6 billion in 2005)
If revenue collection for 2006 will be off target by P22.5 billion, the programmed deficit of
P124.9 billion (based on total cash disbursement of P1,093.5 billion) will be higher at P147.4
billion or 2.4% of GDP.
TABLE 3.6
2006 DBCC TARGETS AND CPBD REVENUE PROJECTIONS (IN BILLION PESOS)
Emerging DBCC Targets CPBD Projection PARTICULARS Amount % of GDP * Amount % of GDP
Difference
BIR 675.4 11.0 630.6 10.4 (44.8)
BOC 190.4 3.1 182.4 3.0 (8.0)
Other Tax 8.5 0.1 11.4 0.2 2.9
Non-Tax 94.3 1.5 121.7 2.0 27.4
TOTAL 968.6 15.8 946.1 15.7 (22.5)
* computed based on adjusted GDP target Source of Basic Data: 2006 BESF; may not add up due to rounding-off
REVENUE PROGRAM 3030
SUMMARY
The National Government’s resolve to balance the budget by 2008 lies largely on its ability to
generate revenues to support government spending and keep the budget deficit as
programmed. The CPBD projects that total revenue collection for 2006 will likely settle at
P946.1 billion contrary to DBCC projection of P968.6 billion. Collection performance by the
BIR and BOC have not been very encouraging—only the BTr continues to compensate for
the shortfall primarily on account of a rather low revenue assignment.
Tax evasion poses the biggest threat to efficient revenue collection. Leakages are particularly
high among individual business income earners/professionals and under the VAT.
Moreover, NG continues to lose revenues from rampant smuggling activities—i.e., the
Bureau of Customs could have doubled its P115 collection if illegal entry of goods is abated.
A healthy revenue stream would depend on the performance of the economy particularly the
taxable sectors (i.e. manufacturing and services) and the efficient enforcement of tax and tariff
laws. Moreover, effective tax administration requires sustained implementation of
administrative reform initiatives to ensure that gains are maximized in favor of the
government.
Chapter
DIMENSIONS OF THE 2006 EXPENDITURE PROGRAM
“ I hope that Congress will see the proposed Budget as the Executive Branch envisions it to be — a potent weapon for the permanent upliftment of the large mass of our people from poverty.”
- The President’s Budget Message, “Moving the 10-Point
Agenda for Socio-Economic Renewal and Fiscal Health” The President calls on Congress to speed up the scrutiny and approval of the 2006 budget so
that government can immediately implement the programs supporting the 10-Point Agenda.
The Executive proposes a P1,053.3 billion budget1 for the National Government which in
nominal terms is 14.7% higher than the P918.6 billion appropriated for 2005. In real terms,
however, the 2006 budget grew only by 6.7%.
Despite the budget reaching the trillion mark, it still pales in comparison with NG spending
of other Asian countries. The proposed budget of P1,053.3 billion is only equivalent to 17.6%
of gross domestic product (GDP) while countries like Vietnam (27.9%), Malaysia (21.7%),
and Cambodia (18.5%) spend much more. In fact, the 2006 budget as a ratio of GDP is far
below the country’s average spending of 19.4% in 2000-2004.
The NG budget for 2006 (net of interest payment) amounts to only P713.3 billion or 11.9% of
GDP. This means that “productive” spending on per capita basis is roughly P8,200
assuming a projected population of 87 million in 2006.
1 Excluding Unprogrammed New Appropriations of P57.1 billion (see related discussion under Sources of
Appropriations)
44
EXPENDITURE PROGRAM 3232
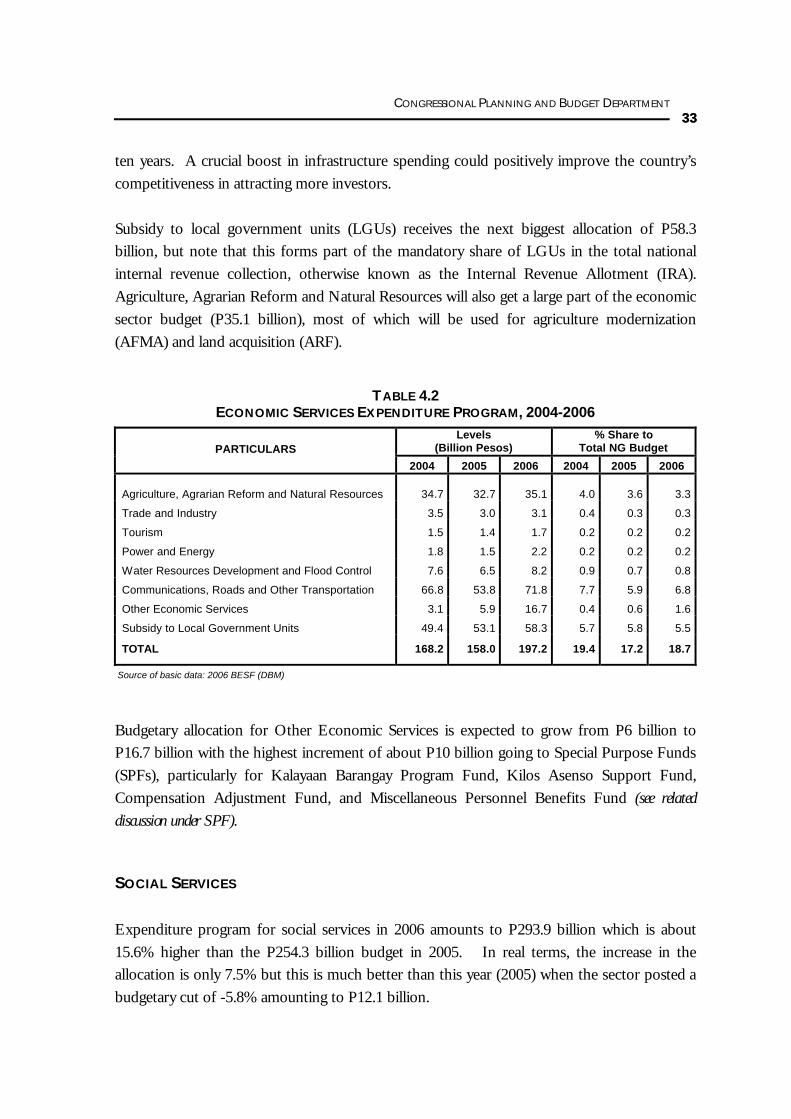
SECTORAL APPROPRIATIONS
While the proposed 2006 budget seems to reflect the government’s will to generate more
economic activities and alleviate poverty due to increases in spending for both economic and
social services, debt service (interest payments) continues to get the biggest chunk (32.3%) of the
budget. It represents 5.7% of GDP or almost one-third of the total proposed budget for
next year (2006).
The sectoral distribution of the 2006 budget shows that next to interest payments, social
services gets the bigger share (27.9%) compared with economic services (18.7%), general
services (15.3%), and defense (5.0%). Net lending is likely to increase by 19.1% from P6.9
billion in 2005 to P8.3 billion in 2006 due to the growing financial needs of government
corporations. Note that even though social services gets the highest budgetary allocation of
P293.9 billion, economic services grew by 24.8% while the social sector is up by only 15.6%.
Economic services suffered a huge budget cut of more than P10 billion in 2005 that could
partly explain the remarkable growth the following year.
TABLE 4.1
NG EXPENDITURE PROGRAM BY SECTOR, 2004-2006
Levels (Billion Pesos) Growth Rates Percent of GDP PARTICULARS 2004 2005 2006 04-05 05-06 2004 2005 2006
Sources of basic data: 2005 GAA and 2006 BESF (DBM)
Taking into account all mandatory expenses—personal services, Internal Revenue Allotment,
and interest payments—an amount of P837 billion or about 80% of the proposed budget
appears to be out of the Congress’ discretion to reallocate for other expenditure needs. To a
certain extent, Congress’ “power over the purse” extends only to as much as P216.3 billion or
20% of the budget in 2006.
EXPENDITURE PROGRAM 3838
Aside from the New Programmed Obligations of P1,053.3 billion, the Executive also submits
a P57.1 billion of Unprogrammed Appropriations. When approved by Congress, this will
provide NG a standby authority to incur obligations for priority programs/projects when
revenue collections exceed targets, and when additional grants or foreign funds are generated.
Unprogrammed appropriations will go to Infrastructure Projects and Social Programs (P30.5
billion), Budgetary Support to GOCCs (P8.1 billion), and Support to Foreign-Assisted
Projects (P8 billion), among others.
REGIONAL ALLOCATION
A breakdown of the proposed 2006 budget shows that P451.7 billion (42.9%) will go to the
Central Office, P358.9 billion (34.1%) to the different regions, and the remaining P242.6
billion (23%) for programs/activities of nationwide application. Out of the P358.9 billion that
will be regionally distributed, Luzon accounts for P185.7 billion or more than half (52%) of
the total regional allocation. Meanwhile, total regional allocation for Mindanao amounts to
P94.6 billion (26%) while Visayas gets P78.6 billion (22%).
Table 7 shows that the top five regions receiving the highest budget allocation in 2006 are
Region IV (P41.9 billion), NCR (P39.2 billion), Region VI (P34.4 billion), Region III (P31.2
billion) and Region VII (P23.5 billion). On the other hand, the bottom five regions include
the Cordillera Administrative Region (P11.4 billion), CARAGA (P14 billion), Region IX
(P14.9 billion), Region XII (P15.4 billion) and Region XI (P16.1 billion).
On per capita basis, however, the highest allocation will go to CAR (P7,454) and CARAGA
(P6,065) owing to a much lower population despite these two regions receiving smaller
budgetary allocations. On the contrary, Region IV which receives the highest budget
amounting to P41.9 billion has a per capita spending of only P2,857. Note that Region XI
which is one of the bottom five regions (as far as the 2006 regional allocation is concerned)
has also the lowest per capita spending of P2667.
ALLOCATION BY DEPARTMENT
The Department of Education (DepED) gets the biggest allocation of P119.1 billion or about
28% of the total regular allocation of P419.2 billion (net of Special Purpose Fund) that will go to
the different government agencies. From P112 billion in 2005, the national government
allocates an additional P7 billion for DepEd to take care of the following, among others:
(a) English manuals and textbooks, P1.8 billion; (b) hiring of new teachers, P2.7 billion;
CONGRESSIONAL PLANNING AND BUDGET DEPARTMENT 3939
TABLE 4.7 NG REGIONAL EXPENDITURE PROGRAM, 2006
(IN BILLION PESOS) Region Amount % Share Per Capita
Central Office
451.7
42.9
-
Nationwide 242.6 23.0 -
Regional 358.9 34.1 -
Region IV 41.9 4.0 2,856.8
NCR 39.2 3.7 3,705.6
Region VI 34.4 3.3 5,043.7
Region III 31.2 3.0 3,213.0
Region VII 23.5 2.2 3,492.7
Region V 22.9 2.2 4,437.1
Region I 22.3 2.1 4,666.9
Region VIII 20.8 2.0 5,263.3
Region X 17.7 1.7 5,660.9
Region II 16.8 1.6 5,240.1
ARMM 16.5 1.6 5,455.5
Region XI 16.1 1.5 2,666.8
Region XII 15.4 1.5 5,219.2
Region IX 14.9 1.4 4,224.7
CARAGA 14.0 1.3 6,065.3
CAR 11.4 1.1 7,454.1
TOTAL 1,053.3 100.0
Sources of basic data: 2006 BESF (DBM), 2002 PSY (NSCB)
(c) service contracting of high school students, P2 billion; (d) construction of new classrooms,
P2.9 billion; and (e) nutrition programs for grade school pupils, P1.5 billion.2 Next to DepED, other top ten departments/entities in terms of budget allocation are DPWH
Note that the increase in DPWH’s budget are basically for foreign-assisted projects (FAPs)
which could mean that NG is now able to put up its peso counterpart for capital intensive
infrastructure projects. On the other hand, the increase of about P6.2 billion in DOTC
budget will be used for locally-funded projects such as the construction, rehabilitation and
improvement of transportation and communication infrastructure (e.g., airports and ports).
SPECIAL PURPOSE FUNDS
The proposed 2006 budget allocates a total of P634.1 billion3 for Special Purpose Funds
(SPFs)—more than half of which will be used for interest payments (P340 billion).
Allocations to local government units (ALGU) will increase by P25.2 billion from P155.9
billion in 2005. The increase in ALGU can be attributed mainly due to the natural growth in
local government share in the national internal revenues (otherwise known as the Internal
Revenue Allotment).
In support of development initiatives at the local level, ALGU for 2006 includes two new
Program Funds namely the “Kilos Asenso Support Fund” and the “Kalayaan Barangay Program
Fund” with amounts of P5 billion and P3 billion, respectively. The Kilos Asenso Support
Fund shall be used as NG counterpart to support local programs/projects like the
construction of farm-to-market roads and day care centers, improvement of potable water
supply, setting up/upgrading of micro-financed community livelihood enterprises, and
investments in agro-forestry projects. On the other hand, the Kalayaan Barangay Program
Fund shall be used specifically to assist barangays in “conflict areas”4 for livelihood projects
and basic infrastructure works—e.g., access roads, school buildings, water system and electricity facilities. 3 Net of AFMA intended for the Departments of Agriculture and Land Reform (formerly DAR). 4 As identified by the Department of National Defense (DND) and the Office of the Presidential Adviser on the Peace Process (OPAPP).
EXPENDITURE PROGRAM 4242
TABLE 4.9 NG EXPENDITURE PROGRAM BY SPECIAL PURPOSE FUND
(IN BILLION PESOS) Increase/Decrease PARTICULARS 2005 2006
Amount % Budgetary Support to GOCC b/ 11.9 14.4 2.6 21.6
Allocations to Local Government Units 155.9 181.0 25.2 16.1
AFP Modernization Fund - 5.0 5.0 -
Agrarian Reform Fund - 8.6 8.6 -
Calamity Fund 0.7 0.7 - -
Contingent Fund 0.8 0.8 - -
E-Government Fund 1.0 1.0 - -
International Commitments Fund 1.8 1.9 0.1 5.6
Miscellaneous Personnel Benefits Fund 2.4 8.8 6.4 272.8
National Unification Fund 0.1 0.1 - -
Priority Development Assistance Fund 6.1 6.2 0.1 2.0
Compensation/Salary Adjustment Fund - 13.1 13.1 -
Pension and Gratuity Fund 34.7 52.5 17.9 51.5
Debt Service -Interest Payment 313.4 340.0 26.6 8.5
TOTAL 528.6 634.1 105.5 20.0
b/ includes AFMA
Source of basic data: 2006 BESF (DBM)
Higher budgetary allocation to LGUs is also due to a substantial increase in premium
subsidies for the enrolment of indigents to the National Health Insurance Program. In 2005,
only P750 million was appropriated to provide for NG’s counterpart in the payment of health
insurance premiums with PhilHealth but this was increased to as high as P2.9 billion in 2006.
This sits well with efforts to increase access of poor Filipinos to medical services—thus,
improving the country’s chances of reducing incidence of illnesses/deaths and subsequently
achieving the millennium development goals (MGDs) for health.
The increase in SPF can also be attributed to additional funds for salary adjustments and
payment of personnel benefits and retirement packages. In keeping with the President’s
declaration of an increase in pay of government employees, the 2006 budget has included
P13.1 billion for such purpose. The Pension and Gratuity Fund which increased by P17.9
billion from P34.7 billion in 2005 sets aside P10 billion for the payment of incentive packages
in anticipation of employees availing of the Rationalization Program (by virtue of Executive
Order 355, Series 2004).
CONGRESSIONAL PLANNING AND BUDGET DEPARTMENT 4343
Note also that Miscellaneous Personnel Benefits Fund increased by P6.4 billion from only
P2.4 billion in 2005. The bulk of the increase will be used by NG to pay for arrears in its
counterpart contributions to the Home Development and Mortgage Fund (HDMF),
Philippine Health Insurance Corporation (PHIC), and the Government Service Insurance
System (GSIS). For GSIS alone, NG is expected to settle P3.3 billion for deficiencies
incurred from July 1997 to December 1998 5.
Table 4.9 shows that NG allotted P14.4 billion as budgetary support to government-owned
and controlled corporations (GOCCs). This is P2.6 billion or 21.6% higher than the P11.9
billion appropriated for GOCCs in 2005. Budgetary support to government corporations
may either come in the form of equity contribution (NG investment in capital stock), subsidy or
net lending.
Out of the P14.4 billion budgetary support to government corporations, P8.3 billion (57.2%)
will go to net lending, P4.9 billion (34.2%) to subsidy, and the remaining P1.2 billion (8.6%)
to equity. Net lending are cash advances by the national government for servicing guaranteed
corporate debts to avoid payment defaults. Unlike equity and net lending where NG
subsequently gets returns through dividends and repayments for cash advances, respectively,
subsidies are outright NG expense used to cover operational expenses or deficits/losses of
GOCCs.
It is important for NG to closely monitor the performance of GOCCs, to watch out for
excessive spending (e.g., salaries and allowances), and to develop a “turn around” program for
losing corporations. This may eventually require the streamlining of the government
corporate sector through privatization and mergers of redundant agencies, and the closure of
those that consistently fail to improve profitability.
Aside from inherent inefficiencies on the way government corporations are run, there are
policies that force NG to continue giving subsidies. For example, the National Food
Authority (NFA) is designed to lose money with its policy of “buying high and selling low”.
Similarly, for political reasons, light-rail fares are below the price than what government
originally contracted to pay. Given their poor cash position, GOCCs are caught in a chronic
cycle of deficit and debt—thus, a need for continued assistance from the national
government.
5 Arrears were incurred due to the increase in employer’s share in GSIS contribution (from 9.5% to 12%) when GAA for 1997 was already passed and budget for 1998 has already been prepared.
EXPENDITURE PROGRAM 4444
CASH VS. OBLIGATION BUDGET
While programmed obligations for 2006 amount to P1,053.3 billion, the estimated cash
disbursements for the year is expected to be higher by P40.2 billion. Total cash
disbursements of P1,093.5 billion is 13.5% more than the projected cash payment of P963.2
billion in 2005. A breakdown of cash disbursements for 2006 shows that 85% will go to
current operating expenditures (P924.8 billion), 15% to capital outlays (P160.5 billion), and
the amount of P8.3 billion to net lending.
Since the deficit is determined on cash basis—i.e., expenses are reported as they are paid regardless of the year when the obligation was incurred—the budget gap for next year (2006) is projected at
P124.9 billion given a revenue program of only P968.6 billion.
BOX 4.1
IMPLICATIONS OF A RE-ENACTED BUDGET
The National Government will be forced to operate under a re-enacted budget should Congress fail to pass the 2006 General Appropriations Bill by end of the year. Table 4.10 shows that a re-enacted budget will reduce NG’s obligation program (2006) by P114.2 billion. Note that the 2005 budget amounted to only P918.6 billion but since P376.3 billion is likely to be automatically appropriated (as programmed for 2006), total obligations will likely settle at P939.1 billion. Out of the P376.3 billion, interest payments accounts for P340 billion while the remaining automatically appropriated items would include Retirement and Life Insurance Premiums, special accounts, and net lending.
TABLE 4.10 COMPARATIVE OBLIGATION BUDGET
(IN BILLION PESOS)
PARTICULARS 2005 GAA
2006 Proposed (a)
2005 Re-enacted (b)
Difference (b-a)
Programmed, New
Automatic Appropriations
TOTAL Obligations
562.8
355.8
918.6
677.0
376.3
1,053.3
562.8
376.3
939.1
(114.2)
(114.2)
Note: Automatic Appropriations amounting to P355.8 billion is the adjusted figure for 2005.
If forced to work on the basis of a re-enacted budget, the biggest losers will include the following: (1) ALGU, particularly the Internal Revenue Allotment; (2) DPWH—delay or non-implementation of flood control and highway projects; (3) DepEd—loss of funds intended for hiring new teachers, purchase of textbooks, and construction of classrooms; (4) DOTC—lack of funding for the construction and rehabilitation of airports and ports; (5) Pension and Gratuity Fund—delay in releases of retirement gratuities and terminal leave benefits (no funds for the payment of incentive packages under the Rationalization Program); (6) Compensation and Salary Adjustment Fund—suspension of the planned increase in allowances of government employees; and (7) Miscellaneous Personnel Benefits Fund—postponement of NG’s plans to settle arrears in counterpart contributions to the HDMF, PHIC and GSIS (see Table 4.11).
Allocations to LGUs will be most affected under a re-enacted budget. The Internal Revenue Allotment (IRA) which is likely to stay at P151.6 billion (as in 2005) will deprive LGUs of the expected P14.9 billion increment for next year. Also, NG is less likely to provide the P8 billion in counterpart funds for local projects under two new programs—Kalayaan Barangay Program Fund and Kilos Asenso Support Fund. Plans to increase the budgetary allocation for the enrollment of indigents to the National Health Insurance Program from only P750 million in 2005 to P2.9 billion in 2006 will also have to be sidelined.
TABLE 4.11 GAINERS AND LOSERS UNDER A 2005 RE-ENACTED BUDGET
(IN BILLION PESOS)
PARTICULARS 2005 GAA (a)
2006 Proposed (b)
Difference (a-b)
GAINER: DLR 14.7 6.5 8.2
LOSERS: ALGU 155.9 181.0 (25.2)
DPWH 49.5 62.3 (12.9)
DepEd 112.0 119.1 (7.0)
DOTC 8.0 14.3 (6.2)
By Fund: Pension and Gratuity Compensation/Salary Adjustment Miscellaneous Personnel Benefits
34.7 - 2.4
52.5 13.1 8.8
(17.9) (13.1) (6.4)
Under a re-enacted budget, the Department of Budget and Management (DBM) wields power over budget re-alignments. It gives the executive branch the “upperhand during budget execution phase…(and) the discretion in deciding how to implement the budget cuts.” (Manasan, 2003). Moreover, “the selective rationing of allotment authority and/or cash allocations tends to politicize the prioritization process as different stakeholders jockey for favors…” (Schiavo-Campo and Tommasi, 1999). Budget re-alignments can also cause delay in the implementation of programs/projects. The timing of release of allotment authority can adversely affect construction schedules. Exercise of discretion in terms of identifying which projects will continue to be funded under a re-enacted budget can put some projects on hold. In particular, counterpart funds for new foreign-assisted projects (FAPs) may not be provided during the year.
Chapter
TAKING STOCK OF GOVERNMENT DEFICIT AND DEBT
Government deficit may be financed by printing new money or borrowing. Deficit financing
through money creation has long been abandoned due to its impact on inflation; hence,
borrowing from domestic and foreign sources has become the instrument to finance
government deficit. When the deficit is financed through borrowing, total outstanding debt
automatically increases. The proportion of debt service in the budget subsequently rises to
the detriment of capital and social expenditures in the long run. NG BORROWING PROGRAM Total borrowing for 2006 amounts to P531.6 billion, of which P310.2 billion (58%) will come
from domestic sources and P221.4 billion (42%) from abroad. Out of the total borrowings,
P381.7 billion (72%) will be used for amortization of principal loans— P262.6 billion for
domestic debts and P119.1 billion for foreign debts (see Figure 5.1). Note that while projected
deficit is only P124.9 billion, an additional P25.1 billion will be needed to build-up the cash
account of the National Treasury (i.e., change in cash).
Domestic loans will be tapped through the issuance of Fixed Rate Treasury Bonds (P221.4
billion) and Treasury Bills (P88.9 billion). Obtaining more funds from local credit market is
seen to be a more prudent debt strategy than sourcing loans abroad because of the recent
credit downgrade by international rating agencies. Furthermore, the NG is better off with
Treasury Bonds because longer maturity period provides “breathing space” that allows the
55
FIG
URE
1
NG
DEF
ICIT
AN
D F
INA
NC
ING
PRO
GRA
M, F
Y 2
006
Fis
cal R
even
ue
96
8.6
T
ax
874.
3
B
IR
675
.4
BO
C
19
0.5
N
on-
Tax
8.
4
Tot
al N
G D
efic
it (1
24.9
)
Dis
burs
emen
ts
1
,093
.5
In
tere
st P
aym
ents
34
0.0
O
ther
s
75
3.5
Net
Dom
estic
F
inan
cing
47
.6
Net
Fin
anci
ng
124.
9
Dom
estic
Bor
row
ings
31
0.2
Prin
cipa
l Am
ortiz
atio
n 26
2.6
For
eign
Bor
row
ings
22
1.4
Prin
cipa
l Am
ortiz
atio
n 11
9.1
Net
For
eign
Fin
anci
ng
102.
4
Cha
nge
in C
ash
(25.
1)
Am
ount
s in
Bill
ion
Pes
os
Sou
rce:
BE
SF
FY
2006
, DB
M
Oth
ers
94.
3
CONGRESSIONAL PLANNING AND BUDGET DEPARTMENT 4949
use of funds for development rather than debt service/repayments. Nevertheless, the
government is still forced to borrow abroad despite certain risks since its huge demand for
loans cannot be met domestically.
The bulk of foreign funding will come from global or commercial bonds (P173.6 billion), and
the remaining P17.8 billion will be provided through project loans (P3.8 billion) and program
loans (P14.0 billion)1. Compared with project and project loans (e.g. Official Development
Assistance), global bonds fetch higher interest rates and are more vulnerable to foreign
shocks. They are also subject to “event risk” such that any unfavorable economic or political
news may create negative perception of the country’s credit-worthiness and/or payment
potential. Fixed interest rates on certain external debt instruments can only mitigate some of
these risks as 34.6% of the current $49.95 billion medium to long term obligations are in
Global Bonds 160.06 175.28 173.60 80.22 76.96 78.40
Source: BESF (DBM)
The proposed financing next year (P531.6 billion) is lower by 7.8% than the 2005 borrowing
of P576.4 billion. Since actual NG borrowings have always exceeded program, the possibility
of borrowing more than P531.6 billion for 2006 cannot be discounted (see Figure 5.2). On the
average (1997-2004), the difference between actual and program borrowing is P138.7 billion.
1 Project loans pertain to foreign loan obtained to finance a specific project while program loans are multi-
purpose foreign loans conditioned on basic changes in economic, monetary or fiscal policies, among others. 2 “Debt Payments to increase due to higher key US rate” BusinessWorld ( 07 November 2005)
DEFICIT FINANCING PROGRAM 5050
Deviation from program borrowing may be traced to a number of reasons: (a) larger-than-
programmed deficit; (b) higher principal amortization due to peso depreciation; and (c)
financial support to GOCCs, among others.
FIGURE 5.2
ACTUAL VS PROGRAM BORROWING, 1997-2004
Source of basic data: BESF (DBM)
In 2003, for example, NG borrowed P530.4 billion which is P205.5 billion or 63.3% more
than the original program (P324.9 billion) because the deficit target (P142.1 billion) was
breached by P57.8 billion. Principal amortization for foreign loans was also higher by P9.6
billion partly due to the depreciation of the peso (from P51-52:US$1 as projected to
P54.20:US$1 actual). Moreover, the Bureau of the Treasury built up its cash accounts
(change in cash) during the same year by P86.9 billion.
Actual deficit in 2004 (P187.1 billion) was lower than originally projected budget gap by P10.7
billion but actual borrowing (P583.3 billion) exceeded original program by P171.4 billion or
41.6%. Accounting for the difference, it was noted that repayment for foreign debt was
higher by P15.8 billion primarily due to foreign exchange variance (from P53-54:US$1 as
projected to P56.04:US$1 actual). Also, the Bureau of Treasury purchased P78.6 billion
worth of National Power Corporation (NPC) securities. It may be recalled that when NPC
failed to sell its debt papers in the international market due to weak financial position, NG
borrowed money and used it to buy NPC bonds. Consequently, the Bureau of the Treasury
recognized income on NPC investments amounting to P14.8 billion. However, such income
would be wiped out as the government assumes P200 billion of NPC liabilities as stated in the
Electric Power Reform Act (EPIRA). It is estimated that annual payment for interest on
NPC debts would be equivalent to 0.3% of GDP or approximately P16 billion in 2005.
0.0
100.0
200.0
300.0
400.0
500.0
600.0
Actual 20.6 153.6 280.8 290.8 274.8 436.3 530.4 583.3
Program 9.2 29.8 93.2 147.6 177.3 267.4 324.9 411.9
1997 1998 1999 2000 2001 2002 2003 2004
CONGRESSIONAL PLANNING AND BUDGET DEPARTMENT 5151
NG DEFICIT AND DEBT
Budget deficits have perennially afflicted the country for the last 40 years (see Table 5.2). Note
that from an average of only 1% of gross domestic product in the 1960s, the NG budget
deficit worsened to 4.4% of GDP in recent years. Large and persistent deficits have been
largely due to progressive decline in the tax effort and the inflexibility of the tax system to
economic changes. From a high of 17% tax-to-GDP ratio in 1997, tax effort continuously
declined to as low as 12.6% in 2004 despite the implementation of a Comprehensive Tax
Reform Program in 1998.
As NG deficits are financed through borrowings, government debts grew at exorbitantly high
levels—from only P395.5 billion in 1986 to P1.1 trillion in 1993. After seven years (2000),
NG posted its debt at P2.2 trillion and this further went up to P3.8 trillion (79% of GDP) by
the end of 2004. NG debt increases by 16.9% on the average from 1999-2004.
TABLE 5.2
DEFICIT HISTORY
PERIOD Deficit as % of GDP (average)
No. of Years in Deficit
1960 – 1969 1.0% 8
1970 – 1979 0.5% 7
1980 - 1989 2.5% 10
1990 - 1999 2.3% 6
2000 - 2004 4.4% 5
Source: Asian Development Bank (ADB) and BESF (DBM)
In retrospect, borrowings during the 1970s and 1980s were utilized to pump-prime the
economy and provide stability against oil price shocks. Moreover, the restructuring of the
Philippine National Bank and the Development Bank of the Philippines in 1986 involved the
transfer to NG of more than P55 billion liabilities and non-performing assets of doubtful
value. Poor financial performance of these institutions was traced to their lending mainly to
highly protected economic ventures or “behest loans”.3 One example was the Bataan Nuclear
Power Plant that became embroiled in national politics and the international politics of
environmental safety. In recent years, the debt stock increased considerably not only because
of budget deficits but also due to mismanagement of public corporations such as NPC.
3 Sicat and Abdula, “Public Finance” in The Philippine Economy by Balisacan and Hill (eds.) 2003
DEFICIT FINANCING PROGRAM 5252
These factors led the Executive Department to recognize the deepening fiscal and debt
problem in 2004.
The Department of Finance estimates that NG debt will reach P4.4 trillion in 2006 (see Table 5.3). Note that while the government expects an improvement in the debt ratio from 79% of
GDP in 2004 to 74.1% in 2006, this is still very high compared with the IMF debt-to-GDP
benchmark of 25% and 30% for emerging market and developing economies, respectively.4
Debt service (interest payments and principal amortization) as a ratio to GDP is also expected
to decline from 12.5% 2004 to 12% in 2006.
TABLE 5.3
DEBT RATIOS (IN BILLION PESOS)
PARTICULARS 2004 Actual
2005 Program
2006 Program
National Government Debt 3,811.9 4,247.7 4,444.2 % of GDP 79.0 79.8 74.1 Debt Service 601.7 674.1 721.7 % of GDP 12.5 12.7 12.0 Interest Payments 260.9 313.4 340.0 % of GDP 5.4 5.9 5.7 % of Cash Disbursements 29.4 32.5 31.1 % of Revenues 37.3 40.0 35.1 Principal Amortization 340.8 360.7 381.7
% of GDP 7.2 6.8 6.4
Source: DOF presentation before the House Committee On Appropriations (26 Sept 2005)
What deserves attention though is the claim of debt servicing in the NG budget. Table 5.3
shows that in 2004, interest payment alone ate up more than one-fourth (P0.29) of every P1
cash disbursement and more than one-third (P0.37) of every P1 revenue collection. Thus, the
money that could have been spent to promote social welfare and increase the country’s
productive capacity was diverted to interest payment instead. Budget allocated for debt
burden in 2006 will not be any better as almost one-third (P0.31) of cash disbursements will
go to interest payment while the remaining 69% will have to be divided among social and
economic services, allocation for local government units and other NG budget priorities.
4 “Public Debt in Emerging Markets: Is it Too High?” World Economic Outlook, International Monetary Fund, September 2003.
CONGRESSIONAL PLANNING AND BUDGET DEPARTMENT 5353
CONSOLIDATING THE PUBLIC SECTOR Consolidated Public Sector Fiscal Position (CPSFP). Aside from NG, the public sector
also includes the 14 monitored GOCCs, local government units (LGUs), government
financial institutions (GFIs), and social security institutions (e.g. SSS and GSIS). While NG
was able to bring down its deficit from P210.7 billion in 2002 to P187.1 in 2004, total public
sector borrowing requirement (PSBR) grew from P268.3 billion in 2002 to P286.1 billion in
2004 (see Table 5.4). The increase in PSBR was primarily due to the combined deficits of the
14 major GOCCs (P90.7 billion) and the cost of restructuring the old Central Bank (P17.5
billion). PSBR is expected to decline in 2005 and 2006 because of two factors: efforts of NG
to balance the budget over the medium term; and the decline in financing deficit of the 14
monitored corporations. A high PSBR usually results in crowding out of private investments
i.e., NG borrowing competes with the private sector for loanable funds and pushes up
benchmark lending rate of financial institutions.
TABLE 5.4 CONSOLIDATED PUBLIC SECTOR FISCAL POSITION
(IN BILLION PESOS)
PARTICULARS 2002 2003 2004 2005 Adj 2006 Est
National Government -210.74 -199.87 -187.06 -180.00 -124.88
National Housing Authority 0.23 -0.32 -0.21 -1.78 -0.47
Philippine National Oil Company 0.36 0.58 1.25 -1.22 -0.29
Home Guaranty Corporation -6.16 -0.96 -1.50 -0.14 -0.10
Local Water Utilities Administration -1.01 -1.26 -1.74 -0.21 0.20
Philippine Economic Zone Authority 0.22 0.36 0.15 0.11 0.16
National Electrification Administration 0.18 -0.31 0.73 0.77 1.21
National Development Company -1.08 0.29 0.21 -4.07 1.36 TOTAL -46.34 -65.32 -90.74 -42.50 -47.80
Source: DOF
Total Public Sector Debt. Consolidated public sector debt in 2002 stood at P 4.4 trillion
and subsequently rose to P5.3 trillion by 2004 primarily due to NG. Table 5.6 shows that NG
debt increased by 29% from P2.6 trillion in 2002 to P3.4 trillion in 2004 while that of the
GOCCs grew by 13% from P1.4 trillion to P1.5 trillion during the same period. One of the
reasons for NG’s ballooning debt aside from the fiscal deficit is the practice of bailing out or
assuming the liabilities of failing financial institutions and GOCCs (e.g. Central Bank, PNB,
DBP, BNPP). Total bail-out by NG contributed P320.6 billion of the P2 trillion increase in
its debt in 1997-2003. 5
Estimates by the DOF for 2006 show that outstanding liabilities of NG and of the 14
monitored GOCCs will be P4.4 trillion and P1.4 trillion, respectively. Adding these to the
2004 debt levels of financial public corporations, social security institutions, old Central Bank
and local government units (less intra-sector debt holdings) would mean that by end of 2006,
liabilities of the entire government sector may reach P6.2 trillion. 5 De Dios, et.al. “The Deepening Crisis: The Real Score on Deficits and the Public Debt” University of the Philippines, August 2004.
CONGRESSIONAL PLANNING AND BUDGET DEPARTMENT 5555
DEBT SUSTAINABILITY
Despite claims by some analysts that the country is in fiscal crisis, this may be disputed since
the government has not defaulted on its debt repayments and the economy continues to
grow. However, it is posited that the country’s fiscal state is weakly sustainable because of
two principal reasons.6
One, the current levels of NG debt and total public sector debt are already too high—making
the economy susceptible to shocks. Fortunately, external shocks seems to have abated in
recent years as foreign debt-to-GDP ratio declined from 71.3% in 2002 to 62.4% as of June
2005. The debt service burden (DSB) as a ratio to current account receipts, exports, and
GNP/GDP has also improved (see Table 5.7). In addition, external debt remains comfortable
for the following reasons: (a) short term debt accounts for only 10% of total external debt; (b)
medium to long-term debt maturities are well spread out over an average 17.7 years; and (c)
strong OFW remittances continue to fend off the peso from depreciating.
TABLE 5.6 CONSOLIDATED PUBLIC SECTOR DEBT
(IN BILLION PESOS) PARTICULARS 2002 2003 Prelim 2004
Nonfinancial public sector debt [1] 3,714.10 4,349.20 4,637.20
National Government (with Bond Sinking Fund) 2635.30 3081.30 3397.10
Central Bank/CB-BOL 67.10 60.50 48.50
Social Security Institutions (SSS,GSIS) 23.30 33.30 7.10
Consolidated Public Sector Debt [1]+[2}+[3] 4,369.10 5,074.00 5,297.60
Notes: a NG debt instruments held by SSIs, LGUs b NG debt instruments held by GOCCs, onlending from NG to GOCCs, onlending GOCC to GOCC c NG and GOCCs securities and deposits at BSP, GFIs debt held by BSP Source: DOF
6 Sustainability pertains to a debt-to-GDP ratio that is not out of control or is ever increasing.
DEFICIT FINANCING PROGRAM 5656
TABLE 5.7 EXTERNAL DEBT RATIOS (IN %)
PARTICULARS 2002 2003 2004 Jan-Jun 2005a/
External debt to GNP 65.62 69.00 60.50 58.24
External debt to GDP 71.29 73.89 64.86 62.39
DSB to Current Acct Receipts 16.19 15.94 13.10 12.66
DSB to exports of goods, receipts from services & income 16.41 16.93 13.82 13.64
Debt Service Burden to GNP 9.11 9.58 7.97 7.14
Debt Service Burden to GDP 9.89 10.26 8.54 7.69
Note: Debt Service Burden refer s to principal and interest payments Source: Mid Year Economic Briefing
However, these improving data are in constant threat from possible downgrade by
international credit rating institutions amid political and fiscal instabilities. It is estimated that
a 1% increase in Treasury-bill rate due to credit downgrade could result in a P6.2 billion
additional interest payments.7
Two, the President may not have enough support to achieve her medium-term reform
program (e.g. balanced budget by 2008) given the current political noise. According to the
ADB, a balanced budget by 2010 would require an annual tax revenue growth of 11% and a
primary spending (government expenditures excluding interest payments) growth of 5%.8 However,
ADB warns that this policy mix would result to a continued contraction in the economy
culminating to a –2% GDP growth in 2010 as the government takes more (tax) from
households and industries but flows back very little (primary spending) to the economy.
Incidentally, taxpayers are left with low disposable income for consumption and investments.
Under the medium-term development framework (2004-2010), tax revenues are targeted to
grow annually by 16.4% on average and primary spending to increase by 12.3%. In 2004, tax
revenues and primary spending grew by 11.2% and 1.23%, respectively. Tax growth
projections in the next two years are 18.1% (2005) and 23.8% (2006). However, these would
largely depend on the proper implementation of the recently approved tax measures (e.g.
VAT/non-VAT reforms and excise tax restructuring) and administrative reforms in the
Bureau of Internal Revenue and the Bureau of Customs (e.g. Run After Tax Evaders and
lifestyle check among BIR and BOC personnel). 7 “ Japanese Rating Agency Also Downgrades Credit Outlook”, BusinessWorld (16 July 2005). 8 Qin, Duo et. al., Empirical Assessment of Sustainability and Feasibility of Government Debt: The Philippine
Case, ERD Working Paper No. 64 (ADB).
CONGRESSIONAL PLANNING AND BUDGET DEPARTMENT 5757
Primary spending is expected to grow by 17.9% in 2006—way above the 8.6% MTPDP target
for the year but the increase was merely because primary spending in 2005 (P605.2 billion)
was lower than previous year’s spending (P606.1 billion). Related measures to increase the
budget and/or improve spending pattern for which the President may need support from
Congress members would include the annual appropriations bill, government
reengineering/streamlining, and the Fiscal Responsibility Bill, among others.
Debt Management Strategies. Various proposals have been raised on how government
can properly address the debt overhang. The MTPDP 2004-2010 presents a comprehensive
strategy on administrative and legislative measures, where the Fiscal Responsibility Bill is
included. Other proposals are the public audit/accounting of all government debts,
cancellation of odious debts, and Debt-for-Millenium Development Goals (MDG)
Investments9.
The Fiscal Responsibility Bill (HB No. 3890) provides a holistic approach not only to ease the
debt problem but also to instill fiscal discipline both in national and sub-national government
agencies. Some of its important features are as follows:
o Rule-based policy making over the medium-term—(a) Legislative-Executive
agreement on deficit, revenue, expenditure and financing programs, (b) personal
services cap for NG, GOCCs and LGUs not to exceed a certain percentage of net
current revenues, and (c) NG debt-to-GDP ratio of 60%-65%.
o Deficit-neutral measure wherein no expenditure proposal will be approved into law
without a complementary revenue source or an expenditure reduction proposal in
other areas.
o Disclosure of government guarantees and repeal of automatic guarantees to GOCCs
and GFIs
Another proposal (HJR No. 2) is the creation of a Congressional Committee that will review
the debt policy of government and conduct an audit of all public debt owing to the increasing
magnitude of the debt. The legislative measure has already been approved in the House of
Representatives, but a counterpart bill has yet to be filed in the Senate.
9 Strategies were raised during the preparatory workshop on Fiscal and Financial Resources Management held 27 June 2005 for the 2nd Political Parties Conference.
DEFICIT FINANCING PROGRAM 5858
A more radical approach to reduce the debt is contained in HB No. 441 which seeks to cancel
loan repayments and recover previous debt servicing for alleged fraudulent loans incurred by
previous administration. Similarly, HB No. 4263 calls for cancellation and recovery of loan
payments for the Bataan Nuclear Power Plant Project.
Finally, there is a proposal to convert 50% of outstanding debt of middle-income countries
into equities i.e., the money that creditors would have received as debt repayments will be
flowed back into the system in terms of equity shares in MDG projects. The proposal has
been endorsed by UN Secretary General Koffi Annan and the European parliaments. A
technical committee for the Paris Club has been set-up to evaluate the proposal.
SUMMARY
Deficits and debt have been affecting the country for decades. The debt burden is demanding
an increasing share in the yearly budget that threatens social welfare and sustainable growth.
In addition, the debt problem is presenting a constant threat of a fiscal crisis that could cause
further economic difficulties. The legislation of key reform measures such as restructuring of
excise tax and E-VAT is a positive development, but it needs to be complemented by other
measures to allow for better debt management.
PART
SECTORAL ALLOCATION
2
Chapter
PROMOTING PUBLIC INFRASTRUCTURE DEVELOPMENT: THE INFRA COMPONENT OF THE 2006 BUDGET
While the government is committed to boost infrastructure development in the country as reflected in a higher public sector infrastructure budget in 2006 compared to last year’s, the major issues are still strategic allocation, balanced rural-urban development, and the efficient and effective selection and implementation of infrastructure projects. Corruption has also been persistently cited as one of the causes of poor and slow delivery of quality infrastructure services, hence, a critical and effective anti-corruption drive should be in place to complement the government’s infrastructure development plan. Proper monitoring and public information drive on these projects along with their corresponding allocations should be undertaken with the coordinated efforts of stakeholders – government, constituents, private sector, etc. This will ensure that these projects are implemented as planned, and benefits from these shall accrue to the greatest number of Filipinos.
The lack of infrastructure is one key constraint of the Philippines in achieving its major goals
of poverty reduction and sustainable economic growth over the long term. Undoubtedly,
infrastructure has an increasing role in raising the living standards of the Filipinos, especially
the poorest of the poor. Access to reliable, safe and cost-effective infrastructure services such
as roads, power, safe drinking water, telecommunications, among others; is essential in
improving the lives of the people both in the urban and rural areas. Moreover, adequate and
efficient infrastructure is indispensable to growth as this improves the country’s
competitiveness and attractiveness to investments.
Although, the Philippines has attained important strides in infrastructure provision, it still
lagged behind its neighboring countries in Asia. In the World Competitiveness Yearbook
(WCY) for 2005, the Institute of Management Development (IMD) ranked the country’s
66
INFRASTRUCTURE 6060
overall infrastructure rating 55th among the 60 countries surveyed (see Figure 6.1).1 The
Philippine performance in 2005 showed minimal improvements from 2004, in terms of
various subcategories under infrastructure (see Table 6.1).
FIGURE 6.1 INFRASTRUCTURE COMPETITIVENESS RANKING
(REGIONAL COMPARISON)
Source: WCY 2005, IMD
Regional comparison of basic infrastructure services shows that while the Philippines has an
edge in terms of advancement of specific infrastructure as compared to its neighboring
countries in Asia, much is still to be done to catch up with its regional competitors on
1 The IMD is a Switzerland-based graduate management institution that measures and ranks the ability of
countries to create and maintain an environment that sustains market competitiveness. It ranks the competitiveness of 60 countries using 314 criteria based on four main factors: economic performance, government and business efficiency, and infrastructure. (See also Annex 1)
Taiwan
Malaysia
Korea
Indonesia
China
India
Philippines
Thailand
(34th)
(18th)
(23rd)
(54th)
(42nd)
(55th)
(47th)
(60th)
CONGRESSIONAL PLANNING AND BUDGET DEPARTMENT 6161
TABLE 6.2 INTERNATIONAL COMPARISON ON INFRASTRUCTURE
Telecoms Power Water & Sanitation Roads per 100 people, 2003 2000 (%) 2003-2004a 2002 (%) PARTICULARS
Paved Roads Ratio
Mainlines Mobile subscribers
Electrifica-tion Rates
Quality of Electric Supply
Access to improved sanitation
Access to Improved
water
Malaysia 0.74 18.16 44.2 96 5.9 - -
Korea - 53.83 70.09 100 6.1 92 92
Thailand 0.82 10.49 39.42 82 5.3 99 85
Philippines 0.22 4.12 26.95 80 3.7 73 85
Vietnam 0.35 5.41 3.37 75 3.4 41 73
Sri Lanka - 4.90 7.27 62 3.2 91 78
Indonesia 0.47 3.94 8.74 53 3.6 52 78
India - 4.63 2.47 43 3 30 86
1/ Scale of 1 to 7; with 1=poorly developed and inefficient; and 7=among the best in the world Source: Cited in World Bank presentation during the Philippine Infrastructure Conference
The formidable task of addressing the country’s huge infrastructure requirements lies with the
government. The government must take bold steps to accelerate infrastructure development
in the country, albeit private sector participation is strongly encouraged, to cope up with the
growing demand for basic services due to a high population growth and rapid urbanization.
PUBLIC SECTOR INFRASTRUCTURE BUDGET
The government’s commitment to boost infrastructure in the country can be determined
through its budgetary allocation on major development projects. The public sector
infrastructure budget is composed of capital outlays expenditure of the government through
the various agencies, government-owned and controlled corporations (GOCCs) and local
government units (LGUs) that carry out the infrastructure development plan.2 The government’s proposed allocation of P126.7 billion for infrastructure development in
2006 is 9.6% higher than the P115.6 billion approved in 2005 (see Table 6.3). The national
government (NG) has allotted P72.4 billion to fund needed infrastructure projects – this is
28% higher compared with the P56.5 billion outlay a year ago. This budget comprises 57.1%
of the overall public sector infrastructure budget.
2 Although allocations to the LGUs – which are composed of 20% of IRA, and Special shares of LGUs in the proceeds of national tax, are classified as MOOE, these expenditures are intended for community development and capital projects. Hence, it is included in the public sector infrastructure budget.
INFRASTRUCTURE 6262
TABLE 6.3 PHILIPPINE INFRASTRUCTURE ALLOCATION
(IN BILLION PESOS)
PARTICULARS 2004 2005 2006
Public Sector Infrastructure Budget 96.2 115.6 126.7
National Government (NG) 51.4 56.5 72.4
Local Government Units 29.8 32.2 35.4
GOCCs 15.0 26.8 18.9
Source: FY 2005 BESF, DBM
Although this is only around 15% of the total public sector infrastructure budget,
government-owned and controlled corporations (GOCCs) allocation for infra development
weighs significantly on government’s overall fiscal standing, since much of these allocations
come from internally generated funds as well as corporate borrowings, which are guaranteed
by the national government. Moreover NG infusion is also needed as counterpart funds for
GOCCs infra-related expenditures.
TABLE 6.4 NATIONAL GOVERNMENT INFRASTRUCTURE
Levels (In Billion) Percentage Share Growth PARTICULARS
2005 2006 2005 2006 (%)
DPWH 38.7 51.4 68.5 71.0 32.7
DOTC 2.5 5.9 4.4 8.1 135.7
DepEd 3.2 3.0 5.7 4.1 (7.5)
ARMM 0.9 1.0 1.6 1.4 9.3
AFMA 10.6 10.5 18.7 14.5 (0.4)
Allocations to LGU 0.7 0.7 1.2 0.9 (2.2)
TOTAL 56.6 72.4 100.0 100.0 28.0
Source: DBM
The higher expenditure program on public infrastructure in 2006 marks an improvement in
the government’s spending pattern of giving priority to improve and modernize the country’s
physical infrastructure. However, the public infrastructure budget to GDP ratio in 2005 and
2006 of 2.2% and 2.1% respectively, is still meager compared to the 5% ratio proposed by
World Bank (WB) for infrastructure investments to have a significant impact on middle
income countries in East Asia.3 Worse, public sector infrastructure budget as a percent to the
3 The World Bank proposes that infrastructure investments gradually increase from less than 3% of GDP to at least 5%;
CONGRESSIONAL PLANNING AND BUDGET DEPARTMENT 6363
FIGURE 6.2 PUBLIC SECTOR INFRASTRUCTURE BUDGET
-
5
10
15
20
% of GDP 3.54 3.47 2.87 2.88 1.99 2.22 2.19
% of Total Budget 17.1 17.8 15.3 15.0 11.1 12.6 12.0
2000 2001 2002 2003 2004 2005 2006
1/ Nominal GDP figures used for 2005 and 2006 are P5,203.3 billion and P5,780.6 billion,
respectively, based on the revised DBCC assumptions; 2/ Actual expenditure used in 2000 to 2004; GAA allocation used in 2005 and proposed budget used in 2006; Sources: GAA, NSCB
overall expenditure is generally on a downtrend in recent years – this is even set to weaken
slightly in 2006 to 12.0% of the overall budget, from 12.6% in 2005 (see Figure 6.2).4 PUBLIC INFRASTRUCTURE EXPENDITURE BY TYPE
Roads. Roads confer social benefits by providing communities with access to markets, basic
services, (education, health, etc.) employment and information. Roads also play a catalytic
role in improving agricultural productivity, quality of education and medical services, gender
equality, as well as the overall well-being of the poor segment of the population. Improved
road condition in the rural areas will effect spill-over development from business centers to
less-progressive communities through trade, improved transportation and investments.
Poor road infrastructure is one factor that explains the disparity in regional development in
the Philippines. The backlog in road infrastructure may be attributed to the low investment
in roads network, as well as inefficiency in resource utilization. Data from the DPWH and
DILG in 2005 showed that while the paved roads ratio to total national roads is at 70.4%, the
paved roads accounted for only 23.8% of the total road network (local and national). This
pales in comparison to Thailand (82%), Malaysia (74%), Indonesia (47%), and Vietnam
(35%).5
4 Although a big portion of the GOCCs infra allocation is not part of the General Appropriations Act (GAA), it is included in this ratio – public sector infrastructure budget as a percentage of total budget, for analysis purposes only;
5 Cited in DPWH presentation during the Philippine Infrastructure Conference in May 23, 2005;
INFRASTRUCTURE 6464
As of 2005, the length of the country’s total road network is at 206,780.4 km. comprised of
28,495 kms. of national roads and 178,285 kms. of local roads.6 However, various road
indicators (as shown in Table 6.5) manifest uneven distribution of national and local roads.
Paved roads ratio is highest in Metro Manila with almost 100%, while the same ratio is dismal
in the Cordillera Autonomous Region (CAR) and CARAGA with 33.3% and 49.5%,
respectively. Metro Manila has also the highest road density per land area, but lowest in road
density per vehicle and population. CARAGA and ARMM have the lowest road length per
land area (in sq.km.) of 0.4 and 0.3 kilometers, respectively.
For 2006, the government is allotting P36.9 billion for roads and bridges development –
25.6% higher than the P29.4 billion proposed in the 2005 budget. This comprises 29.1% of
the entire public sector infrastructure budget (see Table 6.6).
TABLE 6.5
PHILIPPINE ROAD INDICATORSA (BY REGION)
Road Density (in km.)c PARTICULARS National
Roads Paved Road Ratiob (%) Rank Land area
(sq. km.) Population
‘000 Vehicles
‘000
Philippines 28,945.0 70.4 0.7 2.6 42.2
NCR 992.3 99.9 1 7.6 0.5 3.1
CAR 1,795.1 33.3 15 0.5 6.6 171.1
Region I 1,609.0 89.3 2 1.1 3.5 60.7
Region II 1,748.8 66.2 10 0.5 5.3 88.4
Region III 1,977.3 86.3 3 0.8 1.9 26.7
Region IV 4,452.4 65.3 11 0.5 1.9 36.2
Region V 2,171.5 71.4 8 0.5 2.0 65.9
Region VI 2,875.4 73.9 6 0.9 2.8 67.6
Region VII 1,910.6 83.6 4 1.0 2.7 33.2
Region VIII 2,244.8 78.2 5 0.4 2.7 93.5
Region IX 1,106.2 72.4 7 0.6 3.5 80.1
Region X 1,604.0 71.3 9 0.9 5.6 121.1
Region XI 1,439.1 61.7 12 0.6 3.3 98.1
Region XII 1,211.8 59.4 13 0.5 3.7 69.1
CARAGA 1,356.9 49.5 14 0.4 3.6 157.2
ARMM 407.0 -- -- 0.3 2.9 --
a/ Paved roads and road density are CPBD generated data using information derived from DPWH, the 2004 PSY, and LTO; b/ Paved roads ratio is the percentage of all concrete and asphalt roads to the total national road length; data sourced from DPWH website as of August 2005; c/ Road density is the ratio of total road length (national & local) per land area (in sq. km.), number of registered motor vehicles, and
population; Regional breakdown of local roads data as of December
6 National roads as of August 2005 is sourced from DPWH, and local roads as of date is sourced from DILG.
CONGRESSIONAL PLANNING AND BUDGET DEPARTMENT 6565
TABLE 6.6 REGIONAL PUBLIC INVESTMENT IN ROADS & BRIDGES
Region
Total Budget
(in Million Pesos)
Rank
Percent of Regional
Allocation to Total Roads
Budgetb
Rank
Per Capita Roads
Investmentc (in Pesos)
Rank
Per sq. km. Road
Investmentd
(in Pesos)
Rank
NCR 3,002.6 4 10.1 4 30,229.6 9 4,864,040.2 1
CAR 2,713.7 5 9.1 5 198,744.9 1 139,932.0 4
Region I 4,208.6 1 14.2 1 100,193.6 3 319,003.3 2
Region II 986.3 12 3.3 12 35,058.9 5 31,653.1 14
Region III 1,425.3 10 4.8 10 17,747.3 14 77,480.6 9
Region IV 2,308.2 6 7.8 6 19,571.9 13 46,796.0 11
Region V 1,464.2 9 4.9 9 31,242.1 7 80,760.0 8
Region VI 1,929.9 7 6.5 7 31,071.8 8 93,618.0 7
Region VII 1,799.5 8 6.1 8 31,531.4 6 113,353.1 6
Region VIII 3,039.9 3 10.2 3 84,198.1 4 130,305.8 5
Region IX 889.7 13 3.0 13 28,782.4 10 46,386.4 12
Region X 621.6 14 2.1 14 22,625.3 12 38,392.8 13
Region XI 1,370.3 11 4.6 11 26,406.1 11 48,217.1 10
Region XII 28.2 16 0.1 16 1,085.9 16 1,560.1 16
CARAGA 3,536.2 2 11.9 2 168,764.2 2 164,699.5 3
ARMM 360.5 15 1.2 15 14,945.5 15 14,262.6 15
a/ Paved roads as percentage to total national roads; b/ Accounted only P29.7 billion DPWH budget for roads & bridges with regional breakdown; does not include payment for completed
works, Right-of-Way (payment), consultation services; c/ Refers to the percentage of roads investment to regional population; d/ Refers to the percentage of roads investment to regional land area (per sq.km.) Source: DPWH computation based on the 2006 National Expenditure Program (NEP)
Regional breakdown of locally funded and foreign-assisted projects (see Table 6.7) for roads
and bridges improvement in 2006 shows signs of redirection of the funds to regions with
poor road infrastructures. For instance, regional allocations for CARAGA and CAR obtain a
large share in the overall budget for roads, 11.9% and 9.1%, respectively, although ARMM
and Region IV still have the lowest share in this category with 1.2% and 0.1% respectively.
The other regions that topped in the rank in terms of percentage share of regional roads
allocation to total roads investment are Ilocos region (14.2%), Eastern Visayas (10.2%) and
Metro Manila (10.1%).
In terms of per capita road investment, the regions that have the biggest allocation are CAR,
CARAGA, Ilocos region, Eastern Visayas, and Cagayan Valley. In terms of land area, NCR
has the highest allocation of P4.9 million per sq. km., followed by the Ilocos region,
CARAGA, CAR, and Eastern Visayas. The NCR with only 617 sq. km. land area (the lowest
among all regions in terms of land area) obtains P3.0 billion allocation for roads and bridges,
the 4th largest among the country’s 16 regions.
INFRASTRUCTURE 6666
TABLE 6.7 2003 DPWH INFRASTRUCTURE PROGRAM
REGIONAL ALLOCATION OF INVESTMENTS FOR ROADS & BRIDGES (IN THOUSAND PESOS)
PARTICULARS Locally-funded Projects
Foreign-assisted Projects
Total1 Ratio of Regional Allocation to Total
(In %)
Philippines 3,780,760 25,903,934 29,684,694 100.0
NCR 1,766,818 1,235,754 3,002,572 10.1
Northern Luzon 1,046,331 8,287,502 9,333,833 31.4
CAR 26,903 2,686,784 2,713,687 9.1
Region I 83,275 4,125,336 4,208,611 14.2
Region II 170,953 815,310 986,263 3.3
Region III 765,200 660,072 1,425,272 4.8
Southern Luzon 231,230 3,541,224 3,772,454 12.7
Region IV-A 35,730 934,614 970,344 3.27
Region IV-B 30,000 1,307,898 1,337,898 4.5
Region V 165,500 1,298,712 1,464,212 4.9
Visayas 376,726 6,392,484 6,769,210 22.8
Region VI -- 1,929,878 1,929,878 6.5
RegionVII 278,390 1,521,091 1,799,481 6.1
Region VIII 98,336 2,941,515 3,039,851 10.2
Mindanao 359,655 6,446,970 6,806,625 22.9
Region IX -- 889,724 889,724 3.0
Region X 121,655 499,993 621,648 2.1
Region XI 143,000 1,227,301 1,370,301 4.6
Region XII -- 28,214 28,214 0.1
CARAGA 95,000 3,441,230 3,536,230 11.9
ARMM -- 360,508 360,508 1.2
Note: 1/ The DPWH roads budget is P36.9 billion, but what is only accounted for regional breakdown is P 29.7 billion; does not include allocation for payment of ROW, and other lumped sum allocation. Source: DPWH computation based on NEP 2006;
Railway System. The government has embarked in developing an efficient railway system
to address the severe traffic congestion in Metro Manila. This will provide alternative means
of transporting people and cargoes to distant areas in a fast and cost-effective way.
Government budgetary support to the Light Rail Transport Authority (LRTA) through the
Department of Transportation and Communications (DOTC) amounting to P25 million will
be used to finance Line 1 capacity expansion project – i.e purchase of additional four (4) sets
of trains, improvement of stations, etc. The DOTC will also infuse P403 million as a
counterpart fund to a foreign assisted project for Line 2, which will be used for civil works,
land settlement and site acquisitions costs, among others. Budgetary support is also provided
for MRT 3 worth P600,000 for the purchase of additional ticket issuing machines. Given the
CONGRESSIONAL PLANNING AND BUDGET DEPARTMENT 6767
enormous capital investment requirement, NG is financially constrained to finance rail system
projects deeply needed to improve and revitalize the country’s transportation sector, hence
the importance of private sector participation.
The Philippine National Railways (PNR) will likewise allot P2.6 billion – as loan proceeds
from Korea Export-Import Bank, to fund North Rail and South Rail linkage project. The
PNR South Rail project, which is currently under planning and consultancy stage, will develop
a 60 kilometers railway system connecting the Caloocan-Alabang phase (Phase I) and the
Alabang-Calamba phase (Phase 2). The PNR is allocating P70.6 million as consultancy
payment, which includes project planning and design, etc. to the south rail project. Water Supply. The President’s Priority Program on Water (P3W) adheres to the
government’s thrust of providing safe and potable water to identified 432 waterless7
municipalities outside of Metro Manila (see Table 6.8). The project will apportion P500 million
each year during the medium term (from 2005 to 2010) to help alleviate poverty problems in
the country. This is complementary to the “Patubig ni GMA” project, which provided
potable water through mobile tankers to almost a million waterless households in Metro
Manila, and the provinces of Rizal, Cavite, Bulacan and Laguna.
TABLE 6.8
NUMBER OF WATERLESS COMMUNITIES/HOUSEHOLDS UNDER THE P3W PROGRAM (BY REGION )
No. of Waterless % to Total No. of Waterless % to Total REGION
Municipalities Barangays Barangays Households
Philippines 432 10,066 24.0 2,486,261 16.3
CAR 8 129 11.0 19,582 7.4
Region I 12 263 8.1 60,006 7.2
Region II 29 630 27.3 141,355 25.5
Region III 10 165 5.3 50,280 3.1
Region IV 28 603 11.0 141,177 5.9
Region V 28 677 19.5 167,374 18.7
Region VI 74 1,765 43.6 515,438 42.5
Region VII 36 897 29.9 268,089 23.7
Region VIII 22 620 14.1 103,808 14.5
Region IX 34 809 42.5 162,169 27.2
Region X 28 596 29.5 117,076 21.6
Region XI 14 254 21.9 112,746 10.6
Region XII 19 480 40.2 191,568 38.2
CARAGA 15 293 22.4 84,363 21.5
ARMM 75 1,885 76.7 351,230 89.3
Source: National Anti-Poverty Commission (NAPC), 2004 PSY
7 Waterless communities (outside of Metro Manila) – identified by the Water and Sanitation Coordinating Office (WASCO), are areas with less than 50% of total households having access to potable water.
INFRASTRUCTURE 6868
From the 2005 budget of the P3W, actual release of funds from the DBM as of August 2005
reached P134.7 million to finance the first batch of the water provision project; out of the
P140.6 million endorsed by the DPWH (see Table 6.9).8 A total number of 82 municipalities
nationwide are expected to benefit from the first batch of fund release. The program is
required to graduate 72 municipalities yearly if it aims to provide water supply to 432
municipalities in six years up to 2010.
TABLE 6.9 2005 REGIONAL ALLOCATION OF THE P3W FUND, (FIRST BATCH)
REGION
No. of Beneficiary LGUs
Allocation
CAR 3 6,395,400
Region I 3 725,400
Region II -- --
Region III 14 4,373,400
Region IV-A 7 5,493,600
Region IV-B 4 15,647,700
Region V 4 12,753,900
Region VI 11 22,002,000
Region VII 5 16,600,600
Region VIII -- --
Region IX 17 35,555,200
Region X 1 103,700
Region XI 2 3,797,100
Region XII 3 5,427,800
Region XIII 2 5,774,900
ARMM 6 5,906,900
Total 82 140,557,600
Source: DPWH a/ The P359.4 million balance allocation out of the P500 million is allotted for the
2nd batch water supply projects under preparation;
However, reports on the P3W program raise issues on the rationality and transparency of the
criteria set in the identification and approval of project beneficiaries. Data from the DPWH
revealed that only 55% of the actual beneficiaries of the fund were part of the list of waterless
municipalities originally identified by the Water and Sanitation Coordinating Office (WASCO)
of the National Anti-Poverty Commission (NAPC). Additionally, there are project-funding
8 The P5.907 million budget for the ARMM provision for potable water (covering Lamitan, Lantawan, Maluso, Sumisip, Tipo-tipo and Tuburan municipalities in Basilan), was held in abeyance pending the lifting of the election ban on August 2005 pursuant to the Omnibus Election Code.
CONGRESSIONAL PLANNING AND BUDGET DEPARTMENT 6969
requirements for various municipalities/barangays that exceed standard costing of Level 1
and Level II water supply system of not more than P2 to P3 million.
The ranking made by the NAPC of these waterless communities was perceived to guide the
government on how it should prioritize targeted areas in implementing the program. Ideally,
government water supply projects should be initiated first in the ARMM as the incidence of
households with less access to safe drinking water is in huge proportion – about 83.3% of the
entire households. Eight (8) out of the top 10 waterless communities are from the provinces
of Lanao del Sur, Tawi-tawi, Sulu. The other two municipalities in the top rank – Quezon
and Magsaysay, are from the provinces of Quezon and Palawan, respectively.
Meanwhile, capability building among beneficiary LGUs in developing plans and
implementing programs that will address water access gaps in their areas should be supported
well by the involved national agencies, local water districts, and the private sector.
Rural Electrification. The Expanded Rural Electrification Program of the government is a
collaborative effort of the National Electrification Administration (NEA), the private
investor-owned utilities (PIOUs) and the local government utilities, to ensure wider access to
electricity through the electrification of barangays and sitios or pockets of small villages all the
way to the household level. Expanding access to electricity especially in the rural areas forms
part of the government’s effort to alleviate poverty and achieve sustainable economic growth.
A joint study made by the United Nations and Development Program (UNDP) and the
World Bank showed the benefits of rural electrification in the country across a wide range of
activities including increasing literacy, reducing time spent in performing household chores,
increasing entertainment possibilities, raising business productivity, and improving health.9
Based on the Annual Poverty Indicator Survey (APIS) in 2002, there are 15.9 million families
or 21.0% of total have no access to electricity. The poor bear the brunt of having low access
to electricity with 44.1% coming from the families in the bottom 40% income group, as
compared to the 5.6% of the families in the upper 60% income class. Most of them are in the
rural areas, with five (5) out of ten (10) of the families belonging to the lowest 40% income
stratum having no electricity. Majority of these poor families who have no access to
electricity are in the ARMM, Western Mindanao, CAR, Western Visayas, Central Visayas and
Eastern Visayas.10
9 Based on the joint UNDP and WB study entitled Rural Electrification and Development in the Philippines:
Measuring the Social and Economic Benefits; 10 More than 50% of the households in these regions have no access to electricity based on the APIS 2002.
INFRASTRUCTURE 7070
The national summary on the status of energization shows gradual improvement in the
number of households with access to electricity, growing by an average of 5.1% from 2002 to
2004 (see Table 6.10). Across the country, the NCR has the highest energization level with
93.2% of the entire households having access to electricity. On the other hand, the regions
that have the least percentage of families with access to electricity (or an average energization level
below 50%) in the said period are ARMM, Central Mindanao, and Western Mindanao.
Interestingly, efforts to strengthen energization in these regions is encouraging especially in
the ARMM and MIMAROPA, and will hopefully generate increases in the number of
households with access to electricity.
As of June 2005, the National Electrification Administration (NEA) has energized 33,138
barangays out of the targeted 36,003 barangays nationwide. The NEA has exceeded its target
of energizing 600 barangays in 2004, and it is expected to surpass again its targeted 200
barangays this year.
TABLE 6.10 STATUS OF ENERGIZATION
Energization Level (Cumulative) Energization Ratea – in Percent
Note: a/ Refers to the percentage of total households energized or provided with access to electricity; b/ Annual average growth rate of energization level in 2002-2004; * Targeted number of households and percent energization rate are CPBD computations based on the consolidated report on electrification
from electric cooperatives (Ecs), private investor-owned utilities (PIOUs), local government utilities, others. Source: NEA
CONGRESSIONAL PLANNING AND BUDGET DEPARTMENT 7171
In 2006, the NEA allotted P1.3 billion to pursue its rural electrification program for 200
barangays. This budget is more than twice the P509 million allocation last year. The huge
bulk of the fund – P1 billion, is sourced from the corporate earnings – through its collection
of receivables from PSALM, and borrowings of NEA as loan releases for participating
electric cooperatives. Government subsidy to the NEA amounted to P276 million to finance
the electrification of the targeted 200 barangays.
Given the current budgetary constraint as a result of the fiscal consolidation, the government
is hard pressed to accelerate its rural electrification program especially in the poverty-stricken
areas. Hence, it is encouraged to be more cost-efficient and effective, as well as resort to
strategic implementation of the electrification program in support for its anti-poverty
campaign primarily targeting those areas with the highest incidence of poverty.
E-Government Fund. The government needs to sustain the momentum toward exploiting
the benefits of information and communications technology (ICT) and strengthening its role
in national development. Undoubtedly, the comparative advantage of the country’s ICT
sector is recognized worldwide backed by its skilled and competitive workforce.
In the latest United Nations (UN) Global E-Government Readiness survey, the Philippines
global ranking fell from 33rd in 2003 to 47th in 2004 (see Table 6.11). While this is not a
welcome news for the government, the country’s E-Government ranking is one of the highest
in Asia, better than Thailand, China, Indonesia, and even India. The E-Government
Readiness index assesses not only the website development patterns of member countries but
also the levels of access and utilization of ICT as a tool for socio-economic development and
cultural empowerment of the citizens.
Additionally, the Philippines also ranked 26th of the 38 countries that offers Stage IV features
or those that have transactional web presence. Stage IV website features allows two-way
interactions between the citizens and the government, which includes options for payment of
taxes, applying for IDs, birth certificates, passports, licenses and renewals online.
Out of the estimated P4 billion budget earmarked for E-Government Fund in 2003, 24 ICT
projects from different government agencies endorsed to the Commission on Information
and Communications Technology (CICT) were approved amounting to P3.0 billion.11 In
11 Per National Budget Circular 487 (dated 20 May 2003), the government approved the imposition of 15%
reserve on non-personnel services items in GAA, of which 1/3 or approximately P4 billion was earmarked for the E-Government Fund. The amount earmarked in 2003 was available for two (2) years until the end of 2004. No separate amount was allotted in 2004 for the E-Government Fund.
INFRASTRUCTURE 7272
2005, when the E-Government Fund was institutionalized and provided with P1 billion
allocation, five (5) ICT projects were already approved as of date amounting to P592 million
(see Table 6.12). Most of these are continuing projects from those approved in the 2003
budget. This translates to an estimated balance in 2003 and 2005 of approximately P1.4
billion, which will still be tapped for future ICT project proposals.
TABLE 6.11 E-GOVERNMENT READINESS RANKING
SELECTED COUNTRIES IN SOUTH & EASTERN ASIA
Global Ranking Country
2004 2003
Republic of Korea 5 13
Singapore 8 12
Japan 18 18
Malaysia 42 43
Philippines 47 33
Thailand 50 56
Brunei 63 55
China 67 74
Indonesia 85 70
Vietnam 112 97
Myanmar 123 126
Cambodia 129 134
Source: 2004 Global E-Government Readiness Report
The national campaign to intensify information and communications technology (ICT) usage
in the country as a tool for economic growth should be initiated by the government through
the use of Voice over Internet Protocol (VoIP) between and among government offices,
which can substantially reduce communications costs and could result to huge savings for the
cash-strapped government.12. This proposal may be implemented exclusively for
government-to-government transactions (G2G) between national and regional offices,
including local government units. In the long term, widespread use of VoIP technology will
help in developing a universal telecommunication infrastructure allowing access to basic
telecommunication services to unserved and underserved areas of the country.
12 Palawan Representative Abraham Mitra recommended the bureaucracy to institutionalize the use of VoIP –
which allows one to place calls on the Internet for free with the aid of the computer. This will spare the user “long distance” and mobile phone charges (Philippine Daily Inquirer: October 17, 2005)
CONGRESSIONAL PLANNING AND BUDGET DEPARTMENT 7373
TABLE 6.12 2005 E-GOVERNMENT FUND PROJECTS
AGENCY PROJECT APPROVED AMOUNT
DILG Public Safety Information System 176,000,000
DTI Philippine Business Registry 175,761,600
CICT Community E-Center 200,000,000
NCC ELGU Project 20,196,605
LTFRB Frontline Unit Services Enhancement & Upgrading Project
20,000,000
Total 591,958,205
Source: CICT
Airports and Ports. Development fund to improve the country’s airports, navigational
facilities, ports and lighthouses are essential to ensure safe flights and sea voyages in the
country, as well as facilitate trade and tourism activities especially in the countryside. Funding
support from the government to establish new ports/airports, or improving existing
ports/airports in strategic areas will spur economic development leading to huge
concentration of passengers and tourists, and allowing new businesses to flourish.
Some P5 billion under the Department of Transportation and Communications (DOTC) is
proposed to fund airports improvement next year, through new constructions and capital
outlay expenditures of the identified 144 domestic and international airports nationwide (see
Table 6.13). This budget is almost four (4) times larger than the P1.3 billion allocation in
2005. The 2006 airport budget is composed of P3.2 billion locally funded projects and P1.8
billion foreign-assisted projects.
Various airport development projects is lumped under the nationwide item of the DOTC
budget amounting to P1.5 billion, which includes feasibility studies of Daan-Bantayan, Cebu,
and Santa Barbara airport, Pangasinan, as well as the rehabilitation of various trunk line and
secondary airports. Foreign-assisted airport projects include Laguindingan Airport
Development Project in Misamis Oriental (P5 million), the upgrading of air transport service
in Iloilo province (P975 million), and selected airports development project (P792.9 million).
Funding from the national government for ports development amounting to P209 million
consists of P110 million locally-funded projects for 96 identified seaports nationwide, and
foreign-assisted project for feeder ports improvements amounting to P149 million (see Table
6.13). The Philippine Ports Authority is also allotting P3.5 billion to fund various port
infrastructure developments, which include Batangas Port Development Project (P1.7 billion),
local port projects (P1.4 billion), among others.
INFRASTRUCTURE 7474
TABLE 6.13 NG BUDGET ALLOCATION FOR PORTS & AIRPORTS
Source: Details of Selected Programs and Projects, DBM
THE BIGGER TASK AHEAD: COMBATING CORRUPTION The bigger challenge for the government aside from merely increasing public allocation for
infrastructure provision is to urgently address the systemic corruption in various levels of
government infrastructure projects. Public infrastructure projects especially civil engineering
projects, are perceived to be highly susceptible to corrupt activities given the huge amount of
money involved in these projects. One reason that explains this is that government budgetary
allocation for capital projects is subject to political influence.
Corruption is a disincentive to economic growth as public funds that would have otherwise
been channeled for social services – education, public health, and poverty alleviation – are
siphoned off for personal gains. It also results in inferior quality of infrastructure projects –
roads, bridges, buildings, etc., which will require higher costs for maintenance and
rehabilitation.
CONGRESSIONAL PLANNING AND BUDGET DEPARTMENT 7575
The perception of corruption in the Philippines is increasingly cited as pervasive and deep-
rooted, a factor that inhibits domestic and foreign investments which may potentially erode
the overall competitiveness of the country. In the 2004 survey of the Transparency
International (TI), the Philippines ranking in the Corruption Perception Index (CPI) slid by
ten notches to 102nd place from 92nd in the previous year indicating the worsening incidence
of corruption in the country.13
One basic example of the perceived pervasiveness of corruption in the government is the case
of DPWH, the infrastructure arm of the government. The DPWH has been consistently
cited by the public and businesses as one of the most corrupt agencies in the Philippines.14
This presents an alarming situation, which could imperil and put to waste billions of pesos of
infrastructure allocation due to suspected unabated corruption.
Several related literatures recognizing not just “perceptions” but also prevalence and adverse
impact of corruption in the Philippines infrastructure development, are as follows:
§ Serafica cited corruption as the single most important factor that can set back all
efforts to improve the state of infrastructure in the Philippines. He noted that the
existence of consumption externalities imply that every peso that is diverted from
infrastructure results in a loss of more than one peso worth of benefits to users and
the society in general (Serafica:1998)
§ According to the Office of the Ombudsman, the government lost an estimated $48
billion to corrupt practices over the last twenty years (as cited by World Bank from
the study conducted by the Office of the Ombudsman: June 2000);
§ The Philippine Center for Investigative Journalism (PCIJ) estimated that kickbacks
from major infrastructure projects is estimated at 36% of the entire project cost
(based on the presentation of Sheila Coronel entitled Democracy and Its
Discontents: The Philippine Experience);
§ The misuse of resources in public works accounts for 20% to 40% of the total
project cost. Also, regional directors of central agencies are said to receive 10%
commission and DBM officers get 15%, on certain procurement and infra projects
(as cited by World Bank from the study conducted by Azfar & Gurgur: 2000);
Hence, it is imperative for the government to undertake a vigorous anti-corruption strategy
and an extensive oversight program to support the government’s pro-poor and pro-growth
13 The 2004 corruption perception index of the TI is based on series of surveys from 146 countries worldwide. 14 DPWH is always in the bottom five (5) in terms of the net sincerity rating in fighting corruption based on the
SWS survey of Enterprises on Corruption 2000-2005.
INFRASTRUCTURE 7676
stance. Progress in the implementation of the Government Procurement Reform Act
(R.A.9184), Ombudsman Act (R.A.6770) and other measures that address poor accountability
in the implementation of infrastructure projects should be sustained and improved.
A strong monitoring in the implementation of various government infrastructure projects
should be undertaken to see to it that the funds being provided for are used efficiently and
prudently in promoting infrastructure development. Collaborative efforts among different
and colleges, etc., in coming up with a menu of basic infrastructure projects with their
corresponding benchmark costs is one way to improve monitoring and oversight in the
implementation of government infrastructures. Through this intervention by private groups,
the government will be forced to weed out transactions with unscrupulous contractors,
avoiding overpriced infrastructure projects, and allowing only those that are not detrimental
to the general welfare of the people.
Far more important is to fast-track the prosecution and imposition of sanctions to public
officials who are allegedly involved in graft and corruption cases. This action will assure the
public that the government is serious in curbing and ultimately eradicating all sorts of
corruption and irregularities in government transactions. CONCLUSION
Despite the current fiscal constraint faced by the government, public sector infrastructure
budget is increased in 2006 in response to the commitment set forth by the government to
effect broad based infrastructure growth in the Philippines. This strategy is pinned in the
hope that advancements in infrastructure especially in the poorest areas will stimulate
economic growth and will support the poverty alleviation efforts of the government through
the delivery of basic social services. Progress in dispersing infrastructure development –
roads and bridges, water supply; is also evident with much of the public funds diverted from
the National Capital Region to regions with huge infrastructure backlogs – CARAGA, CAR.
These observations are just basic profiles of the public sector infrastructure budget in 2006.
The bigger challenge, however, in assessing the public infrastructure budget is on how this
allocation is implemented and effected into actual infrastructure projects as planned, without
compromising its quality and long-term use by the public. Implementation of anti-graft
measures along with proper monitoring and oversight of these infrastructure projects should
be sustained and should gain some headway, through the coordinated efforts of the
government, constituents and private organizations.
Chapter
IMPROVING OUTCOMES IN BASIC EDUCATION
The demand for educational services by an increasing school-age population continues to strain public resources for primary education. Despite nominal increases in education expenditures annually, real per capita spending has been declining over the past five years. Consequently, the country’s quality of basic education pales comparably with that of our Asian neighbors. Resources gaps in terms of educational facilities and personnel will continue to grow unless limited resources are allocated more efficiently across levels and programs.
INCREASING DEMAND FOR EDUCATION
The school-age population (5 - 19 years) of the Philippines grew by 9.24% from 1995 to 2000
or an average of 451,000 a year. This is in stark contrast with the 3.32% average growth rate
of school-age children in the Asian region. By 2005, the school-age population of the
Philippines is expected to reach 28.19 million or about 34.64% of total population. Although
this growth is expected to decline over time according to the National Statistics Office (NSO)
population projection—from 6.16% in 2005 to a minimal growth of 0.42% in 2010, the
demographic momentum that was the result of high growth rates in the past will keep the
population growing. Evidently, the slow decline in fertility and the country’s rapid population
growth has meant rapid growth of school-age population (see Figure 8.1).
High proportions of school-age children, characteristic of developing countries, will
undoubtedly put additional strain on existing education and health facilities. In the absence
of even more robust growth in government revenues or major shifts in government spending
priorities, the population pressure tends to depress public expenditures per student.
88
BASIC EDUCATION 9292
FIGURE 8.1 SCHOOL-AGE POPULATION, 1995-2015
(IN THOUSANDS)
7000
7500
8000
8500
9000
9500
10000
1995 2000 2005 2010 2015
In T
ho
usa
nd
s
5 to 9 10 to 14 15 to 19
Source: National Statistics Office
In the basic education level, it is estimated that in 2005 there are 12.16 million eligible for
elementary schooling and 5.21 million for secondary schooling. The average growth rates for
each level over the last five years (from 2000 to 2005) are 0.87% and 15.67%, respectively. To meet the huge demand for educational services, the government has responded to this
growth by expanding resources for education in order to ensure high levels of school
participation rates. Elementary schooling is compulsory and, in 1988, the government
adopted the policy of free public secondary education.
Accordingly, participation rates in the elementary level from 2002 to 2003 are considerably
high at an average of 94.02%, suggesting that universal education had been nearly achieved in
the Philippines. Based on such indicator as the proportion of the relevant school-age group
enrolled in elementary education, the Philippines actually ranked relatively above most
countries in Asia. Even Department of Education (DepEd) enrollment projections indicate
that such trend will continue.
EDUCATION OUTCOMES Low Internal Efficiency. While enrollment rates are high, the educational system is marred
by low internal inefficiency. This is apparent in the low cohort survival rates, low
achievement scores, as well as regional and economic differentials in educational attainment.
This is perhaps the effect of the limited budget accorded the basic education. The national
priority to provide universal education has taken its toll on the quality aspect.
CONGRESSIONAL PLANNING AND BUDGET DEPARTMENT 9393
Out of every 100 students that enter Grade 1 in 2003, six of them dropped out of school. Of
the 94 remaining, only 63 of them graduated from grade school. Transition rates are usually
high with almost all students finishing grade school entering the next level. However, what is
particularly alarming is the increasing number of dropouts in high school—about 40% of
total enrollees. This means, out of every 100 students that enter Grade 1, only 38 are able to
finish basic education. Indeed, government intervention is urgently needed to improve
completion rates (see Table 8.1).
TABLE 8.1 PERFORMANCE INDICATOR IN BASIC EDUCATION
Students Entering Students Leaving PARTICULARS
1994 1997 2000 2003 1994 1997 2000 2003
Total number of entrants 100 100 100 100
Elementary 87 95 97 94 13 5 3 6
Completing elementary 56 65 64 63 31 30 33 31
Secondary 54 64 64 63 2 1
Completing secondary 44 46 47 38 10 18 17 25
Total school leavers 56 54 53 62
Source of basic data: Department of Education
There are also differences in access to education by income strata and region. Survey data
from the Annual Poverty Indicator Surveys (APIS) in 1999 and 2000 showed that differences
in elementary participation rates (see Table 8.2) of poor and rich families are not that
significant. There is even a marked improvement in 2000 as the attendance in elementary
school increased by 10.96% for the lowest 40% income group and 7.04% for the highest 60%
income group.
The disparity, however, becomes evident in the secondary level. Only 67.1% of families in
lowest 40% income bracket have children enrolled in high school while the richer 60%
families account for 83%. Driven by poverty, these poor families would rather have their
children work to augment family income. Based on the 1999 APIS, 18.7% of the families in
the lowest income bracket have working children aged 5-17 years old compared to only 8.7%
in the higher income bracket. However, there is modest improvement in 2000, which means
that both income groups were able to send more of their children to school for basic
education.
BASIC EDUCATION 9494
Also, it has been observed that the elementary drop out rate for the lowest quintile increases
through the grade levels. This particular group had a drop out rate of 1.70% in Grade 1,
increasing to 12.20% in Grade 6.
In terms of regional distribution, the ARMM had the lowest cohort survival rate of 47.49%
and the lowest completion rate of 42.91% in 2002 – 2003 despite having the highest
participation rate of 91.37%. ARMM’s cohort survival rate is way below the national level of
68.31%. Likewise, its completion rate is also way below the national level of 65.79%.
The provision of basic education services remains to be the responsibility of the national
government. Percent share of MOOE to department budget (11.24%) is still below
international standards. A World Bank and Asian Development Bank Study indicates that at
least 15% of budget should be devoted to MOOE.
This explains the deteriorating quality of basic education in the country. Furthermore, the
poor quality of teaching and lack of school initiative to raise standards add to the
deterioration. This sector, despite being allocated the second largest share of the national
budget, continues to be plagued by the same issues of lack of classrooms and textbooks and
poor quality of instructions that lead to poor achievement rates of students.
The following measures are recommended to address the deteriorating quality of basic
education in the country: ON LOW INTERNAL EFFICIENCY § Give the schools relative autonomy but with accountability. This will promote greater
efficiency and accountability in managing resources by letting the local school heads
perform administrative and instructional leadership functions critical in making their
schools cost-effective and cost-efficient.
BASIC EDUCATION 104104
§ Empower the Local School Boards to formulate alternative and innovative programs
that would take into consideration the causes of the poor state of basic education in
their local districts. The programs will not only help address the low performance but
also foster opportunities that would reduce incidence of poverty.
§ Equip public school principals and teachers with proper management skills to address
after school-level issues and problems
§ Widen the use of tested and cost-effective, non-conventional, or alternative learning
strategies and delivery systems.
§ Institute measures that would eliminate or decrease wastage and corruption to maximize
the use of funds.
§ Amend the Fair and Equitable Access to Education Act of 1994 (RA 7880) to allow for
the construction of school buildings by entities other than the Department of Public
Works and Highways. More importantly, change the formula in the allocation of fund,
i.e., increase from 20% to 70% the weight assigned to the classroom shortage criteria;
decrease from 50% to 20% the weight assigned to student population criteria.
§ Engage services of private sector and NGOs to build government funded school
projects at a lower cost. Allow existing building specifications to be modified as long as
structural integrity is not compromised.
§ Expand further the ESC under GASTPE. This may prove to be more economical than
to construct classrooms, which entails overhead and maintaining expenses.
§ Improve system of monitoring and evaluation at all levels by formulating sets of
indicators and a relevant timely database.
ON INCOME AND REGIONAL DISPARITY
§ Undertake effective assessment of the reasons for low performance rates in specific
areas and provide intervention programs to address these issues. A good example of
an intervention program is school feeding. This program will help raise the
participation and cohort survival rates as well as the student achievement rates.
CONGRESSIONAL PLANNING AND BUDGET DEPARTMENT 105105
§ Employ alternative learning systems to reach children in remote or conflict-affected
areas. Engaging the cooperation of Local Government Units (LGUs) and Non-
Government Organizations (NGOs) in those areas is vital in order to provide
continuous learning opportunities.
ON ACHIEVEMENT LEVELS
§ Internship program in public schools should be made a requirement in teacher
education programs.
§ Policy reforms such as amending the Localization Law to enable transfer of teachers
and removal of mandatory election duties to devote more time to teaching.
§ Tap the Special Education Fund (SEF), representing 1% of the LGU’s Internal Revenue
Allotment (IRA), and the private sector to fund textbooks and other school
requirements. Hence, there is a need to fast track passage of the bill increasing the share
of SEF from the IRA. More funds would be able to address more of the concerns. In
addition, support initiatives towards improving textbook development, publishing and
printing capacities of the private sector and other devices to make teaching-learning
experience more meaningful to both teachers and students.
§ Continue the implementation of the optional high school bridge program. This will
enhance the readiness of elementary school graduates for secondary education.
Chapter
RATIONALIZING PUBLIC HIGHER EDUCATION
While higher education is generally a high priority in stimulating economic development, public investment to sustain expansion of higher education systems has remained limited. But as the demand for higher education grows due to increasing tertiary enrollees, even more resources will be necessary to improve the quality and access of public higher education. Government needs to respond to this situation by increasing efficiency in the system—by giving education institutions greater autonomy and responsibility, and making them more accountable to certain performance standards.
INCREASING DEMAND FOR HIGHER EDUCATION
The face of development is changing as knowledge replaces physical capital and labor as
major input to production. Technology is driving much of this process with information
technology and other innovations leading to remarkable changes in the way our economies
work.
As knowledge becomes important, so does higher education. Countries need to educate
more of their young people to a high standard—a degree is now a necessary requirement for
many skilled jobs. The quality of knowledge produced by the higher education institutions
and its availability to the college-age population, has become the cornerstone for national
competitiveness.
This poses a serious challenge to our higher education system and its ability to respond to the
enormous opportunities as well as threats that the knowledge revolution offers. Clearly, the
pressure for expanding education opportunities is building up—participation and completion
rates in the primary and secondary education has been increasing steadily due to population
99
HIGHER EDUCATION 108108
growth, and the recognition of positive gains to be realized from progressing to and
completing secondary-and tertiary-program levels.
However, the country faces constraints in meeting the cost of expanding higher levels of
educational opportunities. Expanding education systems would imply a corresponding
increase in resources, but the government is increasingly unable to cope with the rising costs.
This underscores the policies that should allow for greater efficiency in the system while
maintaining quality and equity in the access to higher education.
Equally important is the need to recognize that public and private provision of higher
education can be complementary and that both can work together towards the same end. It
is essential that the competition private institutions bring should create greater diversity and
choice for students, as well as serve a powerful incentive for public universities to innovate
and modernize. It is unfortunate that the current trend in Philippine higher education has not
been supportive to these desired outcomes. Instead, the unhealthy competition brought by
the unfettered proliferation of SUCs may worsen the declining quality of higher education.
HIGHER EDUCATION OUTCOMES
Based on international statistics1, the provision of higher education in the Philippines is
relatively much better than most countries in Asia. In 1995, the country’s gross enrollment
ratio2 in the tertiary level (at 30%) was higher than that of Malaysia or Thailand at 11% and
20%, respectively (see Figure 9.1). The country was even ranked 24th worldwide on proportion
of higher education enrollment to the general population (2,981 students per 100,000
population in 1995). It is also important to note that the country’s attainment rates3 for the
population over age 25 in 1995 was considerably high at 23%—the average for East Asia and
the Pacific was only at 3%. The transition rate from completion of high school to vocational
or higher education was also significant at 89.3% in 2001 (CHED Statistical Bulletin, 2004),
so that most of the students who finish high school get to enter a college or university.
1 “Higher Education in Developing Countries” published by the Task Force on Higher Education and Society of
the World Bank, 2000. 2 Gross enrollment ratio is defined as the total enrollment at a given educational level, regardless of age, divided
by the population of the age group that typically corresponds to that level of education. 3 These rates measure the highest level of education in which individuals were enrolled. The data reflect the
attainment rates for the population that is over age 25. Attainment rates do not imply that all students completed this level of education.
CONGRESSIONAL PLANNING AND BUDGET DEPARTMENT 109109
FIGURE 9.1 GROSS ENROLLMENT RATIO
IN TERTIARY LEVEL (SELECTED COUNTRIES)
0102030405060
In P
erce
ntIndonesia Malaysia Singapore
1985 1995
Source: World Bank, 2000
It is therefore surprising that in spite of these positive features, the higher education system,
in particular with public institutions, is beset with persistent problems of equity in access, as
well as deteriorating quality.
Proliferation of State Universities and Colleges. The total number of higher education
institutions (HEIs) in the Philippines has reached 1,787 (with satellites) in 2004. About 1,363
(or 76.3%) are private while 424 (or 23.7%) are public-run institutions. The bulk of the
public higher education system is composed of state universities and colleges (SUCs) that
accounts for 85%.4 As of academic year (AY) 2003-2004, there are 360 SUCs—111 main and
249 satellite campuses in the country. Since 1990 the number of SUCs has considerably
increased by as much as 160% (see Figure 9.2).
It has been observed that the creation/conversion of SUCs which has been the legislative
mandate of the Philippine Congress, is a highly politicized activity. Hence, one of unintended
consequences of this political exercise is the proliferation of substandard HEIs and the
conversion of overgrown high schools into state colleges as well as conversion of state
colleges into universities. This unfettered proliferation of public institutions is problematic
for several reasons. First, as public funds available for higher education get scarce, creating
more SUCs further dissipates available resources. In 2004, SUCs accounted for 13.71% of
the national education budget, down from over 15% in 1999. In contrast, the number of
SUCs has expanded by 64% from 219 in 1999 to 360 in 2004. As a result, the share of each
SUC decreases not only because the total budget for the sector has decreased, but also
because of the growing number of SUCs that have to be financed.
4 CHED-supervised institution (CSIs) and local universities and colleges (46) are also part of the public higher
education system. In 1998, originally there were 102 CSIs. As of 2003, there are only two CSIs remaining; the rest were integrated as a campus of the nearest SUC in their respective region. There are about 46 local colleges and universities (LCUs) that are operated, supported and maintained by local government units. These institutions are established by virtue of an ordinance passed by their respective local government units.
HIGHER EDUCATION 110110
FIGURE 9.2 NUMBER OF SUCS
(MAIN AND SATELLITE CAMPUSES)
050
100150200250300350400
1991
1992
1993
1994
1995
1996
1997
1998
1999
2000
2001
2002
2003
2004
Main Satellite Campus
Source: CHED Statistical Bulletin
Second, the public institutions crowd out the private institutions. In many cases, the SUCs
are located in the same geographic region where there is already a high density of private
institutions (Bernardo, 2003). Take for instance, regional distribution of higher education
institutions. Among the regions, Regions IVA and V ranked second and fourth in terms of
the number of private HEIs yet both also account for 20% of all state universities and
colleges in the country. The distribution of public institutions does not seem to address the
areas or regions that are being neglected by the private sector.
FIGURE 9.3 ENROLLMENT DISTRIBUTION
OF HIGHER EDUCATION, 1991-2005
0%
20%
40%
60%
80%
100%
1991
1992
1993
1994
1995
1996
1997
1998
1999
2000
2001
2002
2003
2004
2005
% Private % Public
Source: Basic data from CHED
Moreover, as the tuition and fees of the SUCs are much cheaper than most private
institutions, the former end up crowding out the latter. In fact, the share of public HEIs to
total enrollment has doubled from 19% in 1991 to 36% in 2005 (see Figure 9.3). And as the
number of enrollees in SUCs continues to grow due to increasing number of graduates in the
CONGRESSIONAL PLANNING AND BUDGET DEPARTMENT 111111
secondary level, more public resources will be needed to ensure that access and quality of
higher education are sustain.
Third, proliferation results in an increasing number of SUCs that are very small by
international standards. An international multi-faculty university typically enrolls 10,000 or
more students. As of AY 2003-2004, there are some 46 (or 43%) of SUCs that have enrolled
fewer than 4,000 students. Moreover, only 25 of 111 institutions were able to meet the
criterion.
Inequitable Access to Public Institutions. Typically, SUCs should cater to the poorer or
underprivileged students. But, more often than not, they fail to get accepted. Because of
almost free tuition, SUCs have to ration admissions. Entry is usually based on merit rather
than need. Thus, students from poor families are less likely to succeed in merit-based
selection processes than students from less poor families who have attended better secondary
schools, and have an extra year of prior schooling before entry to higher education. It has
been shown that of the total HEI enrollees, only 24% belong to the poor income groups
(Preddey and Nuqui, 2001) (see Table 9.1).
TABLE 9.1
EDUCATIONAL ATTAINMENT BY GENDER/INCOME (2000) IN PERCENT
Male Female PARTICULARS
Poor Non-Poor Poor Non-Poor Total
Elementary 85 92 87 92 88
Secondary 46 71 62 78 64
Higher 9 26 15 33 24
Source: Preddey and Nuqui, 2001
Tuition fees set by SUCs are generally low by international standards. Public HEIs in South
and East Asia set tuition fees that meet 20% to 30% of recurrent cost (Preddey and Nuqui,
2001). On other hand, SUC revenues (mostly from tuition fees) averaged only 10% of
recurrent cost (PS+MOOE) in the national budget from 2001 to 2005. This situation may
actually increase inequity by providing almost ‘free’ education to students from relatively well-
off families and denying access to students from poor families.
HIGHER EDUCATION 112112
Low Internal Efficiency. An indicator of low efficiency of the higher education system is
the average graduation rate of 49%. Between 1996 and 2001, out of every 100 who enter first
year in college, about half of them were able to finish their course within the prescribed
duration. This implies that half of these students either dropped out altogether or finished
their course over the prescribed duration.
On other hand, there has been no marked improvement in the participation rates for the past
8 years. From 1996 to 2004, the participation rate—which stands at 21% in 2004—grew by
only 1.4%. At this rate of progress, it may be difficult to meet the medium-term target of
increasing the participation rate of college-age population (from 16-21 years) to 27.2%.5
FIGURE 9.4 PERFORMANCE INDICATOR IN HIGHER EDUCATION
The most frequently used indicator of quality is the performance in licensure examinations in
the various disciplines and professions. While the number of graduates in both private and
public institutions has grown by as much as 30% between 1995 and 2003, the overall passing
rates for the past nine years have barely changed from 41.6% in 1995 to 41.7% in 2003.
The programs/disciplines that enjoy high levels of enrollment are unfortunately also those
where the students perform badly in the licensure examinations. For example, the disciplines
on engineering, education and teacher training and business administration and related
programs already accounts for more than half of total enrollment yet average passing rate
(1995-2003) in accountancy is only 18%, for teacher education at 32% and civil and electrical
engineering at 35%. It should be noted that there is wide variation in performance among the
various higher education institutions. Some elite institutions have consistently high
percentage of board passers. On the other hand, there are 293 institutions that have zero
passing rates from 1993 to 1997 (Bernardo, 2003). 5 Philippine Education Sector Roadmap, CHED
CONGRESSIONAL PLANNING AND BUDGET DEPARTMENT 113113
Dependence on Government Subsidy. SUCs depend mostly on government support for
their operations. On the average, about two-thirds of SUCs financing are sourced from the
national budget. Since these institutions vary in size, this subsidy for some SUCs accounts for
90-95% of total financing. Over the last five years, the share of national government in SUCs
financing has been declining from 85% in 2001 to 77% in 2005. Hence, the diminishing
support from the government poses a huge challenge to public institutions to be more
efficient in their service delivery.
As cited earlier, the levels of tuition and fees in the SUCs are generally low as compared to the
tuition levels in South and East Asia that are able to meet 20% to 30% recurrent costs.
However, it must be noted that SUC revenues, in particular from tuition fees, have been
steadily increasing for the past five years. From P1.2 billion in 2002, revenues from tuition
jumped to P2.31 billion in 2005. Nonetheless, the 2005 figure represents only 14% of the
P16.6 billion of current operating expenditure (COE or PS+MOOE) from the national
budget. It must be noted that the comparison is being made with COE (which excludes CO)
instead of total appropriations because COE represents the ‘recurrent’ portion of SUC
appropriations.
Out of the 111 SUCs with income data, only 36 institutions have total incomes representing
20% or higher of their COE from the GAA. A total of 61 institutions have incomes
equivalent to 15% or below of their COE.
FIGURE 9.5 RECEIPTS OF SUCS , 2001–2005
Source: 2006 BESF (DBM)
PUBLIC FINANCING OF SUCS
For fiscal year 2006, national government allocation to education at all levels will be P138.27
billion that is 5.28% higher than this year’s level. Of this amount, P16.67 billion will be
0
5
10
15
20
25
2001 2002 2003 2004 2005 2006
In B
illio
n
NG SUC revenues
HIGHER EDUCATION 114114
obligated to the SUCs that accounts for 12% of the total sectoral budget. From a high
growth of 10.5% in 2002, nominal budget for SUCs has been registering negative growth
rates in 2005 at –3.85% and 2006 at –1.2%. Likewise, percentage share of higher education
budget has been declining from 13.9% in 2004 to 12.1% in 2006. This may reflect discrete
efforts by the Department of Budget and Management (DBM) to rationalize allocation using
performance as indicator, in contrast to earlier practices of determining SUC budget
allocations based on increments to past budgets (World Bank, 2004).
Putting together the estimated enrollment data from AY 2005-2006 and GAA COE figures
from 2006 reveals that the average COE per students is about P18,080. This is the recurring
appropriation granted by the national government per student. In real terms (based on 2000
prices), SUC spending per student has considerably declined from P17,000 in 2004 to
P12,930 in 2006 or a 23% decline for the said period. It is important to note that within the
system, there is a wide disparity in COE per student, as well as wide disparity in enrollment
profiles and quality among SUCs.
FIGURE 9.6 SUCS NOMINAL BUDGET
AND GROWTH RATES: 2002-2006
Source: 2005 & 2006 BESF (DBM)
By object of expenditures, personal services (PS) will receive the bulk of next year’s SUC
allocation at 86% (or P14.3 billion). However, there is noticeable slowdown in the growth of
PS allocations from 8% in 2004 to 0.07% in 2006. Between 2001 and 2005, the MOOE
budgets of the SUCs from the national budget increased by almost 6% from P2.1 billion to
2.2 billion. Comparing year-on-year increases, there have been modest increases in 2001-2002
(3.8%) and 2003-2004 (22.2%). However, this was followed by a reduction in 2004-2005 by
as much as 11%.
15
15
16
16
17
17
18
18
2002 2003 2004 2005 2006
In B
illio
n
-6-4-202468101214
In P
erce
nt
nominal budget (in bil) Growth rates
CONGRESSIONAL PLANNING AND BUDGET DEPARTMENT 115115
In terms of sources of financing, more than 90% of spending in personal services of SUCs
come from the national budget while the balance is culled from SUC internal revenues. The
SUCs, however, have increased its counterpart spending in their PS from 4%in 2001 to 10%
in 2006. This is quite different in the case of MOOE and CO of SUCs. For the same period,
the SUCs accounted for more than half of their MOOE and CO budget. This positive trend
has been observed since the SUCs were allowed in 1998 to retain all their income and trust
funds. Moreover, these institutions can immediately use these funds and they do not have to
be spent within the year. Typically, SUC income and trust funds are used to supplement
MOOE and CO outlays, including equipment purchase.
During budget implementation, PS appropriations (especially for permanent positions) are
usually exempted from reductions when budget reserves have to be imposed but not MOOE
and CO. Hence, it is imperative for SUCs to consider setting realistic tuition fees that will
help them finance their operations, otherwise they will have to contend to dwindling
government subsidy that is subject to policy changes.
CONCLUSION AND RECOMMENDATIONS
The public higher education system continues to be hounded by problems related to low
quality of programs offered, crowding out of private provision, dwindling budgetary support
and institutional inefficiencies. All these point out to the urgency to rationalize the public
higher education system
The move to rationalize the system should be anchored on the need for a more efficient,
equitable and strategic use of limited public funding for higher education with the expectation
that private institutions can the carry the main burden of meeting increasing student demands.
It should be emphasized that government invest in higher education to: ensure access for the
poor, offer programs/courses that are not better serve by private institutions, and provide
regional access not serviced by the private sector.
Specifically, key policy measures are proposed that will help rationalize the system in terms
of—program, location, student cost, governance and budgetary support. Given these
measures, it is expected that there will be a natural reduction in the number of public higher
education institutions.
HIGHER EDUCATION 116116
ON PROGRAM
• CHED should continue to phase out programs that consistently perform below the
national passing average for three years in the various licensure examinations, or that
do not meet DBM’s breakeven point in terms of enrollment.
• For program offerings by SUCs that are not accredited or do not meet the policies,
standards and guidelines of CHED, it is proposed that public subsidy and other forms
of government support be reduced or discontinued.
• Extension programs and services should facilitate the transfer of technology, foster
leadership and promote self-reliance among the less privileged and share SUC
resources with the community, e.g. capability building activities and management
consultancy.
ON LOCATION
• As an incentive for SUCs for pursuing rationalization, they should be allowed to
retain savings arising from the closure of satellite campuses and the discontinuation of
degree programs and to use these savings for recurring expenditures such as personal
services.
ON STUDENT ACCESS AND COST
• Ensuring greater accessibility through student assistance in the form of student loans.
Government financial institutions will be tapped to provide them with soft loans
through the schools.
• Advocating greater contributions by students and their families to the costs of their
own higher education since many of its benefits accrue to private individuals.
ON GOVERNANCE
• CHED should come put with tighter standards, rules and regulations for the creation
of state universities or the elevation of state colleges to state universities. Likewise,
the Commission should come out with a more rational classification or typology of
HEIs using internally accepted standards. Such new classification should be able to
correct defective nomenclature, particularly those which have been converted to
“Universities”.
CONGRESSIONAL PLANNING AND BUDGET DEPARTMENT 117117
ON GOVERNMENT BUDGETARY SUPPORT
• The present budgetary process or input financing—in which allocations are based on
historical data (past budget allocations)is perceived to be inefficient and inequitable
because it does not consider actual performance of public institutions such as quality
of programs and passing rates in board exams. In this case, implementing normative
or output-based budgeting to enable redistributing financial resources from less
efficient to more efficient SUCs should be adopted.
Normative financing is a scheme of granting public subsidy that is based on a clear
criteria on what outputs public institutions are trying to produce. In brief, SUCs are
financed for their contribution (through their financed outputs) to Philippine higher
education, not according to their negotiating skill or access to political base. With
normative financing, budget allocations will be predictable and will allow for sensible
and financial planning to take place. Given this efficiency in the system, government
can achieve less dependence by the SUCs on the public subsidy for higher education.
Chapter
EFFECTING FURTHER HEALTH GAINS
The Medium-Term Philippine Development Plan (MTPDP) 2004-2010 aims to make health care delivery responsive to the needs of the population, especially the poor. Meeting this goal, however, may prove difficult given the country’s high population growth, which puts more pressure on already tight government fiscal position. Unless the government makes major decision shifts on population policy, improves revenue mobilization and effectively targets its health spending to the most vulnerable sectors, there is no guarantee of the health objectives coming to fruition. This paper analyses budgetary implications of health and population trends and recommends measures to achieve health goals.
HEALTH STATUS AND TRENDS The health of Filipinos has improved significantly over the past years, as evidenced by the key
health indicators. Infant and child mortality rates have declined, and so did the maternal
mortality rate. Morbidity rates caused by leading diseases have also shown encouraging
improvements, albeit minimally. All these and other equally important factors resulted in
longer life expectancy for most Filipinos. Most of the health indicators, however, still pale vis-
à-vis select Asian countries and the Millennium Development Goals (MDG) on health.
Infant and Under-five Mortality Rates. Infant mortality rate (IMR) has declined from 34
in 1993 to 29 per 1,000 live births in 2003. Under-five mortality rate (U5MR) also fell from 54
to 40 per 1,000 live births during the same period. Childhood mortality rates, however, would
have been lesser where it not for the repeated decline in the rates of immunization and
vaccination. The Maternal and Child Health Survey revealed a three-percentage point decline
in immunization rate from 65% in 2000 to 62% in 2002—the target immunization rate is 90%
1010
HEALTH 120120
to achieve “herd immunity” for children against diseases like measles (Herrin, 2004). The 2003
National Demographic and Health Survey also indicated that almost 3 in 10 children age 12-
23 months have not received the recommended vaccinations. From around 73% in 1993 and
1998, full vaccination has declined to 70% in 2003.
Data shows the decreasing trend in the number of immunized children was due to: 1)
inadequate outreach particularly in hard-to-reach areas; and 2) shortages in vaccines in 2000-
2001 due to untimely deliveries caused by changes in the procurement system. Across the
region, the Philippines had the highest U5MR (40) while Singapore had the lowest (3).
Malaysia and Vietnam had an U5MR of 7 and 23 respectively (see Figure 10.1). This suggests
very strongly that the Philippines has a lot of catching up to do in paring down childhood
mortality rates, thus necessitating for, among others, sustained and well-targeted
vaccination/immunization efforts.
FIGURE 10.1
U5MR FOR SELECTED ASIAN COUNTRIES, 2003 40
37
2623
73
0
10
20
30
40
U5M
R P
er 1
000
Live
Birt
hs
Philippines China Thailand Viet Nam Malaysia Singapore
Source: Human Development Report 2005 except for Philippine U5MR, which was taken from the 2003 NDHS
Maternal Mortality Rate. From 209 per 100,000 live births in 1990, maternal mortality
rate was down to 172 in 1998. Since then however, no substantial reduction of maternal
mortality rate has taken place. Not surprisingly, the Human Development Report (UNDP,
2005) showed that from 1985-2003 the Philippines had the highest maternal deaths,
surpassing Vietnam by nearly double and Malaysia and China by more than triple (see Figure
10.2). Thus, a joint ADB-UNDP assessment report titled Tracking the Millennium
Development Goals in Asia and the Pacific (2005) rated the country “slow” on maternal
mortality. This suggests that, while the country is expected to hit the target (MDG target by
2015 of 52.2 per 100,000 maternal mortality rate), this can happen only after 2015.
CONGRESSIONAL PLANNING AND BUDGET DEPARTMENT 112121
FIGURE 10.2 MATERNAL MORTALITY RATIO
PER 100,000 LIVE BIRTHS, (1985-2003)
170
95
50 5036
6
0
20
40
60
80
100
120
140
160
180
P hi l ippines V i e t Nam M alaysia C hina Tha i l and S ingapore
Source: Human Development Report, UNDP 2005
Morbidity Rates Due to Diseases. Deaths caused by the leading diseases have also
exhibited declining trend in the past decade, except for pneumonia that grew 54% (see Table
10.1). Pneumonia has claimed the most number of lives in 2002 (924 per 100,000 population)
followed by diarrhea (914). Diarrhea, which remained fatal today among small children, was
the number one killer disease 10 years ago. Malaria, too, is a cause for alarm as it is endemic in
65 provinces. Cases of malaria is high in Mindanao (53%), followed by Luzon (46%) and
Visayas (1%).
Ratio of Physicians to Population. The country may be fairly endowed with doctors,
outranking Thailand, Malaysia and Viet Nam in physicians to population ratio (see Figure 10.3).
This proportion, however, may likely decline as the exodus of health workers continue
unabated. Data from the POEA revealed that approximately 55,000 nurses had already left
the country from 1995 to 2002. A UP study also showed that 90% of nursing alumni of the
UP College of Nursing and 65% of doctors from the UP College of Medicine are working
outside the country. This indicates the forthcoming shortage of health personnel in the
country, thus compromising the capacity of health care system. Testimony to this is the recent
warning of the Alliance of Health Workers that the Philippine health care system will collapse
within the next two to three years as dismal working conditions and low wages continue to
drive local doctors and nurses abroad.
HEALTH 122122
TABLE 10.1 SEVEN LEADING CAUSES OF MORBIDITY
Rates per 100,000 Population Causes of Morbidity 1992 2002
Growth Rate (%)
Diarrhea 1,561 914 (41.45)
Bronchitis 1,150 792 (31.13)
Pneumonia 599 924 54.26
Influenza 762 609 (20.08)
Tuberculosis, all forms 205 144 (29.76)
Malaria 70 50 (28.57)
Diseases of the Heart 109 66 (39.45)
Source: 2003 PNHA
A study shows that migration of skilled and educated individuals, such as physicians and
nurses, from one nation to another is as much a response to the lack of opportunity in their
home country as it is to the availability of opportunity and the deliberate and selective
promotion of immigration in another (Sarabia, 2004). In yet another study analyzing why
health workers migrate, “the continuing disparities in working conditions and pay between
richer and poorer countries offer a great deal of “pull” towards more developed countries”
(Stilwel, 2004).
FIGURE 10.3 PHYSICIANS PER 100,000 PEOPLE
SELECTED ASIAN COUNTRIES, 1990-2004
164
140
116
7053
30
0
50
100
150
200
China Singapore Philippines Malaysia Viet Nam Thailand
Source: Human Development Report, UNDP 2005
Life Expectancy. Life expectancy at birth (in years) for males rose from 62 in 1990 to 67.2
in 2003. For females, it rose from 67.5 to 72.5 during the same period (see Figure 10.4). Filipino
female had higher life expectancy than some Asian women. Malaysian and Chinese male, on
the other hand, had longer life expectancy than other men in the region (see Table 10.2).
CONGRESSIONAL PLANNING AND BUDGET DEPARTMENT 123123
FIGURE 10.4 PHILIPPINE LIFE EXPECTANCY AT BIRTH (IN YEARS)
64.866.3 67.2
62.2
67.570.1 71.6
72.5
55
60
65
70
75
1990 1995 2000 2003
Life
Exp
ecta
ncy
at B
irth
(in y
ears
)
Male Female
Source: NSCB, 2003
FACTORS BEHIND POOR HEALTH INDICATORS
While there may be a host of other factors, the country’s high population growth and the
relatively low health expenditure are just too revealing and strong to account for the poor
health performance of the country.
Population Growth Rate. The country ranks among Asian nations with high population
growth rate. From 2.9% in 1970, the country’s annual average growth rate declined to 2.3% in
2000. But other countries such as Thailand, Vietnam, Indonesia and China had a much faster
growth rate decline during the said period (see Figure 10.5).
TABLE 10.2
LIFE EXPECTANCY AT BIRTH (IN YEARS) FOR SELECTED ASIAN COUNTRIES, 2003
Country Male Female
China 69.0 73.0
Indonesia 65.0 69.0
Malaysia 71.0 76.0
Philippines 67.2 72.4
Thailand 68.0 75.0
Viet Nam 67.0 72.0
Source: www.UNESCAP.org./stat/data 2004
HEALTH 124124
FIGURE 10.5 AVERAGE ANNUAL POPULATION GROWTH RATE
FOR SELECTED ASIAN COUNTRIES (1970-2000)
2.9
3.0
2.3
2.4 2.
8
2.6
2.2
2.1
2.1
1.3
2.3
1.8 2.
2
1.8
1.5
2.3
0.8 1.
3
1.3
0.7
0
1
2
3
4
Philippines Thailand Vietnam Indonesia China
1970 1980 1990 2000
Source: WDI database
Fertility Rate. The country’s high population growth rate stems in part to high fertility level.
Filipino women of childbearing age have an average of 3.5 children, the highest fertility level
in the region (see Figure 10.6). The 2003 National Demographic and Health Survey noted that
if Filipino women had achieved their average desired fertility rate of 2.5 children, there would
have been half a million births fewer in 2003 alone. This could have saved the government
million of pesos in terms of immunization shots and micronutrients supplementation.
FIGURE 10.6 TOTAL FERTILITY RATES
SELECTED ASIAN COUNTRIES
1.4
1.7
1.8
2.6
2.9
3.5
1.9
0 1 2 3 4No. of Children per Woman of Childbearing Age
Philippines (2003)
Malaysia (2004)
Indonesia (2002-03)
Viet Nam (2002)
China (2004)
Thailand (2004)
Singapore (2004)
Source: Philippines 2003 National Demographic and Health Survey
The high population growth rate and high fertility rate posed critical challenge to both the
working population and the government. This is on the observation that a country with high
birth rates will have a relatively young population and a high age-dependency ratio1. A higher
proportion of dependents is likely to experience slower economic development due to the
1 Defined as the proportion of the dependent ages (below 15 years and above 64 years) to the working-age population (15-64 years).
CONGRESSIONAL PLANNING AND BUDGET DEPARTMENT 125125
drag on resources to provide for these age groups (Balisacan, 2004). In other words, the larger
the dependency ratio, the greater the responsibility of the working-age population to provide
for those who are dependent. In times, however, of high unemployment and
underemployment rates and rising private health care costs, the government may be
compelled to assume greater responsibility in providing the public basic social services like
health.
AGE STRUCTURE AND DEPENDENCY RATIO
In 2000, there were 31.2 million dependent age Filipinos (below 15 years and above 64 years)
and 45.3 million working age (15-64 years), thus a dependency ratio of 69.0. This means there
were nearly 70 dependents for every 100 working age people. From 2005 to 2010, the
dependency will gradually decline to 57 (see Table 10.3). The number of Filipino dependents,
however, will increase 5.14% or an increment of more than 1.7 million. This corresponds to
342,000 people annually for the next five years that have to be provided health care by the
government and private sector.
Cost Implications of Additional Dependents. Assuming the national government targets
basic health care provision to poorest 30% only of this additional dependents (numbering
102,600) and allots the same per capita health expenditure in 2003 (amounting to P277.5 in
nominal terms), this is an up front P28.5 million a year from 2006 to 2010 or an aggregate of
P142 million. However, it is not only the new dependent age groups that will pull funds from
the government purse but all age groups of the population that will build up through time.
There have been significant improvements on the health status of Filipinos as evidenced by
the increasing life expectancy and declining child/maternal mortality and morbidity rates.
However, there were pockets of inefficiencies such as the repeated decline in child
vaccination and immunization, unmet family planning needs and poor monitoring of maternal
mortality (such that the latest figure available was in 1998). The migration of doctors and
nurses for greener pasture also typifies government inadequacy to improve the lot of public
health workers. All these are but partly outcomes of high population growth and continuing
budget deficit facing the government. The following imperatives have to be considered
therefore to effect further health gains:
§ Pursue a stronger population management program or variants that will slow down high
population growth. The high population growth rate that now prevails indeed makes the
task of poverty reduction more difficult and the financial cost of poverty alleviation more
restrictive.
§ Pursue training/skills upgrading programs for all government health workers to prevent
the future collapse of health care system due to shortage of health personnel. Relatedly,
the government will have to strictly monitor and upgrade quality of medical and allied
education in the country to increase availability of skilled and licensed health workers.
§ Pass a reproductive health care act that will address unmet family planning needs.
Passage of this bill is crucial to achieving many of the MDG on health particularly those
that relate to child and maternal welfare.
HEALTH 140140
§ Strengthen DOH capacity to adequately and sustainably implement vital public health
interventions such as Safe Motherhood Program, Expanded Program on
Immunization, Micronutrients Supplementation for children and pregnant/lactating
mother, and dengue, malaria and tuberculosis control programs.
§ Pass a bill ensuring that a minimum standard of health service is met at the LGU
level. Such bill should also indicate accountability of local chief executives and local
health boards on health services. This measure will somehow ascertain the localization
of MTPDP-MDG goals on health.
§ Pass a bill granting autonomy to government hospitals to collect user fees and
earmark the same for their MOOEs. This measure will ease burden on the NG to
allocate budget for health.
Chapter
TOWARDS AN INCREASED SHELTER SUPPLY AND EFFICIENT SUBSIDY MECHANISM
A relatively high unmet housing need continues to be observed in the country’s housing sector While this could be partly an indication of limited budget for housing, this is also an outcome of policy and institutional weaknesses. This chapter discusses in brief the NG budget as well as policy and institutional arrangements relating to housing.
HOUSING NEED
The Housing and Urban Development Coordinating Council (HUDCC) estimates the
country’s housing need at 3.75 million units for the period 2005-2010 (see Table 11.1). This
need consists of 1.17 million units in total housing backlog plus some 2.58 million units to
accommodate formation of new households due to population increase. These figures are
slightly higher than the 3.36 million units housing need estimated during the preceding plan
period 1999-2004, where 1.14 million units in total housing backlog and 2.22 million units for
new households were recorded. More than the statistical difference, the two shelter plan
periods reveal that housing backlog is persistently high, and so is the demand of new
households. Both the plan periods also indicate the difficulty of the government to meet the
need, much less the backlog. Indeed, historical performance of the government housing
institutions shows that they can only address some one-third or 30% to 40% of the country’s
housing need (Alonzo, 2004), thus leaving about two-thirds or 60% to 70% to the private
sector to fill. Recent performance of the Arroyo administration on housing typifies this
difficulty.
1111
HOUSING 142142
TABLE 11.1 HOUSING NEED, 2005-2010
(IN UNITS)
CATEGORY Total
Housing Backlog 1,170,800
Doubled-Up Housing 387,315
Replacement/Informal Settlers 588,853
Homeless 8,298
Substandard (Upgrading) 186,334
New Households 2,585,272
TOTAL 3,756,072
Source: HUDCC
SIGNIFICANT SUPPLY BUT SHORT STILL OF DEMAND
During the shelter plan period 2001-2004, the Arroyo administration targeted to provide
shelter security1 to 1.2 million households. Of this target, the housing sector (which includes
such active industry players as Pag-IBIG, GSIS and SSS) provided some 882,823 shelter
security units or an accomplishment rate of 74% (see Table 11.2). Of this total output, some
493,496 units or 56% went to socialized housing where 44% (219,268 units) benefited the
informal sector or nonmembers of the Pag-IBIG, GSIS and SSS. During the same period, the
informal dwellers also benefited from the government-private sector program for slum-
dwellers where total production of shelter security units reached 382,285 (see Table 11.3). This
provision plus the other 219,268 units that went to the informal sector would total to 601,553
shelter security units. This amounts to a modest 53% response rate to the total housing
backlog registered then (1.14 million units).
TABLE 11.2 HOUSING TARGETS AND ACCOMPLISHMENTS
(2001-2004) Target
Households Actual Accomplishments
HOUSING PACKAGE
2001-2004 2001 2002 2003 2004* 2001-2004
Socialized (below P225,000)
880,000 207,940 118,987 84,716 81,853 493,496
Low Cost (P225,000-P2M)
320,000 54,447 74,306 114,507 146,067 389,327
TOTAL 1,200,000 262,387 193,293 199,223 227,920 882,823
*Figures as of June 2004 Source: HUDCC
1 defined as a lot, house or house and lot package.
CONGRESSIONAL PLANNING AND BUDGET DEPARTMENT 143143
TABLE 11.3 PROGRAM FOR SLUM DWELLERS
No. of Household Beneficiaries PROGRAM 2001 2002 2003 TOTAL
HUDCC Asset Reform Program 133,900 68,820 1,000 203,720
NHA Housing Programs 47,771 25,356 15,205 88,332
NHMFC Community Mortgage Program 28,474 19,529 11,453 59,456
National Government Center East-West Project 8,739 2,049 410 11,198
North and South Rail Relocation - 7,350 3,250 10,600
Gawad Kalinga (GK 777) 1,000 1,032 2,963 4,995
Habitat for Humanity 1,878 1,087 1,019 3,984
TOTAL 221,762 125,223 35,300 382,285
Source: MTPDP 2004-2010
NG BUDGET FOR HOUSING The national government (NG) allocation for housing and community development for the
period 2002-2006 exhibits a generally increasing trend (see Table 11.4). From P800 million in
2002, budgetary support to housing went up by 275% to P3.0 billion in 2003. However, the
year that followed saw housing budget cut by nearly half (the reason could have been that
funds were channeled to other priority social service sectors such as land distribution, social
welfare and health that saw budget climbed by 722%, 15% and 17% respectively). By 2005,
budget for housing rose by 6% and by a hefty 65% under the 2006 proposal.
Aside from direct spending on housing, the NG also provides funding assistance to the
housing sector through internal revenue allotment (IRA) to LGUs and subsidies to
beneficiaries and developer-participants of the government’s housing programs. Among city
LGUs for instance, actual expenditure on housing went up from 2.9% of total expenditure
prior to 1992 to about 7% after 1992. According to Ballesteros (PIDS, 2002) the amount
comes primarily from IRA and grants. Ballesteros also noted that the government has
probably spent substantially more on housing subsidies than on any other welfare program in
the country. As a case in point, public retail mortgages exposure in the Philippines, including
developer guaranty amount to about 4.5% of GDP for the period 1994-1999.2
2 As cited by Ballesteros from Duebel A (2000), “Separating Homeownership Subsidies from Finance: Traditional Mortgage Market Policies, Recent Reform Experiences and Lessons for Subsidy Reform”, The World Bank.
HOUSING 144144
TABLE 11.4 NATIONAL GOVERNMENT ALLOCATION
TO HOUSING AND COMMUNITY DEVELOPMENT
Year Amount (Billion pesos)
Growth (%)
2002 0.8 (55.56) 2003 3.0 275.00
2004 1.6 (46.67)
2005 1.7 6.25
2006 2.8 64.71
Source: BESF 2000-2006
The NG budget for housing are spread to various agencies (see Table 11.5) from the
HUDCC that ensures accomplishment of the National Shelter Program to four other key
shelter agencies (KSAs) that have direct role in shelter production. These KSAs are the
Home Guaranty Corporation (HGC) that mobilizes private sector funds, the National Home
Mortgage Finance Corporation (NHMFC) that serves a major role in community mortgage
financing, the National Housing Authority (NHA) that provides housing assistance to low
and marginal income groups, and the Housing and Land Use Regulatory Board (HLURB)
that functions as the regulatory body for housing and land development. Except for the
HUDCC that suffered 9.52% cutback on its 2006 budget compared from last year, all KSAs
either retained their previous years’ support or had minimal increase.
TABLE 11.5 TOTAL NG BUDGETARY SUPPORT
TO SHELTER AGENCIES (IN MILLION PESOS)
Year HUDCC HGC NHMFC NHA HLURB
2002 57 - 764 245 166
2003 50 1000 - 460 161
2004 84 1000 500 1000 157
2005 72 - 500 1000 164
2006 65 1000 500 1000 165
Source: BESF and NEP 2004-2006
Budgetary requirement for 2006 shelter target is higher though than what is allotted. Per
HUDCC costing, the NHMFC will require P761 million for its nearly 16,000 CMP-targeted
household beneficiaries (see Table 11.6). Unless the NHMFC pours in own funds, the 34% or
CONGRESSIONAL PLANNING AND BUDGET DEPARTMENT 145145
P261 million shortfall is certain to hurt target, thus preventing chances for 2,000 or so
informal household dwellers to own shelter security units. The same problem awaits
beneficiaries of NHA and HUDCC, which respectively have 72% (P2.5 billion) and 35%
(P35 million) fund deficiency. To meet their targets, these shelter agencies will either have to
utilize their existing funds, be resourceful to obtain grants from other sources or boost
collections from existing home lending programs.
TABLE 11.6 2006 COMPARATIVE RESOURCE REQUIREMENT
OF GOVERNMENT SHELTER PROGRAM Levels in Million
SHELTER AGENCIES Target
Household Values 2006
Proposed Budget
NHMFC-CMP 15,860 761 500
57,211 3,532 1,000
54,241 3,151 -
NHA Total
Socialized Housing
Economic Housing 2,970 381 -
58,692 100 65
35,000 30 -
HUDCC Total
Presidential Proclamation
Special Projects 23,692 70 - Source of basic data: HUDCC and DBM
The HGC receives equity infusion from the NG owing to Republic Act 8763 or the Home
Guaranty Corporation Act of 2000, which increases its authorized capital stock from P2.5
billion to P50 billion in a span of 50 years. The increase is directed toward strengthening its
credit guaranty capacity. The Corporation, however, had a record of fund misuse when it
illegally guaranteed and ended up shouldering P550 million worth of loans incurred by two
private corporations that built 21 high-class villas at Subic, purportedly for delegates of the
1996 APEC meeting.3
Likewise, the NHMFC had a record of poor fund management. In the 80s and 90s, the home
lending program it administered (Unified Home Lending Program or UHLP) suffered low
collection efficiency. Its collection rate in 1985 was about 60% and tumbled to 55% in 1996.
For this reason, the NHMFC was twice declared insolvent (first in 1985 and second in 1997).
The year 1996 also marked a dark period in the history of the NHMFC when the UHLP
funders (SSS, GSIS and Pag-IBIG) refused to contribute further to the UHLP, thus causing
their abandonment of the program. 3 Philippine Daily Inquirer, July 15, 1999.
HOUSING 146146
In mid-1997, the NHMFC owed these big three government financing institutions some P42
billion worth of uncollected loans from homebuyers. As of late 2004, the Corporation has
about P13 billion worth of bad loans (INS, 2004).
The NHMFC continues operating as collecting arm for the failed UHLP and as administrator
of Abot-Kaya Pabahay Fund (AKPF) and Community Mortgage Program (CMP), variants of
the government’s social housing programs. The administration of AKPF and CMP, however,
was already transferred to the Social Housing Finance Corporation (SHFC), a body corporate
created via Executive Order 272 issued on January 20, 2004. The EO states that the SHFC
shall be the lead government agency to undertake social housing programs that will cater to
the formal and informal sectors in the low-income bracket and shall take charge of
developing and administering social housing program schemes, particularly the CMP and the
AKPF Program. .
The creation of the SHFC was a recommendation of the HUDCC to the President. The
HUDCC saw the need for the NHMFC to devote full attention to its mandate to develop
and provide a secondary market for home mortgages granted by public and/or private home
financing institutions. Thus, it advised creation of the SHFC to handle the administration,
management and development of the CMP and the AKPF Program, as well as other social
housing functions of the NHMFC. POLICY AND INSTITUTIONAL ISSUES Rapid urbanization abetted by in-city migration and high population growth have indeed
contributed to the perennial housing shortage. Beyond these, however, are policy and
institutional factors that trigger the problem. Undeveloped Rental Market. Government housing programs mainly emphasize
homeownership. While most families would prefer homeownership, not all can afford it.
Other households are more mobile and prefer renting to ownership. The rental could thus
serve as a “staging area” for these families. However, the country has for many years pursued a
rent control policy, supposedly to encourage the development of affordable housing for the
lower income brackets). Up until this time, Congress has succeeded to extend such law (the
latest being RA 9161) through series of legal amendments.
Studies have shown that while rent control is meant to protect residents from undue price
increases, it harms far more citizens by driving out affordable housing and creating housing
shortages. Data gathered by Tucker (Cato, 1997) from 18 North American cities revealed that
CONGRESSIONAL PLANNING AND BUDGET DEPARTMENT 147147
in cities without rent control, the available housing units are almost evenly distributed above
and below the census median. In rent-controlled cities, most available units are priced well
above the median. In other words, inhabitant in cities without rent control have far easier time
finding moderately priced rental units than do inhabitants in rent-controlled cities. Likewise,
there can be no doubt that rent control produces housing scarcity. Vacancy rates in rent-
controlled cities have been below 7%. In cities without rent control, vacancy rates were above
15%.4
However, it is not only the citizens that bear the brunt of rent control but the government as
well. With rent control, its income from real property tax decline. In a referendum held in
selected places in the United States, property owners argued that the costs of rent control
were being borne by other taxpayers. When landlords start losing money because of low
rents, they are usually able to get their property assessments lowered. This leads to a general
decline in property values in a rent-controlled city and thus less revenue going to the
governments.
In the Philippines, a study by Ballesteros (PIDS, 2001) carried varied thoughts and findings
about rent control. For one, Ballesteros doubted the assertion that rent control leads to a
supply-demand gap. It is more probable, she said, that investors confidence on rental
investment is dampened by property taxes, limited demand for “used” housing, which
constrains financing for rental investments, and the possibility of being unable to capitalize
on rising property values.
The study also showed that: 1) many poor and low-income households in Metro Manila have
benefited from rent control; 2) the distributional effects of rent control are minimal since
non-poor families have equal access to rent-controlled units; and 3) rent control results in
higher rents for new and short-term tenants, smaller increases for sitting tenants leading to
lower rents for long-stayers.
The study raised the need for rent control to be strictly enforced to be effective. Thus,
government has to ensure that those who have access to these “low cost rental housing
units” are the low-income sector. This, unfortunately, is hard to monitor given institutional
weaknesses in identifying legitimate beneficiaries of subsidies. In this case, rent control
becomes a poor mechanism for income transfers.
4 William Tucker, “How Rent Control Drives Out Affordable Housing”, Cato Policy Analysis No. 274, May 21, 1997.
HOUSING 148148
High Cost of Land. The real property boom in the early 1990s has caused rapid increases in
land prices. In Manila, the average annual housing price increase was computed at 32%, the
highest among major cities in Asia (see Table 11.7).
On the other hand, the cost of servicing raw land increases to five times its amount. In the
outskirts of Metro Manila for example, the P60/sq m raw agricultural land rises by 2.5-3.0
times when zoned for urban use. When developed, it rises further by 5.3-6.7 times the zoned
land price. The high, and at times exorbitant increases in land prices, is partly a result of
undefined/conflicting land uses.
TABLE 11.7 RATE OF CHANGE IN HOUSING PRICE
IN SELECTED ASIAN CITIES*, (ANNUAL)
COUNTRIES Rate of Change (%)
Manila 32
Bangkok 26
Hong Kong 18
Singapore 6
Kuala Lumpur 14
*observed over the five-year period 1986-1990 Source: United Nations Human Settelements as cited by Ballesteros.
Off-Target Subsidy. Housing subsidies leak to non-poor or least targeted beneficiary. A
World Bank study has shown that about 95% of the beneficiaries of government housing
assistance have been urban households (the majority of which are in the NCR). Rich and
middle-income households have captured most of the assistance, with only 21% of the
beneficiaries coming from the poor. A study by the Philippine Institute for Development
Studies analyzing the income profile of the beneficiaries of housing programs validated this
WB finding. It indicated that higher income households (or the non-poor) are the main
beneficiaries of government subsidies (see Table 11.8). This pattern is observed even in the case
of community-based programs such as the CMP. Compared to other programs, CMP has the
most number of low-income beneficiaries but middle-income beneficiaries comprise the bulk
of households that benefit from the subsidy.5
5 This portion benefited largely from Dr. Marife Ballesteros’ study.
CONGRESSIONAL PLANNING AND BUDGET DEPARTMENT 149149
TABLE 11.8 INCIDENCE OF HOUSING SUBSIDIES
(% OF TOTAL BENEFICIARIES)
Income Groups HOUSING PROGRAMS Low Middle High
Unified Home Lending Program 38 33 29
Expanded Housing Loan Program 12 67 21
Community Mortgage Program 39 49 12
Group Land Acquisition and Development Program 17 56 27
Land Tenurial Assistance Program 27 54 19
Source: Ballesteros, 2002
MTPDP GOALS AND ACTION PLANS
The Medium-Term Philippine Development Plan 2004-2010 positions the housing sector to
adopt a strategic framework anchored on a multi-stakeholder/tripartite market-based, private
sector and LGU-led reforms and approaches the meet the goals of: 1) job generation; 2)
shelter security for the different market segments; and 3) MDG of improving the lives of
slum dwellers. It also places the sector as one that will work towards the decongestion of
Metro Manila by developing new centers for communities outside the metropolis.
Thus, the MTPDP has lined up the following legislative agenda that are crucial to meeting the
goals set for the country’s housing sector:
§ Operationalizing Social Housing Finance Corporation. This shall be the
primary institution responsible for addressing the housing needs of the bottom 30%
poor households. It shall have an authorized capital of P15 billion and shall enter
into loans or issue bonds and other debentures to raise funds for housing
construction.
§ Instituting the National Land Use Policy. This shall integrate efforts, monitor
development relating to land use and evolve policies, regulations and directions of
land use planning processes. This policy shall also categorize land uses according to
protection land use, production land use, settlements development and
infrastructure development. § Establishing Local Housing Boards in Every City and Municipality. The
Board shall be tasked, among others, to ensure compliance with the 20% balanced
housing requirement in the Urban Development and Housing Act (RA 7279), which
HOUSING 150150
provides that in every housing development project, at least 20% of the units or
project cost should be for socialized housing.
§ Creating the Field of Land Title Insurance. This will help build confidence of
financial institutions and individuals to proceed and deal with real property
transactions, knowing that, should it later turn out that the title sold or mortgaged
was a fake, the financial institution or individual will be reimbursed by the insurance
company for the losses. If passed, this law will pave way for the development of the
secondary mortgage market as it promotes investor confidence in mortgage-backed
assets.
CONCLUSIONS AND RECOMMENDATIONS
Policy and institutional weaknesses have, to some extent, contributed to inefficient
functioning of the country’s housing sector, thus resulting in a relatively high unmet housing
need. The rent control policy, for example, has dampened investors confidence to venture
into low-supply but high-demand low to medium-income housing, thus restricting the growth
of housing stock. Likewise, the existing subsidy mechanisms have led to substantial leakage of
government support to the non-poor, thus rendering many of them still homeless or held up
in dilapidated and doubled-up dwellings. While there may be other institutional shortcomings
that may be inadvertently missed out in this chapter, it would do well the housing sector if
Congress begins addressing some of these failings mentioned here. Following are the
proposed measures that will certainly increase housing supply and pave way for an efficient
government housing subsidy mechanism:
§ Pursue/explore development of the rental housing market, thus allow any
standing rent control policy to expire as scheduled.
§ Establish a Housing Assistance Fund or Socialized Housing Fund as an on-budget
subsidy mechanism that would replace the existing off-budget subsidy scheme,
where even the non-poor can avail of below-market interest rates on mortgage
loans.
§ Pass a National Land Use Policy that will classify land according to protection land
use, production land use, settlements development; and infrastructure
development. This will ensure availability of land for housing development and
stabilize undue or exorbitantly high land price increases.
§ Set standards through the IRA that will ensure LGUs meet at least minimum goals
for socialized housing programs for the poor and low-income households.
Chapter
CONCLUDING REMARKS
The national budget typically provides a clear statement of intent—often more accurate than
the policies or plans on which they are based—about priorities and commitments that a
government wants to adhere to. In this context, the President’s 2006 proposed National
Budget is sending a clear [and strong] signal that keeping the fiscal house in order still remains
the top priority of the government.
Last year’s ratings downgrade from international agencies had sharply and painfully
underlined the critical need of achieving meaningful fiscal consolidation for enhancing
stability and growth prospects over the medium term. Thus, reducing the fiscal deficit and
public debt to manageable levels continues to be most urgent and critical task facing our
country today, and raising fiscal revenues has been the government’s main strategy for
achieving this.
From a macro perspective, closing the fiscal gap will help raise the level of national saving,
free up funds for investments, prevent a buildup of inflation expectations, reduce domestic
interest rates, and restore investor confidence in the country’s macroeconomic fundamentals.
It will also enable the government to have enough fiscal space for key budget items such as
infrastructure, education, health and other basic services.
Coming from a very difficult period of large and persistent fiscal overhang, the government
embarked on aggressive campaign towards fiscal consolidation, by way of intensified tax
administration and vital new tax measures as well as expenditure control. Overall, the impact
of these reform measures has yielded positive results. The budget deficit stood at P146.5
billion for 2005, well below the target of P180 billion for the period and much lower than the
1212
CONCLUDING REMARKS 152152
187.1 billion shortfall in 2004. This figure already represents one of the lowest budget
shortfall since 2001. The nation has not had a balanced budget since 1997. In addition,
netting out the interest payments in the expenditures, the government recorded a primary
surplus amounted to P153.3 billion for the year or 107% higher than the amount recorded
last year.
Both the equities and the foreign exchange market were buoyed as a result of the progress
made on the fiscal front. The local equities market have gained while the peso was the best
performing currency for 2005 and continues its upward streak this early 2006.
However, these matters should not divert our attention from the remaining challenges if we
are to attain our fiscal targets over the medium term. Notwithstanding the full
implementation of the expanded value-added tax this month, the government has to renew its
commitment of protecting its revenues from being eroded by inefficiency and graft and
corruption. Apparently, collection performance by the revenues agencies in 2005 has not
been very encouraging. The two agencies—BIR and BOC—failed to gain significant revenue
yields from recent measures, including the attrition law, the sin tax law, and the reformed
value-added tax law.
Hence, continuing efforts towards fiscal consolidation must be pursued that will pave the way
for additional reform measures that would further improve tax administration. Moreover,
fiscal reforms should be effectively accompanied by structural reforms to boost growth
prospects. Historical experience suggests that it is difficult to bring down deficits and public
debt levels without an accompanying robust economic growth. This means that fiscal
consolidation efforts are best undertaken within the larger context of a broad-based agenda of
structural economic reforms that will help guarantee the continued growth of the economy.
Another important signal that the 2006 National Budget has underlined was about “alleviating
the pain”—which reflects the government’s desire to create enough fiscal space in order to
deliver political and social commitments.
At first glance, the proposed budget seems to reflect these intentions to give the economy a
boost and deliver on its anti-poverty promises because of increases in allocation for economic
and social services. A closer look, however, reveals that these increases are very minimal and
in effect limits the funds that can be used to implement programs and projects under the
MTPDP and the 10-Point Agenda.
CONGRESSIONAL PLANNING AND BUDGET DEPARTMENT 153153
In terms of sectoral expenditures, the following concerns and recommendations are worth
highlighting:
§ Notable increase in economic services signifies the government’s effort to address the
infrastructure backlog in the country. For 2006, more funds are expected to support
flood control and highway projects, as well as, the construction and rehabilitation of
ports and airports nationwide. Undertaking these projects can generate additional
employment and can improve the investment climate in the country.
§ While allocation for health and education increased in the 2006 budget, these
represent a small percentage of the total GDP, compared to debt servicing. Public
investments in education should be concentrated in basic education, especially in
improving academic achievements in these levels up to the secondary level. Delivery
of health services particularly to children and women in difficult situation, and the
promotion of an effective population control program should also be addressed.
§ Expenditure items in the social and economic sectors should also be prioritized based
on economic and social benefits they generate. In the case of agriculture, resources
should be allocated to improving its productivity through expanded irrigation,
stronger research and extension system, and improved rural infrastructure and market
accessibility. These impact positively on output and rural incomes.
§ Government has adequate funding for its housing program since sources for this
come from various government agencies, including local government units through
their IRA. However, there is a lack of coordination among its agencies regarding the
allocation of this fund that those who desperately need housing assistance are not
benefited. Congress may look into establishing a Housing Assistance Fund that
would replace existing off-budget subsidy scheme.
§ Aside from improving the distribution of its budget to the social sector, government
must also consider promoting certain policy reforms. These include the passage of
vital legislation on land use, population management, rural infrastructure, and health
delivery as well as institutional reforms in agencies that deal with these sectors.
Given the political environment, it is important to acknowledge that the government has
signaled a strong commitment to fiscal consolidation by passing new tax measures while
pursuing continued expenditure management. But it must be realized that such fiscal
adjustments often entail short-term political and economic costs. Obviously, compressed
CONCLUDING REMARKS 154154
public spending is usually problematic when there are urgent social needs and serious
infrastructure deficiencies that can impede long-term growth. Hence, better-focused
expenditure targeting the sectors that need it most can be useful, as will an increase in the tax
base and greater efficiency in tax collection
REFERENCES
AGENCY PUBLICATIONS:
Asian Development Bank. Asian Development Outlook Update. September 2005.
Asian Development Bank. 2005 Human Development Report
Asian Development Bank, JBIC and the WB. Connecting East Asia: A New Framework for Infrastructure. May 2005
Asian Development Bank. Poverty in the Philippines: Income, Assets and Access. January 2005.
Bureau of Internal Revenue. Annual Report for 2004.
Bureau of the Treasury. Cash Operations Report (1998-2004 and January-June 2005).
Commission on Higher Education Final Report on the Rationalization of Public Higher Education System. March 2004.
Committee on Oversight. Turning Point: The Chair’s Assessment of Government Performance on the First Year of the Arroyo Presidency. House of Representatives. July 2005.
Congressional Planning and Budget Department. An Analysis of the Presidents Budget for Fiscal Years 2003/2004/ 2005.
Department of Agrarian Reform. Agrarian Reform Communities’ Level of Development Assessment: ALDA Reports (2002-2004).
Department of Agrarian Reform Comprehensive Agrarian Reform Program: Briefing for CY 2005. .
Department of Agriculture. 2004 Annual Report.
Department of Agriculture. Performance of Philippine Agriculture, January – December, 2004.
Department of Agriculture. Review of the Agriculture and Fisheries Modernization Plan, 2001 – 2004.
Department of Budget and Management. Budget of Expenditures and Sources of Financing 2005 / 2006
Department of Budget and Management Details of Selected Programs and Projects.
Department of Budget and Management. National Expenditure Program FY 2000-2006.
Department of Finance. Sensitivity Indicators Year 2006. September 2005.
Energy Information Administration. International Petroleum Supply and Demand: Medium Recovery Case. “Short-Term Energy Outlook.” U.S. Department of Energy. September 2005.
International Labour Organization, World Employment Report 2004-05: Employment, Productivity and Poverty Reduction. December 2004.
International Monetary Fund. “Key Messages from 2004 IMF Report on Philippines.” Manila. 09 May 2005.
National Economic and Development Authority. Medium-Term Philippine Development Plan 2004-2010. 2004.
National Economic Development Authority. Medium –Term Public Investment Program, 2005-2010.
National Economic and Development Authority Second Progress Report on the MDG. June 2005
National Economic Development Authority. Socio-Economic Report 2004.
National Statistical Coordination Board. National Accounts of the Philippines. Various issues. Various years.
National Statistics Office. Monthly Integrated Survey of Selected Industries: Volume of Production Index (VoIP) July 2005. Released 27 September 2005.
Philippine Institute For Development Studies. Special Issues in Agriculture, 2004
United Nations Development Programme. Philippines Country Study on Meeting the Millennium Development Goals. March 2002.
United Nations Development Programme-National Economic Development Authority. Second Philippines Progress Report on the Millennium Development Goals. June 2005.
United Nations Development Programme and World Bank. Rural Electrification and Development in the Philippines: Measuring the Social and Economic Benefits. May 2002.
Department of Economic and Social Affairs. UN Global E-Government Readiness Report 2004. United Nations, November 2004
UNCTAD. Various documents on the 6th WTO Ministerial Conference in Hong Kong, China.
Washington Sycip Policy Forum-Asia Institute of Management (AIM). The Infrastructure Policy Program: Meeting Tomorrow’s Needs Today.
World Health Organization. Bulletin, Vol. 82, No. 8, August 2004, 559-638.
The World Bank. Education Policy Reforms in Action: A Review of Progress since PESS and PCER. Washington D.C., May 2004
World Bank East Asia Pacific Region. Philippines From Short-Term Growth to Sustained Development. Washington D.C., April 2005.
World Bank. Philippines Filipino Report Card on Pro-Poor Services. Washington D.C., May 30, 2001
World Bank. Philippines: Meeting Infrastructure Challenges, Infrastructure Sector Department. Washington D.C., May 19, 2005
World Bank. Philippine Poverty Assessment. Washington D.C., May 31, 2001.
World Bank. World Economic Outlook 2005: Update. Washington D.C., September 2005
World Bank Task Force Higher Education and Society Higher Education in Developing Countries. The World Bank, Washington, D.C. 2000.
Annual Financial Report for 2004, Commission on Audit (COA).
NEWS ARTICLES:
Agence France Press. Oil Prices Drop to 2-Month Low on Cooler Demand. Philippine Star. October 8, 2005.
Esguerra Christian V., “Health care to collapse in two years, medics warn”, Philippine Daily Inquirer, September 2005
Philippine Star. Table on Crude Oil Prices. Sourced from the Department of Energy and Platt’s. Various dates.
PRESENTATIONS
Abaya, Peter Anthony A. Rising Oil Prices and the Crippling of Our Economy. Department of Energy. Presentation before the AIM Policy Center Workshop: “The Global Oil Situation: What is it to the Philippines”. 10 August 2005.
Balisacan, Arsenio M., What Does It Take to Get Out of Our Poverty Trap?, Presentation at the launching of the Millennium Project Report entitled “Investing in Development: A practical Plan to Achieve the Millennium Development Goals”. Dusit Nikko Hotel, Makati City. February 16, 2005.
Guinigundo, Diwa C., “Building on Success, Committed to Further Reforms: Monetary, External and Banking Sectors.” Presentation before the Committee on Appropriations. Bangko Sentral ng Pilipinas. September 26, 2005.
Habito, Cielito F. & Briones, Roehlano M. Philippines Agriculture over the Years Performance, Policies and Pitfalls. Paper presented at the Conference on Policies To Strengthen Productivity in the Philippines. Makati City, June 27, 2005.
Lee, Sang Mu. Agriculture and Rural Development in the Asia-Pacific Region— in the Context of Globalization and New Civilization. Presentation at the Global Agriculture Policy Institute and Asia-Pacific Policy Center,13-15 November 2002.
_______________. “Performance and Outlook for the Philippine Economy, 2005-2006.” Presentation before the Committee on Appropriations. September 26, 2005.
STUDIES/PAPERS/REPORTS:
Azfar, Omar et. al. Decentralization and Corruption in the Philippines (as cited by World Bank). University of Maryland, College Park
Ballesteros, Marife M. “Rethinking Institutional Reforms in the Philippine Housing Sector.” Discussion Paper Series No. 2002-16. Philippine Institute for Development Studies. November 2002
Bernardo, Allan. International Higher Education: Models, Conditions and Issues. Education and Globalization. Tullao, Tereso Tullao, Jr. (ed). 2003
Bernardo, Romeo L. and Christine G. Tang. “Economic Review: Muddling Through.” September 2005.
Callaghan, Michael. “Key Points in the Statement”. August 2004.
Campos, Edgardo J. “Hellooo…, It’s the Deficit: Fiscal Management for the 21st Century”. 2002.
Coronel, Sheila. Democracy and its Discontents. Philippine Center for Investigative Journalism (PCIJ).
David, Cristina C. Agriculture Growth and Performance. Philippine Institute of Development Studies. 2000.
Habito, Cielito F. “From Crisis to Crisis: Are We Poised for Take-Off?” Ateneo Center for Economic Research and Development. Ateneo de Manila University. 2005.
Herrin, Alejandro. “The Ties that Bind: Population and Development in the Philippines” (2nd edition). AIM policy Center. 2004.
Llanto, Gilbert M. “Bottleneck to Growth: Inadequate Infrastructure”. Policy Notes. Philippine Institute for Development Studies (PIDS). March 2004
Manasan, Rosario G., “Explaining the Decline in Tax Effort”. Policy Notes. Philippine Institute for Development Studies. December 2002.
Manasan, Rosario G. Some Notes on Tax Leakage and Tax Incidence. Philippine Institute for Development Studies. August 25, 2004.
Preddey, George and Honesto Nuqui. Normative Financing in Higher Education. Asian Development Bank, August 2001.
Premchand A. Government Budgeting and Expenditure Controls. 1983.
Santiago, Andrea et al. A Comprehensive Cost Analysis of Degree Programs for Selected Higher Educational Institutions (NCR Pilot Study – Phase 1) Commission on Higher Education. October 2002.
Serafica, Ramonette. “Beyond 2000: An Assessment of Infrastructure Policies.” Discussion Papers. Philippine Institute for Development Studies. May 1998.
Tanzi, Vito et. Al. Roads to Nowhere: How Corruption in Public Investment Hurts Growth. International Monetary Fund (IMF), 1998
Tolentino, Bruce. “Can We Feed Ourselves? Rapid Population Growth and Rice Policy in the Philippine,” The Ties That Bind: Population and Development in the Philippines. Asian Institute of Management.
_________________. “Benefits (and Losses) from Rent Control in the Philippines: An Empirical Study of Metro Manila.” Discussion Paper Series No. 2001-23. Philippine Institute for Development Studies. December 2001
_________________. “East Asia’s Dollar Influx – Signal for Change”. April 2005.
_________________. National Government Revenue Program 2003-2010.
_________________. Philippine Labor Force Survey July 2005: Preliminary results. 15 September 2005.
_________________. Staff Report for the 2004 Article IV Consultation and Post-Program Monitoring Discussions. 04 February 2005.
_______________. “Selected macroeconomic data 2005-2010”.
ONLINE SOURCES
David, Wilfredo P. Constraints, Opportunities and Options in Irrigation Development. Philippine Institute of Development Studies http://www.pids.gov.ph. October 2000.
International Development Enterprises (IDE) in Vietnam: Agriculture and Poverty, 2005. http://www.idevn.org/Core_Approach/Agriculture_&_Poverty.htm.
STATISTICAL REFERENCES
2002 Annual Poverty Indicator Survey (APIS), National Statistics Office (NSO), July 2003
Current Labor Statistics, Fourth Quarter, 2002-2004. Department of Labor and Employment.
Fact Sheet 2005, Basic Education Statistics. Department of Education
Philippine Statistical Yearbook 2004. National Statistics Coordination Board, October 2004
Philippine National Demographic and Health Statistics. National Statistics Office. 2003
Philippine National Health Accounts, 2001-2003. National Statistical Coordination Board.
Population Projection 2000-2040. National Statistics Office.
Selected Statistics on Agriculture. Bureau of Agricultural Statistics. 2005
Statistical Bulletin on Higher Education FY 2003-2004. Commission on Higher Education
OTHERS
Republic Act Nos. 9334 (Sin Tax Law) and 9337 (New E-VAT Law).
Revenue loss estimates on the non- implementation of VAT provisions on oil and power (RA 9337) by the Fiscal Policy and Planning Office of the Department of Finance, 2 September 2005.
Tax gap estimates by the National Tax Research Center, 30 September 2003. Presentation materials submitted by the DBCC to the Committee on Appropriations during the budget hearing held 3 October 2005.
Reports submitted to the Committee on Ways and Means during the deliberation of the Anti-Smuggling Bill (1st Regular Session, 13th Congress).