Prithviraj Paul Choudhury Page 1 University of Nottingham An Analysis of the UK Auto Component Industry: From the perspective of a Tier 2 safety software company Prithviraj Paul Choudhury MBA
Transcript
Prithviraj Paul Choudhury Page 1
University of Nottingham
An Analysis of the UK Auto ComponentIndustry: From the perspective of a Tier 2
safety software company
Prithviraj Paul Choudhury
MBA
Prithviraj Paul Choudhury Page 2
To Him
An Analysis of the UK Auto ComponentIndustry: From the perspective of a Tier 2
safety software company
By
Prithviraj Paul Choudhury
2010
A Management project presented in partconsideration for the degree of “MBA in Finance”
Prithviraj Paul Choudhury Page 3
Executive Summary
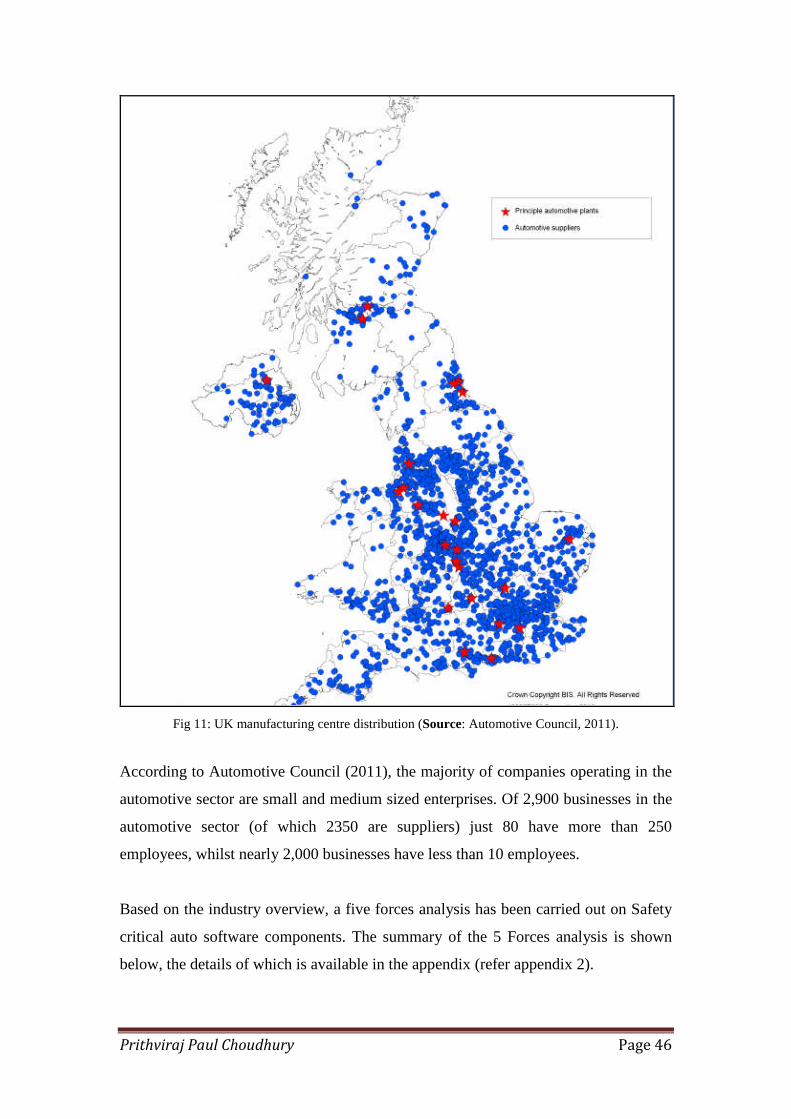
The automotive industry is a large critical sector to UK economy as it accounts forclose to a million jobs and is the highest exporter for the country. The industry ischaracterised by the presence of world’s major OEMs and Tier 1 suppliers along witha wide chain of other suppliers. The relationship between these players has mostlybeen studied only to the extent of OEMs and Tier 1 suppliers, leaving a gap inestablishing the relationship with Tier 2 suppliers with the other two. This industryhas been in the news for quite some time for being less competitive due to low growthand high number of players but there are also positive news about various governmentinitiatives to promote low carbon development and to boost up the existing supplychain.
This report aims to unravel the nature of relationship between OEM/Tier 1 suppliersand Tier 2 suppliers in the UK auto component sector and also to discoveropportunities that might be present for Silver Atena, a new Tier 2 safety criticalsupplier.
In doing so, first the auto component market structure has been studied to ascertainthe current opportunities, trends, government initiatives etc. The relationship betweenOEM/Tier 1 and Tier 2 suppliers has helped in segmenting the clients into three: Tier1 suppliers, R&D centres and Design Engineering centres. Based on thissegmentation, an exhaustive client and competitor analysis has been provided. It isalso observed that most current developments are taking place in the fields ofelectronics/electrical components involving software which makes it a goodproposition for Silver Atena. This report has identified four domains for Silver Atenato focus on viz. powertrain, vehicle control, driver assistance and infotainment &telematics.
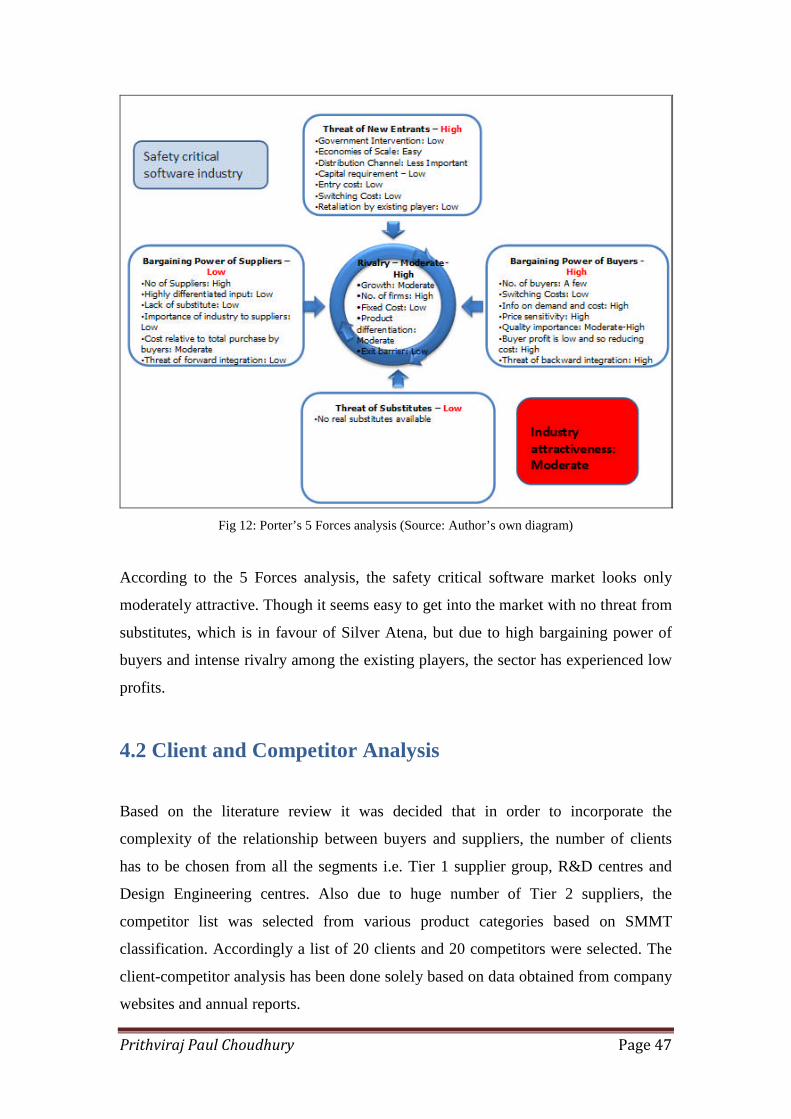
Even though the future seemed bright, when the current market conditions wereanalysed it revealed that most participants are making very low profits and evenlosses making it a very unattractive market to be in.
However, based on the future prospects in hybrid, electric and fuel cell technologies,the report has made recommendations for Silver and has also highlighted thechallenges that Silver Atena needs to overcome in order to make a successful entryinto the auto component market by leveraging its existing skills.
Prithviraj Paul Choudhury Page 4
Acknowledgements
First and foremost my heartfelt sincere gratitude and thanks goes to my supervisorProfessor Chris O’Brien for his continuous encouragement and guidance. Hisvaluable feedback and constant motivation during the course of this research willalways be treasured.
I would also like to thank all my lecturers, NUBS staffs and colleagues for theirencouragement and help.
And last but not the least I would like to take this opportunity to thank my family fortheir love & affection and supporting me all throughout the MBA program, withoutwhich this dream may never be realised.
Prithviraj Paul Choudhury Page 5
Table of ContentsExecutive Summary.......................................................................................................3Acknowledgements........................................................................................................4List of Figures and Tables..............................................................................................7List of Abbreviations .....................................................................................................8Chapter 1: Introduction ..................................................................................................91.1 Purpose of the study.................................................................................................91.2 Research Question .................................................................................................111.3 Research Format ....................................................................................................12Chapter 2: Literature Review.......................................................................................142.1 Overview of Auto parts industry............................................................................14
2.1.1 Automobile Safety and Software Industry......................................................15
2.7 Conclusion- Literature Review..............................................................................32Chapter 3: Research Methodology...............................................................................333.1 Introduction............................................................................................................333.2 Methods for research: Qualitative and Quantitative ..............................................333.3 Data Collection Methodology:...............................................................................35
3.3.1 Primary data collection ...................................................................................35
3.3.2 Secondary data collection ...............................................................................37
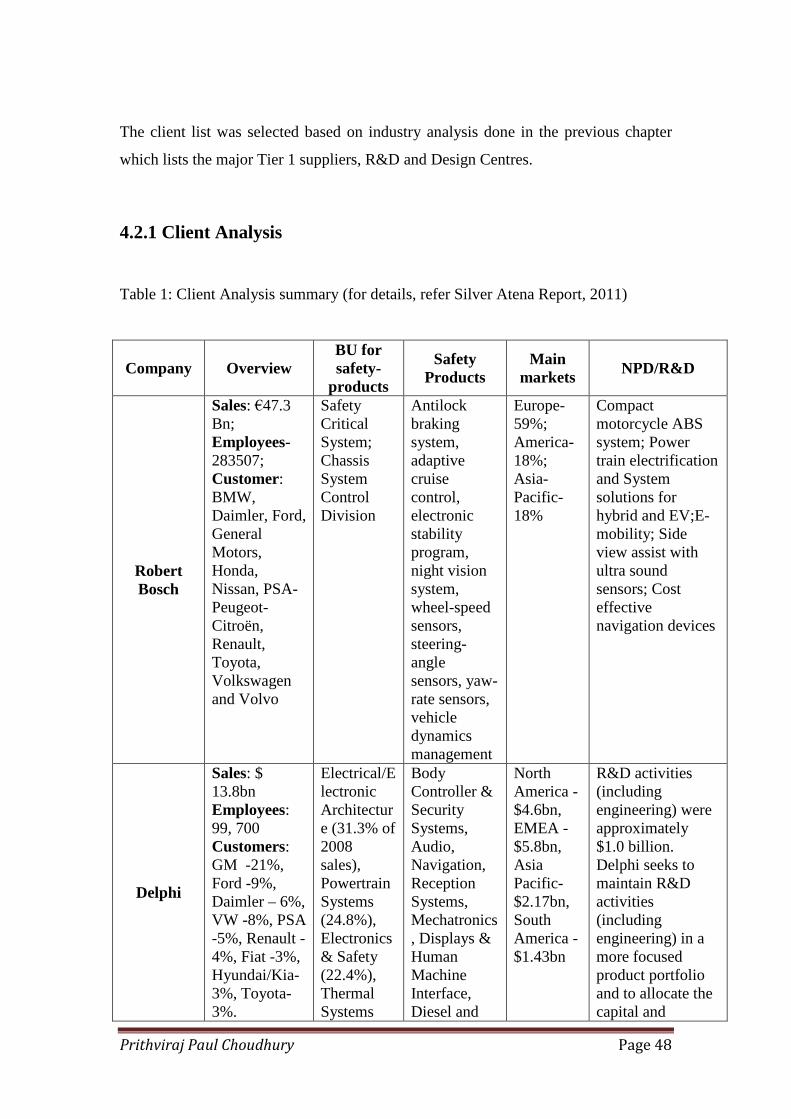
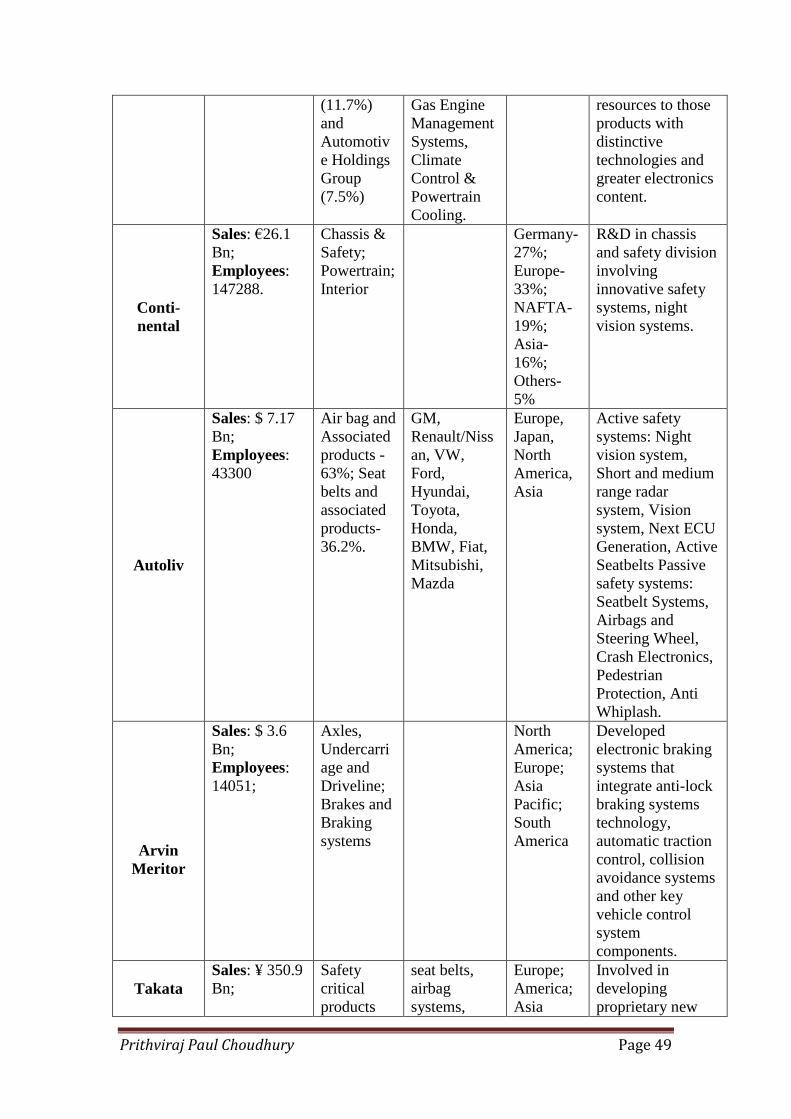
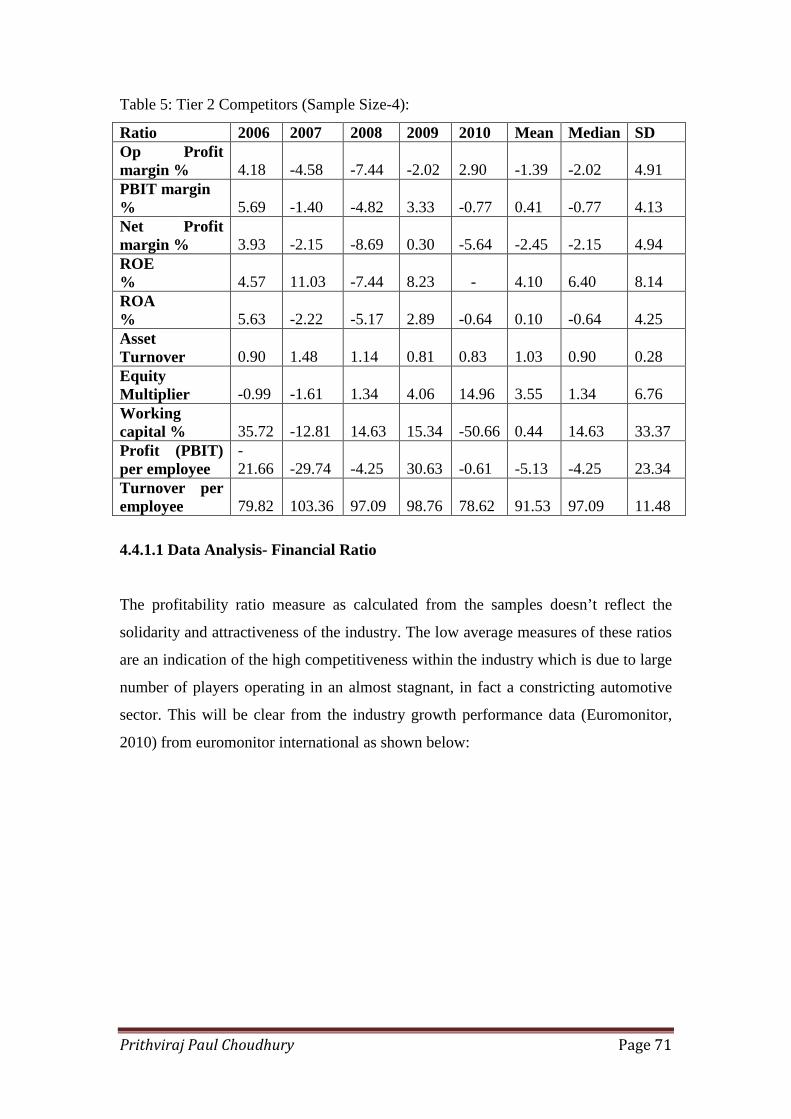
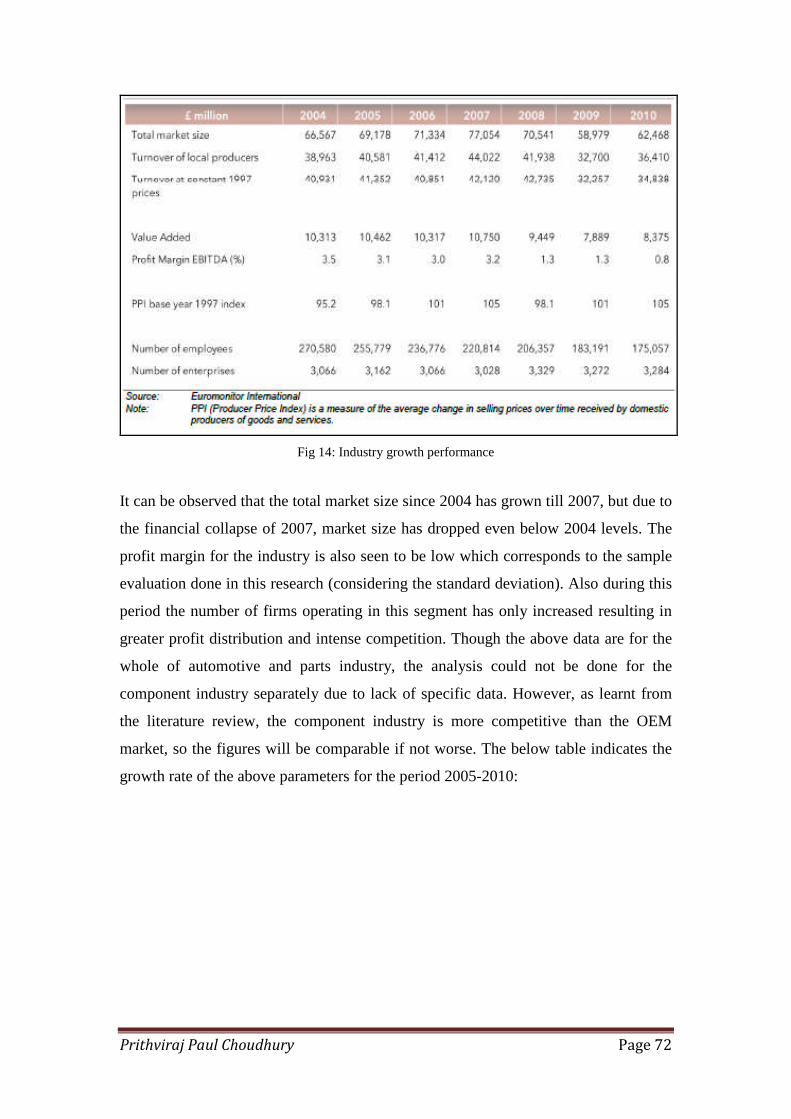
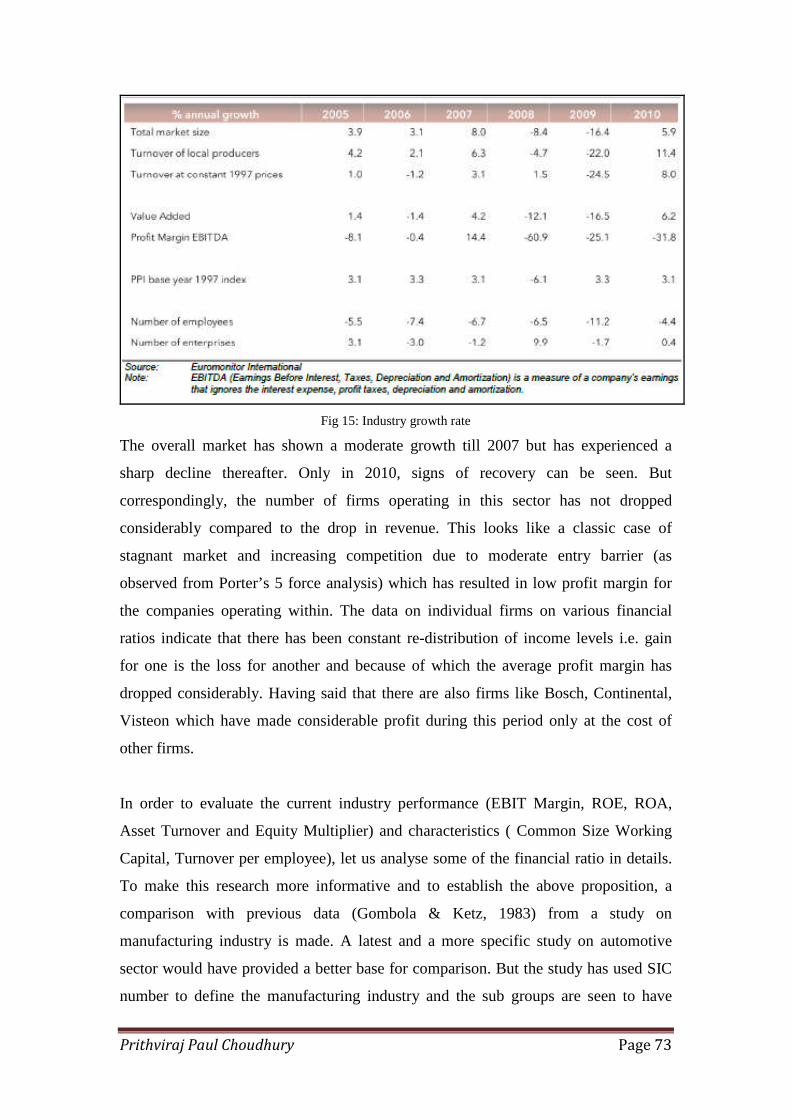
Chapter 4: Data Analysis .............................................................................................384.1 External Analysis: ..................................................................................................38
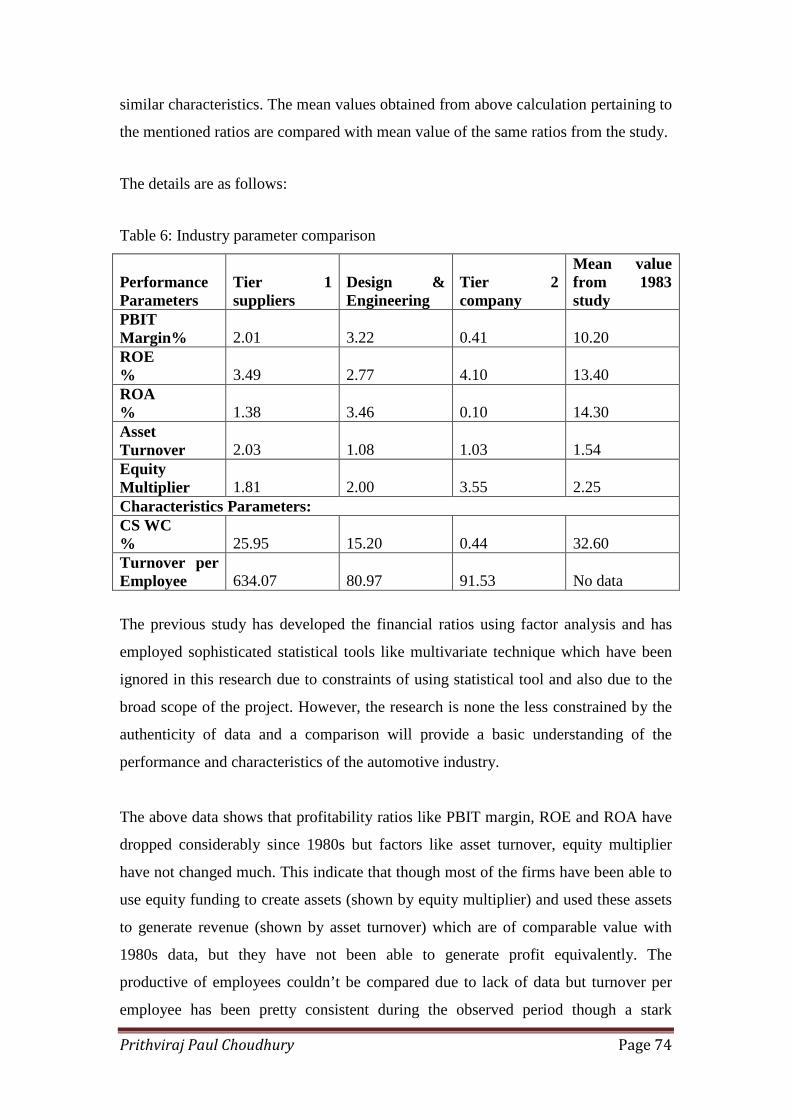
Table 6: Industry parameter comparison…………………………………………….74
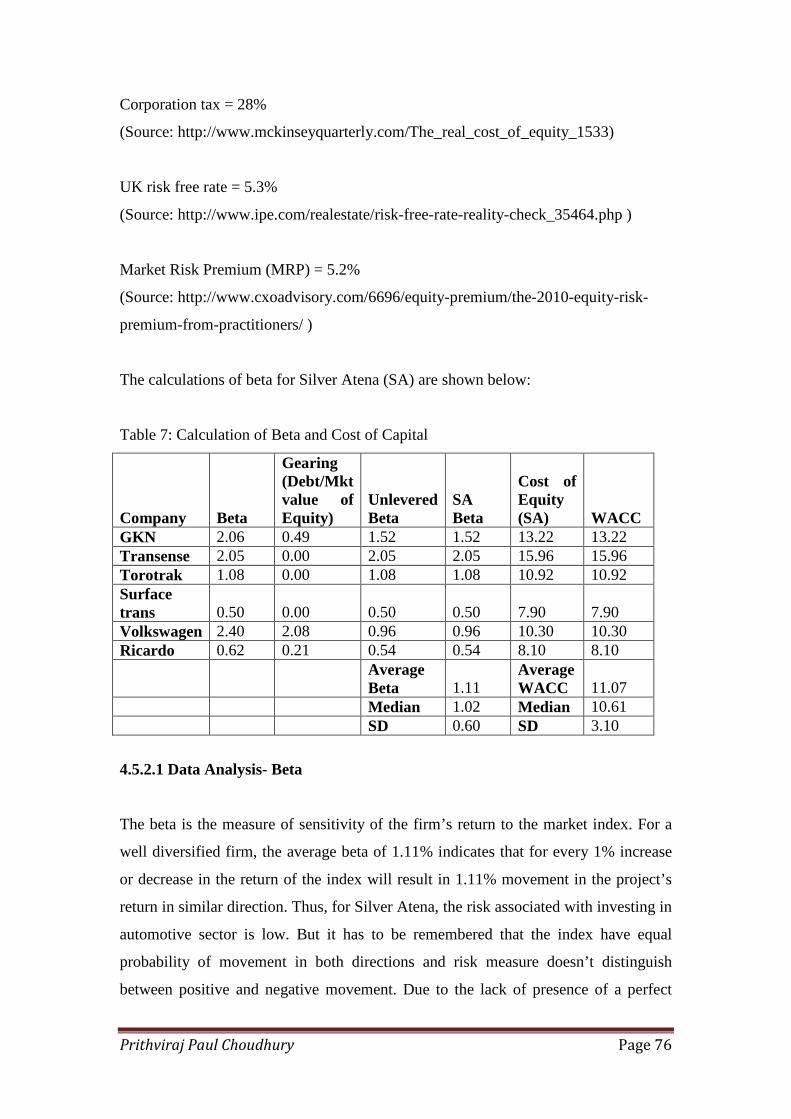
Table 7: Calculation of Beta and Cost of Capital……………………………………76
Prithviraj Paul Choudhury Page 8
List of Abbreviations
ASF: Automotive Supplier Finder
ATA: Automotive Technician Accreditation
ATF: Authorised Treatment Facilities
BEV: Battery Powered Electric Vehicles
BIS: Business Innovation and Skills
BKM: Bodie, Kane and Marcus
CAPM: Capital Asset Pricing Model
DWI: Driving while intoxicated
EBIT: Earnings before interest and tax
ECU: Electronic Control Unit
FCEV: Fuel cell electric vehicles
GSD: Global software development
IMI: Institute of the Motor Industry
JIT: Just In Time
MISRA: Motor Industry Software Reliability Association
MRP: Market Risk Premium
NAIGT: New Automotive Innovation and Growth Team
NPD: New Product Development
OEM: Other Equipment Manufacturer
OES: Other Equipment Supplier
OLEV: Office of Low Emission Vehicles
OS: Operating System
PAT: Profit after Tax
PHEV: Plug-in-hybrids
PICG: Plug in car grant
PLD: Programmable logical device
R&D: Research and Development
ROA: Return on Asset
ROE: Return on Equity
ROS: Return on Sales
SDLC: Software Development Life Cycle
SIC: Standard Industrial Classification
SMMT: Society of Motor Manufacturers and Traders
TCE: Transaction Cost Economics
TQC: Total Quality Control
TSB: Technology Strategy Board
UKTI: UK Trade and Investments
WACC: Weighted Average Cost of Capital
Prithviraj Paul Choudhury Page 9
Chapter 1: Introduction
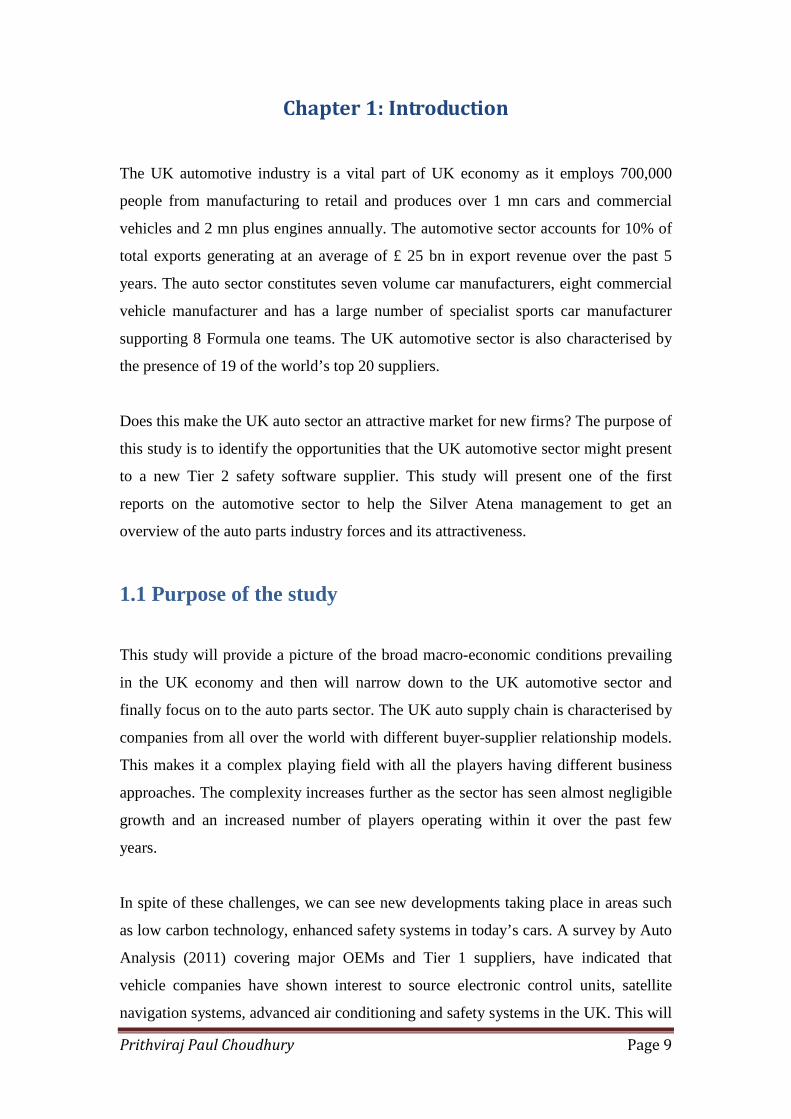
The UK automotive industry is a vital part of UK economy as it employs 700,000
people from manufacturing to retail and produces over 1 mn cars and commercial
vehicles and 2 mn plus engines annually. The automotive sector accounts for 10% of
total exports generating at an average of £ 25 bn in export revenue over the past 5
years. The auto sector constitutes seven volume car manufacturers, eight commercial
vehicle manufacturer and has a large number of specialist sports car manufacturer
supporting 8 Formula one teams. The UK automotive sector is also characterised by
the presence of 19 of the world’s top 20 suppliers.
Does this make the UK auto sector an attractive market for new firms? The purpose of
this study is to identify the opportunities that the UK automotive sector might present
to a new Tier 2 safety software supplier. This study will present one of the first
reports on the automotive sector to help the Silver Atena management to get an
overview of the auto parts industry forces and its attractiveness.
1.1 Purpose of the study
This study will provide a picture of the broad macro-economic conditions prevailing
in the UK economy and then will narrow down to the UK automotive sector and
finally focus on to the auto parts sector. The UK auto supply chain is characterised by
companies from all over the world with different buyer-supplier relationship models.
This makes it a complex playing field with all the players having different business
approaches. The complexity increases further as the sector has seen almost negligible
growth and an increased number of players operating within it over the past few
years.
In spite of these challenges, we can see new developments taking place in areas such
as low carbon technology, enhanced safety systems in today’s cars. A survey by Auto
Analysis (2011) covering major OEMs and Tier 1 suppliers, have indicated that
vehicle companies have shown interest to source electronic control units, satellite
navigation systems, advanced air conditioning and safety systems in the UK. This will
Prithviraj Paul Choudhury Page 10
help reduce exchange rate fluctuation, minimise cost of an extended supply chain,
take advantage of the labour market flexibility and positive industrial relations
environment and finally to exploit the growing UK expertise in low carbon
technologies. And for the electric vehicle market, an entirely new supply chain will
have to be established for sourcing specialist wiring harness, electric power units,
electric drive train and gearing.
With strong signalling from the government to support the automotive sector by
improving access to finance for growing companies, reduce red tape, trade missions to
emerging economies and a commitment shown to decarbonise the economy through
initiatives like NAIGT (New Automotive Innovation Growth Team), Automotive
Council, TSB (Technology Strategy Board), OLEV (Office of Low Emission
Vehicles), Plug in car grant (PICG) and tax incentives for electric vehicles will sow
the seeds for an improved automotive and supply chain network within the UK. These
new developments are bound to make the UK a viable place for auto development and
the component supply market will see new energy in terms of increased internal
sourcing of high tech components and new electric vehicle components which will
provide opportunity for new players like Silver Atena to exploit the new product
development market.
In such a competitive environment, Silver Atena wants to explore these new
opportunities by correctly positioning itself to cater for the needs of the sector. Silver
Atena was formed from the merger of Silver Software and Atena Technologies in
2008. Silver Atena is an expert provider of safety critical software and hardware and
operates in Aerospace & Defence, Automotive, Rail and Gas Turbine & Energy sector
across various parts of the world. In the UK, Silver Atena only operates in the
Aerospace & Defence sector and now wants to explore the UK automotive component
market as it believes it can leverage its skills and competencies learnt from other
sectors especially its German counterpart, to enter the UK parts market.
Prithviraj Paul Choudhury Page 11
1.2 Research Question
To assist Silver Atena in exploring the UK component market, the following research
questions will be answered:
1. What is the current structure of the UK auto component market?
2. Who are the clients and competitors of Silver Atena?
3. Is the UK auto component market attractive for Silver Atena?
4. How can Silver Atena increase its brand awareness in the UK auto
component market?
The reason for selecting the above questions is to produce a realistic business case for
successful engagement in the UK parts market. In order to get into this competitive
industry, Silver Atena has to know the opportunities and threats that the current
market throws. So in the first question, it becomes important to look at the market
structure in terms of macro-economic factors, industry forces and buyer-supplier
relationships.
Along with this, Silver Atena also has to know who can be its potential clients as that
will decide the revenue stream. But in order to earn a share it has to compete with the
existing players. And in some cases, even a client can be its competitor. So the second
question will provide a detailed client-competitor analysis to help Silver Atena
position itself.
In order to exploit these opportunities and minimize the threats, Silver Atena has to
first identify and then use its strengths; that will come from doing an internal analysis.
Also knowing the current profitability of the industry and risk involved in operating in
this industry will provide a basis for Silver Atena to decide on the attractiveness,
which will be answered in the third question.
And finally, as a new entrant, along with leveraging its existing skill set, for Silver
Atena to increase its branding in the industry, it has to actively promote itself. The
fourth and the final question will provide promotion channels and customer value
proposition for Silver Atena.
Prithviraj Paul Choudhury Page 12
Having looked at these, the research will also be extended to make a few
recommendations and to highlight a few challenges for the future.
1.3 Research Format
This research begins with a literature review that will identify the tools needed to
conduct an external analysis of the UK component market, internal analysis of Silver
Atena and also describes the methods to measure profitability and risk involved in the
industry.
Among various research methodologies available, the third chapter will select and
discuss the appropriate methodology that will best suit the research and will also
highlight the challenges involved.
In the fourth chapter, analysis of the data collected from various primary and
secondary sources will be discussed that will provide a base for discussing all the
research questions in the fifth chapter. The external analysis will use frameworks like
PESTLE and Porter’s 5 Forces to represent the industry structure. The fourth chapter
will then include the analysis of the potential clients and competitors of Silver Atena.
And finally, the attractiveness will be analysed in two parts. The first part will discuss
the internal analysis of Silver Atena in terms of core competency and competitive
advantage and finally SWOT framework will be used to consolidate the analysis to
identify its position. The second part will then analyse the profitability of the industry
and provide measure of investment risk. The reader should note that the data analysis
in this chapter will correspond to the research done for Silver Atena by Prithviraj and
Mrinal (Silver Atena Report, 20111).
The fifth chapter will discuss the research questions based on the analysis done in the
previous chapter and will also draw inferences from academic literature to fill all the
1 Note: M. Sharma and P.P. Choudhury, 2011, ‘Silver Atena Report: the UKAutomotive Component Market Review’, MBA Management Project, University ofNottingham, September, 2011
Prithviraj Paul Choudhury Page 13
gaps. The chapter will also highlight the challenges that Silver Atena might face going
forward.
And finally the sixth chapter will conclude the research by stating the findings in brief
and will highlight any scope of further research.
Prithviraj Paul Choudhury Page 14
Chapter 2: Literature Review
The literature review has been structured in the similar sequence as the research
questions. So it starts with an over view of automotive market and safety software
market. In order to understand the market structure and opportunities present in auto
component market, along with broad environment scanning, it is also important to
demystify the forces present in the Tier 2 supplier industry. So the selection of proper
tools (PESTLE, 5 Forces) that will be useful to evaluate the industry has also been
included as a part of literature review. It was observed that the relationship between
buyers and Tier 1 suppliers have been studied extensively in many researches but
there has been hardly any case when these studies were extended to understand the
relationship between the OEMs and Tier 2 suppliers or Tier 1 and Tier 2 suppliers.
These kinds of studies are particularly important for this research which will help in
identifying the clients and competitors for Silver Atena. Thus existing literature will
be explored to establish the relationships. The literature review has then been
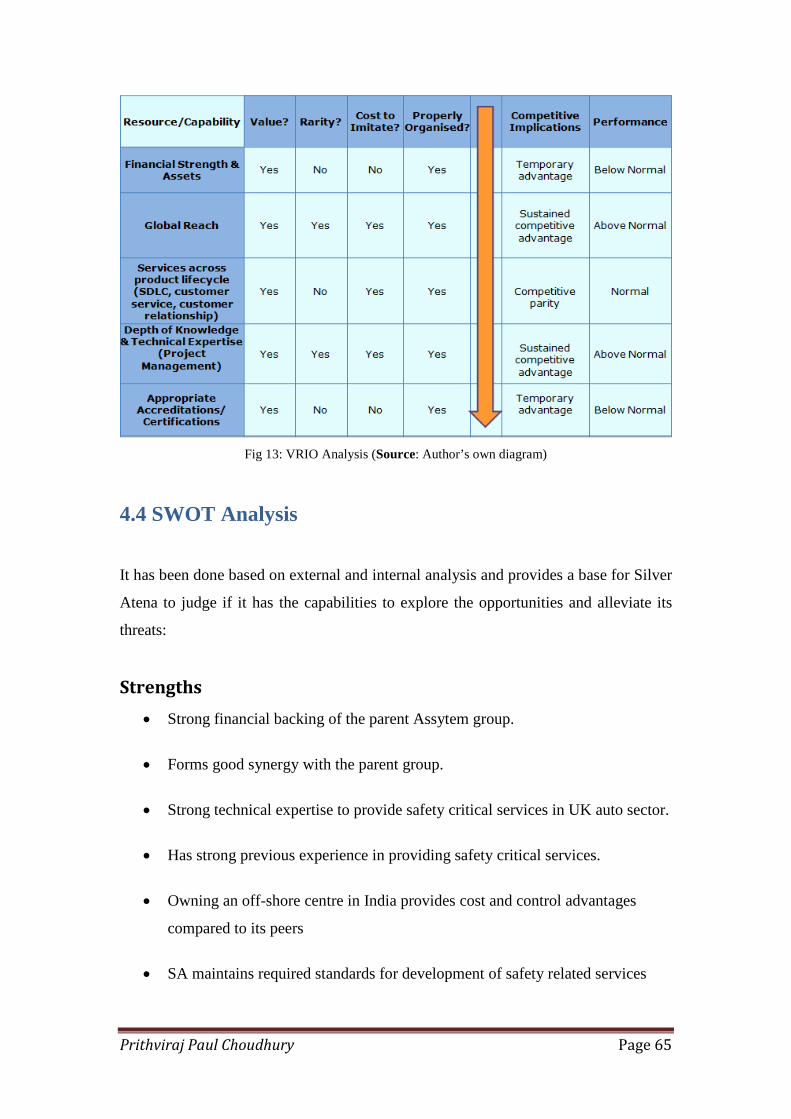
extended to identify and analyse a few tools for internal analysis of the firm like Core
competency analysis and VRIO framework. These will help to explore the
opportunities and mitigate the threats using the strengths and eradicating the
weaknesses of the firm. And since financial analysis will form the final part of the
research, tools like financial ratio analysis and measurement of risk have also been
discussed here.
2.1 Overview of Auto parts industry
The auto industry has been a local industry for most part of the last century. Apart
from Ford and GM, the auto globalization took hold only in 80s and 90s. Honda and
Nissan were the first Japanese auto makers to have plants in Europe and North
America soon followed by Toyota. The much smaller Suzuki became active in small
car and truck market and made an early entry in India and Hungary. The operation of
Mercedes and BMW also expanded from German soil to the United States, Brazil and
Mexico. The large suppliers like TRW, Allied signal, Dana etc followed the Big
Three overseas but thousands of mid and small sized suppliers stayed away. The
Japanese auto makers and part suppliers formed a different relationship and following
Prithviraj Paul Choudhury Page 15
OEMs like Toyota, many Japanese suppliers built manufacturing facilities overseas.
Ford on the other hand tried to force its suppliers to follow it to its assembly locations
else will be left out. So only large suppliers were able to enter new markets and a
series of Mergers and Acquisitions, JVs and Licensing followed.
But with the increase in competition and decrease in margin, there is reduced scope of
economies of scale. Also to remain competitive and to differentiate, automakers are
seeking more flexibility in terms of product engineering and purchasing overhead.
This is made possible by using the platform concept where automakers are using same
parts on different car models or brands. As in this case, the product engineering cost
will not decrease but there can be reduction in purchasing area by working with fewer
purchasing people. This has led to a decrease in number of suppliers the automakers
do business with. According to Santucci (1997), these JVs have different
characteristics. Instead of just collaborating in a particular operation, in order to meet
the requirement of the automakers, the suppliers try to present a common face. So we
see more sharing of manufacturing processes, administrative functions, marketing
actives are complimentary and also jointly owning a facility. And this makes more
economic sense to work with same supplier as automakers are building similar
vehicles in variety of regions.
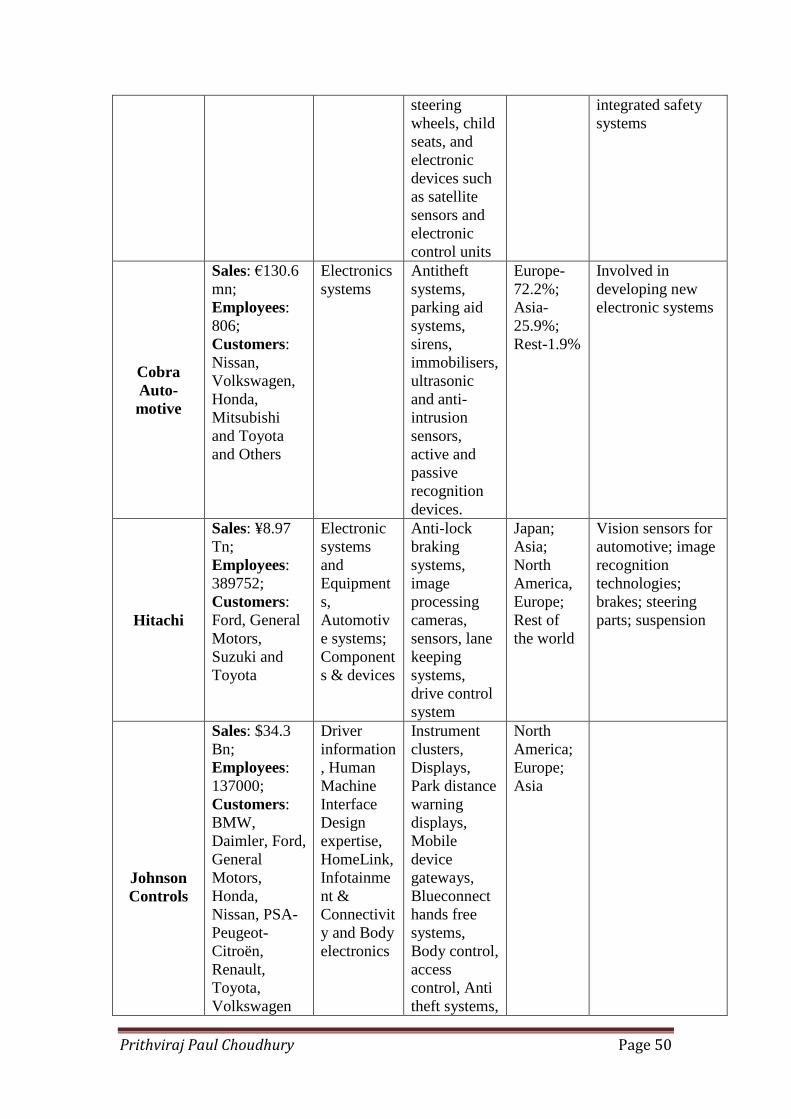
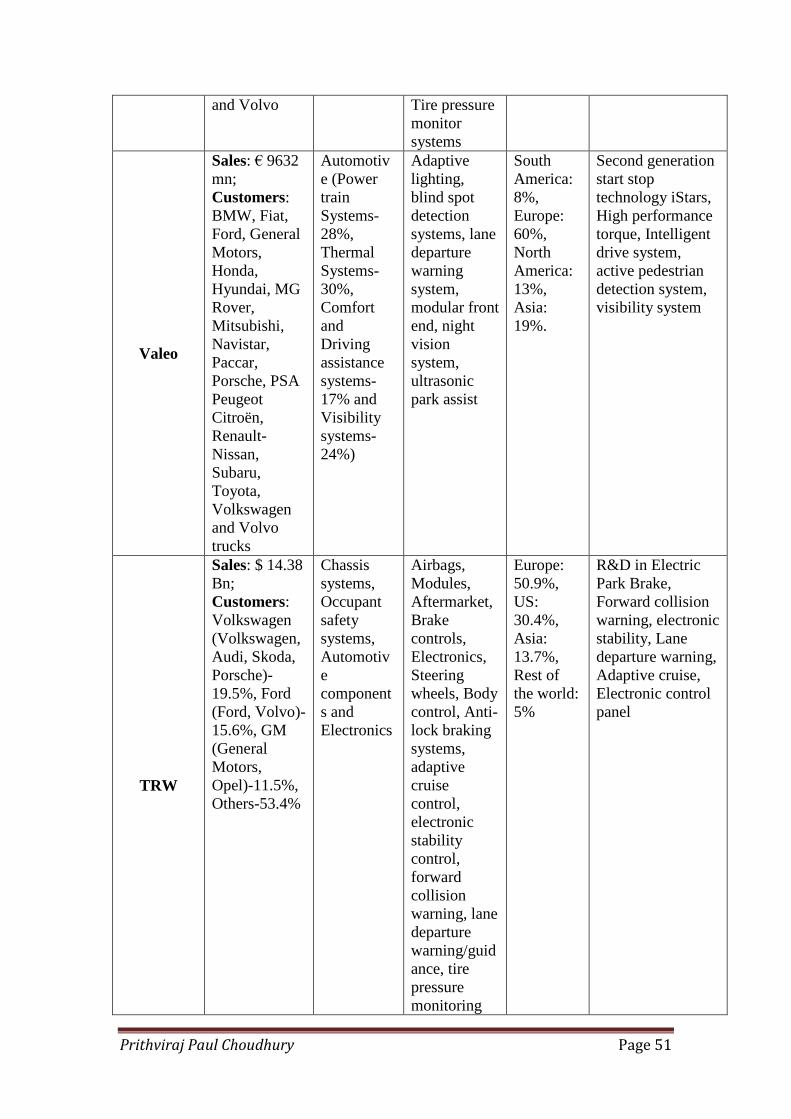
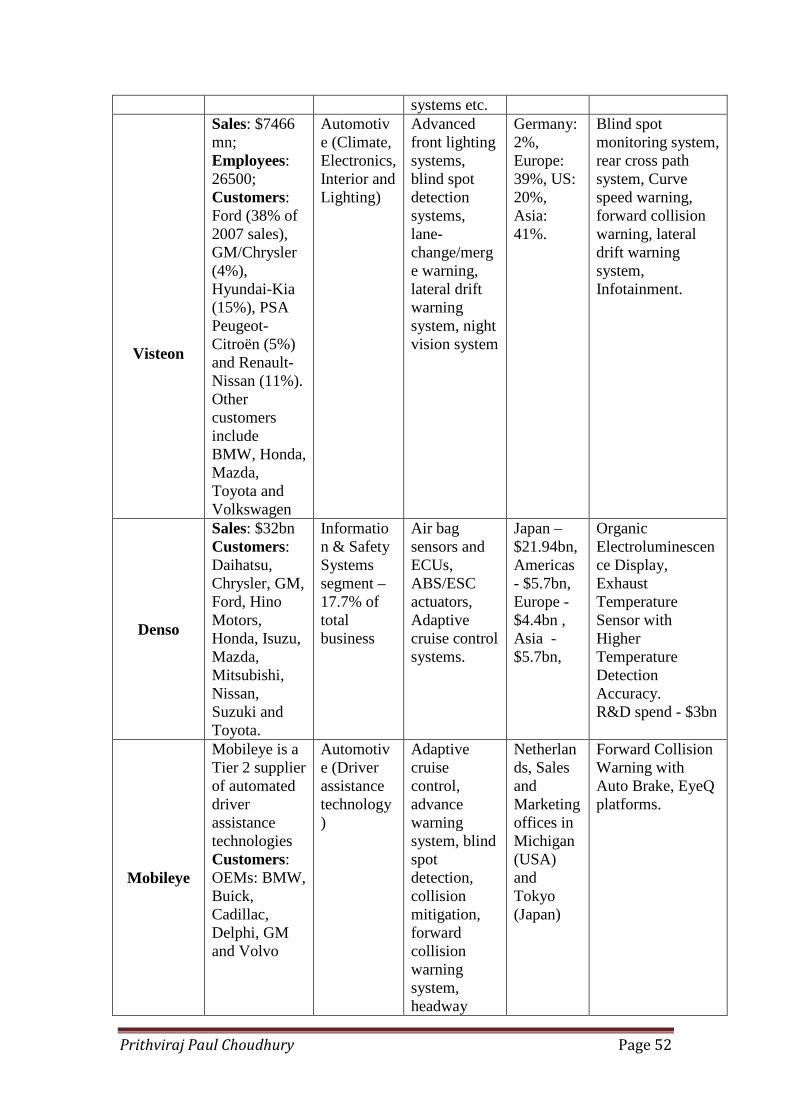
2.1.1 Automobile Safety and Software Industry
Since the introduction of electronics systems into vehicles in 60s, the main sources of
current innovation in automotive is in the field of electronics especially software
which is about 80% of the automotive industry’s functional innovation (Mossinger,
2010). Software is used to improve performance or increase safety both active and
passive and also enhances the comfort through infotainment and telematics products.
Vehicle software has to be highly reliable with failure rate of about one part per
million in a year (Mossinger, 2010). Nowadays vehicles contain several electronic
control units (ECUs) that are interconnected by standardized bus systems which
increase the complexity of the automobile functioning. Mid-sized cars have around 50
ECUs and a high end luxury models have more than 80 ECUs (Mossinger, 2009). The
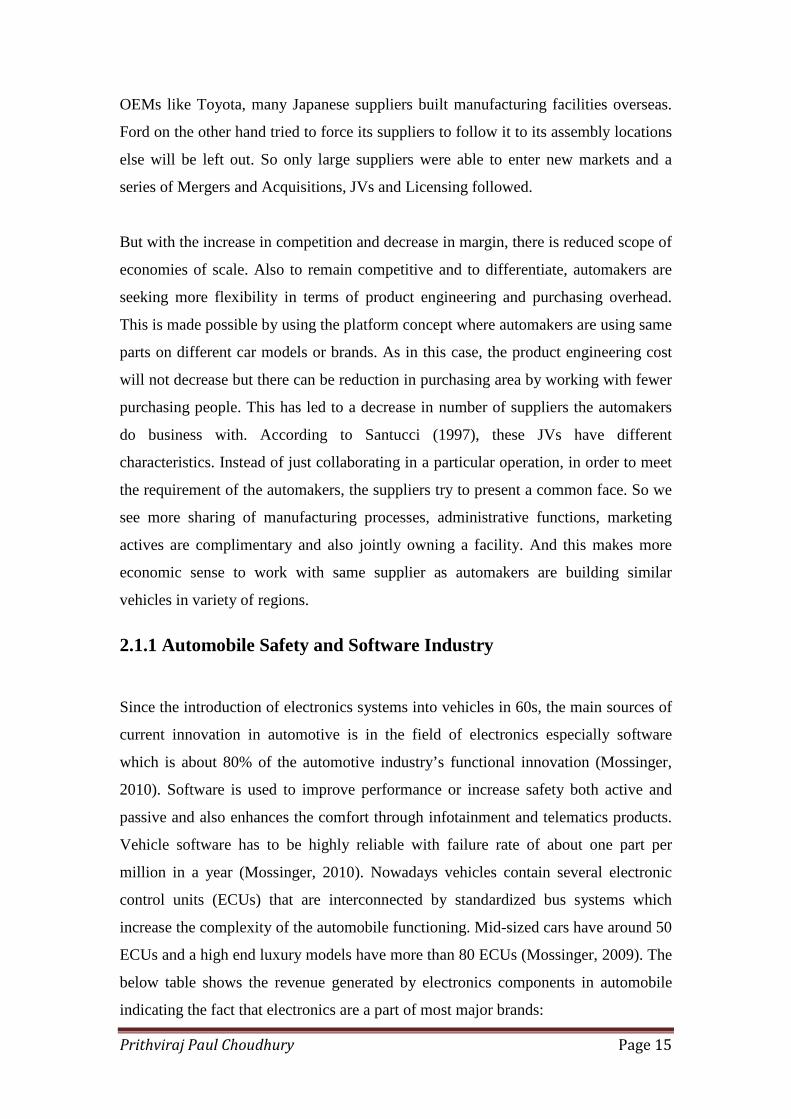
below table shows the revenue generated by electronics components in automobile
indicating the fact that electronics are a part of most major brands:
Prithviraj Paul Choudhury Page 16
Fig 1: Automotive Revenue for Semi-conductor Companies
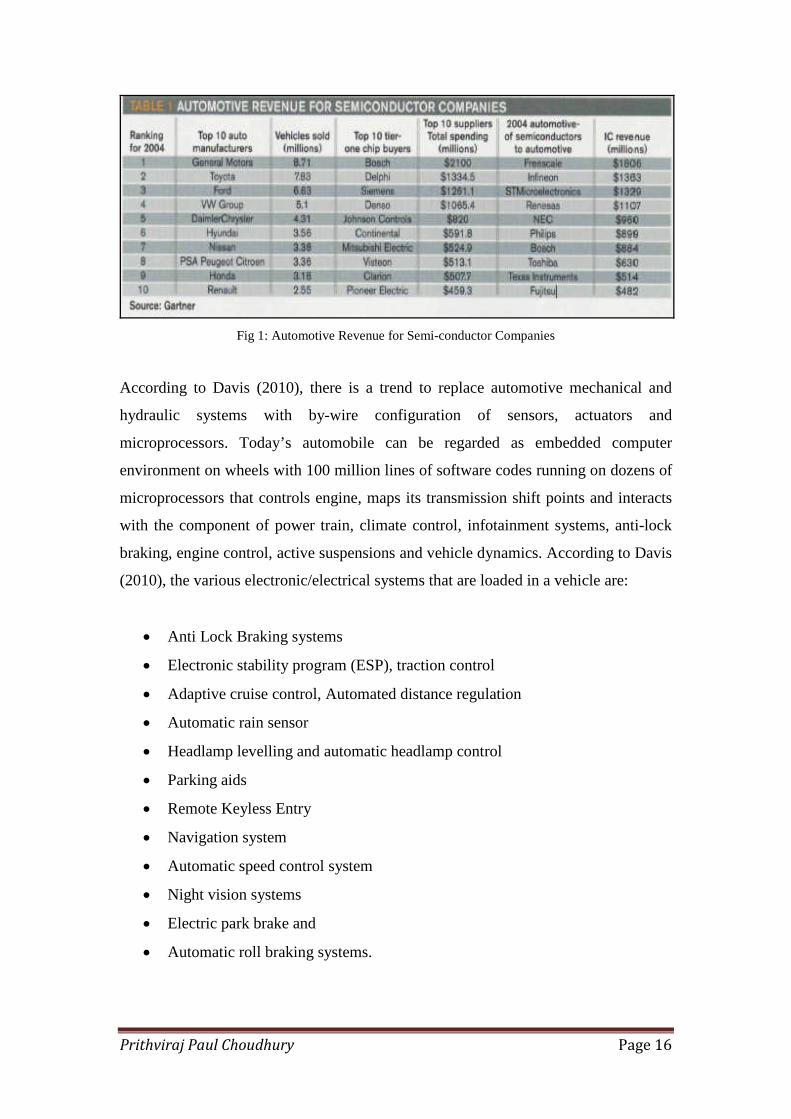
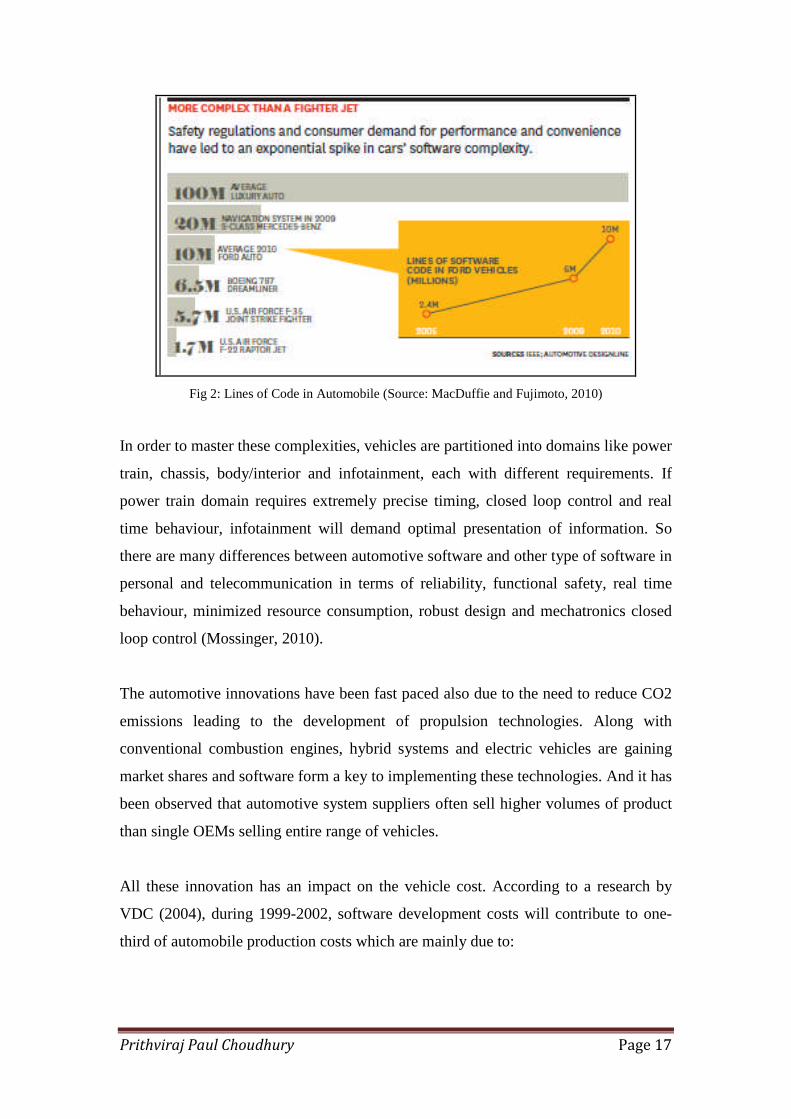
According to Davis (2010), there is a trend to replace automotive mechanical and
hydraulic systems with by-wire configuration of sensors, actuators and
microprocessors. Today’s automobile can be regarded as embedded computer
environment on wheels with 100 million lines of software codes running on dozens of
microprocessors that controls engine, maps its transmission shift points and interacts
with the component of power train, climate control, infotainment systems, anti-lock
braking, engine control, active suspensions and vehicle dynamics. According to Davis
(2010), the various electronic/electrical systems that are loaded in a vehicle are:
Anti Lock Braking systems
Electronic stability program (ESP), traction control
R&D activities(includingengineering) wereapproximately$1.0 billion.Delphi seeks tomaintain R&Dactivities(includingengineering) in amore focusedproduct portfolioand to allocate thecapital and
Prithviraj Paul Choudhury Page 49
(11.7%)andAutomotive HoldingsGroup(7.5%)
Gas EngineManagementSystems,ClimateControl &PowertrainCooling.
resources to thoseproducts withdistinctivetechnologies andgreater electronicscontent.
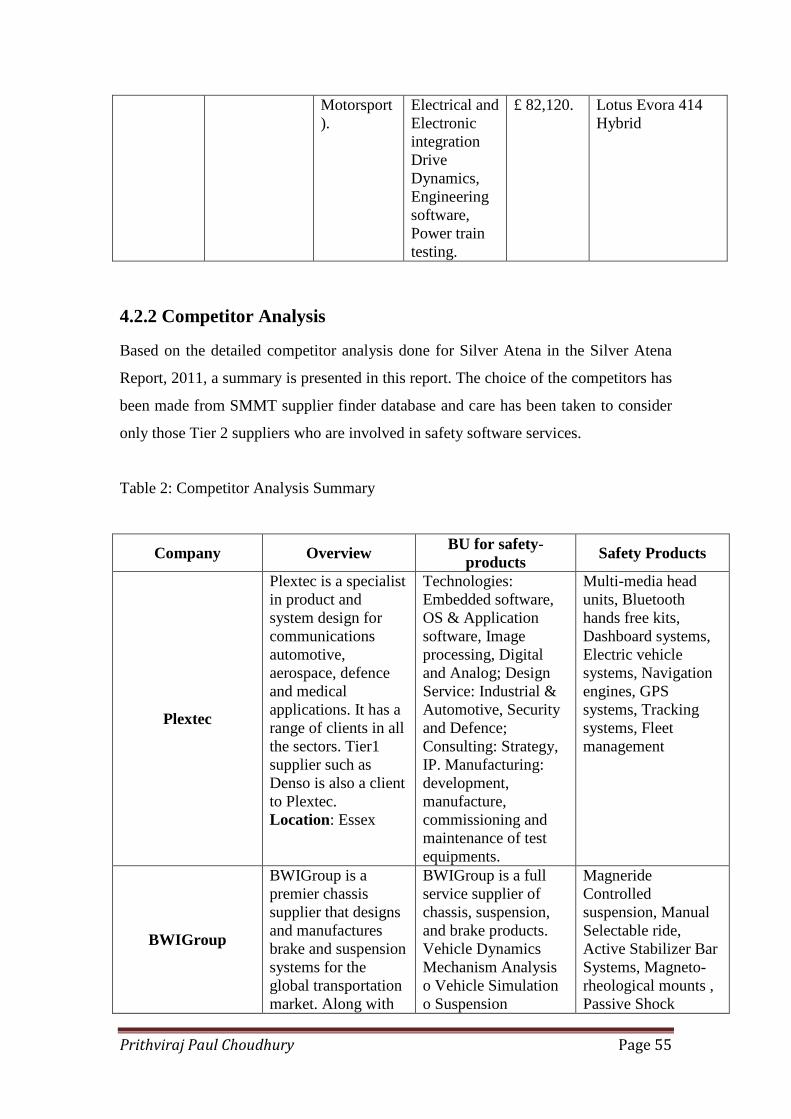
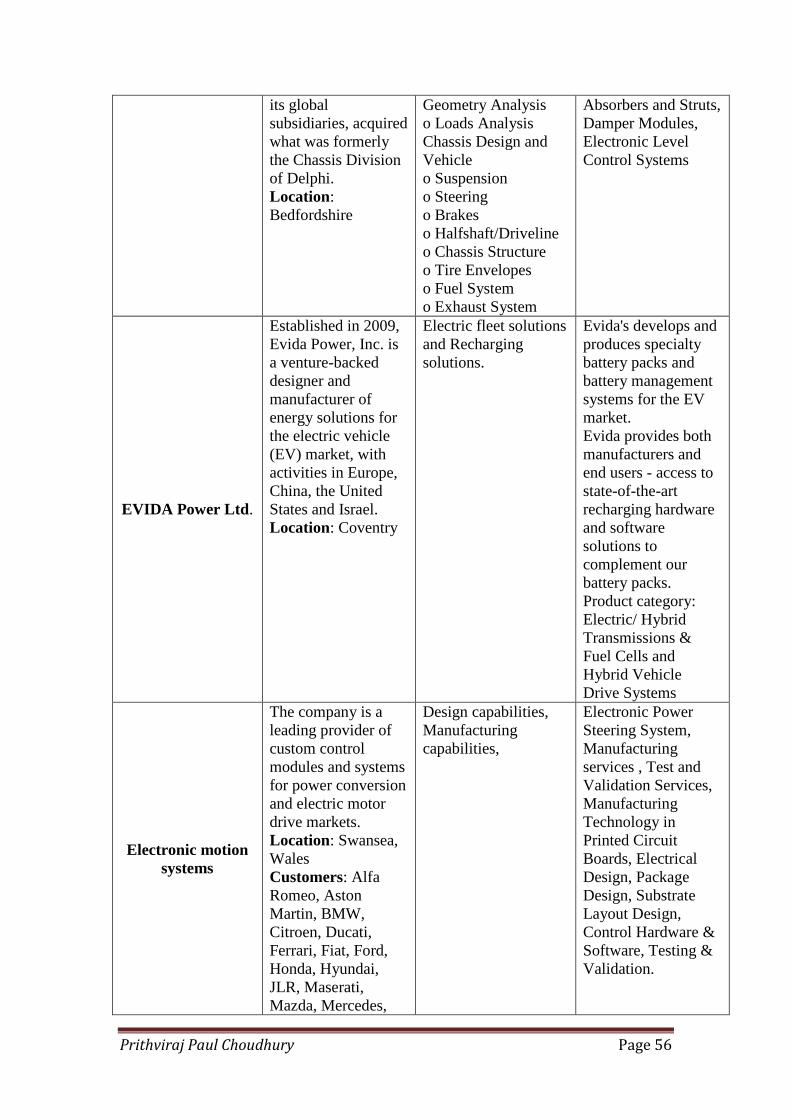
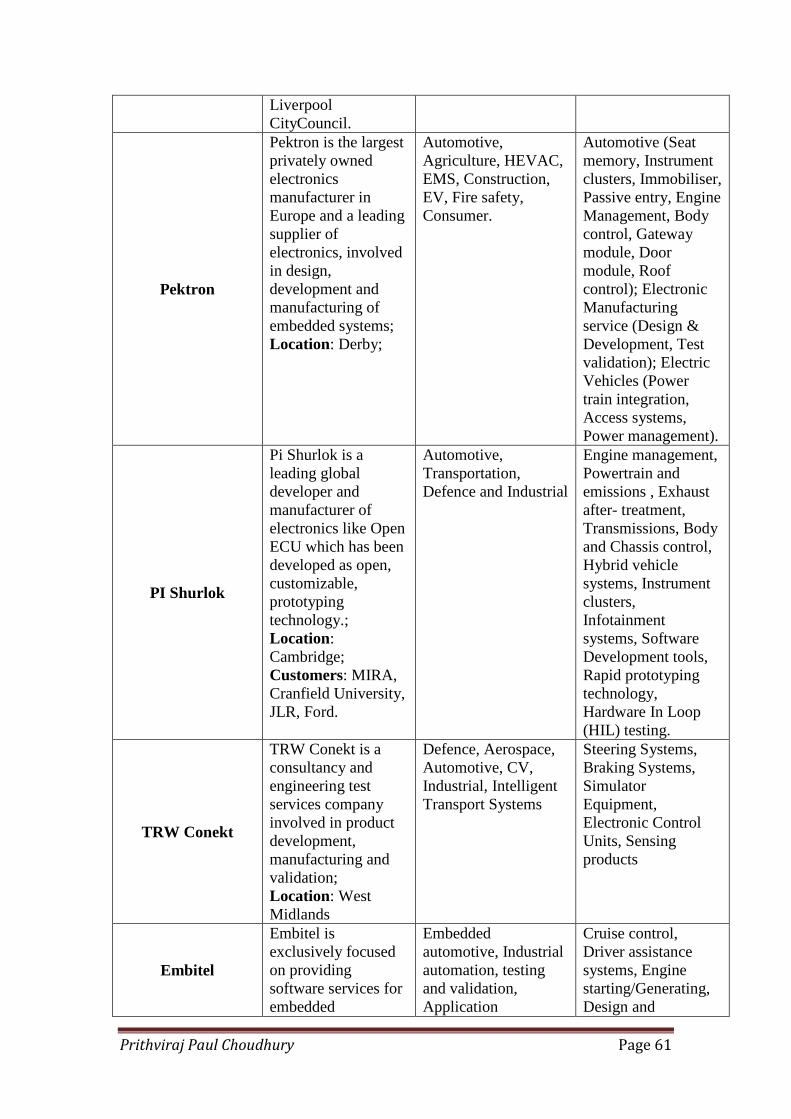
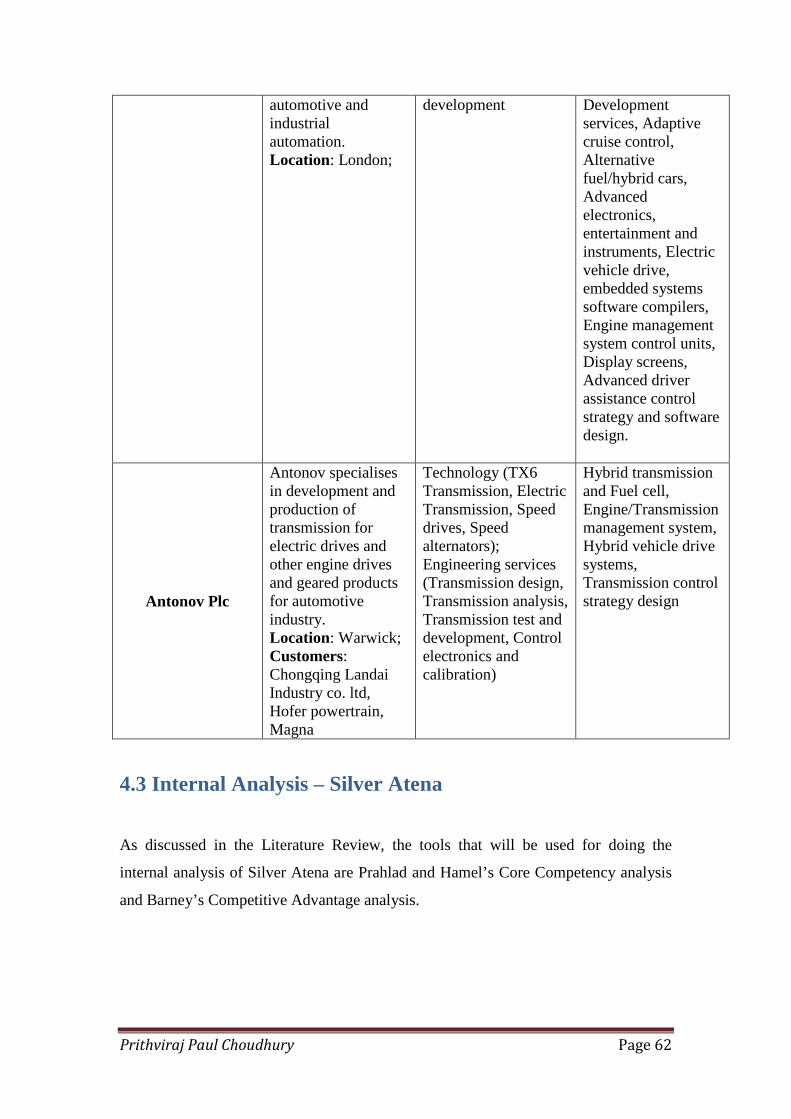
Based on the detailed competitor analysis done for Silver Atena in the Silver Atena
Report, 2011, a summary is presented in this report. The choice of the competitors has
been made from SMMT supplier finder database and care has been taken to consider
only those Tier 2 suppliers who are involved in safety software services.
Table 2: Competitor Analysis Summary
Company OverviewBU for safety-
productsSafety Products
Plextec
Plextec is a specialistin product andsystem design forcommunicationsautomotive,aerospace, defenceand medicalapplications. It has arange of clients in allthe sectors. Tier1supplier such asDenso is also a clientto Plextec.Location: Essex
Absorbers and Struts,Damper Modules,Electronic LevelControl Systems
EVIDA Power Ltd.
Established in 2009,Evida Power, Inc. isa venture-backeddesigner andmanufacturer ofenergy solutions forthe electric vehicle(EV) market, withactivities in Europe,China, the UnitedStates and Israel.Location: Coventry
Electric fleet solutionsand Rechargingsolutions.
Evida's develops andproduces specialtybattery packs andbattery managementsystems for the EVmarket.Evida provides bothmanufacturers andend users - access tostate-of-the-artrecharging hardwareand softwaresolutions tocomplement ourbattery packs.Product category:Electric/ HybridTransmissions &Fuel Cells andHybrid VehicleDrive Systems
Electronic motionsystems
The company is aleading provider ofcustom controlmodules and systemsfor power conversionand electric motordrive markets.Location: Swansea,WalesCustomers: AlfaRomeo, AstonMartin, BMW,Citroen, Ducati,Ferrari, Fiat, Ford,Honda, Hyundai,JLR, Maserati,Mazda, Mercedes,
DTAfast producestate of the artcompetition enginemanagement systemsand accessories.DTAfast designs andmanufactures enginemanagement systemsfor spark ignitionengines. It alsoprovides a full rangeof temperaturesensors, crankshaftsensors and wheels,pressure sensors etc.The systems aredesigned to be fittedto almost any engine.Location: SalfordCustomers: AstonMartin, Ford,Volkswagen,Vauxhall, Peugeot,Porsche, Nissan,Mercedes,Mitsubishi, Honda,Lexus, Ferrari,Citroen, HarleyDavidson, Renault,Suzuki, Toyota,Volvo
Bluestreak offersreplacements ofengine managementsystems, ABSmodules and Airflow meters. Thecompany was thenfully aquired byStandard MotorProducts Europe in2010Location:Nottingham
Product categories:Electronic FuelInjection , ElectronicFuel Injection ECUs,Engine/ TransmissionManagement Systems,Engine ManagementSystem Control Units,Engine ManagementSystem SoftwareDevelopment, EngineManagement Systems,Fuel Injection System,Throttle Body System
ECU and Airflowmeter.
Prithviraj Paul Choudhury Page 58
Assemblies.
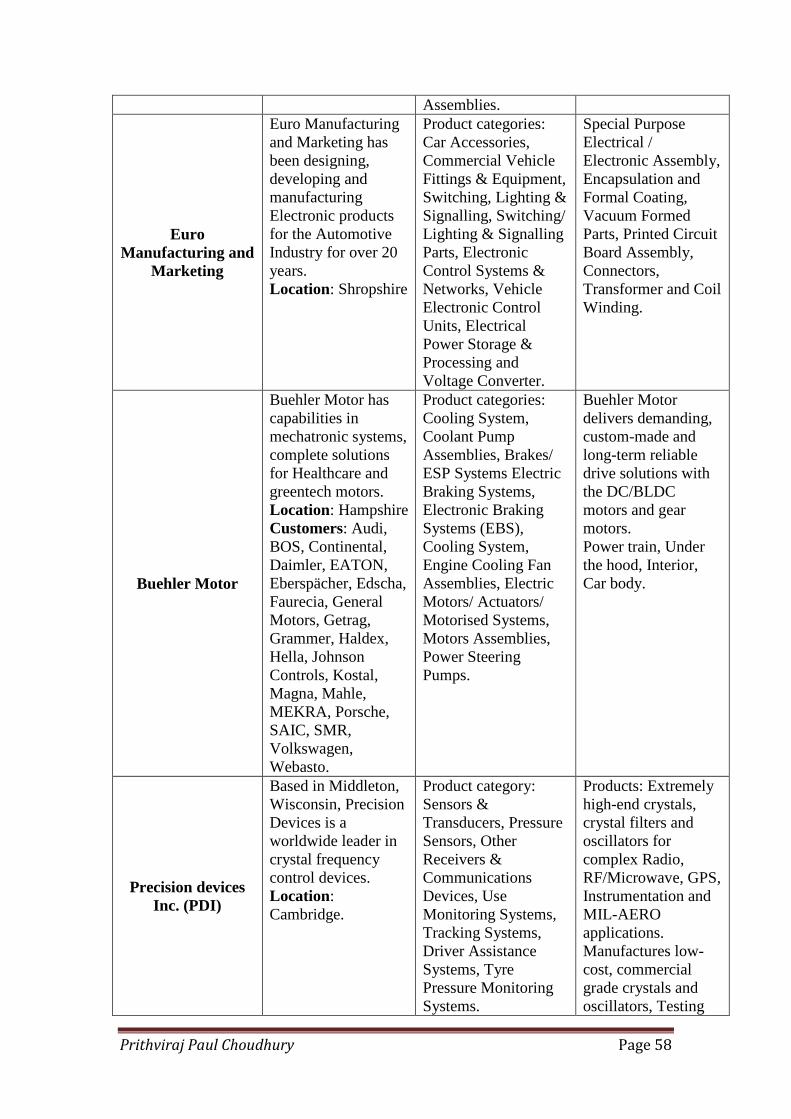
EuroManufacturing and
Marketing
Euro Manufacturingand Marketing hasbeen designing,developing andmanufacturingElectronic productsfor the AutomotiveIndustry for over 20years.Location: Shropshire
Displays, EngineManagementSystems,Transmission ControlSystems (Clutchcontrol, Activedifferential control,Active damping);Software (Calibrationand Data analysis)
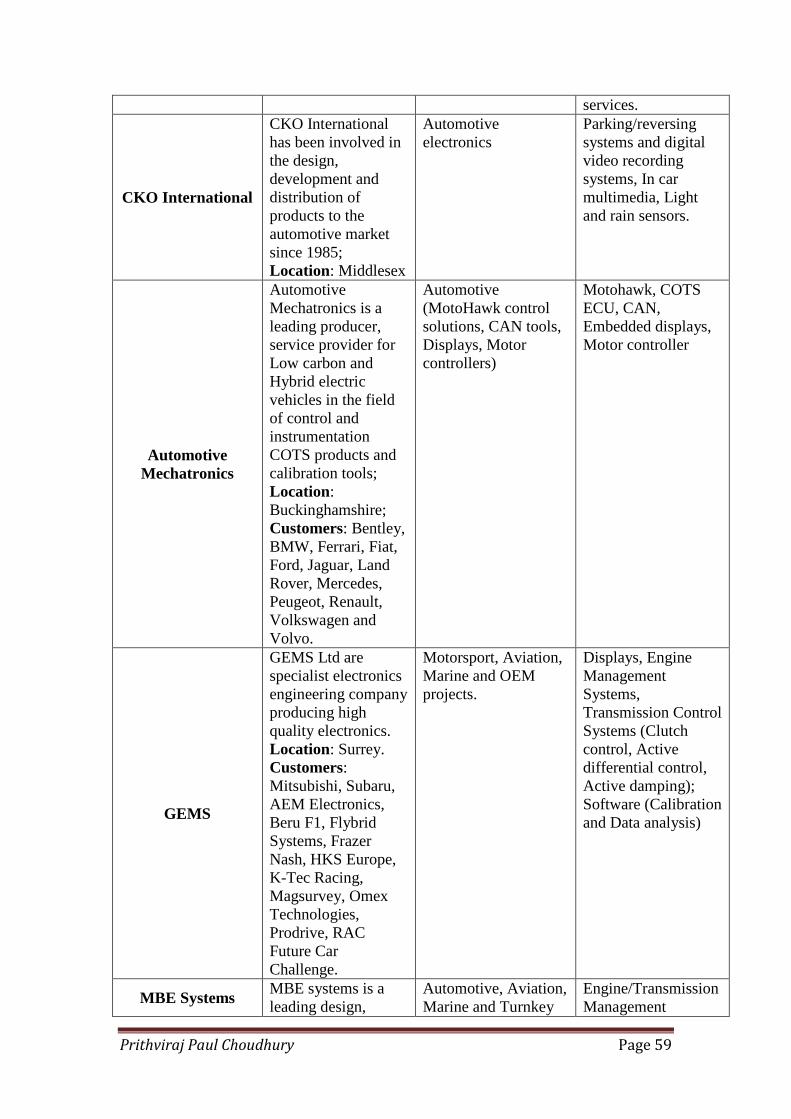
MBE SystemsMBE systems is aleading design,
Automotive, Aviation,Marine and Turnkey
Engine/TransmissionManagement
Prithviraj Paul Choudhury Page 60
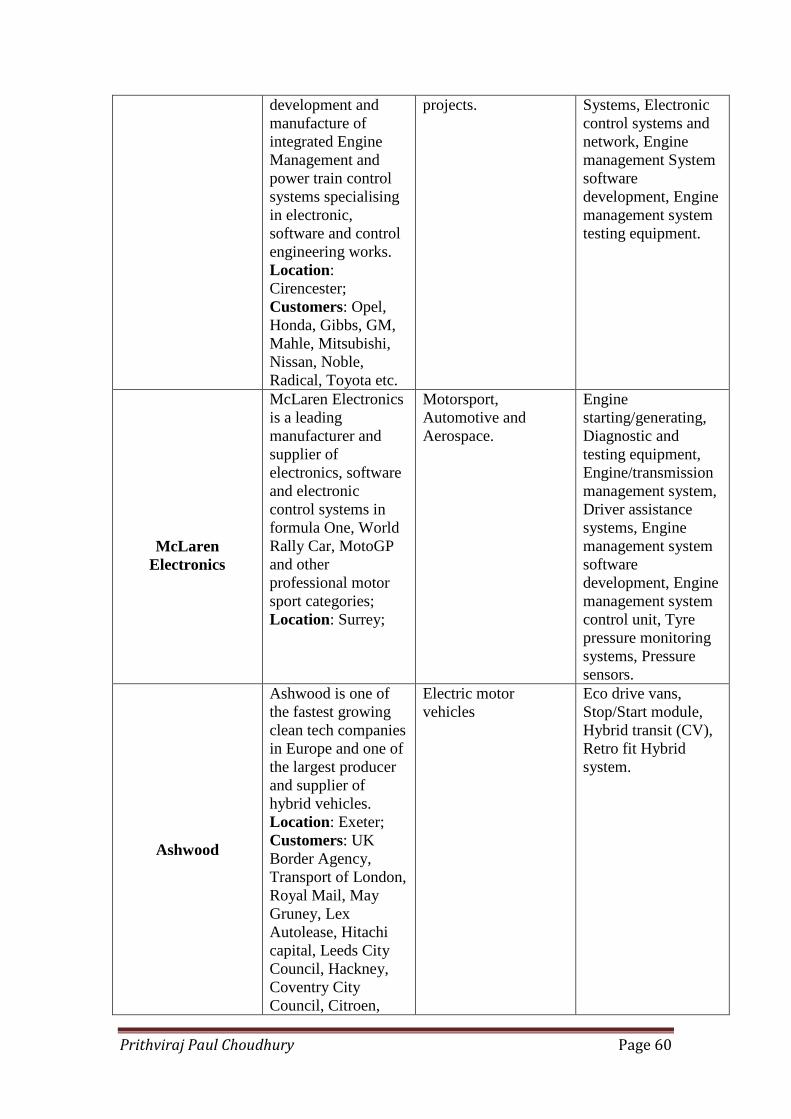
development andmanufacture ofintegrated EngineManagement andpower train controlsystems specialisingin electronic,software and controlengineering works.Location:Cirencester;Customers: Opel,Honda, Gibbs, GM,Mahle, Mitsubishi,Nissan, Noble,Radical, Toyota etc.
projects. Systems, Electroniccontrol systems andnetwork, Enginemanagement Systemsoftwaredevelopment, Enginemanagement systemtesting equipment.
McLarenElectronics
McLaren Electronicsis a leadingmanufacturer andsupplier ofelectronics, softwareand electroniccontrol systems informula One, WorldRally Car, MotoGPand otherprofessional motorsport categories;Location: Surrey;
Ashwood is one ofthe fastest growingclean tech companiesin Europe and one ofthe largest producerand supplier ofhybrid vehicles.Location: Exeter;Customers: UKBorder Agency,Transport of London,Royal Mail, MayGruney, LexAutolease, Hitachicapital, Leeds CityCouncil, Hackney,Coventry CityCouncil, Citroen,
Electric motorvehicles
Eco drive vans,Stop/Start module,Hybrid transit (CV),Retro fit Hybridsystem.
Prithviraj Paul Choudhury Page 61
LiverpoolCityCouncil.
Pektron
Pektron is the largestprivately ownedelectronicsmanufacturer inEurope and a leadingsupplier ofelectronics, involvedin design,development andmanufacturing ofembedded systems;Location: Derby;
Automotive,Agriculture, HEVAC,EMS, Construction,EV, Fire safety,Consumer.
Pi Shurlok is aleading globaldeveloper andmanufacturer ofelectronics like OpenECU which has beendeveloped as open,customizable,prototypingtechnology.;Location:Cambridge;Customers: MIRA,Cranfield University,JLR, Ford.
Some of these bodies maintain list of suppliers which provide a easy way to be
searched by any buyer. Associating with some of these repositories by publishing
technical paper with them will enhance branding of Silver Atena in the auto
component market. Membership with auto industry trade associations like
Automotive Council, Society of Motor Manufacturers and Traders (SMMT),
European Automobile Manufacturer Association, Automotive Distribution Federation
provide opportunities to meet prospective buyers and competitors during various
events.
One of the basic memberships that Silver Atena should take is with SMMT which will
place it in the automotive supplier finder (ASF) database, a repository used by most
buyers and suppliers in UK. As discussed in the PESTLE analysis, events like ‘Meet
the Buyers’ will be an excellent opportunity for Silver Atena to strengthen its ties with
prospective clients.
Based on the market complexity, as learnt from the literature review and the strengths
that Silver Atena possesses, a customer value proposition has been developed that
highlights the market needs and the solutions offered by Silver Atena. The following
diagram depicts the summary:
Prithviraj Paul Choudhury Page 83
Fig 16: Customer Value Proposition (Source: Author’s own diagram)
Based on the literature review and data analysis, the market wants could be clearly
identified under the following five heads:
Cost of products and services
Quality Standards
Proximity
Customer Satisfaction
Indigenous products/services.
The offerings from Silver Atena have been identified based on the internal analysis
done in the previous chapters. Silver Atena has been providing their software products
and services using the offshore development model since inception. The wholly
owned Indian development centre has been working in conjunction with UK and
Spain offices to deliver low cost high quality products and services for Aerospace &
Defence and Rail sector. The same model can also be applied for UK automotive
sector that will reduce the labour cost extensively compared to other European
competitors.
Prithviraj Paul Choudhury Page 84
During to their long standing experience in safety critical services in domains like
Aerospace & Defence, Rail, Energy etc., Silver Atena has acquired various quality
and safety related accreditations that testifies its commitment to quality. It can
therefore meet the safety standards of the automotive sector easily.
One of the advantages Silver Atena has is due to its location within the UK
automotive hub that places it in close proximity with most OEMs and Tier 1s. As seen
in the literature review and the external analysis, proximity plays an important role
and manufacturers are inclined to reduce their long supply chain.
Also consistent high customer satisfaction index of Silver Atena is an
acknowledgement of good relationship management with various clients. And so
Silver Atena seems competent enough to handle the complex relationships that exist
between OEM and Tier 2 suppliers and Tier 1 and Tier 2 suppliers.
And finally, being headquartered in UK, its indigenous origin will appeal to many
buyers and Tier 1 suppliers who are looking for internal sourcing.
So in response to the final fourth question, this discussion highlights the various ways
through which Silver Atena can increase its brand awareness and that it is well
positioned to meet the needs of the market.
5.5 Challenges for Silver Atena
Software development has increasingly become global software development where
offshore developments have increased many fold in the past 10 years (Conchuir et. al
2009). And Silver Atena is no exception. Though there are many potential benefits of
Global software development and reduction in development cost due to salary saving
is the most evident one. GSD can also lead to reduced development duration due to
greater time zone effectiveness and also provides access to a larger and better skilled
developer pool. But the study has highlighted the challenges faced by GSD model in
relation to control of development process as shown below:
Prithviraj Paul Choudhury Page 85
Fig 17: Challenges in GSD model (Source: Conchuir et. al, 2009)
Though Silver Atena have been using the offshore development centre for businesses
in UK and Spain but it has to be conscious of the control, communication, and
coordination that changes with the distance type.
With replacement of mechanical or hydraulic components with ECUs, automotive
electronics have to be 100% reliable across stringent running conditions but at the
same time be low cost. Such semi-conductors are expected to work under broad range
of temperature from -40C to 125C. Automobiles employ various types of
microprocessors that store programmed lines of software code instructions, data, in
read-write and Random access memory (RAM). There has to be flawless movement
of instruction and data through the microprocessor units, RAM and external sources.
In case of automotive industry, the software/hardware must be fail safe or have a safe
back up in case of fault. Davis (2010) has pointed out that although automotive
developers may adopt solutions from non-automotive systems, the specific
requirements of the automotive industry may not be transferable which requires
Prithviraj Paul Choudhury Page 86
learning curve to solve unique problem. According to the report, the complexities
arise due to the following:
Receive inputs from many sources like sensors and timers instead of a single
interactive user or storage device.
Outputs are produced under time constraints unlike ASAP in a stationary
computer.
Continuous working under no supervision.
Must be able to able to tolerate the faults of various nodes without
jeopardising the safety of the whole vehicle.
Complexity also increases in order to restrict the interference of one embedded
computer with another.
Semiconductor and Tier 1 companies have also to conform to OEM PPAT
(production part approval process) requirements with numerous standards like
AECQ100 qualification flow, ISO9001 and ISO/TS 6949 (2002), which are quality
guidelines for Tier 2 suppliers (Santarini, 2006). Silver Atena will have to ensure
these quality accreditations are achieved before getting into the automotive sector.
According to Huhn and Schaper (2007), due to the shift in focus from chips to codes
in engineering products, companies that are accustomed to manage hardware
development now need to learn new ways of managing software development. As
compared to hardware which involves less uncertainty about system functioning,
software development involves higher complexity due to more levels of connectivity
and greater integration with other systems. The reliability of these embedded
software systems will depend on adoption of mature architectures like in case of
aerospace. In automotive industry, AUTOSTAR (Automotive Open System
Architecture) is trying to establish standards, which can manage complexity, meet
reliability standards and can be reused. This is a consortium formed by German
automakers and electronics supplier group like BMW, Bosch, Daimler Chrysler,
Seimens, Volkswagen and GM that have come up with the following architecture to
create software foundation that serves every electronically controlled component in
automotive.
Prithviraj Paul Choudhury Page 87
Fig 18: AutoStar framework (Source: Global Report: Automotive; Marsh, 2005)
Fig 19: Automotive Network Standard (Source: Global Report: Automotive; Marsh, 2005)
The challenge for Silver Atena will be to adopt AUTOSTAR and other standards in
all of their software developments that will accelerate their industry recognition and
acceptance process.
Huhn and Schaper (2007) have highlighted that software development in embedded
systems is lagging behind in the industry due to lack of software development tools.
Prithviraj Paul Choudhury Page 88
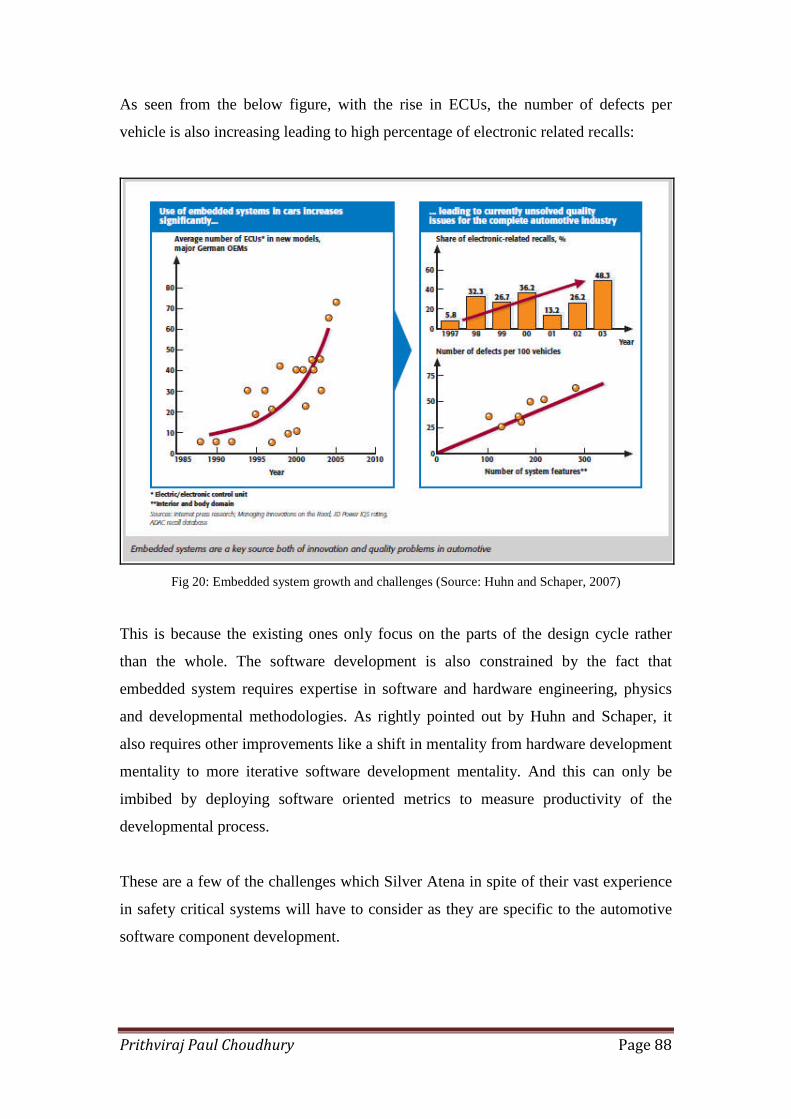
As seen from the below figure, with the rise in ECUs, the number of defects per
vehicle is also increasing leading to high percentage of electronic related recalls:
Fig 20: Embedded system growth and challenges (Source: Huhn and Schaper, 2007)
This is because the existing ones only focus on the parts of the design cycle rather
than the whole. The software development is also constrained by the fact that
embedded system requires expertise in software and hardware engineering, physics
and developmental methodologies. As rightly pointed out by Huhn and Schaper, it
also requires other improvements like a shift in mentality from hardware development
mentality to more iterative software development mentality. And this can only be
imbibed by deploying software oriented metrics to measure productivity of the
developmental process.
These are a few of the challenges which Silver Atena in spite of their vast experience
in safety critical systems will have to consider as they are specific to the automotive
software component development.
Prithviraj Paul Choudhury Page 89
Chapter 6: Conclusion
This dissertation was aimed to provide a realistic business case for Silver Atena on the
UK auto component safety software market. In order to evaluate the market, four
research questions were designed. This research provided answer to these questions
which collectively represents the business case for Silver Atena.
Premised on the Literature Review, various tools identified for undertaking external
and internal analysis provided the framework for data collection and analysis.
Additionally, the Literature review unfolded the complex buyer-supplier relationship
in general and also provided some insight into the relationship of OEMs/Tier 1
suppliers with Tier 2 suppliers. And it was observed that in case of electronics/
electrical and software components, the involvement of Tier 2 seem more with high
level of dependency. But due to the presence of large number of small suppliers, the
competition is mostly based on price. The literature review was also beneficial as it
helped in identifying the latest developments that are taking place in safety related
components which can be classified under four major segments: power train, vehicle
control, driving assistance and infotainment & telematics.
The chapter on data analysis extended the research to identify the opportunities
present in the UK automotive market. It was observed that the UK government is
taking many initiatives to bring manufacturing back to UK which is expected to
increase internal sourcing too. And in this regard we have seen many OEMs making
commitments about specific models to be built in the UK (Auto Analysis, 2011).
Though the future looks promising, but the current condition analysed using Porter’s
framework supported by the detailed financial analysis revealed that the profitability
of the industry has been low. The main reason identified is price competition which is
due to the increasing number of players getting into the sector. Further to this, the
research has also identified the potential list of clients which Silver Atena can target
and an extensive list of competitors who will be competing for market share against
Silver Atena.
Prithviraj Paul Choudhury Page 90
In spite of these challenges which most Tier 2 suppliers are facing currently, it looks
the future will see more activities in low carbon technology field like hybrids, electric
and fuel cell where government funding is increasing and strict emission norms will
compel developments in those areas. The electric car segment and fuel cell
technology are two areas which are not explored yet and have huge potential in future.
For Tier 2 supplier like Silver Atena who has experience in developing safety related
software products and wants to get into the highly competitive component industry,
positioning themselves and partnering with companies in EV or fuel cell technology
might provide an easy entry into the automotive sector. This call for further research
in this area and the current research can be extended further to focus on the
opportunities provided by the developments in electric or fuel cell sector.
In summary, the research concludes that the current auto component market is not
attractive but the future looks bright for companies pursuing EV or fuel cell
technology.
Prithviraj Paul Choudhury Page 91
References
Altera (2011), ‘Automotive Industry Trends’, Altera, Downloaded fromhttp://www.altera.com/end-markets/auto/industry/aut-industry.html as at 21st June,2011
Amaratunga, D., Baldry, D., Sarshar, M. and Newton, R. (2002). ‘Quantitative andqualitative research in the built environment: application of “mixed” researchapproach’, Work Study, Vol. 51 (1), pp. 17 – 31.
Ames, B.B. (2002), ‘Automobile take nibbles out of PLM’, Design News, Vol. 58Issue 19, p32
APMG (2011), ‘Driving growth: Future challenges and opportunities for UKAutomotive’, All-party Parliamentary Motor Group
Appleby, C., Twigg, D. (1988), ‘CAD diffusion in the West Midlands autocomponent industry’, Centre for Industrial Studies, The Polytechnic Wolverhampton,Wolverhampton, U.K
Auto Analysis (2011), ‘The UK Automotive Industry: Invest Now’, March 2011
Automotive Council, 2011, ‘Growing the Automotive Supply Chain forward’,Automotive Council UK
Banks S. (2010), ‘Current and Future Trends in the Automotive Industry’, Oracle,November, 2010. Downloaded fromhttp://www.oracle.com/us/corporate/profit/opinion/102910-banks-190918.html as at21st June, 2011
Barney, J. (1991), ‘Firm Resources and Sustained Competitive Advantage’, Journalof Management, 1991, Vol. 17, pp. 99-120
Beaver, W., Kettler, P. and Scholes, M. (1970), ‘The association between marketdetermined and accounting determined risk measures’, The Accounting Review, Vol.XLV, October 1970, pp. 654-82
[BKM] Bodie Z., Kane A. and Marcus A.J. (2008), Investments, Seventh Edition,McGraw Hill International Edition.
Bowman, R.G. and Bush, S.R. (2006), ‘Using Comparable Companies to estimate theBeat of Private Companies’, Journal of Applied Finance, Fall/Winter, 2006, pp. 71-81
Prithviraj Paul Choudhury Page 92
Brownlie D. (1999), ‘Environmental Analysis’ in Baker M J ed, Encyclopaedia ofMarketing, International Thomson Business Press, Oxford, pp. 238-250.
Conchuir E., Agerfalk, P.J., Olsson, H.H. and Fitzgerald, B. (2009), ‘Global SoftwareDevelopment: Where are the benefits?’, Communication of the ACM, August, 2009
Cook, T. D. and Reichardt, C. S. (1981). ‘Qualitative and Quantitative Methods inEvaluation Research’, Educational Researcher, Vol. 10 (7), pp. 29 – 30.
Curtis, S., Gesler, W., Smith, G. and Washburn, S. (2000). ‘Approaches to samplingand case selection in qualitative research: examples in the geography of health’,Social Science and Medicine, Vol. 50, pp. 1001 – 1014.
Davis, S. (2010), ‘EMC poses challenges for automotive electronics’, PowerElectronics Technology, May 2010
Deshpande, R. (1983). ‘“Paradigms Lost”: On Theory and Method in Research inMarketing.’, The Journal of Marketing, Vol. 47 (Fall), pp. 101 – 110.
Dyer, J. (1998), ‘Strategic Supplier Segmentation: the next ‘best practice’ in supplychain management’, California Management Review, Vol. 40, No. 2, pp. 57-77
Dyer, J.H. and Ouchi, W.G. (1993), ‘Japanese-style partnerships: giving companies acompetitive edge’, Sloan Management Review, Fall, pp. 51-63
Easterby-Smith, M. (1991), ‘Management Research: An Introduction’, London: SagePublications.
Euromonitor (2010), ‘Motor Vehicles, Trailers and Semi trailers in the UnitedKingdom: ISIC 34’, Euromonitor International, October 2010.
Fama, E.F. and French, K.R. (1992), ‘The cross section of expected stock returns’,Journal of Finance, 47(2), pp. 427-65
Fama, E.F. and French, K.R. (1996), ‘The CAPM is wanted dead or alive’, Journal ofFinance, 51(5), pp. 1947-58
Gombola & Ketz (1983), ‘Financial ratio Pattern in Retail and ManufacturingOrganisations’, Financial Management, Summer83, Vol. 12 Issue 2, p45-56
Hamada, R.S. (1972), ‘The effect of the firm’s capital structure on the systematic riskof common stocks’, Journal of Finance, Vol. XXVII, May 1972, pp. 435-52
[HRWJJ (2010)] Hiller D., Ross S., Westerfield R., Jaffee J. and Jordan B. (2010),Corporate Finance, First European Edition, McGraw Hill
Holweg M., Davies P. and Podpolny D. (2009), ‘The competitive status of the UKautomotive industry’, PICSIE Books
Prithviraj Paul Choudhury Page 93
Huhn, W. and Schaper, M. (2007), ‘Code and Chips’, IET Computing and ControlEngineering, April/May 2007
IMI Report (2009), ‘Skills Priorities for the Automotive Retail Sector- UnitedKingdom’, IMI Research Department, November, 2009
Isakov, D. (1999), ‘Is beta still alive? Conclusive evidence from the Swiss stockmarket’, The European Journal of Finance, Vol. 5, pp. 202-212
Jarrat, D. G. (1996). ‘A comparison of two alternative interviewing techniques usedwithin an integrated research design: a case study in out shopping using semi-structured and non-directed interviewing techniques.’ Marketing Intelligence &Planning, Vol. 14 (6), pp. 6 –15
Jegadeesh, N. (1992), ‘Does market really explain the size effect?’, Journal ofFinance and Quantitative Analysis, 27(3), pp. 337-51
Kamath, R.R. and Liker, J.K. (1990), ‘Supplier dependence and innovation: Acontingency model of Suppliers’, Innovative Activities, Journal of Engineering andTechnology Management, Vol. 7, pp. 111-127
Kast, F.E. and Rosenweig, J.E. (1974), ‘Organisation and management: A SystemApproach’, 2nd Edition, Maidenhead, McGraw-Hill
Lieb, R. and Wiseman, F. (2001), ‘Public attitude towards automobile safety issues’,Transportation Journal, Spring 2001, pp. 26-32
Lintner, J. (1965), ‘Security Prices, Risk and maximal gains from Diversification’,Journal of Finance, Vol. XX (December 1965), pp.587-681)
MacDuffie, J.P. and Fujimoto, T. (2010), ‘Why dinosaurs will keep ruling the autoindustry’, Harvard Business Review, June 2010, pp. 23-25
Mamoto, T. (2005), ‘Japanese automotive goes horizontal’, EDN Europe, November2005, Vol. 50, Issue 11, pp. 24-24
Marsh, D. (2005), ‘Engines of Change’, EDN Europe, July (2005), Vol. 50, Issue 7,pp. 58-62
Marshall, M. N. (1996). ‘Sampling for qualitative research.’ Family Practice, Vol. 13 (6),pp. 522 – 525.
McCartt, A. (2011), ‘The future of auto safety’, Canadian Underwriter, May 2011
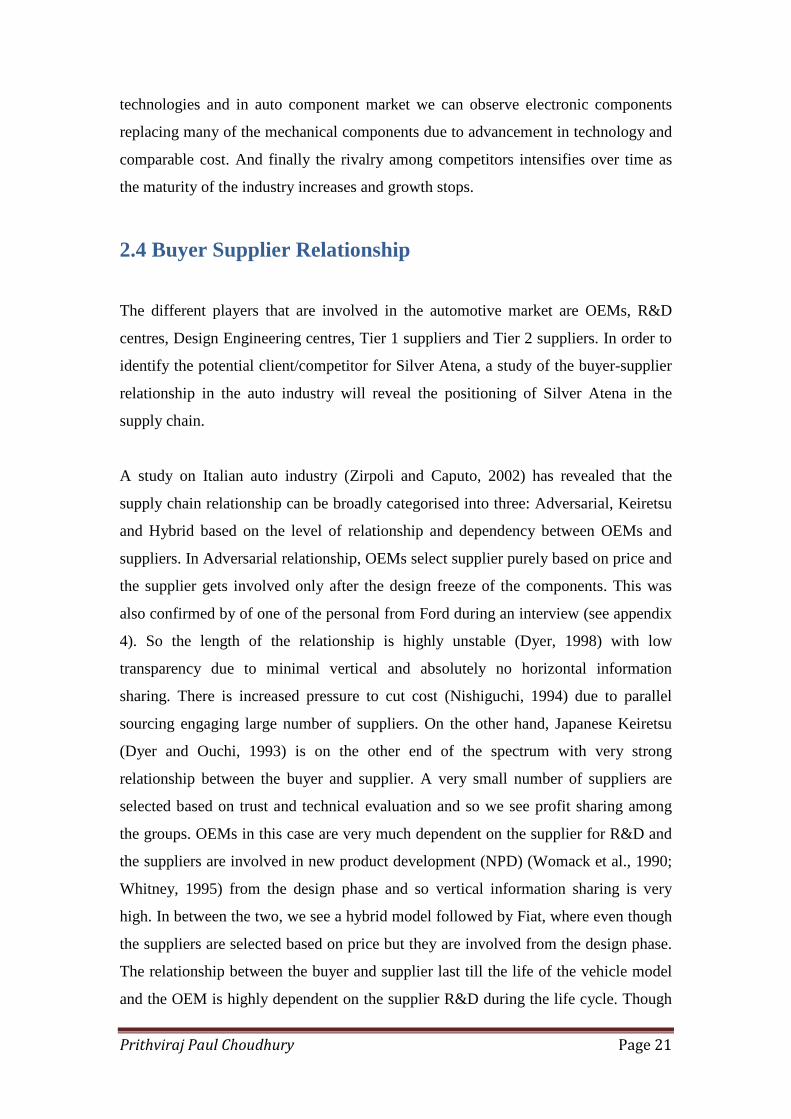
Mondragon, A.E.C. and Lyons, A.C. (2008), ‘Investigating the implication ofextending synchronized sequencing in the automotive supply chain: the case of
Prithviraj Paul Choudhury Page 94
suppliers in European automotive sector’, International Journal of ProductionResearch, Vol. 46, Issue. 11, pp. 2867-2888
Mossinger, J. (2009), ‘Standard Practice’, Automotive Engineering, ProfessionalEngineering Publishing, April 2009
Mossinger, J. (2010), ‘Software in Automotive Systems’, IEEE Software,March/April 2010, Vol 27, Issue 2, pp. 92-94
Myers, S.C. (1977), ‘The relation between real and financial measures of risk andreturn’, in Irwin Friend and James L. Bicksler, editors, Risk and Return in Finance,Cambridge, Mass: Ballinger Publishing Company, 1977, pp. 49-80
NAIGT (2007), ‘An Independent Report on the future of the Automotive Industry inthe UK’, New Automotive Innovation and Growth Team
Net News Publisher (2011), ‘British Car Industry Shows Its Strength to EuropeanChiefs’, Net News Publisher, 9th June, 2011. Downloaded from Source:http://www.netnewspublisher.com/british-car-industry-shows-its-strength-to-european-chiefs/ as at 22nd June, 2011
Nishiguchi, T. (1994), ‘Strategic Industrial Sourcing, Oxford University Press, NewYork
Patton, M. Q. (1978), ‘Utilization-Focused Evaluation’, Beverly Hills, C. A.: Sage.
Pettengill, G.N., Sundaram, S. and Mathur, I. (1995), ‘The conditional relationbetween beta and returns’, Journal of Financial and Quantitative Analysis, 30(1), pp.101-16
Pettit, R. and Westerfield, R. (1972), ‘A model of capital asset risk’, Journal ofFinance and Quantitative Analysis, Vol. VII, March 1972, pp. 1649-1668
Porter, M.E. (2008), ‘The Five Competitive Forces that Shape Strategy’, HarvardBusiness Review, January 2008, pp. 78-93
Prahlad, C.K. and Hamel, G. (1990), ‘The Core Competency of the Corporation’,Harvard Business Review, May-June 1990, pp. 79-91
Rubinstein, M. (1973), ‘A Mean variance synthesis of corporate financial theory’,Journal of Finance, Vol. 28, pp. 167-181
Salomon, G. (1991). ‘Transcending the Qualitative - Quantitative Debate: TheAnalytic and Systemic Approaches to Educational Research’, EducationalResearcher, Vol. 20 (6), pp. 10 – 18.
Santarini, M. (2006), ‘Design challenges’, EDN, Reed Business Information, January2006
Prithviraj Paul Choudhury Page 95
Santucci, M. (1997), ‘Executive Insights: Globalization of Auto parts industry’,Journal of International Marketing, Vol. 5, No. 3, 1997, pp. 85-89
Sharpe, W.F. (1964), ‘Capital Asset Prices: A theory of market equilibrium underconditions of risks’, Journal of Finance, Vol. XIX (September, 1964), pp. 425-442
Silver Atena Report (2011), ‘Silver Atena Report: the UK Automotive ComponentMarket Review’, MBA Management Project, University of Nottingham, September,2011
SMMT (2011), ‘The Society of Motor Manufacturers and Traders motor industryfacts 2011’, SMMT
Turnbull, P., Oliver, N. and Wilkinson, B. (1992), ‘Buyer supplier relations in UKautomotive industry: strategic implication of Japanese manufacturing model’,Strategic Management Journal, Vol. 13, pp. 159-168
Turnbull, S.M. (1977), ‘Market value and Systematic Risk’, Journal of Finance, Vol.XXXII, September 1977, pp. 1125-42
UKTI Report (2010), ‘Big names lead the UK's low carbon transport transition’, UKTrade and Investment, 9th Nov, 2010. Downloaded fromhttp://www.ukti.gov.uk/uktihome/item/116881.html as at 18th July, 2011
VDC (2004), ‘Automotive embedded software development costs increase’, TechKernels
Wasti, S.N. and Liker, J.K. (1997),‘Risky business or competitive power? Supplierinvolvement in Japanese product design’, J Prod Innov Manag, Elsevier Science Inc,1997, Vol. 14, pp. 337-355
Whitney, D.E. (1995), ‘Nippondenso Co. Ltd; a case study of strategic product’, inJ.K. Liker and J.C. Campbell, Engineering in Japan: Organisation and Technology,Oxford University Press, New York, NY
Womack, J.P., Jones, D.T. and Ross, D. (1990), ‘The machine that changed theworld’, Rawson Associates, New York, NY
Zirpoli, F. and Caputo, M. (2002), ‘The nature of buyer-supplier relationships in co-design activities’, International Journal of Operations and Production Management,Vol. 22, No. 12, 2002, pp. 1389-1410
Prithviraj Paul Choudhury Page 96
Appendices
Appendix 1: PESTLE Analysis
Political
Various studies show that till now UK government and public have been less
protective of the national industries in relation to their European counter parts.
Issues
There have been many issues mentioned by industry leaders in the past such as:
1. Government’s less supportive nature towards the industry as compared to countries
like Germany where national industries have direct and frequent contact to top
government officials (Automotive Council, 2011).
2. The availability and skill levels of the UK workforce (Automotive Council, 2011).
3. The competitiveness (and scale) of the UK supply base (Automotive Council,
2011).
4. A severe hollowing out of the industry in the past decade, with a number of
suppliers having significantly reduced their manufacturing activity in the country, or
exited the country entirely (Holweg et. al, 2009).
5. A parallel reduction in the amount of automotive R&D taking place in the UK
(Auto Analysis, 2011).
6. The perception of a lack of status of engineering in general and the automotive
industry specifically as a long-term career choice (Auto Analysis, 2011).
7. Improving the monetary and fiscal environment, especially improving the lines of
credit and financing available to the industry (Auto Analysis, 2011).
8. Lack of collaboration between the automotive sector and other high-technology
industries and the academic world (Auto Analysis, 2011).
9. Lack provision of apprenticeships and low flexibility of the UK labour market in
terms of skills and training for the industry (Auto Analysis, 2011).
Prithviraj Paul Choudhury Page 97
However, now government will encourage automotive companies by reducing
corporate tax rate and setting up regional growth funds to push money in advanced
technology, innovation centres and expanding apprenticeship and wants to bring
manufacturing and supply chain back to UK. Companies like BMW, Nissan will
invest in UK for design, engineering and production of cars (Net News Publisher,
2011). UK government has taken various other steps to revive auto sector in general
and also change public’s perception:
Steps taken by government
1. The Automotive Council was established in 2009, as a partnership between
industry and government, to consider the strategic development of the UK automotive
industry. Its role is to promote investment for upgrades to existing research and
manufacturing facilities in the UK by co-ordinating nation-wide activity and
supporting key initiatives in the UK’s automotive industry, including:
The Technology Group – strategic support for automotive research and
development, through the New Automotive Innovation and Growth Team’s
technology roadmap.
The Supply Chain Group – feeding into the Automotive Council and focused
on the development of a strong automotive supply base in the UK.
The remit of the Automotive Council is to position the UK as a compelling
investment proposition, transforming the business environment in the UK and
enabling it to secure funding for the research and development of new technology,
collaborative research and testing facilities (SMMT, 2011).
2. The IMI is the professional association for individuals working in the motor
industry. The institute is the Sector Skills Council for the automotive retail industry
and the governing body for the Automotive Technician Accreditation (ATA) scheme
(SMMT, 2011).
Prithviraj Paul Choudhury Page 98
3. RoadSafe is a road safety partnership that brings together the motor industry and
related companies, traffic engineers, the police and road safety professionals. Its
mission is to reduce road deaths and injuries by sharing knowledge and encouraging
innovation (SMMT, 2011).
4. The ‘Manufacturing Strategy 2008’ document, which despite its rather selective
reporting of KPIs, is providing the „manufacturing matters‟ message that industry has
long wanted the government to give. This document also identifies R&D as the most
the important USP of UK manufacturing firms, which in automotive terms has to be
seen in context of the sharp decline in both capital investment and R&D the UK has
seen, which will place the UK in a very weak competitive position in the long run
(Holweg et. al, 2009).
5. Cenex is an UK government initiative to promote low carbon and fuel cell
technologies and has committed to invest GBP 350 million to encourage ultra low
emission vehicles for future. It is also becoming a centre for electric car
manufacturing site with Cenex managing operations of Mitsubishi-MiEV and also
administering the launch of Toyota Plug in Hybrid. Nissan is also planning to
manufacture electric car Leaf and Toyota will manufacture its first full hybrid Auris
(UKTI Report, 2010).
All these steps taken by the government in the recent years promise to eradicate the
issues prevalent in the sector. The importance now being given by government to
automotive sector assures that investment would increase in the sector and general
competitiveness in the sector would improve, leading to increased preference of UK
auto suppliers by the OEMs.
Economic
The UK auto industry employs 194,000 people in 3,300 businesses, generating some
£10.2bn value added in 2007 i.e. the automotive manufacturing sector directly
represents around 0.8% of the UK economy in terms of value added, and directly
provides around 0.6% of total UK employment. According to 2007 data, UK auto
Prithviraj Paul Choudhury Page 99
sector is the largest single exporter and a even larger importer leaving a large net trade
deficit.
Recession in 2008 has altered the landscape of UK automotive industry. Not only
OEMs but OESs, including Tier1 and Tier2 suppliers, also have been largely affected
by the economic turndown (NAIGT, 2007; Holweg et. al, 2009).
Dynamics of OEMs and OESs in the UK auto sector
The UK automotive supply chain largely supports the vehicle programmes assembled
in the UK. At present, about 80% of all component types required for vehicle
assembly operations in the UK can be produced by the UK suppliers. However, about
one third of the value of components needed to support UK-based vehicle production
is currently purchased in the UK, while two thirds are imported (Automotive Council,
2011).
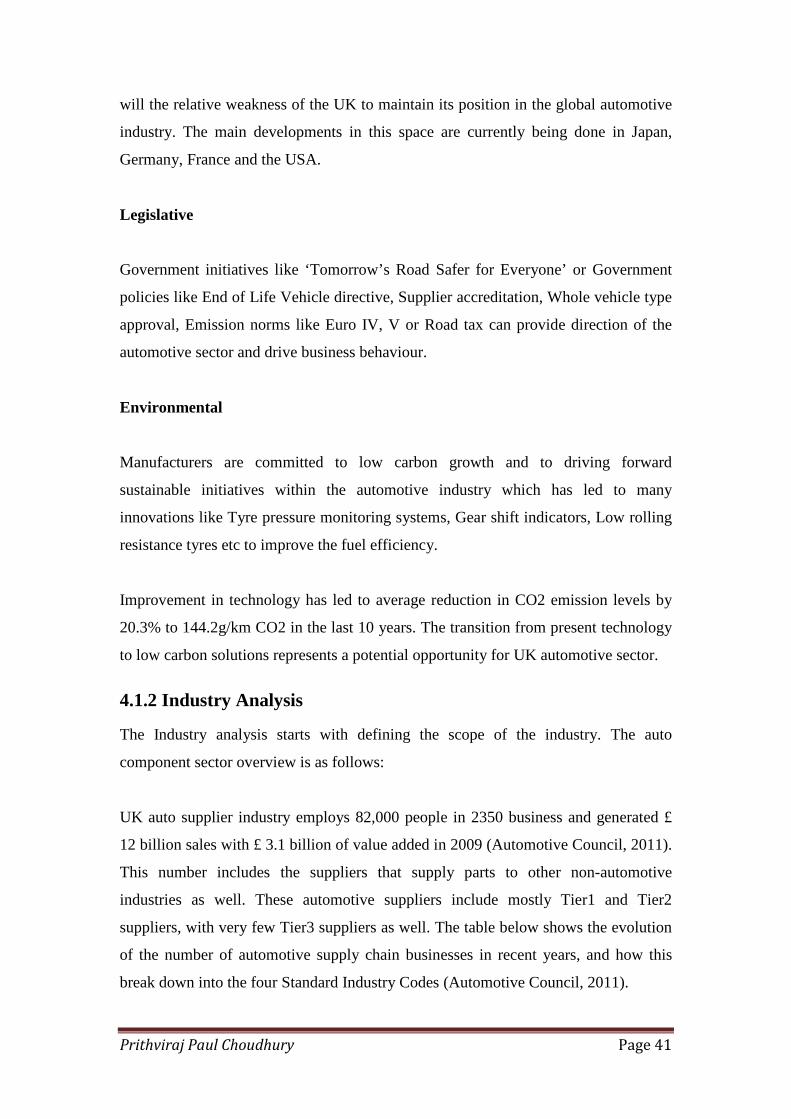
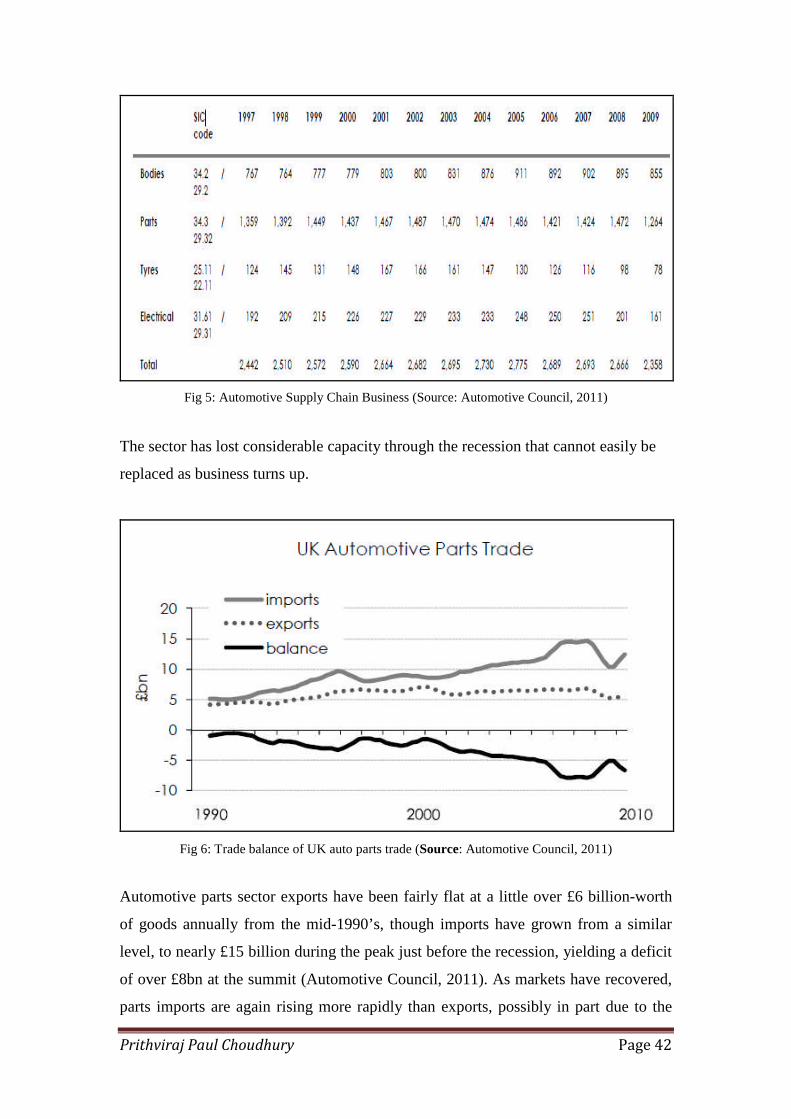
Parts/Supplier sector exports have been fairly flat at a little over £6 billion-worth of
goods annually from the mid-1990‟s, though imports have grown from a similar level,
to nearly £15 billion during the peak just before the recession, yielding a deficit of
over £8bn at the peak. As markets have recovered post recession, parts imports are
again rising more rapidly than exports, possibly in part due to the loss of capacity and
by mid-2010 the parts trade deficit was approaching £7bn on an annualised basis
(Automotive Council, 2011).
Of the entire Tier1 suppliers in the UK, 65% manufacture in the UK, while virtually
all Tier2 suppliers operate manufacturing facilities in the UK. The average supplier
(Tier1) serves six customers (median), with a strong bias towards those OEMs that
operate vehicle and engine assembly plants in the UK (Automotive Council, 2011).
Competitive advantages and disadvantages of UK suppliers
According to Automotive Council Report (2011) ‘Proximity’ was identified as the
key competitive advantage of UK suppliers: in operational terms, proximity allows
for:
Prithviraj Paul Choudhury Page 100
lower logistics cost, a better support for UK-built vehicles
a responsive and quick turnaround of configuration of parts
more flexibility to adjust to volume and product mix fluctuations.
In strategic terms proximity also acts as a general proxy for risk reduction the
supply chain and a hedge against currency fluctuations.
The key reasons why UK suppliers have lost business are:
the unit cost is not competitive
operational execution i.e. quality, cost and delivery (QCD)
financial aspects such as availability of finance and concerns over supplier
size and stability
When UK supply business is lost, about one third stays within the UK and Western
Europe, one third goes to low-cost countries, while the final third show no clear
pattern. The risk of losing business to low-cost regions rises however considerably
for second-tier suppliers. In terms of suppliers, there is a general consensus that the
UK is losing its Tier1 supplier base to continental Europe (France and Germany),
which in turn has led to a reduction in Tier2 and Tier3 suppliers in the UK. This is
leading to a ‘hollowing out’ of the supply chain. Surveys clearly show that the
decline in the level of sourcing from the UK has continued for all firms surveyed, and
is very likely to decline further over the coming five years. The loss of economies of
scale in the component supply chain is detrimental to the future of the UK automotive
industry (Automotive Council, 2011).
Opportunities created for suppliers
According to Automotive Council Report (2011) short term opportunities largely arise
where OEM sourcing needs match with strategic growth areas of UK suppliers, in
other words, where OEMs have a current need that could potentially be met from a
UK-based supplier. Here, considerable potential was identified for the ‘classic’
components sourced:
Prithviraj Paul Choudhury Page 101
1. ‘Powertrain & body’ components, where virtually all needs can theoretically be
met, with the exception of ‘heavy metals’ processing capabilities (casting, forging,
etc) that were identified as supply chain constraint by both OEM and suppliers.
2. ‘Interior and exterior’ components, where virtually all OEM needs can be matched
with supplier growth intentions.
3. ‘Electrics & electronics’ components, where some needs can be matched. Critical
parts missing are batteries and electronics (such as Electronic control unit) in general.
For instance, GM is the harbinger of change and it has already been reported that GM
plans to bring back over £130 million worth of sourcing to UK suppliers (Auto
Analysis, 2011). This might be symbolic of the way in which the industry is heading
and other vehicle companies will steadily increase UK sourcing for a variety of
reasons, including wanting to:
Minimise exposure to exchange rate fluctuations.
Minimise the vulnerabilities and costs of an extended supply chain.
Take advantage of the flexibility of the UK labour market and the generally
positive industrial relations environment.
And, crucially, take advantage of the growing expertise which the UK has in
low carbon technologies.
SMMT has launched two initiatives the Automotive Supplier Finder (ASF) database
and a series of “Meet the Buyer” network events. The Automotive Supplier Finder
(http://www.autosupplierfinder.com/) database contains information on several
thousand UK companies which enables vehicle manufacturer and Tier1 purchasing
executives to search for potential UK suppliers online. The first of the networking
event took place in July 2010 with over 90 meetings taking place between UK
suppliers and purchasing representatives (Auto Analysis, 2011).
Prithviraj Paul Choudhury Page 102
Social
The UK has competitive advantage in terms of labour flexibility as compared to
Western Economies though less compared to Eastern Europe and BRIC economies.
The R&D tax benefits, personal tax and tariffs are also competitive with respect to
other European countries. The UK also has better customer service as compared to
other European and BRIC economies. The most salient weakness that came out was
the labour cost and lack of skilled labour which is more pronounced in the mid
management level. UK is perceived to be more competitive than FGIS (France,
Germany, Italy and Spain) in labour flexibility and barriers to exit, while FGIS are
clearly more competitive than the UK in the availability of local suppliers, the skill
level workforce, the availability of skilled labour. Most of the western economies
have suffered from east-shoring of manufacturing unit but UK has been hit worst due
to government’s non-interventionist approach which makes it less costly (politically)
to close out operations during down turn. In other words, the UK is currently
competing mostly on labour flexibility, and the least cost for capacity
adjustment, while suffering from disadvantages in terms skilled labour and the
availability of local suppliers. The perception of UK automotive and supplier
industry is not strong amongst the people (APMG, 2011; NAIGT, 2007).
Technological
Key areas of sourcing opportunities for UK suppliers
In the higher technology areas, vehicle companies have indicated their wish to source
electronic control units, satellite navigation systems, advanced air conditioning and
safety systems in the UK (Auto Analysis, 2011). For the electric vehicle market, an
entirely new supply chain will need to be established – for the vehicles and the
batteries; the following component areas have been identified as highly desirable for
local sourcing: specialist wiring harness, electrical power unit, electric drivetrain and
gearing (Auto Analysis, 2011).
Prithviraj Paul Choudhury Page 103
A major report undertaken by Ricardo Consulting, supported by government,
identified the emerging low carbon vehicle market as the key new opportunity for the
UK and also led to the setting up of five expert groups – covering supply chain,
technology and business environment issues (Auto Analysis, 2011).
Fig 21: NAIGT Technology Road Map
Increasing use of Telematics in Vehicles
The use of high tech equipment will become more and more prevalent like in-vehicle
telematics which provide drivers instant safety, security and communication services.
Voice assisted driving directions, parking, acceleration and vehicle failure detection
will become common. Telematics driven infotainment services include Blue tooth
wireless and satellite radio and future applications will include vehicle to vehicle
communication to ensure safe distance and eliminate collision chances. Automakers
will also be pressurized to develop global platform upon which vehicles will be
designed, engineered and produced to leverage most capital intensive equipment and
resources initially and then customize and accessorize later for regional preferences
(Banks S, 2010). Eg. Volkswagen’s Golf platform PQ35 is shared across the VW,
Prithviraj Paul Choudhury Page 104
Audi and Skoda brands. Hence, suppliers will have to be equipped with technology
and provide the technology which would be acting as standards in the industry.
Rapid change is technology used as platform
Suppliers will also have to keep up with the improvements and latest updates in
the technologies used in digital systems and electronic systems in the car. For
instance, the improvement in semiconductor technology in the form of PLDs
(Programmable logical device) are a viable replacement for ASICs and ASSPs as they
can reduce engineering development time and cost and can be programmed and
reprogrammed during the design process and can be upgraded easily. The PLDs have
grown over the past 3 to 4 years and is expected to rise at 40-50% CAGR over the
next five years. The evolution of platform concept was needed to respond to the short
design cycle times by sharing of different car model on same basic design (Altera,
2011).
Expected developments in car technologies
SMMT forecasts that in the next 10-20 years, the following developments could be
fostered into vehicle production (IMI Report, 2009):
Zero failure electronics with self-monitoring circuits and active intervention
Switches that do not have to be pressed but respond to finger pointing
Sleep/drowsiness monitoring
On-board computers that predict vehicle and pedestrian movements and
automatically trigger the car to respond to an emergency
Real conversation voice control
Key areas of development in future: Green technology and Car Safety
There is possibility of heavy investment in R&D by the Tier1 suppliers in
technologies related to reducing CO2 emissions and increasing car safety.
Alternative fuel vehicles are expected to grow in the future, such as use of vehicle
Prithviraj Paul Choudhury Page 105
with hydrogen fuel, bio fuels, hybrid, electric and so on. Alternative low carbon
powertrain parts will gradually phase-in, however, these will be in addition to
traditional parts, so the shift is only partial. At present, alternative powertrain (such as
hybrid, hydrogen, fuel cell and electric) vehicles make up a small proportion of the
market only. However, as their importance will grow, so will the relative weakness of
the UK to maintain its position in the global automotive industry. The main
developments in this space are currently being done in Japan, Germany, France and
the USA.
Legislative
Government policy can provide direction to the automotive sector and drive business
behaviour.
The End of Life Vehicle directive aims to reduce the amount of waste from
vehicles (cars and light goods vehicles) when they are finally scrapped. Future
investments in End of Life Vehicle directive will ensure that by 2015 95% of
new vehicles will be fully recyclable. Suppliers will have to take care to
supply sustainable components (SMMT, 2011).
One reason why OEMs in UK source from suppliers outside UK is that there
are not sufficient numbers of „accredited suppliers‟. The accreditation levels
here include OEM-specific programmes, as well as generic ones such as
ISO/TS16949:2002, ISO9000 or ISO14001 (Automotive Council, 2011).
Euro IV emission norms were made mandatory for all vans registered after
31st December 2006, Euro V which limits fine particles, hydrocarbon and
nitrous oxide came into force from Sep 2009. A tighter Euro IV for Nitrous
oxide emission will apply from September 2014. Euro V reduced pollution
certificate entitles vehicle owners to a reduction in Vehicle Excise Duty if
their vehicle is fitted with on-board diagnostics systems and torque-control
mechanisms that check and control emission levels, came into effect in 1st
October, 2007. Suppliers will have to stick to these emission norms and be
aware of changes in these norms in the future (Key Note, 2008).
Whole Vehicle Type Approval will be made compulsory for all commercial
vehicles by 2014 which will ensure that vehicles are safe to use on the road
Prithviraj Paul Choudhury Page 106
without having to inspect and test every single one. Suppliers might have to
make appropriate technological changes for the same (Key Note, 2008).
Government has recently made a number of legislative bodies. It is important
that the OEMs and OESs keep an eye on the changes these bodies make
related to various areas such as CO2 emission, tax rebate on R&D
investments, mandatory requirements of any technologies, any legislation
affecting competition in the industry and so on. Some of these bodies are:
SMMT (Society of Motor Manufacturers and Traders), Automotive Council,
APMG, NAIGT (New Automotive Innovation and Growth Team), ASF, BIS
(Business Innovation and Skills), MISRA (Motor Industry Software
Reliability Association), IMI (Institute of the Motor Industry Home), ATA
(Automotive Technician Accreditation) etc.
The sale of green cars is expected to outnumber those of heavy petrol users
due to road tax benefits provided by the government. The government is
planning to accelerate the process with extra tax to be levied on gas guzzlers
(Key Note, 2008).
Government initiatives like ‘Tomorrow’s Road Safer for Everyone’ have led
to the development in vehicle safety innovations that include rear seatbelts,
airbags and improved braking systems (Key Note, 2008).
Environmental
Manufacturers are committed to low carbon growth and to driving forward
sustainable initiatives within the automotive industry. This has led to many
innovations. For e.g.:
Tyre pressure monitoring systems measure the pressure of each of the tyres
and will give a warning through the dashboard display if they become under-
inflated.
Gear shift indicators show the driver the optimum time to change gear (up and
down) while driving (SMMT, 2011).
Low rolling resistance tyres are designed to improve the fuel efficiency of a
vehicle by minimising the energy wasted as heat when the tyre rolls down the
road (SMMT, 2011).
Prithviraj Paul Choudhury Page 107
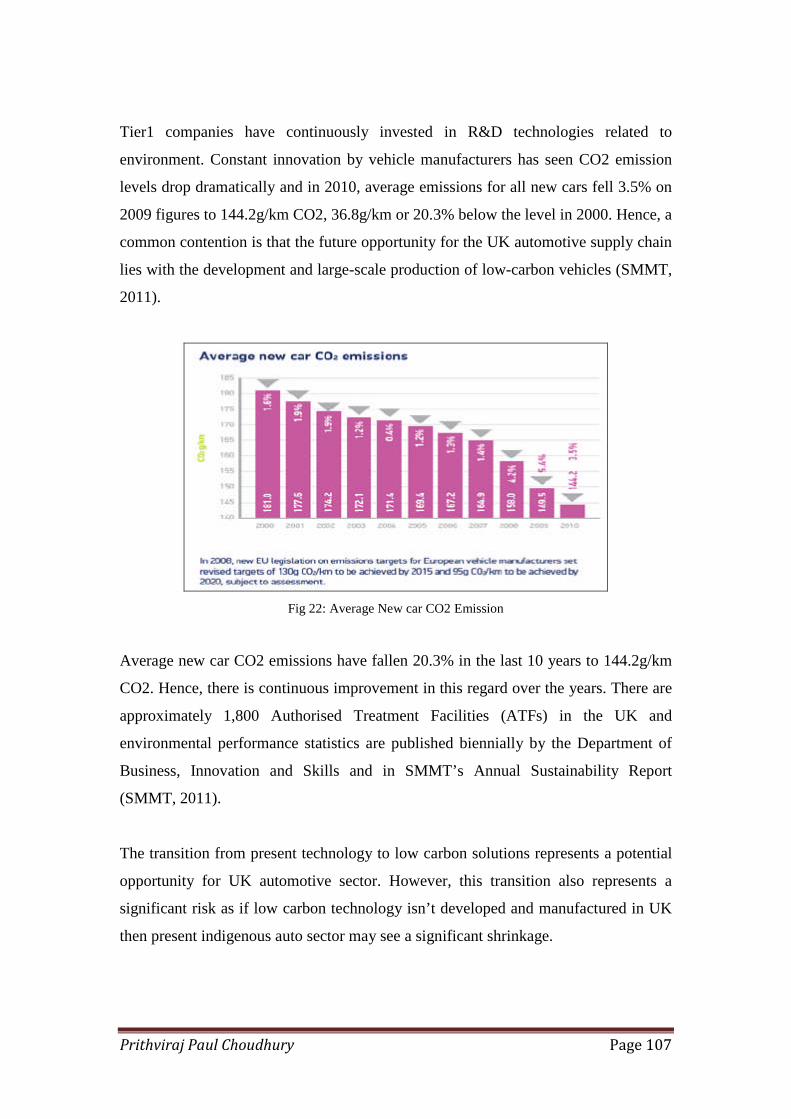
Tier1 companies have continuously invested in R&D technologies related to
environment. Constant innovation by vehicle manufacturers has seen CO2 emission
levels drop dramatically and in 2010, average emissions for all new cars fell 3.5% on
2009 figures to 144.2g/km CO2, 36.8g/km or 20.3% below the level in 2000. Hence, a
common contention is that the future opportunity for the UK automotive supply chain
lies with the development and large-scale production of low-carbon vehicles (SMMT,
2011).
Fig 22: Average New car CO2 Emission
Average new car CO2 emissions have fallen 20.3% in the last 10 years to 144.2g/km
CO2. Hence, there is continuous improvement in this regard over the years. There are
approximately 1,800 Authorised Treatment Facilities (ATFs) in the UK and
environmental performance statistics are published biennially by the Department of
Business, Innovation and Skills and in SMMT’s Annual Sustainability Report
(SMMT, 2011).
The transition from present technology to low carbon solutions represents a potential
opportunity for UK automotive sector. However, this transition also represents a
significant risk as if low carbon technology isn’t developed and manufactured in UK
then present indigenous auto sector may see a significant shrinkage.
Prithviraj Paul Choudhury Page 108
Appendix 2: Porter’s Five Force Analysis
Automotive Safety Critical Software components industry
Bargaining Power of Buyers
In automotive safety critical software industry, the buyers are the OEMs or the Tier 1
suppliers who tend to monitor and influence the supply chain in terms of standards
and processes. As the number of buyers is less and their size being large, they have a
strong bargaining power against the safety critical software suppliers. These buyers
have full information on the demand and cost of the safety critical software products
and services. Though there is importance on quality but due to low profit, they are
very price sensitive and there is an increased pressure from buyers to reduce cost.
Most auto component buyers require their suppliers to lower their process in order to
improve productivity. Also due to their sheer size, OEMs and Tier 1s pose a high
threat of backward integration. In fact companies like Robert Bosch are vertically
integrated and have internal software division to produce safety critical and other
automobile software. So the bargaining power of buyers is exceptionally high.
Barrier to Entry
The main barrier for companies entering the auto component industry is the
substantial capital investment and the industry is seen as highly capital intensive. In
component industry, latest and highly specialized technology is used which are costly
and hence increases the exit barrier. But in safety critical software industry, the initial
capital investment is negligible and only requires substantial initial investment in
human resources and constant training of employees. Also there are numerous
requirements in terms of standards, certifications and accreditations that include the
regular ones and the customer specific ones. Also, knowhow of safety software
industry requirements including SDLC cycle and project management pose a barrier
for entry. In addition to these, due to global presence of some players they can easily
leverage low production cost business model.
In safety critical software industry, product differentiation is considered as moderate
as mostly standardized products are used in auto components. This also makes the
switching cost low for the buyers. Most of the safety critical software development
Prithviraj Paul Choudhury Page 109
takes place in house with OEMs and Tier 1 suppliers and depends on relationship
building and so there is low dependency on the access to distribution channel. Due to
the presence of large number of players in the software market, the retaliation by the
existing players is considered to be low and only depends on how cost effective they
are.
Though there are significant barriers for entry of new auto parts manufacturers due to
the nature of the industry, the safety critical software industry seems to provide only
low barrier.
Internal Rivalry
There are nearly 2600 business units which are active in the auto component sector of
which 80 companies represent 74% of sector sales and 96% of employment (Holweg
et. al, 2009). The number of auto component manufacturers is pretty high that are
operating in UK. Giants like Robert Bosch have their internal software teams to
develop safety critical software components. As auto parts manufacturing companies
have high capital investment making the exit barrier costly, there is increased focus on
product differentiation and cost optimization. Due to slow growth of the overall
industry and low profit margin, the competitiveness is high.
But for companies providing only software services to the OEMs and Tier1s, the
capital investment is low making the exit barrier easy and the profit margin is better
amongst the players. However, to remain competitive the product differentiation is
moderately high. Also considering the high level of globalization of the auto industry,
it would be inappropriate to exclude international competition. But since most product
development and R&D takes place in house so global players are unlikely to
participate. So, for safety critical software industry, the competitiveness can be
considered moderate to high as opposed to highly competitive auto parts rivalry.
Bargaining Power of Suppliers
In auto industry, OEMs and Tier1 suppliers command the bargaining power and often
instruct and monitor suppliers. The buyers normally provide all the requirements on
production standards and certifications. These also provide suppliers with necessary
accreditations and affiliations with substantial bargaining power. In safety critical
Prithviraj Paul Choudhury Page 110
software industry the suppliers are the skilled labour force and there are is no dearth
of technical skills in UK due to its high education standards with number of courses
running on automotive technologies in UK universities.
The human talent does not provide much differentiation in terms of skill set but there
are also no substitutes of these skilled technical people. Though there are increased
focus on automation and mechanization but in product development or R&D phase is
mostly skilled labour intensive. Due to high labour cost, high man hours in R&D and
product development phase, the cost of acquiring these skills makes up a large portion
of the input cost. This increases their bargaining power to some extent also supported
by the fact that these skill set will find use in other industries and so not very
dependent on only automotive industry.
However, due to the access to global workforce, in an effort to become more
competitive the buyers tend to outsource work to acquire high skilled labour at lower
cost. Also there are very little chances of forward integration by these suppliers and so
overall it seems the bargaining power of suppliers is low.
Threat of Substitutes
There seems to be no likely threats of new products that could replace automobiles
and so auto component replacement is unlikely. But due to high energy cost and
emission norms, there is increased focus on low emission and high efficiency
technologies which drives the innovation in the industry. So there is an affinity among
OEMs and Tier1 suppliers to manufacture automobiles and auto components that are
substantially different from today’s standards such as hybrid vehicles, electric
vehicles and fuel cell power train etc. Overall, threat of substitutes is very low.
Thus, Industry attractiveness: Moderate.
Prithviraj Paul Choudhury Page 111
Appendix 3: Evaluation of capabilities and resources of Silver Atena
(UK)
Questions Answered by Nilanjan Das Gupta from Silver Atena (UK)
1 a) Considering the fact that Silver Atena in Germany is into Product
development, does the German office has experience in providing services as
outsourcing partner of OEMs and Tier1 suppliers in automotive sector?
Generally, in what ratio the revenue is generated from products and services?
Ans:- Yes to your first question. I would say the ratio of revenue generated from
products to services is in between 1:8 and 1:10
b) If Silver Atena in Germany provides outsourcing services, does it provide
services as Tier 1 supplier or Tier 2 supplier?
Ans: Mostly as a Tier 1 supplier to automotive clients
c) Does Silver Atena in the UK have experience in providing services as
outsourcing partner to Companies operating in Aerospace, Defence, Rail and
Gas turbine sector?
Ans: Yes
2. a) What is the average length and size of contracts for Silver Atena in
Germany operating in automotive sector? Can you provide specific details of
various developments in the field of hydrogen fuel technology, hybrid drives,
control by wire, engine control etc.
Ans: 1 to 1.5 years
b) What is the average length and size of contracts for Silver Atena in the UK
operating in different sectors?
Ans: At this point of time 8 months to 1 year on fixed price projects. Given the
economic condition in UK for the past couple of years most of our resources have
been working for clients onsite, integrated in their team (on a Time and Material
basis- i.e. hourly rate basis)
3. a) What according to you is the competitive advantage of Silver Atena in
Germany in automotive sector? What are generally the USPs of Silver Atena
in Germany when pitching for a contract?
Prithviraj Paul Choudhury Page 112
Ans: According to me Germany has a matured automotive market with big
automotive OEMs close to our offices in Germany. SA Germany has been
operating in the automotive market more than the past decade that gives them the
credibility, experience and reference in the local market, whereas SA UK has
never worked on any automotive project in the past.
Germany USPs: Quality is first and foremost although price is a little on the
higher end; Experience in high end technology work; Highly productive; financial
stability because of large parent company – Assystem group; References from
OEMs and Tier 1 companies in the automotive sector.
b) What are the competitive advantages of Silver Atena in the UK operating
in different sectors?
Ans: UK USPs – Local European front office (HQ located near to office of major
clients such as GE Aerospace, Invensys Rail); wholly owned Indian offshore
development centre managed by our HQ in UK, which gives our clients an
optimised low risk-cost benefit; Our higher management is very much
approachable by our customers (as and when needed); Most of our present
business is based on relations that we have built with clients in the past (long term
customer relationship); Good quality – e.g. Customer Satisfaction Index in the last
18 months have been 4.8 on scale of 1 to 5; financial stability from our parent
company – Assystem group; More than a decade experience in
managing/offshoring aerospace and rail projects (high integrity safety critical
projects – i.e. a niche market sector)
4. a) What are the automotive related software technologies Silver Atena in
Germany is working on?
Ans: Provided in Page 6 of the SA company brochure provided to NUBS students.
Also present in the slides provided to you. (See below)
b) What are the technological (software) skills of Silver Atena in the UK?
Ans: I shall attach a slide for this answer along with this email. The slide shall be
depicting most of the technology and software skills used in the industries that we
operate in, but we are not limited only to these many skills.
Prithviraj Paul Choudhury Page 113
Appendix 4: Interview with Industry Expert
1. Whether safety features are generally developed in-house or outsourced and
if outsourced, what are the lengths of the contracts?
Ans: The complexity of the vehicle manufacturing comes from combining Engine
controller, Cruise controller, Braking System etc which are the safety components.
Parts of the components like Engine controller are outsourced but Diesel engines are
in house developed. So not all the components are outsourced and some are produced
in house.
The contracts are long term and the competition is on price.
2. Can you share your knowledge about the sub contracts by the Tier1 safety
components suppliers for safety software services?
b) Do you deal with tier1 suppliers only or Tier2 suppliers as well?
Ans: a) Bosch, Continental manage most components including software. These Tier
1s internally outsource many of their components or parts to Tier 2s. The Tier 1s
develop most of the components outside UK and then import.
b) Tier 1 only. The interviewee couldn’t disclose much of the information.
3. What are the selection criteria for the safety critical component suppliers?
Ans: A year ago it was very much over price but now stability of suppliers also is
important.
The design is done by Ford but manufacturing and production is done by Bosch or
Continental.
4. How is the competitiveness of safety component market? (Number of
vendors, rivalry, differentiation factor etc.)
Ans: Power is balanced between Tier 1 and OEMs.
5. What are the major developments in safety critical systems in UK and
Europe and what are your reflections on the growth of software usage in safety
components?
Ans: In the areas of power train, vehicle control, driver assistance.
6a) Are the suppliers of safety systems based in UK or abroad? Can you tell us
name of few major players of Safety software service providers in the UK and
abroad?
Prithviraj Paul Choudhury Page 114
b) How much development of software services takes place in UK and how much
in other parts Europe?
Ans: a) According to him, Bosch and Continental provide all the safety systems
including software and they internally might outsource some parts to Tier 2. The
components used by UK manufacturer are mostly imported by the Tier 1s.
b) Since most of the software is provided by Tier 1 suppliers, so couldn’t provide
internal Tier 1 details.
7. What portion of safety systems is comprised of software and what is its effect
on cost? Which safety products have more potential for software usage in
future?
Ans: 25-30% of the total cost. No answer was provided for the 2nd part.
8. Your reflection on the growth of software usage in safety components?
Ans: Couldn’t provide specific answer.
9. What is the sales projection/potential size of market for safety systems/safety
software services?
Ans: Being a technical person he couldn’t provide answer.
10. Are the technologies used for development of safety software different for
different car/commercial car segments?
Ans: Couldn’t be asked.
11. Are there any govt. regulations regarding use of safety components in UK?
Ans: Couldn’t be asked due to time constraint.
12. How long usually is the new product development of Tier1 suppliers?
Ans: 1-1.5 years.
13. Are there any safety components in aftermarket that require software
services?
Ans: Couldn’t be asked due to time constraint.
14. Which kind of vehicle is expected to have more software usage- Hybrid,
Electric or Combustion?
Ans: Due to complexity involved, hybrids are expected to have more embedded
software.
Prithviraj Paul Choudhury Page 115
Appendix 5: Interview with Academic Expert
1. What is your view on the UK automotive industry? Where do you see it
heading towards?
Ans: The UK manufacturers serve the global market and not just the local market. Eg.
Ford Engineering Centre produces diesel engine for whole world.
The Tier 1s fight over cost all over the world to secure business but at the same time
they are highly innovative.
2a) Even though cars are produced in UK, but the reports say that most of the
components used are outsourced and the trend will continue in future? What is
your view on this?
Ans: Yes, most components are outsourced by the manufacturers.
Low carbon technology innovations involve huge amount of software and it is ever
increasing.
b) Are the low carbon developments taking place in UK?
Ans: Didn’t make specific comment.
c) Are software involved in these developments?
Ans: Software will only be involved in the R&D or design phase of the component
and the licensing will be transferred to the OEMs after product development.
3. Does technology Strategy Board work on automotive technology? If so what
are they? Are there any developments related to automotive safety component?
Ans: Power train efficiency.
4. How do you see the growth of fuel cell technology wrt to automotive? Is this
technology in R&D phase or in production? Do you see this technology to be
used for mass production or luxury cars? What do you think will be the impact
of such technology on the cost of the vehicle?
Ans: Its closer than many people think they are. May be a 5 years away. R&D is
taking place to reduce the cost involved.
On Software involvement: Fuel cell technology will also demand use of software in
the power train design.
5. What is the competitive position of UK as compared to other European
countries and US? DO you see any scope of developments of power train related
to fuel cell to take place in UK in future?
Ans: Couldn’t be asked due to time constraint.
Prithviraj Paul Choudhury Page 116
6. What is govt’s attitude towards fuel cell in terms of assisting or funding R&D?
Ans: Low Carbon Vehicle Program is a government initiative for promoting low
carbon vehicles.
7. Do auto suppliers or auto manufacturers have access to this technology? Are
they in a position to develop this technology? When can we see this technology in
production?
Ans: Couldn’t be asked due to time constraint.
8. Will the power train developed with fuel cell technology be a mechanical unit
or a combination of mechanical and electronic/electrical unit? If so, what could
be the percentage of electronic/electrical in the whole component i.e power train?
Ans: The fuel cell power will also involve software as in hybrids or contemporary
diesel or petrol engines.
9. We have found from a few researches that in present day cars almost 40%
component cost is for electronic/electrical items. What is your view on this?
Ans: Couldn’t be asked due to time constraint.
10. Can you provide some insight into the competitiveness of automotive safety
component market –buyer power, supplier power, internal rivalry, threat of new
entrant, threat of substitutes? What are the major developments taking place
now? What safety technologies can we see in future?
Ans: Didn’t provide specific answer. Just that competition is mostly price based.
11. Are there any researches or products for automotive industry that are taking
place in Carbon abatement technology? If so what are those products/research?
When can we see those technologies in market?
Ans: Couldn’t be asked due to time constraint.
12. What do you think will be the composition of such product i.e. what portion
of it might comprise of electronic/electrical component?
Ans: Couldn’t be asked due to time constraint.
13. Who is supporting these research, is it only govt or car manufacturers and
Tier 1 suppliers are also investing in such research?