Full length article An analytical model to predict the volume of sand during drilling and production Raoof Gholami a, * , Bernt Aadnoy b , Vamegh Rasouli c , Nikoo Fakhari d a Department of Petroleum Engineering, Curtin University, Miri, Sarawak, Malaysia b Department of Petroleum Engineering, University of Stavanger, Stavanger, Norway c Department of Petroleum Engineering, University of North Dakota, Grand Forks, ND, USA d Department of Chemistry, Shahrood University of Technology, Shahrood, Iran article info Article history: Received 21 October 2015 Received in revised form 12 December 2015 Accepted 13 January 2016 Available online 19 March 2016 Keywords: Sand production Shape parameter Failure criteria Carbonate reservoir Analytical solution abstract Sand production is an undesired phenomenon occurring in unconsolidated formations due to shear failure and hydrodynamic forces. There have been many approaches developed to predict sand pro- duction and prevent it by changing drilling or production strategies. However, assumptions involved in these approaches have limited their applications to very specific scenarios. In this paper, an elliptical model based on the borehole shape is presented to predict the volume of sand produced during the drilling and depletion stages of oil and gas reservoirs. A shape factor parameter is introduced to estimate the changes in the geometry of the borehole as a result of shear failure. A carbonate reservoir from the south of Iran with a solid production history is used to show the application of the developed meth- odology. Deriving mathematical equations for determination of the shape factor based on different failure criteria indicate that the effect of the intermediate principal stress should be taken into account to achieve an accurate result. However, it should be noticed that the methodology presented can only be used when geomechanical parameters are accurately estimated prior to the production stage when using wells and field data. Ó 2016 Institute of Rock and Soil Mechanics, Chinese Academy of Sciences. Production and hosting by Elsevier B.V. This is an open access article under the CC BY-NC-ND license (http://creativecommons.org/ licenses/by-nc-nd/4.0/). 1. Introduction Up to 70% of oil and gas reservoirs worldwide are located in poorly consolidated formations (Nouri et al., 2003, 2007). In these reservoirs, when the pressure is depleted to a point where the maximum tangential stress exceeds the formation’s strength, the formation fails and sand production is triggered. The sand pro- duction phenomenon is generally taking place through three stages: (1) loss of mechanical integrity of rocks surrounding the borehole, (2) separation of solid particles due to the hydrodynamic force, and (3) transportation of the particles to the surface by production. This phenomenon is particularly important when sig- nificant changes of in-situ stresses, high production rates, and collapses of cavities are observed (Wang and Dusseault, 1991; Kooijman et al., 1996; Abass et al., 2002). Solid production in non-granular rocks such as carbonates shares the same concept and is triggered when excessively broken rocks due to natural fractures are transported by production fluids (Papamichos and Furui, 2013). Excessive sanding or solid production may damage the down- hole and surface equipment, induce wellbore instability, and cause difficulties during completion and production phases. Sand pro- duction has, therefore, remained as an ongoing challenge in the reservoir management and field operations. A better understand- ing of the sanding mechanism should allow for prediction of the initiation of sanding more realistically. This is, however, a complex mechanism as sanding is impacted by various parameters, including geological, geomechanical and fluid characteristics of the formations as well as the initial state of stresses, pressure condi- tions, wellbore completions and boundary conditions (Papamichos and Malmanger, 1999; Vaziri et al., 2000; Palmer et al., 2000; van den Hoek et al., 2000). Considering the impact of these parame- ters in a simple model is not practical and assumptions are required to derive models for prediction of sanding. One of these assump- tions is the one where shear failure is considered as the most likely mechanism in unconsolidated formations, causing sand/solid pro- duction to take place in the presence of the fluid flow (Wang and Papamichos, 2012). * Corresponding author. Tel.: þ60 128451611; fax: þ60 85443837. E-mail address: [email protected](R. Gholami). Peer review under responsibility of Institute of Rock and Soil Mechanics, Chinese Academy of Sciences. Contents lists available at ScienceDirect Journal of Rock Mechanics and Geotechnical Engineering journal homepage: www.rockgeotech.org Journal of Rock Mechanics and Geotechnical Engineering 8 (2016) 521e532 http://dx.doi.org/10.1016/j.jrmge.2016.01.002 1674-7755 Ó 2016 Institute of Rock and Soil Mechanics, Chinese Academy of Sciences. Production and hosting by Elsevier B.V. This is an open access article under the CC BY-NC-ND license (http://creativecommons.org/licenses/by-nc-nd/4.0/).
Transcript
lable at ScienceDirect
Journal of Rock Mechanics and Geotechnical Engineering 8 (2016) 521e532
Contents lists avai
Journal of Rock Mechanics andGeotechnical Engineering
journal homepage: www.rockgeotech.org
Full length article
An analytical model to predict the volume of sand during drilling andproduction
aDepartment of Petroleum Engineering, Curtin University, Miri, Sarawak, MalaysiabDepartment of Petroleum Engineering, University of Stavanger, Stavanger, NorwaycDepartment of Petroleum Engineering, University of North Dakota, Grand Forks, ND, USAdDepartment of Chemistry, Shahrood University of Technology, Shahrood, Iran
a r t i c l e i n f o
Article history:Received 21 October 2015Received in revised form12 December 2015Accepted 13 January 2016Available online 19 March 2016
* Corresponding author. Tel.: þ60 128451611; fax:E-mail address: [email protected] (R. GPeer review under responsibility of Institute o
Chinese Academy of Sciences.
http://dx.doi.org/10.1016/j.jrmge.2016.01.0021674-7755 � 2016 Institute of Rock and Soil MechanCC BY-NC-ND license (http://creativecommons.org/li
a b s t r a c t
Sand production is an undesired phenomenon occurring in unconsolidated formations due to shearfailure and hydrodynamic forces. There have been many approaches developed to predict sand pro-duction and prevent it by changing drilling or production strategies. However, assumptions involved inthese approaches have limited their applications to very specific scenarios. In this paper, an ellipticalmodel based on the borehole shape is presented to predict the volume of sand produced during thedrilling and depletion stages of oil and gas reservoirs. A shape factor parameter is introduced to estimatethe changes in the geometry of the borehole as a result of shear failure. A carbonate reservoir from thesouth of Iran with a solid production history is used to show the application of the developed meth-odology. Deriving mathematical equations for determination of the shape factor based on differentfailure criteria indicate that the effect of the intermediate principal stress should be taken into account toachieve an accurate result. However, it should be noticed that the methodology presented can only beused when geomechanical parameters are accurately estimated prior to the production stage when usingwells and field data.� 2016 Institute of Rock and Soil Mechanics, Chinese Academy of Sciences. Production and hosting byElsevier B.V. This is an open access article under the CC BY-NC-ND license (http://creativecommons.org/
licenses/by-nc-nd/4.0/).
1. Introduction
Up to 70% of oil and gas reservoirs worldwide are located inpoorly consolidated formations (Nouri et al., 2003, 2007). In thesereservoirs, when the pressure is depleted to a point where themaximum tangential stress exceeds the formation’s strength, theformation fails and sand production is triggered. The sand pro-duction phenomenon is generally taking place through threestages: (1) loss of mechanical integrity of rocks surrounding theborehole, (2) separation of solid particles due to the hydrodynamicforce, and (3) transportation of the particles to the surface byproduction. This phenomenon is particularly important when sig-nificant changes of in-situ stresses, high production rates, andcollapses of cavities are observed (Wang and Dusseault, 1991;Kooijman et al., 1996; Abass et al., 2002). Solid production innon-granular rocks such as carbonates shares the same concept and
þ60 85443837.holami).f Rock and Soil Mechanics,
ics, Chinese Academy of Sciencescenses/by-nc-nd/4.0/).
is triggered when excessively broken rocks due to natural fracturesare transported by production fluids (Papamichos and Furui, 2013).
Excessive sanding or solid production may damage the down-hole and surface equipment, induce wellbore instability, and causedifficulties during completion and production phases. Sand pro-duction has, therefore, remained as an ongoing challenge in thereservoir management and field operations. A better understand-ing of the sanding mechanism should allow for prediction of theinitiation of sanding more realistically. This is, however, a complexmechanism as sanding is impacted by various parameters,including geological, geomechanical and fluid characteristics of theformations as well as the initial state of stresses, pressure condi-tions, wellbore completions and boundary conditions (Papamichosand Malmanger, 1999; Vaziri et al., 2000; Palmer et al., 2000; vanden Hoek et al., 2000). Considering the impact of these parame-ters in a simple model is not practical and assumptions are requiredto derive models for prediction of sanding. One of these assump-tions is the one where shear failure is considered as the most likelymechanism in unconsolidated formations, causing sand/solid pro-duction to take place in the presence of the fluid flow (Wang andPapamichos, 2012).
. Production and hosting by Elsevier B.V. This is an open access article under the
Fig. 1. Changes in the shape of the borehole as a result of shear failure.
R. Gholami et al. / Journal of Rock Mechanics and Geotechnical Engineering 8 (2016) 521e532522
There have been many sand production risk assessments per-formed using geomechanical models where analytical approacheswere proposed to predict either the initiation of sanding or theextent of rock failure around the borehole. For example, Bratli andRisnes (1981) and Risnes et al. (1982) developed analytical solu-tions for rock failure around the boreholes which was only suitablefor a steady state flow condition. Bratli and Risnes (1981) intro-duced a cohesive failure model and calculated a critical bottomholepressure for sanding in a uniformly stressed cylindrical borehole.Their model, however, could not be used for the prediction ofsanding due to shear failure, which is more common than cohesivefailure in unconsolidated formations. Morita et al. (1989) proposedthe so-called equivalent plastic strain (EPS) criterion and stated thatsanding occurs once a critical plastic strain is achieved. Theirapproach could not be validated completely later when it was usedfor a gas filed (Wang and Dusseault, 1991). McLellan and Wang(1994) developed an analytical approach to evaluate the failure ofboreholes by assuming an exclusive elasticebrittleeplastic strain-softening behavior for the formations. Weingarten and Perkins(1995) developed a model to predict the sanding exclusively forthe perforationsmade in loose formations based on the assumptionof elastic-perfectly plastic materials, where the effect of the steady-state and compressible fluid flow was taken into account. Bradfordet al. (1998) proposed analytical models for predicting the failurearound the boreholes under an isotropic in-situ stress conditionwhich could not be used for a tectonically active region with threeindependent principal stresses. Ewy et al. (2001) proposed a Lademodel to enhance the accuracy of predictions previously providedby the MohreCoulomb criterion and/or DruckerePrager criterion.Their model, however, did not find a wide application due to thelimitation and complexity of the Lade equation. Vaziri et al. (2002)used different sand production criteria for predictions in a hightemperature and high pressure well and indicated a high level ofconservation in the predictions provided. Nouri et al. (2006)developed a new set of criteria for prediction of sanding usingthe conservative MohreCoulomb failure criterion through experi-mental and numerical analyses. Osisanya (2010) developed anapproach based on the production, well logs and laboratory data todetermine the initiation of sanding, but did not indicate theimportance of predicting the volume of sand if it is initiated. Wangand Papamichos (2012) compared the shear, cohesive and effectiveplastic strain sanding criteria by doing calibration with the resultsobtained from a perforated test in sandstone. They suggested theplastic strain approach as the best method for the prediction ofsanding, although the accuracy of results was questionable.Lamorde et al. (2014) developed an approach to determine thevolume of sand produced based on the yield zone and fractureenergy dissipation around the wellbore. However, their approachrequires very complicated calculations and experimental studies todetermine the energy dissipation.
The aim of this paper is to present a newmethodology based onchanges in the geometry of boreholes for predicting the volume ofsand produced during drilling and depletion phases. The applica-tion of this approach will be initially at the reservoir assessmentstage, where the risk of sand production must be quantified todevelop a management strategy or to satisfy regulatory authorities.
2. Sand prediction models
Predicting the onset of sanding is a long standing geomechanicalissue which has been the subject of many studies such as thosepresented earlier in the Introduction section. According to thesestudies, approaches developed to predict sand production can bedivided into three main categories of empirical correlations,analytical models and numerical analysis.
Through the use of empirical correlations, the relationshipsbetween the onset of sanding and effective parameters, causing thesanding to take place, are established (Veeken et al., 1991). Thesecorrelations are, however, developed based on particular field dataand their results may not be generalized to any other fields.
Analytical models are used to predict the sanding when criticalconditions for the initiation of sanding are determined by theanalysis of the stress state near the wellbore or perforations (Cerasiet al., 2005; Detournay et al., 2006). Simplifying the geometry of theproblem and rock’s mechanical properties, analytical equations areused to estimate the onset of sanding. These models are easy to beused and widely acceptable for the sand production evaluation(Addis et al., 2008). Although analytical models suffer from limi-tations due to simplified assumptions, they are still commonly usedin complex well geometries and subsurface environments.
Numericalmodels are perhaps the best approach for the analysisof a combination of effective parameters contributing to the onset ofsanding. Finite element (Watson and Jones, 2009) and finite differ-ence (Detournay et al., 2006; Nouri et al., 2007) numerical modelshave been used to assess the variation of the stress state when thefluid flow is presented. They can be used for the quantitative eval-uation of the sand volume, but require a large data acquisition.
In this section, a newanalytical solution for determination of thevolume of sand produced during drilling and production is pre-sented based on the changes in the shape of the borehole. Theapproach can be used in conjunction with different failure criteriato estimate the sanding onset in the presence of formationstrengths and principal stresses.
2.1. A new elliptical model for prediction of sanding
Boreholes are expected to have a circular shape, but in practice,due to stress concentrations around the borehole, the boreholetends to change its geometry to reach a new state of stability.Generally speaking, the optimal shape (i.e. circular shape) of theborehole changes during the life of awell andmay become ellipticaldue to shear failure. This concept is depicted in Fig. 1.
One of the approaches conventionally used for determination ofthe maximum and minimum tangential stresses in the elliptical
R. Gholami et al. / Journal of Rock Mechanics and Geotechnical Engineering 8 (2016) 521e532 523
borehole is developed by Lekhnitskii (1968) and formulated asfollows:
sA ¼ ð1þ 2cÞsH � sh ��2c� 1
�Pw (1)
sB ¼�1þ 2
c
�sh � sH � ð2c� 1ÞPw (2)
where sA and sB are the tangential stresses at points A and B aroundthe wellbore, respectively, as shown in Fig. 1; sH and sh are themaximum andminimum horizontal stresses, respectively; Pw is thewellbore pressure and the parameter c is a function of boreholediameters (i.e. a and b in Fig. 1) which is defined as
c ¼��sH � sh þ Pw � 1þsin f
1�sin f Pw � 2S0cos f
1�sin f
�þ
ffiffiffiffiffiffiffiffiffiffiffiffiffiffiffiffiffiffiffiffiffiffiffiffiffiffiffiffiffiffiffiffiffiffiffiffiffiffiffiffiffiffiffiffiffiffiffiffiffiffiffiffiffiffiffiffiffiffiffiffiffiffiffiffiffiffiffiffiffiffiffiffiffiffiffiffiffiffiffiffiffiffiffiffiffiffiffiffiffiffiffiffiffiffiffiffiffiffiffiffiffiffiffiffiffiffiffiffiffiffiffiffiffi�sH � sh þ Pw � 1þsin f
1�sin f Pw � 2S0cos f
1�sin f
�2
þ 16sHPw
s
4sH(8)
c ¼ b=a (3)
Borehole collapse is induced when the mud weight used fordrilling is not able to apply enough pressure to resist against theextreme formation pressure. This kind of failure is often leaving anelliptical borehole shape behind. In the next section, amethodologybased on the elliptical borehole shape is proposed using three well-known failure criteria to estimate the volume of sand.
2.1.1. MohreCoulomb criterionMohreCoulomb shear failure criterion is one of the most
commonly used and well-known criteria in many engineering ap-plications. This criterion is expressed as
c ¼��sH � sh þ Pw � 2S0
cos f1�sin f
�þ
ffiffiffiffiffiffiffiffiffiffiffiffiffiffiffiffiffiffiffiffiffiffiffiffiffiffiffiffiffiffiffiffiffiffiffiffiffiffiffiffiffiffiffiffiffiffiffiffiffiffiffiffiffiffiffiffiffiffiffiffiffiffiffiffiffiffiffiffiffiffiffiffiffiffiffiffiffiffiffiffiffiffiffiffiffiffiffi�sH � sh þ Pw � 2S0
cos f1�sin f
�2
þ 16sHPw
s
4sH(10)
s ¼ S0 þ msn (4)
where sn and s are, respectively, the normal and shear stresses; S0 isthe cohesion and m is the coefficient of internal friction.
The linearized form of the criterion is written in the principalstress space:
s1 ¼ sc þ qs3 (5)
where
q ¼��
m2 þ 1�1
2 þ m
�2¼ tan2
�p4þ f
2
�(6)
where s1 is the major principal stress at failure, s3 is the minorprincipal stress at failure, sc is the uniaxial compressive strength(UCS) and f is the internal friction angle.
Shear failure during drilling occurs once the maximum inducedtangential stress at point A, as shown in Fig. 1 (i.e. sA), is higher thanthe radial stress (sr ¼ Pw). Thus, in the worst case scenario, thetangential stress is the maximum and the radial stress is the min-imum principal stresses around the borehole. As a result, Eq. (1) canbe substituted into Eq. (5) to give
ð1þ 2cÞsH � sh ��2c� 1
�Pw ¼ sc þ qPw (7)
Eq. (7) can then be rearranged to determine the parameter c as
At the initial stage ofproduction, theporepressure at theboreholewall becomes equal to the wellbore pressure and, as a result, theeffective radial stress becomes zero (sr ¼ Pw�Pp ¼ 0, where Pp is thepore pressure). Considering the tangential stress (sA) as themaximum principal stress and the radial stress (sr) as the minimumprincipal stress for shear failure, Eq. (5) can be rewritten as
ð1þ 2cÞsH � sh ��2c� 1
�Pw ¼ sc (9)
As a result, the parameter c for the production stage can beobtained as a function of the in-situ stress, wellbore pressure,friction angle and cohesion by rearranging Eq. (9) as
It should be noticed that Eq. (10) can only be used for the pre-diction of sanding when updated effective stresses are recalculatedbased on the changes in the magnitude of the pore pressure due todepletion. Two equations were, therefore, presented at the end ofthis section to estimate the changes in the magnitude of effectivestresses as depletion progresses. Having the parameter c deter-mined during drilling (i.e. Eq. (8)) and production (i.e. Eq. (10)), thevolume of sand produced can be calculated using the equationformulated below:
V ¼ p4ab� p
4b2 ¼ p
41� cc
b2 (11)
where V is the rate of sand production per unit length of thewellbore (m3/m).
R. Gholami et al. / Journal of Rock Mechanics and Geotechnical Engineering 8 (2016) 521e532524
2.1.2. HoekeBrown criterionHoekeBrown failure criterion was originally developed in the
early 1980s and undergone numerous revisions (Hoek and Brown,1980, 1997; Hoek et al., 1995, 2002). It uses two dimensionlessparameters, m and s, which depend mainly on the rock type anddegree of heterogeneity, for estimation of the ultimate strength ofrocks. According to this criterion, the relationship between themaximum and minimum stresses is expressed as
s1 ¼ s3 þ sc
�m
s3sc
þ 1�1
2
(12)
Fig. 2. Geological stratigraphy of the
c ¼��sH � sh þ Pw � sc � sc
�m s3
scþ 1
�12�þ
ffiffiffiffiffiffiffiffiffiffiffiffiffiffiffiffiffiffiffiffiffiffiffiffiffiffiffiffiffiffiffiffiffiffiffiffiffiffiffiffiffiffi�sH � sh þ Pw � sc
s
4sH
Assuming the same situation as before for a drilling practice,where the tangential stress (sA) is the maximum principal stressand the radial stress (sr ¼ Pw) is the minimum principal stress, Eq.(1) can be substituted into Eq. (12) to give
ð1þ 2cÞsH � sh ��2c� 1
�Pw ¼ Pw þ sc
�m
Pwsc
þ 1�1
2
(13)
Eq. (13) can then be rearranged to derive the parameter cas
Fig. 3. Log data of Well A used for the purpose of this study.
R. Gholami et al. / Journal of Rock Mechanics and Geotechnical Engineering 8 (2016) 521e532 525
Considering the initial stage of depletion, where the porepressure is equal to the wellbore pressure (sr ¼ 0) and thetangential stress (sA) is obtained using Eq. (1), Eq. (12) changes to
ð1þ 2cÞsH � sh ��2c� 1
�Pw ¼ sc (15)
This is a same equation as Eq. (7), but the UCS in the HoekeBrown criterion cannot be simply related to the cohesion andfriction angle of the rock. The parameters, m and s, in the HoekeBrown criterion, however, can be linked to the cohesion and frictionangle parameters of the MohreCoulomb criterion using theapproach presented by Lee and Bobet (2014). Using Eq. (15), theparameter c for the production stage can be obtained through thefollowing formulation:
c ¼ �ðsH � sh þ Pw � scÞ þffiffiffiffiffiffiffiffiffiffiffiffiffiffiffiffiffiffiffiffiffiffiffiffiffiffiffiffiffiffiffiffiffiffiffiffiffiffiffiffiffiffiffiffiffiffiffiffiffiffiffiffiffiffiffiffiffiffiffiffiffiffiffiffiffiffiffiffiðsH � sh þ Pw � scÞ2 þ 16sHPw
q4sH
(16)
Having the parameter c calculated from Eqs. (14) and (16), thevolume of sand produced during drilling and depletion stages canbe obtained from Eq. (11).
2.1.3. MogieCoulomb criterionMogi (1971) proposed a failure criterion formulated below:
soct ¼ fsm;2
(17)
where sm,2 and soct are, respectively, the effective mean stress andoctahedral shear stress, while f is a power-law function. Parametersincluded in the Mogi’s criterion cannot be simply related to theCoulomb strength parameters, c and f (Colmenares and Zoback,2002). Thus, Al-Ajmi and Zimmerman (2005) recommended thatthe parameter f can be a linear function following the form of:
soct ¼ xþ ysm;2 (18)
where
x ¼ 2ffiffiffi2
p
3S0 cos f (19)
y ¼ 2ffiffiffi2
p
3S0 sin f (20)
To determine the parameter c during drilling using the MogieCoulomb criterion, the worst case scenario for shear failure is againapplied. This means that the tangential (sA), axial (sz) and radial (sr)stresses are, respectively, the maximum, intermediate and mini-mumprincipal stresses around the borehole. The axial stress, in thissituation, is estimated as
sz ¼ sV þ 2mðsH � shÞ (21)
where sV is the vertical stress.The parameter c can then be estimated as
R. Gholami et al. / Journal of Rock Mechanics and Geotechnical Engineering 8 (2016) 521e532526
c ¼ �N þffiffiffiffiffiffiffiffiffiffiffiffiffiffiffiffiffiffiffiffiffiffiffiffiffiffiffiffiffiN2 þ 16PwsH
With the parameter c defined for drilling (Eq. (22)) and deple-tion (Eq. (25)), the volume of produced sand can be estimated usingEq. (11). As it was indicated earlier, the equations developed forestimation of the parameter c give the changes in the boreholeshape at the initial stage of production. During production, how-ever, the magnitude of horizontal stresses changes as the porepressure decreases. Aadnoy (1991) derived a model to consider thechanges in the magnitude of horizontal stresses as a function of thepore pressure. Aadnoy and Kaarstad (2010) used that model to seethe effect of the pore pressure on sand production. The model isformulated by
A- 3400.04M) 12/8/2015 22:28
.5
Cohesion
S (MPa)0. 100.
Friction Angle
FA (Degree)0. 90.
cohesion, and friction angle of formations in Well A.
3400Fig. 5. Estimated UCS, pore pressure and in-situ principal effective stresses in Well A.
R. Gholami et al. / Journal of Rock Mechanics and Geotechnical Engineering 8 (2016) 521e532 527
s*h ¼ sh � 1� 2n1� n
�Po � P*o
�(27)
s*H ¼ sH � 1� 2n1� n
�Po � P*o
�(28)
where s*h is the updated minimum horizontal stress, s*H is theupdated maximum horizontal stress, Po is the initial pore pressure,P*o is the pore pressure of the reservoir at any stage of depletion, andn is the Poisson’s ratio.
Substituting the values of in-situ stresses calculated from Eqs.(27) and (28) into Eqs. (10), (16) and (25), the volume of sand/solidproduction can be estimated at any stages of depletion. It shouldbe noted that to develop the equations presented in this section, itwas assumed that the sand production takes place first duringdrilling until a stable elliptical hole is obtained. This is followed byfurther changes in the shape of the hole, as depletion initiates andthe pore pressure decreases. However, the sanding phenomenonduring depletion is a slow process, and the borehole collapse maynot take place instantly. Besides, the occurrence of sanding during
drilling may not happen again from the same interval duringdepletion.
3. Case study
In this section, awell with the potential of solid/sand productionlocated in the south of Iran is taken into account to evaluate theapplication of the proposed methodology. This well, referred to asWell A, is a vertical and onshore well but its name cannot bereleased due to confidential reasons.
The field of this study is located at offshore of Khuzestan, closeto the boundary of Iran and Iraq, which is characterized by a verygentle NeS to NEeSW trending anticline in the South-East, and aNWeSE trending fold in the North-East (Abdollahie Fard et al.,2006). Its structure belongs to the stable shelf of the ArabianPlatform and there are limited geological outcrops from subsurfacestructures which can be evaluated on the surface (Berberian, 1995).This field is one of the richest petroleum systems in theMiddle East,having Gurpi, Khazdumi and Gadvan source rocks and Lurestan,Asmari, Khuzestan, Fahliyan, and Khami/Bangestan reservoirs. Fielddata obtained from this structure have revealed unconformities
Fig. 6. Shear failure, shape factor and the volume of sand predicted by the MohreCoulomb criterion.
R. Gholami et al. / Journal of Rock Mechanics and Geotechnical Engineering 8 (2016) 521e532528
and erosional surfaces due to the uplifting of basement horsts. Thereservoir in the field has been formed in argillaceous limestonewith shaly intercalations. Fig. 2 shows the geological stratigraphy ofthe field. Fig. 3 shows the logs used for the purpose of this study,including the gamma ray, compressional and shear sonic logs,density and porosity logs as well as resistivity logs. As can be seenin Fig. 3, the reservoir is located in limestone formations within theintervals of 3012e3050 m and 3100e3150 m.
4. Estimation of input parameters
In this section, the input parameters required to apply theproposed methodology are estimated using the well and field data.These parameters consist of the elastic parameters and strength ofrocks as well as the pore pressure and in-situ stresses. The details ofthe principles and correlations used in this paper for estimates ofthe above parameters have already been reported in the literature(e.g. Maleki et al., 2014; Gholami et al., 2015a, b), and the outputresults corresponding to Well A were only presented.
Characterizations of the geomechanical parameters were star-ted by estimates of elastic parameters (i.e. Young’s modulus and
Poisson’s ratio) using dynamic elastic formulations presented byFjaer et al. (2008). The dynamic to static conversion of the Young’smodulus was then done using the correlation proposed by Wang(2000a). It should be noticed that the dynamic and static Pois-son’s ratios were equal due to the high Young’s modulus and in-situstress in the field (Wang, 2000b). Fig. 4 shows the static Young’smodulus and Poisson’s ratio estimated and calibrated against thecore samples.
There are few correlations which can be used to estimate thefriction angle, but the one proposed by Plumb (1994) was used forthe purpose of this study due to its proven ability in providingreliable results (Gholami et al., 2015c). The fourth track of Fig. 4shows the friction angle estimated from the above analysis. TheUCS of rocks, however, was estimated using the correlation pro-posed by Bradford et al. (1998) through the use of the static Young’smodulus. The estimated UCS log was then calibrated against thelaboratory core test data. The second track of Fig. 5 displays theestimated UCS log where a good match between the estimated logand laboratory data is observed.
The pore pressure was estimated using Eaton’s equation (Eaton,1975) based on the inherent relationship of the pore pressure with
Fig. 7. Shear failure, shape factor and volume of sand predicted by the HoekeBrown criterion.
R. Gholami et al. / Journal of Rock Mechanics and Geotechnical Engineering 8 (2016) 521e532 529
P-wave velocity data (sonic log). The pore pressure log was cali-brated against modular dynamic formation tester (MDT) data. Theestimated pore pressure profile is shown in the third track of Fig. 5.
The vertical stress (sV) was estimated by integrating the bulkdensity, acceleration, and depth (Fjaer et al., 2008). The magni-tude of horizontal stresses was determined using the poroelasticequations (Gholami et al., 2015a, b). The leak-off test (LOT) datawere used to calibrate the magnitude of the minimum horizontalstress while failures (break-out) observed in the caliper logs wereemployed to fix the magnitude of the maximum horizontal stress.The last track of Fig. 5 gives the magnitude of the effectivevertical (SV, sV), minimum horizontal (Shmin, shmin) andmaximum horizontal (SHmax, sHmax) stresses. As shown in thisfigure, the stress regime in the field is reversed (i.e.sV < shmin < sHmax).
5. Sand volume calculations
5.1. During drilling
An excessive sand/solid production has been reported in thefield of current study during the drilling and production stages
while the source of sanding in these two phases was quite different.According to the field and drilling reports, sand was produced fromshale and tight formations during drilling while fractured lime-stone reservoirs were the origin of sanding during depletion.Having the details of the sand production in different stages of thewell development, the methodology presented earlier was appliedto assess its applicability in predicting the sanding during thedrilling operation. The results obtained from this analysis areshown in Figs. 6e8 for different criteria.
Comparing the predictions provided with the breakoutsobserved in the caliper log, it is found that almost all of the failurecriteria are able to provide reasonable results, even though theprediction made by the MogieCoulomb criterion is closer to thereality. However, the objective of current study is to evaluate theefficiency of these criteria in prediction of the shape factor andchanges in the diameter of the borehole. As is indicated earlier, thevolume changes, as a result of the enlargement of the borehole, arerelated to the volume of sand that will be produced during drilling.Thus, the shape factor parameter c corresponding to differentcriteria is estimated from Eqs. (8), (14) and (22) and plotted alongwith the volume of produced sand estimated from Eq. (11), in thelast two tracks of Figs. 6e8.
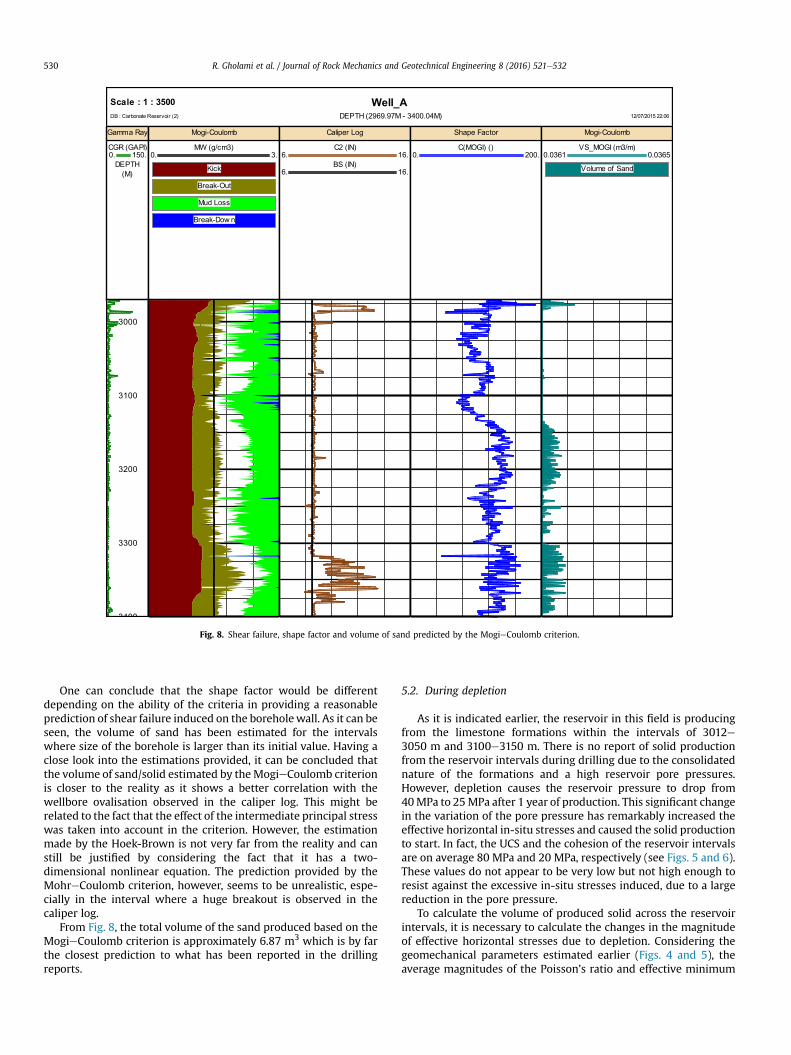
Fig. 8. Shear failure, shape factor and volume of sand predicted by the MogieCoulomb criterion.
R. Gholami et al. / Journal of Rock Mechanics and Geotechnical Engineering 8 (2016) 521e532530
One can conclude that the shape factor would be differentdepending on the ability of the criteria in providing a reasonableprediction of shear failure induced on the boreholewall. As it can beseen, the volume of sand has been estimated for the intervalswhere size of the borehole is larger than its initial value. Having aclose look into the estimations provided, it can be concluded thatthe volume of sand/solid estimated by theMogieCoulomb criterionis closer to the reality as it shows a better correlation with thewellbore ovalisation observed in the caliper log. This might berelated to the fact that the effect of the intermediate principal stresswas taken into account in the criterion. However, the estimationmade by the Hoek-Brown is not very far from the reality and canstill be justified by considering the fact that it has a two-dimensional nonlinear equation. The prediction provided by theMohreCoulomb criterion, however, seems to be unrealistic, espe-cially in the interval where a huge breakout is observed in thecaliper log.
From Fig. 8, the total volume of the sand produced based on theMogieCoulomb criterion is approximately 6.87 m3 which is by farthe closest prediction to what has been reported in the drillingreports.
5.2. During depletion
As it is indicated earlier, the reservoir in this field is producingfrom the limestone formations within the intervals of 3012e3050 m and 3100e3150 m. There is no report of solid productionfrom the reservoir intervals during drilling due to the consolidatednature of the formations and a high reservoir pore pressures.However, depletion causes the reservoir pressure to drop from40MPa to 25MPa after 1 year of production. This significant changein the variation of the pore pressure has remarkably increased theeffective horizontal in-situ stresses and caused the solid productionto start. In fact, the UCS and the cohesion of the reservoir intervalsare on average 80 MPa and 20 MPa, respectively (see Figs. 5 and 6).These values do not appear to be very low but not high enough toresist against the excessive in-situ stresses induced, due to a largereduction in the pore pressure.
To calculate the volume of produced solid across the reservoirintervals, it is necessary to calculate the changes in the magnitudeof effective horizontal stresses due to depletion. Considering thegeomechanical parameters estimated earlier (Figs. 4 and 5), theaverage magnitudes of the Poisson’s ratio and effective minimum
R. Gholami et al. / Journal of Rock Mechanics and Geotechnical Engineering 8 (2016) 521e532 531
and maximum horizontal stresses in the reservoir intervals wereconsidered to be 0.3, 60MPa, and 78MPa, respectively. Substitutingthe above-mentioned values into Eqs. (27) and (28), the magni-tudes of effectiveminimum andmaximumhorizontal stresseswereobtained to be 68.5 MPa and 86.5 MPa, respectively.
The parameter c was then calculated based on the MogieCoulomb criterion (Eq. (25)) due to its better efficiency in predic-tion of sanding during drilling. The results obtained indicated a1.5 cm enlargement in the size of the wellbore resulting in a totalamount of 1.1 m3 produced sands. The calculations indicated that avolume of 0.3 m3 was produced from the interval of 3012e3050 mwith the remaining of 0.8 m3 being produced from the interval of3100e3150m. In the above calculations, the parameter b, the radiusof the intact borehole (see Fig. 1), is assumed as 0.216 m, as shownin the third tracks of Figs. 6e8.
The production reports from this field has estimated an averageof 0.9 m3 solid being produced from the reservoir intervals afterone year, which resulted in using gravel pack to stop sanding.
6. Conclusions
In this study, a new approach based on the changes in thediameter of the borehole was presented to estimate the volume ofsand produced during drilling and production. A shape factorparameter was introduced to capture the change in the geometry ofthe borehole taken place due to the excessive hoop stress. Threefailure criteria were used to develop equations for determination ofthe shape factor and the models were applied to a well located inthe south of Iran. The results obtained indicated that taking theeffect of the intermediate stress into account by employing a three-dimensional failure criterion can provide reliable results when itcomes to the prediction of shear failure and volume of sand. Theclose agreement between the values predicted by the presentedapproach and those given in the drilling and production reportsindicates the applicability of the model. However, the approachpresented requires determination of the geomechanical parame-ters before initiation of depletion due to the variation of the porepressure. This means that it would be hard to apply this method-ology directly into production stage to predict sanding.
Conflict of interest
The authors wish to confirm that there are no known conflicts ofinterest associated with this publication and there has been nosignificant financial support for this work that could have influ-enced its outcome.
References
Aadnoy BS. Effects of reservoir depletion on borehole stability. Journal of PetroleumScience and Engineering 1991;6(1):57e61.
Aadnoy BS, Kaarstad E. History model for sand production during depletion. In:Proceedings of the SPE EUROPEC/EAGE Annual Conference and Exhibition.Barcelona, Spain: Society of Petroleum Engineers; 2010. p. 14e7.
Abass HH, Nasr-El-Din HA, BaTaweel MH. Sand control: sand characterization,failure mechanisms, and completion methods. In: Proceedings of the SPEAnnual Technical Conference and Exhibition. San Antonio, Texas: Society ofPetroleum Engineers; 2002. p. 1e8.
Abdollahie Fard I, Braathen A, Mokhtari M, Alavi SA. Interaction of the Zagros fold-thrust belt and the Arabian-type, deep-seated folds in the Abadan Plain and theDezful Embayment, SW Iran. Petroleum Geoscience 2006;12(4):347e62.
Addis MA, Gunningham MC, Brassart PC. Sand quantification: the impact oncompletion design, facilities design and risk evaluation. In: SPE Annual Tech-nical Conference and Exhibition. Denver: Society of Petroleum Engineers; 2008.p. 1e18.
Alavi M. Regional stratigraphy of the Zagros fold-thrust belt of Iran and its pro-foreland evolution. American Journal of Science 2004;304(1):1e20.
Al-Ajmi AM, Zimmerman RW. Relationship between the parameters of the Mogiand Coulomb failure criterion. International Journal of Rock Mechanics andMining Sciences 2005;42(3):431e9.
Berberian M. Master “blind” thrust faults hidden under the Zagros folds: activebasement tectonics and surface morphotectonics. Tectonophysics 1995;241(3/4):193e224.
Bradford IDR, Fuller J, Thompson PJ, Walsgrove TR. Benefits of assessing the solidsproduction risk in a North Sea reservoir using elastoplastic modelling. In: SPE/ISRM 47360, Proceedings of Eurock ’98 e SPE/ISRM Rock Mechanics in Petro-leum Engineering. Trondheim, Norway: Society of Petroleum Engineers; 1998.p. 261e9.
Bratli RK, Risnes R. Stability and failure of sand arches. Society of Petroleum Engi-neers Journal 1981;21(2):236e48.
Cerasi P, Papamichos E, Stenebraten JF. Quantitative sand production prediction:friction-dominated flow model. In: SPE Latin American and Caribbean Petro-leum Engineering Conference. Rio de Janeiro: Society of Petroleum Engineers;2005. p. 1e10.
Colmenares LB, Zoback MD. A statistical evaluation of intact rock failure criteriaconstrained by polyaxial test data for five different rocks. International Journalof Rock Mechanics and Mining Sciences 2002;39(6):695e729.
Detournay C, Tan C, Wu B. Modeling the mechanism and rate of sand productionusing FLAC. In: Proceedings of the 4th International FLAC Symposium on Nu-merical Modeling in Geomechanics. Minneapolis: Itasca Consulting Group;2006. p. 8e10.
Eaton BA. The equation for geopressure prediction from well logs. Society of Pe-troleum Engineers of AIME; 1975. SPE 5544.
Ewy RT, Ray P, Bovberg CA, Norman PD, Goodman HE. Openhole stability andsanding predictions by 3D extrapolation from hole collapse tests. SPE Drilling &Completion 2001;16(4):243e51.
Fjaer E, Holt RM, Horsrud P, Raaen AM, Risnes R. Chapter 3 geological aspects ofpetroleum related rock mechanics. Developments in Petroleum Science2008;53:103e33.
Gholami R, Rasouli V, Aadnoy B, Mohammadnejad M. Geomechanical and numer-ical studies of casing in reservoir with solid production. Rock Mechanics andRock Engineering 2015. http://dx.doi.org/10.1007/s00603-015-0828-5.
Gholami R, Rasouli V, Aadnoy B, Mohammadi R. Application of in-situ stress esti-mation methods in wellbore stability analysis under isotropic and anisotropicconditions. Journal of Geophysics and Engineering 2015b;12(4):1e17.
Gholami R, Rabie M, Rasouli V, Aadnoy B, Fakhari N. Application of quantitate riskassessment in wellbore stability analysis. Journal of Petroleum Science andEngineering 2015c;135:185e200.
Hoek E, Brown ET. Underground excavations in rock. London: Institution of Miningand Metallurgy; 1980.
Hoek E, Brown ET. Practical estimates or rock mass strength. International Journal ofRock Mechanics and Mining Sciences 1997;34(8):1165e86.
Hoek E, Carranza-Torres CT, Corkum B. HoekeBrown failure criterion d 2002 edi-tion. In: Proceedings of 5th North American Rock Mechanics Symposium. Tor-onto, Canada: Rocscience; 2002. p. 267e73.
Hoek E, Kaiser PK, Bawden WF. Support of underground excavations in hard rock.Rotterdam: A.A. Balkema; 1995. p. 225.
Homke S, Vergés J, Serra-Kiel J, Bernaola G, Sharp I, Garcés M, Montero-Verdu I,Karpuz R, Goodarzi MH. Late CretaceousePaleocene formation of the proto-Zagros foreland basin, Lurestan Province, SW Iran. Geological Society ofAmerica Bulletin 2009;121:963e78.
James GA, Wynd JG. Stratigraphic nomenclature of Iranian oil consortium agree-ment area. The American Association of Petroleum Geologists Bulletin1965;49(12):2182e245.
Kooijman AP, van den Hoek PJ, De Bree Ph, Kenter CJ, Zheng BVZ, Khodaverdian M.Horizontal wellbore stability and sand production in weakly consolidatedsandstone. In: SPE Annual Technical Conference and Exhibition. Denver, Colo-rado: Society of Petroleum Engineers; 1996. p. 35e48.
Lamorde M, Somerville JM, Hamilton AS. Application of the yield energy approachto prediction of sand debris production in reservoir sandstones. In: SPE NigeriaAnnual International Conference and Exhibition. Lagos, Nigeria: Society of Pe-troleum Engineers; 2014. p. 1e21.
Lee YK, Bobet A. Instantaneous friction angle and cohesion of 2-D and 3-D HoekeBrown rock failure criteria in terms of stress invariants. Rock Mechanics andRock Engineering 2014;47(2):371e85.
Maleki S, Gholami R, Rasouli V, Moradzadeh A, Riabi RG, Sadaghzadeh F. Compar-ison of different failure criteria in prediction of safe mud weigh window indrilling practice. Earth-Science Reviews 2014;136:36e58.
McLellan PJ, Wang Y. Predicting the effects of pore pressure penetration on theextent of wellbore instability: application of a versatile poro-elastoplasticmodel. In: Proceedings of Eurock ’94 e SPE/ISRM Rock Mechanics in Petro-leum Engineering. Delft, Netherlands: Society of Petroleum Engineers; 1994.p. 205e14.
Mogi K. Fracture and flow of rocks under high triaxial compression. Journal ofGeophysical Research 1971;76(5):1255e69.
Morita N, Whitfill DL, Fedde OP, Lovik TH. Parametric study of sand-productionprediction: analytical approach. SPE Production Engineering 1989;4(1):25e33.
Nouri A, Vaziri H, Belhaj H, Islam R. Effect of volumetric failure on sand productionin oil-wellbore. In: SPE Asia Pacific Oil and Gas Conference and Exhibition.Jakarta, Indonesia: Society of Petroleum Engineers; 2003. p. 1e8.
Nouri A, Vaziri H, Belhaj H, Islam R. Sand-production prediction: a new set ofcriteria for modeling based on large-scale transient experiments and numericalinvestigation. SPE Journal 2006;11(2):26e9.
R. Gholami et al. / Journal of Rock Mechanics and Geotechnical Engineering 8 (2016) 521e532532
Nouri A, Vaziri H, Belhaj H, Islam R. Comprehensive transient modeling of sandproduction in horizontal wellbores. SPE Journal 2007;12(4):1e9.
Osisanya OS. Practical guidelines for predicting sand production. In: Nigeria AnnualInternational Conference and Exhibition. Tinapa e Calabar, Nigeria: Society ofPetroleum Engineers; 2010. p. 1e8.
Palmer ID, McLennan JD, Vaziri HH. Cavity-like completions in weak sands. In: SPEInternational Symposium on Formation Damage Control. Lafayette, Louisiana:Society of Petroleum Engineers; 2000. p. 1e9.
Papamichos E, Malmanger EM. A sand erosion model for volumetric sand pre-dictions in a North Sea reservoir. In: Latin American and Caribbean PetroleumEngineering Conference. Cancaras, Venezuela: Society of Petroleum Engineers;1999. p. 2e9.
Papamichos E, Furui K. Sand production initiation criteria and their validation. In:47th U.S. Rock Mechanics/Geomechanics Symposium. San Francisco, California:American Rock Mechanics Association; 2013. p. 1e9.
Plumb RA. Influence of composition and texture on the failure properties of clasticrocks. In: Eurocks 94, Rock Mechanics in Petroleum Engineering Conference.Delft, Netherlands: Society of Petroleum Engineers; 1994. p. 13e20.
Risnes R, Bratli RK, Horsrud P. Sand stresses around a wellbore. Society of PetroleumEngineers Journal 1982;22(6):883e98.
van den Hoek PJ, Kooijman AP, de Bree Ph, Kenter CJ, Sellmeyer HJ, Willson SM.Mechanisms of downhole sand cavity re-stabilisation in weakly consolidatedsandstones. In: SPE European Petroleum Conference. Paris, France: Society ofPetroleum Engineers; 2000. p. 1e9.
Vaziri H, Lemoine E, Palmer I, McLennan J, Islam R. How can sand production yield aseveral-fold increase in productivity: experimental and field data. In: SPEAnnual Technical Conference and Exhibition. Dallas, Texas: Society of PetroleumEngineers; 2000. p. 1e12.
Vaziri H, Barree B, Xiao Y, Palmer I, Kutas M. What is the magic of water in pro-ducing sand?. In: SPE Annual Technical Conference and Exhibition. San Antonio,Texas: Society of Petroleum Engineers; 2002. p. 1e13.
Veeken CAM, Davies DR, Kenter CJ, Kooijman AP. Sand production prediction re-view: developing an integrated approach. In: SPE Annual Technical Conferenceand Exhibition. Dallas, Texas: Society of Petroleum Engineers; 1991. p. 335e46.
Wang HF. Theory of linear poroelasticity. Princeton: Princeton University Press;2000a.
Wang Z. Dynamic versus static elastic properties of reservoir rocks. In: Wang ZJ,Nur A, editors. Seismic and acoustic velocities in reservoir rocks. Tulsa: Societyof Exploration Geophysicists; 2000b. p. 531e9.
Wang Y, Dusseault MB. Borehole yield and hydraulic fracture initiation in poorlyconsolidated rock strata e Part II. Permeable media. International Journal ofRock Mechanics and Mining Sciences & Geomechanics Abstracts 1991;28(4):247e60.
Wang Y, Papamichos E. Sand prediction by different criteria and a validation by aperforated test in a sandstone. In: SPE Heavy Oil Conference Canada. Calgary,Alberta, Canada: Society of Petroleum Engineers; 2012. p. 2e9.
Watson K, Jones C. FEA modeling of expandable sand screens interactions with rockformations. In: Simula Customer Conference, SCC 2009. London: DassaultSystem; 2009. p. 1e12.
Weingarten JS, Perkins TK. Prediction of sand production in gas wells: methods andGulf of Mexico case studies. Journal of Petroleum Technology 1995;47(7):596e600.
Dr. Raoof Gholami is a geomechanical and drillingspecialist in Department of Petroleum Engineering atCurtin University, Malaysia. He accomplished his BSc andMSc in Mining Engineering and got a PhD in Geo-mechanics from Shahrood University of Technology, Iran.He had been involved in many geomechanical relatedprojects with National Iranian Oil Company (NIOC) overthe past six years. He joined Curtin University in 2013 andis closely working with Shell and Petronas Oil Companiesfor geomechanical and CO2 sequestration related projects.