An overview and evaluation of quality‐improvement methods from the manufacturing and supply‐chain perspective
Radej, B.a,*, Drnovšek, J.a, Begeš, G.a aUniversity of Ljubljana, Faculty of Electrical Engineering, Laboratory of Metrology and Quality, Slovenia
A B S T R A C T A R T I C L E I N F O
Inrecentyears,besideshighproductivityofthemanufacturingprocess,quali‐ty issues (including safety requirements and cost efficiency) have both be‐comemajormarketdrivers.Inordertomeetalltheaboveobjectives,soastoachieve competitive advantages, a number of quality techniques need to beimplemented within the manufacturing process. Starting from the generalmanufacturingmodel and presenting a supply‐chain philosophy, this paperprovidesanoverviewof thequality toolsandmethodssuchasquality tech‐niques and links tomanufacturing process quality andmanufacturing cost‐effectiveness; it focuses on manufacturing processes and perceived qualityproblems associatedwith the supplier’s quality issues. Additionally, the im‐pact of the component supplier on the overall quality of the final productneeds to be distinguished from the impact of the manufacturing process.Basedonthemodelofthegeneralmanufacturingprocesstheauthorsproposemethodsofeffectivedeployment for themostcommonqualitymethodsandtools within different manufacturing areas. In the discussion the authorspropose certain quality techniques to improve the key performance indica‐tors(KPI)withinthemanufacturingprocess.
Customersdefinethefunctionalrequirementsofproducts,whilemanufacturersneedtorespondappropriatelyandprovide themarketwithproducts that customerswill accept [1].Customerrequirements or trends in themarket change quickly; therefore,manufacturers are forced toreorganizeinternalprocessesandquicklyrespondtothechangingneedsofthemarket[2].Thisstudy shows that suppliermanagement is essential to ensure product/service quality [3]. Toachievestability in therelationship,companiesshouldchoosesuppliersbasedontheirqualityand reliability, encourage theirparticipation in thedesignofproducts and try to improve thesuppliers’awarenessoftheimportanceofquality.Qualityassuranceisoneofthemostessentialprocessesinthesupplychain;therefore,specificqualitymethodsandtoolsneedtobeemployed.Since there aremanydifferentmethods and tools available, the characteristicsneed tobe as‐sessed,benefitsandweaknessesneedtobeexposed,andoptimalapplicationareashavetodedefined.
An overview and evaluation of quality‐improvement methods from the manufacturing and supply‐chain perspective
Advances in Production Engineering & Management 12(4) 2017 389
2. Quality assurance and manufacturing processes
Amanufacturercanonlybeeffectiveifthelevelofqualityperceivedbythebuyersofitsprod‐uctsisachieved.Sinceallproductionprocesseswithinmanufacturingcompaniesaresupportedbysupply‐chainmanagement,itiscrucialtounderstandthequalityofthesupply‐chainnetwork.Suppliers have taken on the responsibility to constantly ensure an adequate level of quality,whichinturnhasresultedinanoverallincreaseinthereliabilityofproducts[4,5].
2.1 General manufacturing model
Asupply‐chainnetworkissupplyingmaterialcomponentstoamanufacturingcompany,whichisconvertingthemintofinalproducts–thefinalproductsarethensoldtothefinalcustomer.Anon‐goingsellingprocessisonlypossibleifthemanufacturingcompanyisabletoproduceprod‐uctsthatarefulfillingrequirementsrelatedtoqualityandfunctionality,definedbothbythecus‐tomerandlocal legislation[5].Qualitysupervisioniscarriedoutbythebuyersofcomponents(manufacturing companies),whichbyusing the (un)announcedauditsofprocesses andprod‐uctshaveoverseentheworkofsuppliersandthereforeprovidedanappropriatelevelofproductquality,whichisessentialforthesatisfactionofendcustomers.Somemanufacturers,despitetheimplemented ISO standards, started to demand that their component suppliers comply withspecificquality requirements,which theydefine additionallyby themselves.This requirementstems from the conviction ofmanufacturers that by defining and realizing specific quality re‐quirements they will, to the greatest extent, meet the expectations of the customer for theirproducts [7]. Globalizationhas resulted in the best tools andmethods for the optimization ofbusinessprocesses,toolswhichhavebeenrefinedandpositivelyproveninvariouspartsoftheworld[8].Withtheaimofmaximizingtheprofitsofthebusiness,thereisastrongmotivationforthemanufacturertoemploythecost‐effectiveimplementationofinternalcompanyprocesses[9].
Market requirements aremetwhenan adequate quality level is integrated and thequalitytraceabilityisensuredinthemanufacturingprocess,whichneedstoproduceproductswithanacceptablecost.Thisknown fact cannotbe linked just to themanufacturer’sprocesses,but tothe supplierprocesses aswell – theybothneed to ensure that thequality standards aremet,otherwise theproductswill failon themarket.Theagreedpropertiesof the finalproductcanonlybeachievedifthesupplier'scomponentwiththeproperqualityisusedinawell‐designed(also in relation to the supplier's component)manufacturingprocess.Due to the fact that themajorityofmanufacturersoutsourcecomponentproduction,manysuppliersareforcedtoinvestinmethodsandsystemstoimprovethequalityoftheirproduction,whichalsoincludesatracea‐bilitysystemthatprovidesaninsightintothemanufacturinghistoryofeachindividualcompo‐nent.Quiteoften theproduction facilitiesarearrangedatdifferent locations in the factories–subassembliesandmanufacturingprocessesareassignedtocertainproductionchecks,namedfinalqualitycontrol,whichareprovidingthedigitaldatabymeansofwhichthehistoryofpro‐ductionforeachproductcanbedeterminedinthecontrolsystemofproduction[14‐16].
An overview and evaluation of quality‐improvement methods from the manufacturing and supply‐chain perspective
Advances in Production Engineering & Management 12(4) 2017 391
Fig.2Anexampleofasupplychain[6]
3. Evaluation of common quality methods and tools
Theconceptofprovidingqualityproducts includesnotonly the fulfilmentof customerneeds,but also the ability tomaintain and service thoseproducts at low cost. Thequality‐assurancesystemwas originally developed by the Toyota Motor Corporation and was later named theToyotaProductionSystem.Thehighlevelofqualityoftheirvehicleswasachievedthroughthestandardizationofprocessesandtheestablishmentofeffectivecommunicationswithinthede‐partmentsofthecompany.Theactivitiesofthestaffwerefocusedonobtaininginformationbyaudits, inspections, tests and analyses of a variety of development and production processes.DuetoadecreaseinthevalueofstocksofmaterialsToyotaneededtoensurehighflexibilityinmanufacturing,whichfollowedthevolumeofvehiclesales,whileothercarmanufacturerspro‐ducedvehiclesonstock,butthensubsequentlyfailedtosellthem.Themethodologyofobtaininginformationthroughassessment,testingandinspection,andthecreationofflexibleproduction,waslaternamedleanproduction[17].
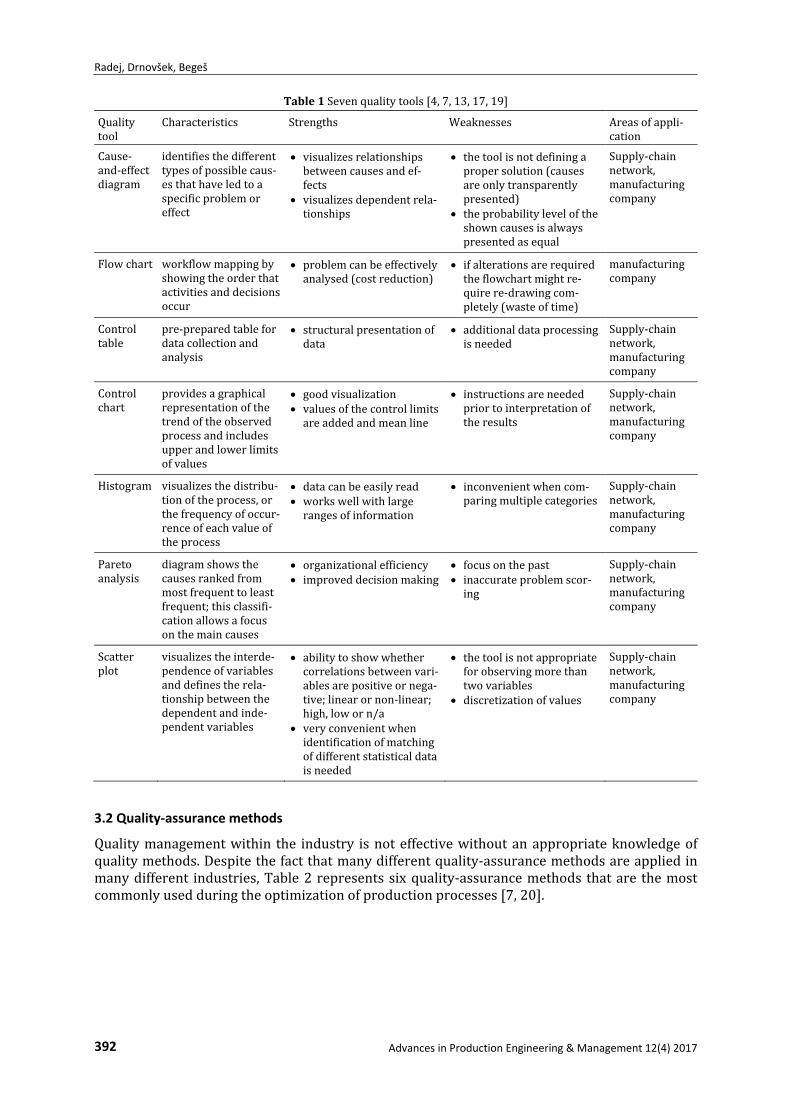
3.1 Quality tools
The seven basic quality tools were defined by Kaoru Ishikawa and used for problem‐solvingpurposes.Ishikawaisofopinionthat90%ofallissuescouldbesolvedusingsevenqualitytools,whicharepresentedinTable1[18,19].
The characteristics of all seven tools are presented, and the strengths andweaknesses arehighlighted.Basedonageneralmanufacturingmodel,presentedinFig.1,potentialmanufactur‐ingareasarepresented.
Radej, Drnovšek, Begeš
392 Advances in Production Engineering & Management 12(4) 2017
Qualitymanagementwithin the industry isnoteffectivewithoutanappropriateknowledgeofqualitymethods.Despitethefactthatmanydifferentquality‐assurancemethodsareappliedinmanydifferent industries,Table2representssixquality‐assurancemethods thatare themostcommonlyusedduringtheoptimizationofproductionprocesses[7,20].
An overview and evaluation of quality‐improvement methods from the manufacturing and supply‐chain perspective
Advances in Production Engineering & Management 12(4) 2017 393
TheclassicPDCAmethodincludesfourelementsofprocesscontrol:planning(preparationofthequality‐assuranceplan),execution(integrationofimprovementmeasures),checking(controlofeffects)andaction(implementationofmeasuresaccordingtothedetermineddeviationsinthecontrolof effects) [10,22].TheclassicPDCAmethodexcludesperformancemonitoring toen‐suretheon‐goingeffectivenessofchange.Andersenetal.[11]statethattheusersoftheclassicPDCAmethodarenotexperiencedenoughtouseitinaneffectiveway,andthereforetheypro‐poseanimprovedtypeofPDCAmethod,whichincludestheelementsshowninFig.3:character‐izationandresearch into theproblem,analysing thesituation,preparationofmeasures to im‐prove, a critical assessment of the reasonableness of the measures, implementation of themeasures,andcheckingtheeffectsoftheimplementedmeasuresforimprovement.
A reduction* of 100% is achieved by using the error prevention Poka‐Yokemethod, pro‐posedbytheimprovedPDCAmethod.However,wecannotgeneralizethestatementthattheuseoftheimprovedPDCAmethodwillalwayseliminateproductswithunacceptablequality.BasedonaparallelcomparisonofPDCAmethods,shownabove,thesameprocedurecouldbeappliedforotherqualitytoolsandmethods.
Thequestionis,whatgoalsdoesacompanyenvisagetosatisfyormerelypleaseitscustomers?Theanswertothisquestion is theQFDmethod,whichrepresentsaqualitysystemfocusedonthecustomer(Fig.4).Themethodinitiallyidentifiesthecustomers'needsandexpectations,andthendefinesthecorrectresponsestothem.QFDisamethodenablingcompaniestoachievetheoptimalsatisfactionofitscustomers[17].
An overview and evaluation of quality‐improvement methods from the manufacturing and supply‐chain perspective
Advances in Production Engineering & Management 12(4) 2017 395
The QFDmethod represents a process that allows the identification of customer require‐
ments,understandingmarketsandknowledgeofdifferentcustomersegments.TheconditionsforthesuccessfulimplementationoftheQFDmethodareathoroughknowledgeoftherequire‐mentsofeachcustomersegment,howimportantthecustomer'sbenefit isandhoweffectivelytheserequirementsaremetbyexistingsuppliersofproducts/services[23,35]. If thesecondi‐tionsarenotmet,thecustomerrequirementsareobviouslyunknownand,consequently,prod‐ucts/servicescannotbeconsistentlydeliveredtothemarketandwouldpreventcustomersfrombeinggenerallysatisfied[36].TheQFDmethodisthereforeaquality‐assurancesystemwiththeaimofmaximizing the customer's satisfaction. It focusesonprovidingvalue in aproduct thatdelivers both spoken and unspoken customer requirements or expectations. These require‐mentsaretranslatedintothe(developmentandproduction)activitiesoftheproducer.TheQFDmethodallowscross‐referencingoftheproduct’sproducerwithitscompetitionbyhelpingthecompany todirect furthersteps in thedirection thatwillhelp increasecompetitiveadvantage[23,34].
3.3 Influence of the quality of the manufacturing processes on manufacturing cost efficiency
Thepurposeofthissectionistohighlighttheconnectionbetweenthehigh‐qualitymanufactur‐ing processes and the cost efficiency of themanufacturing process. Companies are aiming todevelophigh‐qualitymanufacturingprocesses,whichareinturnenablinghigherprofitsforthecompany. For that reason there is a need to reliably assess themanufacturing cost efficiency.Therearevariousauthorsexpressingdifferent innovativeapproachesrelated to themeasure‐mentandimprovementofprocessefficiency.AccordingtoHendricksetal.[32],productqualityiscrucialtothesuccessofanycompany–asevidencedbythestatementthatthecompaniesthatarewinningawards foroutstandingquality, achievehigherprofits andahighervalueof theirsharesonthestockmarket.
Processcontrolisveryimportantforimprovingtheefficiencyofproductionprocesses.Eachserialproduction isdesigned in suchaway that it canbeeffectivelymonitored,whichcanbedone throughconstantcontrolof importantparameters,whereby it isnecessary toeffectivelyrespondtoanyperceiveddeviationfromthenominalvalue.Theefficiencyofthemanufacturingprocessesiscloselyassociatedwithproductivityprocesses–itisimportanttoensureacontinu‐ousproductionprocesswithorwithouttheshortest‐possiblestandstillandwithzeroormini‐mumpoor‐qualityproducts[24].Hanenkamp[25]describesamethodforthecontrolofproduc‐tionprocesses,describedas"OverallEquipmentEfficiency"(OEE),whichusestherelativevaluetodefinethelevelofavailabilityofmachineryandequipment,quantityandthedegreeofprod‐uctquality,withEq.1:
y (1)
Theavailability rate is the ratio between the availableworking timeof themachinery andequipmentandtheiractualworkingtime;theproductivityrateistheratiobetweentheavailable
Radej, Drnovšek, Begeš
396 Advances in Production Engineering & Management 12(4) 2017
Involvingemployeesinaprocess‐performancemeasurement(OEE,productivity,etc.)isveryimportant.Theproductivityofcompaniesisaffectedbytheuseofthe5Smethod,describedasamethod for organizing and standardizing workplaces within the company. An appropriatelystructured workplace motivates employees, both production workers and management, im‐provesoccupationalsafety,theproductivityoftheprocessandevokesasenseofresponsibilityamongtheemployees[24‐28].
Several authors [25, 28‐30] also mention the Shop Floor Management method (SFM), themainadvantageofwhich isasystematic,process‐oriented industrialwayofsolvingproblems.The SFM method pursues three objectives: gemba (real venue, for example, assembly line),genbutsu(detailedknowledgeoftheaffectedprocess,e.g.,increasedscrap)andgenjitsu(defini‐tionandimplementationofcorrectiveactionsthatwillimprovethecurrentissue).Tancoetal.[31]proposeamethodologytomeasuretheimpactofSFMondefect‐freeproduction,whichcanbesummarisedinthefollowingsteps:a)chooseanadequateresponse(theimpactofSFMshouldbemeasuredindifferentways:firstly,astheimpactondefect‐freecarsandtheninthelastqual‐ity‐controlstage),b)gathersignificantdata(tocarryoutarelevantstatisticalanalysis,asignifi‐cant amount of datamust be gathered to give certainty to results), c) analyse several factors(productionlevel,weekday,shifts,qualitylevel),d)drawconclusionsandrecommendations.
Jingshanetal.[33]speakaboutthecertaindemiseofacompany,ifthecompanyisonlypar‐tially focusedon improving the levelofquality.Theypointout thatproductquality isnot justvitalfortheprofitabilityofthecompany,butalsoforitsexistence.Manufacturerswanttocoop‐eratewithfewersuppliers,butthelatterneedtobelargeandstrongenoughforallthecustom‐er’s requirements. This is due to the fact that the typical construction of products requires alargenumberofcomponents;therefore,itmakessensethatasmanycomponentsaspossiblearesuppliedbyoneorafewsuppliers.Thereisariskthatthepartspurchasedfromalargenumberof supplierswould not be compatible [17]. Production‐oriented companies implement opera‐tional processes by attempting to minimize resource consumption, in addition to realizingplannedquantitiesofproductsthatmeetcustomerrequirementsregardingquality[36].
Manufacturingefficiencyisofhugeimportancewithineverycompany.Itisimportanttoen‐sureacontinuousmanufacturingprocesswiththeshortestpossiblestandstillandwiththemin‐imumnumber of poor‐quality products. Therefore,manufacturingprocesses are cost efficientonly if there is a reliable performancemeasurement integrated (established by SFMmethod)andifthemind‐setoftheemployeesisacceptingtheimportanceofquality(qualitymethodsandtools).Fig.5illustratesmajorcontributorstotheimprovedcostefficiencyofmanufacturingpro‐cesses,wherethevalueofeachcontributorisassessedbasedontheavailableliterature[24,25,28‐30,32,33,36].
An overview and evaluation of quality‐improvement methods from the manufacturing and supply‐chain perspective
Advances in Production Engineering & Management 12(4) 2017 397
4. Discussion
Thefutureofcomponentsupplierswillbefinanciallysuccessfulonly if theyreducethecostofdoingbusinessandstarttoproduceproductsthatcanbesoldtodifferentcustomers,evenbe‐yond their core sector. Productivity and scrap levels impact on the operating costs, notesHanenkamp[25],whorecommendstheuseofmethodologiesformeasuringtheOEE.Fromthemanufacturer’spointofviewthemeasurementofproductivityandOEEisimportantbecauseitexposesprocessdeviationsinrealtimeandenablesopportunitiesforprocessimprovements.
Fromthemanufacturingpointofviewandbasedonmanufacturingexperienceswepresentsome exampleswhere the application of certain quality techniques (combination of tools andmethods,presentedinTable3)canbeimplemented:
bypoorproductdesign,isresultinginalowerproductyieldandalowerOEEofproductionline,while the increased scrap rate, caused by poor process design, is again resulting equally in alower OEE of production line. The correlation between product and process improvement isthereforemutual,as the improvementof theproductwilldirectly improveprocessesandviceversa.
Although themost criticalmanufacturingprocesses canbe detectedusing the SPCmethod
and control chart tool,we areof theopinion that the application of the SFMmethoddeliversbetterresultsthroughtheidentificationandimplementationofcorrectiveactionsthatwill im‐provethecurrentissue,whichwillresult inimprovedOEE.Inaddition,theSFMmethodmoti‐vates employees and their leaders through its systematic approach,where quality techniquesneedtobeappliedtoeverysinglequalityissue.
Based on manufacturing experiences, where customer satisfaction with a product alwaysplaysabigroleinacompany,weproposetheuseoftheQFDmethod,whichsuccessfullytrans‐lates customer requirements into product specification. During themass production of thoseproductstherearevariousmanufacturingissues,relatedtothequalityoftheproduct,whichcanbesolvedbytheuseofthenewPDCAmethod.
This paper initially describes quality challenges within manufacturing processes, which isachievedthroughtheintegrationofthequalitytoolandmethods.Thestrengthsandweaknessesofvariousqualitymethodsand toolsarerevealedandpotentialapplications inmanufacturing
An overview and evaluation of quality-improvement methods from the manufacturing and supply-chain perspective
fields are presented. The parallel application of two quality methods on a manufacturing process was performed, while the positive effect of the usage is proved with a decrease of 44 % (first method) and 100 % (second method) of products with unacceptable quality.
The concepts of high OEE and high manufacturing quality are shown to be very important to secure a positive financial future for the company. Therefore, this article as a review of common quality tools and methods serves as an incentive for the definition of a new approach to the im-provement of OEE, the reduction in the rate of complaints and the procedures for a faster and more efficient response to deviations within production processes.
Based on a general manufacturing model we propose a generic flow chart that identifies qual-ity techniques for a particular KPI within the manufacturing process. Manufacturing processes are cost efficient only if there is a reliable performance measurement integrated and if the mind-set of employees is willing to accept the importance of quality; therefore, we can also conclude that the use of methods and tools (QFD, 5 S, PDCA and SFM) significantly improves the efficiency of the processes.
This paper should serve as a basis for carrying out detailed analyses of manufacturing pro-cesses before and after the implementation of the above-described quality techniques. Conse-quently, manufacturing managers could motivate their staff to implement the above-described quality-assessment techniques more effectively.
Acknowledgment We sincerely thank the reviewers of this journal for their insightful comments which helped us improve the quality of this paper. Authors are expressing their gratitude to Faculty of Electrical Engineering, Laboratory of Metrology and Quality for their financial support.
References [1] Tang, D. (2005). Partnership development between product customer and tool and die supplier, Proceedings of
the Institution of Mechanical Engineers, Part B: Journal of Engineering Manufacture, Vol. 219, No. 4, 365-376, doi: 10.1243/095440505X32265.
[2] Hirsh, E., Kakkar, A., Singh, A., Wilk, R. (2015). Auto industry trends; Industry perspectives, PriceWaterhouse-Coopers International Limited, from http://www.strategyand.pwc.com/perspectives/2015-auto-trends, accessed August 28, 2016.
[3] Perez-Arostegui, M.N., Benitez-Amado, J., Huertas-Perez, J.-F. (2012). In search of loyalty: An analysis of the determinants of buyer-supplier relationship stability under a quality management approach, Total Quality Management & Business Excellence, Vol. 23, No. 5-6,703-717, doi: 10.1080/14783363.2012.669999.
[4] Stylidis, K., Wickman, C., Söderberg, R. (2015). Defining perceived quality in the automotive industry: An engi-neering approach, Procedia CIRP, Vol. 36, 165-170, doi: 10.1016/j.procir.2015.01.076.
[5] Wang, F.-K., Du, T., Li, E. (2004). Applying six-sigma to supplier development, Total Quality Management & Busi-ness Excellence, Vol. 15, No. 9-10, 1217-1229, doi: 10.1080/1478336042000255596.
[6] Pavlínek P., Janák L. (2007). Regional restructuring of the Škoda auto supplier network in the Czech Republic, European Urban and Regional Studies, Vol. 14, No. 2, 133-155, doi: 10.1177/0969776407076101.
[7] Goicoechea, I., Fenollera, M. (2012). Quality management in the automotive industry, In: Katalinic, B., DAAAM International Scientific Book 2012, DAAAM International Vienna, Austria, 619-632, doi: 10.2507/daaam.scibook. 2012.51.
[8] Šurinová, Y. (2013). Review of special standards in quality management systems audits in automotive produc-tion, , Research Papers Faculty of Materials Science and Technology Slovak University of Technology, The Journal of Slovak University of Technology Vol. 21, No. 33, 21-30, doi: 10.2478/rput-2013-0036.
[9] Chang, S.-C., Pan, L.-Y., Yu, H.-C. (2008). The competitive advantages of Quanta computer – The world’s leading notebook PC manufacturer in Taiwan, Total Quality Management & Business Excellence, Vol. 19, No. 9, 939-948, doi: 10.1080/14783360802224602.
[10] Teli, S.N., Majali, V.S., Bhushi, U.M., Gaikwad, L.M., Surange, V.G. (2013). Cost of poor quality analysis for automo-bile industry: A case study, Journal of The Institution of Engineers (India): Series C, Vol. 94, No. 4, 373-384.
[11] Andersen, B., Sorqvist, L., Saraiva, P., Watson, G. (2015). Structured improvement for the 21st century: A new model from Europe, In: World Quality Forum – International academy for quality, Budapest, Hungary, from http://eoq.hu/iaq/andersen.pdf, accessed September 25, 2017.
[12] Taguchi, G., Chowdhury, S., Wu, Y. (2004). Taguchi’s quality engineering handbook, John Wiley & Sons, New York, USA, doi: 10.1002/9780470258354.ch17.
[13] Omega, R.S., Noel, V.M., Masbad, J.G., Ocampo, L.A. (2016). Modelling supply risks in interdependent manufactur-ing systems: A case study, Advances in Production Engineering & Management, Vol. 11, No. 2, 115-125, doi: 10.14743/apem2016.2.2014.
Advances in Production Engineering & Management 12(4) 2017 399
[14] Cho, H. (2014). Traceability-driven system development and its application to automotive system development, In: 21st Asia-Pacific Software Engineering Conference, Jeju, South Korea, 143-146, doi: 10.1109/APSEC.2014.30.
[15] Doran, D., Roome, R. (2003). An evaluation of value-transfer within a modular supply chain, Proceedings of the Institution of Mechanical Engineers, Part D: Journal of Automobile Engineering, Vol. 217, No. 7, 521-527, doi: 10.1243/095440703322114906.
[16] Doran, D., Hill, A. (2008). A review of modular strategies and architecture within manufacturing operations, Proceedings of the Institution of Mechanical Engineers, Part D: Journal of Automobile Engineering, Vol. 223, No. 1, 65-75, doi: 10.1243/09544070JAUTO822.
[17] Juran, J.M., Godfrey, A.B. (1998). Juran’s quality handbook: Fifth Edition, McGraw Hill, New York, USA. [18] McQuater, R.E., Scurr, C.H., Dale, B.G., Hillman, P.G. (1995). Using quality tools and techniques successfully, The
TQM magazine, Vol. 7, No. 6, 37-42, doi: 10.1108/09544789510103761. [19] Bird, D. Dale, B.G. (1995). The use of statistical process control in the manufacture of high-integrity products,
Proceedings of the Institution of Mechanical Engineers, Part D: Journal of Automobile Engineering, Vol. 209, No. 1, 25-31, doi: 10.1243/PIME_PROC_1995_209_180_02.
[20] Abdulaziz, A.-I. (2014). Quality management and its role in improving service quality in public sector, Journal of Business and Management Sciences, Vol. 2, No. 6, 123-147, doi: 10.12691/jbms-2-6-1.
[21] Poksinska, B., Dahlgaard, J.J., Antoni, M. (2002). The state of ISO 9000 certification: A study of Swedish organiza-tions, The TQM Magazine, Vol. 14, No. 5, 297-306, doi: 10.1108/09544780210439734.
[22] Banduka, N., Veža, I., Bilić, B. (2016). An integrated lean approach to process failure mode and effect analysis (PFMEA): A case study from automotive industry, Advances in Production Engineering & Management, Vol. 11, No. 4, 355-365, doi: 10.14743/apem2016.4.233.
[23] Chao, L.P, Ishii, K. (2004). Project quality function deployment, International Journal of Quality & Reliability Management, Vol. 21, No. 9, 938-958, doi: 10.1108/02656710410561763.
[24] Coetzee, R., van der Merwe, K., van Dyk, L. (2016). Lean implementation strategies: How are the Toyota way principles addressed? The South African Journal of Industrial Engineering, Vol. 27, No. 3, 79-91, doi: 10.7166/27-3-1641.
[25] Hanenkamp, N. (2013). The process model for shop floor management implementation, Advances in Industrial Engineering and Management, Vol. 2, No. 1, 40-46.
[26] Chang, H.H. (2006). An empirical evaluation of performance measurement system for total quality management, Total Quality Management & Business Excellence, Vol. 17, No. 8, 1093-1109, doi: 10.1080/14783360600941795.
[27] Soliman, M.H.A. (2017). Why continuous improvement programs fail in the egiptyian manufacturing organizations? A research study of the evidence, American Journal of Industrial and Business Management, Vol. 7, No. 3, 202-222, doi: 10.4236/ajibm.2017.73016.
[28] Jasti, N.V.K., Kodali, R. (2015). Lean production: Literature review and trends, International Journal of Production Research, Vol. 53., No. 3, 867-885, doi: 10.1080/00207543.2014.937508.
[29] Kayis, B., Kara, S. (2005). The supplier and customer contribution to manufacturing flexibility: Australian manu-facturing industry's perspective, Journal of Manufacturing Technology Management, Vol. 16, No. 7, 733-752, doi: 10.1108/17410380510626169.
[30] Lee, S.-D., Kim, S.-L. (2010). Characterization and development of the ideal pedal force, pedal travel, and re-sponse time in the brake system for the translation of the voice of the customer to engineering specifications, Proceedings of the Institution of Mechanical Engineers, Part D: Journal of Automobile Engineering, Vol. 224, No. 11, 1433-1450, doi: 10.1243/09544070JAUTO1585.
[31] Tanco, M., Mateo, R., Santos, J., Jaca, C., Viles, E. (2012). On the relationship between continuous improvement programmes and their effect on quality defects: An automotive case study, Total Quality Management & Business Excellence, Vol. 23, No. 3-4, 277-290, doi: 10.1080/14783363.2011.637779.
[32] Hendricks, K.B., Singhal, V.R. (1997). Does implementing an effective TQM program actually improve operating performance? Empirical evidence from firms that have won quality awards, Management Science, Vol. 43, No. 9, 1258-1274, doi: 10.1287/mnsc.43.9.1258.
[33] Li, J., Blumenfeld, D.E., Marin, S.P. (2008). Production system design for quality robustness, IEE Transactions, Vol. 40, No. 3, 162-176, doi: 10.1080/07408170601013661.
[34] Akao, Y., Mazur, G.H. (2003). The leading edge in QFD: Past, present and future, International Journal of Quality & Reliability Management, Vol. 20, No. 1, 20-35, doi: 10.1108/02656710310453791.
[35] Miller, K., Brand, C., Heathcote, N., Rutter, B. (2005). Quality function deployment and its application to automo-tive door design, Proceedings of the Institution of Mechanical Engineers, Part D: Journal of Automobile Engineer-ing, Vol. 219, No.12, 1481-1493, doi: 10.1243/095440705X35053.
[36] Popovic, P, Ivanovic, G., Mitrovic, R., Subic, A. (2012). Design for reliability of a vehicle transmission system, Proceedings of the Institution of Mechanical Engineers, Part D: Journal of Automobile Engineering, Vol. 226, No. 2, 194-209, doi: 10.1177/0954407011416175.
[37] Mourtzis, D., Vlachou, E., Milas, N., Xanthopoulos, N. (2016). A cloud-based approach for maintenance of machine tools and equipment based on shop-floor monitoring, Procedia CIRP, Vol. 41, 655-660, doi: 10.1016/j.procir. 2015.12.069.
[38] Lee, S. (2008). Principal component analysis of vehicle acceleration gain and translation of voice of the customer, Proceedings of the Institution of Mechanical Engineers, Part D: Journal of Automobile Engineering, Vol. 222, No. 2, 191-203, doi: 10.1243/09544070JAUTO351.
400 Advances in Production Engineering & Management 12(4) 2017