December 23, 2016 Dear Connecticut Green Bank Board of Directors: On behalf of the Strategic Retreat Committee, we are looking forward to holding our Strategic Retreat in a few weeks. Here are a few details: Date: Thursday, January 5, 2017 Time: 11:30 a.m. to 5:00 p.m. for the Strategic Retreat 5:30 to 8:00 p.m. for the Tour of the Beinecke Library and Dinner at Mory’s (please RSVP with Cheryl Samuels at [email protected]) Location: Strategic Retreat Dinner (please RSVP with Cheryl) Yale F&ES Mory’s Kroon Hall – 3 rd Floor 306 York Street 195 Prospect Street New Haven, CT 06511 New Haven, CT 06511 (203) 562-3157 The Strategic Retreat will be facilitated by Dr. Jonathan Raab. Jonathan has helped Connecticut navigate its climate change strategies for nearly 15 years and has been involved with the Connecticut Green Bank since inception. We are looking forward to working with him again. We will also be joined by special guest Frances Beinecke. Frances served as the President of the Natural Resources Defense Council from 2006 through 2015 where she focused on finding solutions to some of the biggest environmental challenges of our time, including clean energy, climate change, and sustainable communities. She is excited to join us and offer some useful insights into the challenges ahead. We have prepared an exciting, impactful, and productive agenda for the Strategic Retreat, including: ‒ 5-Year Review – an “ice breaker” session over lunch where we discuss the success and shortcomings (or missed best practices) of the Connecticut Green Bank’s first five years. The team has prepared an excellent summary document to provide background for this discussion. ‒ Towards 2050 – Connecticut has a goal to reduce its greenhouse gas emissions by 80 percent from 2001 levels by the year 2050. Building from the work of the Governor’s Council on Climate Change, we will explore what role the Connecticut Green Bank can play to assist the state in achieving this target.
Transcript
December 23, 2016 Dear Connecticut Green Bank Board of Directors: On behalf of the Strategic Retreat Committee, we are looking forward to holding our Strategic Retreat in a few weeks. Here are a few details: Date: Thursday, January 5, 2017 Time: 11:30 a.m. to 5:00 p.m. for the Strategic Retreat
5:30 to 8:00 p.m. for the Tour of the Beinecke Library and Dinner at Mory’s (please RSVP with Cheryl Samuels at [email protected])
Kroon Hall – 3rd Floor 306 York Street 195 Prospect Street New Haven, CT 06511 New Haven, CT 06511 (203) 562-3157
The Strategic Retreat will be facilitated by Dr. Jonathan Raab. Jonathan has helped Connecticut navigate its climate change strategies for nearly 15 years and has been involved with the Connecticut Green Bank since inception. We are looking forward to working with him again. We will also be joined by special guest Frances Beinecke. Frances served as the President of the Natural Resources Defense Council from 2006 through 2015 where she focused on finding solutions to some of the biggest environmental challenges of our time, including clean energy, climate change, and sustainable communities. She is excited to join us and offer some useful insights into the challenges ahead. We have prepared an exciting, impactful, and productive agenda for the Strategic Retreat, including:
‒ 5-Year Review – an “ice breaker” session over lunch where we discuss the success and shortcomings (or missed best practices) of the Connecticut Green Bank’s first five years. The team has prepared an excellent summary document to provide background for this discussion.
‒ Towards 2050 – Connecticut has a goal to reduce its greenhouse gas emissions by 80 percent from 2001 levels by the year 2050. Building from the work of the Governor’s Council on Climate Change, we will explore what role the Connecticut Green Bank can play to assist the state in achieving this target.
‒ Sustainability – the Connecticut Green Bank has made substantial progress building public-private partnerships that have attracted significant investments into Connecticut’s clean energy economy. There are a number of emerging opportunities to leverage our financial position to attract other sources of capital to the organization – pursuing a path towards sustainability.
‒ Protectability – because of the Connecticut Green Bank’s financial position, and given that the State of Connecticut is facing a billion-dollar budget deficit in FY 2018 and beyond, we will discuss strategies for how we can more accurately present and communicate our financial position as well as reduce the budget threats from the legislature.
‒ Trump Administration – to wrap up the day, we will discuss how the green bank movement might proceed at the national level during President Trump’s administration. This will be a “blue sky” conversation to determine pathways for the future of clean energy and green bank support at the federal level with respect to infrastructure investment.
For each agenda item, we have provided reading as background material. We have a lot of ground to cover – this will be meaningful and fun! If you have any questions, comments or concerns, please feel free to contact any of us. We look forward to seeing you in a few weeks. Happy Holidays! Sincerely,
Bryan Garcia President and CEO Cc: Catherine Smith
Norma Glover Reed Hundt Dr. Jonathan Raab Eric Shrago
STRATEGIC RETREAT
Board of Directors of the Connecticut Green Bank
Yale School of Forestry and Environmental Studies – Kroon Hall (Rooms 319 and 321)
Thursday, January 5, 2017 11:30 a.m. to 5:00 p.m.
Facilitator: Jonathan Raab Note-Taker: Matt Macunas Staff Invited: George Bellas, Craig Connolly, Mackey Dykes, Brian Farnen, Bryan Garcia, Dale
Hedman, Ben Healey, Bert Hunter, Kerry O’Neill, Eric Shrago
1. Arrival for Lunch – 11:30 a.m.
2. Kick-Off – Successes and Shortcomings (12:00 to 12:45 – 45 minutes)
a. 2011 to 2016 – What were the Connecticut Green Bank’s successes and
shortcomings (or missed best practices) in its first 5 years?
3. Strategic Issues to Address (12:45 to 4:50 – 245 minutes) a. Issue #1 – The “Big Picture” – Towards 80% Reductions of GHG Emissions by 2050
(12:45 to 1:55 – 70 minutes)
b. Issue #2 – Financial Position of the Connecticut Green Bank; Leveraging Resources for Public-Private Partnerships and Sustainability: Emerging Opportunities Like Bank of America (1:55 to 2:55– 60 minutes)
(Afternoon Break – 2:55 to 3:10 – 15 minutes)
c. Issue #3 – Financial Position of the Connecticut Green Bank – Protecting Resources from Transfer to the General Fund: Strategies and Communications* (3:10 to 4:00 – 50 minutes)
d. Issue #4 – The Green Bank Movement in a Trump Administration – Opportunities and Vulnerabilities (4:00 to 4:50 – 50 minutes)
4. Next Steps (4:50 to 5:00 – 10 minutes)
5. Adjourn
Next Regular Meeting: Friday, January 20, 2017 from 9:00-11:00 a.m.
Connecticut Green Bank, 845 Brook Street, Rocky Hill, CT
Board of Directors
Strategic Retreat5-Year Results (2012-2016)
January 5, 2017
Content
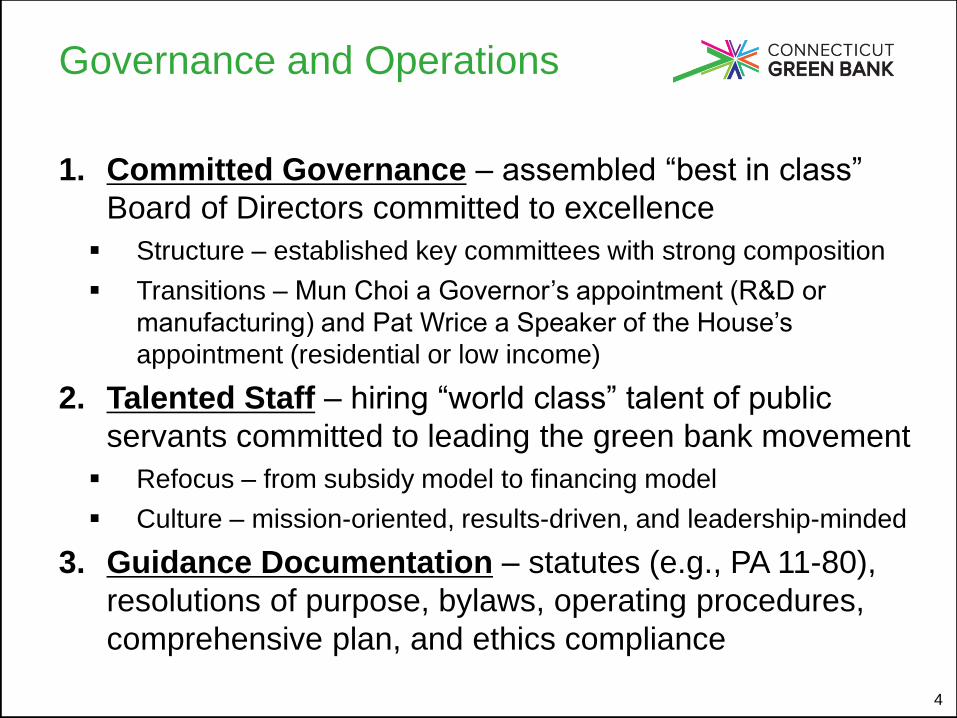
1. Governance and Operations – board of directors, senior
leadership, and documentation;
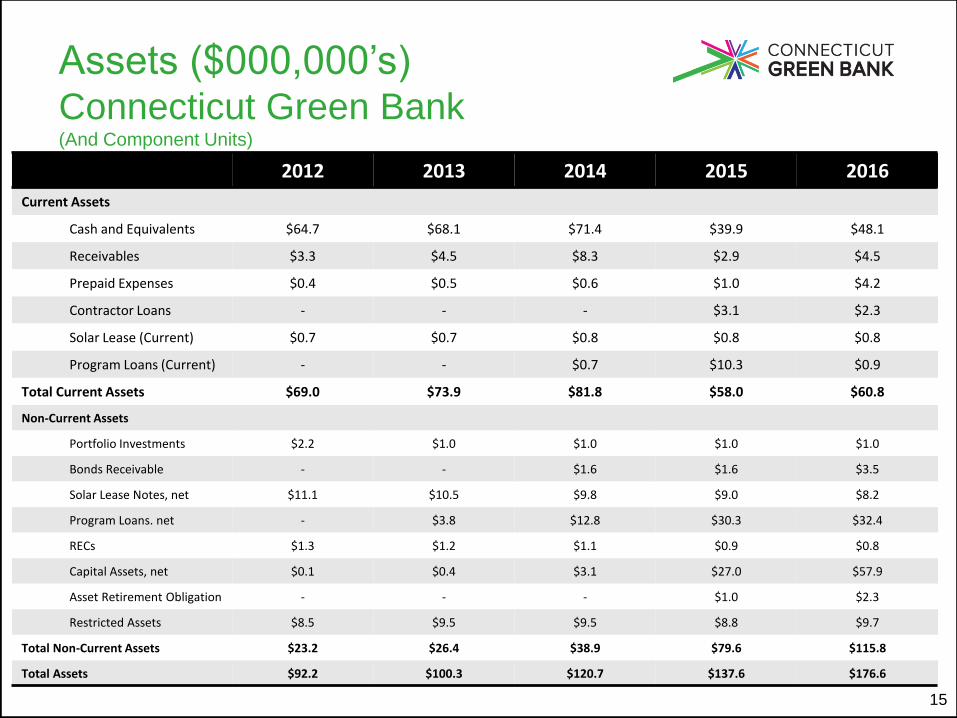
2. Financial Position – reporting, assets, net position, revenues,
and expenses;
3. Impact – investment, leverage ratio, public funds, pipeline,
Ending net position 81,188,309 84,195,195 100,793,237 109,167,243 127,362,335
ImpactConnecticut Green Bank
Impact
1. Investment – delivered nearly $1 billion of investment in
Connecticut’s clean energy economy in the first 5 years
Leverage Ratio – delivering between 5 to 10 : 1 leverage ratio
Funds Invested – less than 50% of funds invested as grants
2. Projects – increasing the number of projects and installed capacity
supported year-to-year while increasing the amount of clean energy
produced
3. Objective Function – reducing the amount of Connecticut Green
Bank funds at risk per installed capacity (i.e., kW - $650/kW),
production (i.e., lifetime kWh - $0.02/kWh), and savings (i.e., lifetime
MMBtu - $50-$100/MMBtu)
4. Societal Benefits – supporting the increase in job-years created
(i.e., over 11,500 direct, indirect and induced job-years) and GHG
emission reductions (i.e., over 2.2 MTCO2)
19
InvestmentPublic Funds and Private Capital
20
Investment – over $915 million of
investment in the clean energy
economy in 5 years – about
$80/capita/yr. for last 2 years (e.g.,
about $325 million)
About $165 million of investment from
the Connecticut Green Bank
Over $755 million of investment from
private capital
~$325 million in BTM investment in
2015 and 2016 is nearly the same
capital improvement budget (i.e.,
wires and poles) for Eversource,
which is cost-recovered by ratepayers
REFERENCESComprehensive Annual Financial Report for FY 2016 (Page # TBD)
Leverage RatioPrivate Capital vs. Public Funds
21
REFERENCESComprehensive Annual Financial Report for FY 2016 (Page # TBD)
Leverage Ratio – 5-year
leverage ratio of 5.6 : 1 of
private to public funds
Infrastructure – average of 6.6 : 1
with highest year of 10.9 : 1 (2016)
Residential – average of 6.2 : 1 with
highest year of 10.5 : 1 (2014).
Focusing now on hard-to-serve LMI
markets.
CI&I – average of 2.9 : 1 with highest
year of 4.5 : 1 (2015)
Target – 5 to 10 : 1
Dilemma – maximize leverage
ratio to demonstrate power of
public-private partnerships or
build assets on our balance
sheet for sustainability?
Public FundsInvestment Type
22
REFERENCESComprehensive Annual Financial Report for FY 2016 (Page # TBD)1. All subsidies provided through the RSIP for projects approved after January 1, 2015 are recoverable through the sale of SHRECs to the EDCs through an MPA
Financing – transition from
subsidy model to financing –
about 50% of funds invested are
financing
Subsidies – about $84 million to
support the RSIP1
Credit Enhancements – nearly $5
million:
Loan Loss Reserves – $4.1 million
Interest Rate Buy-Downs – $0.9 million
Loans and Leases – over $76 million:
Infrastructure – $24 million
Residential – $13 million
CI&I – $39 million
Project PipelineApproved – Closed – Completed
23
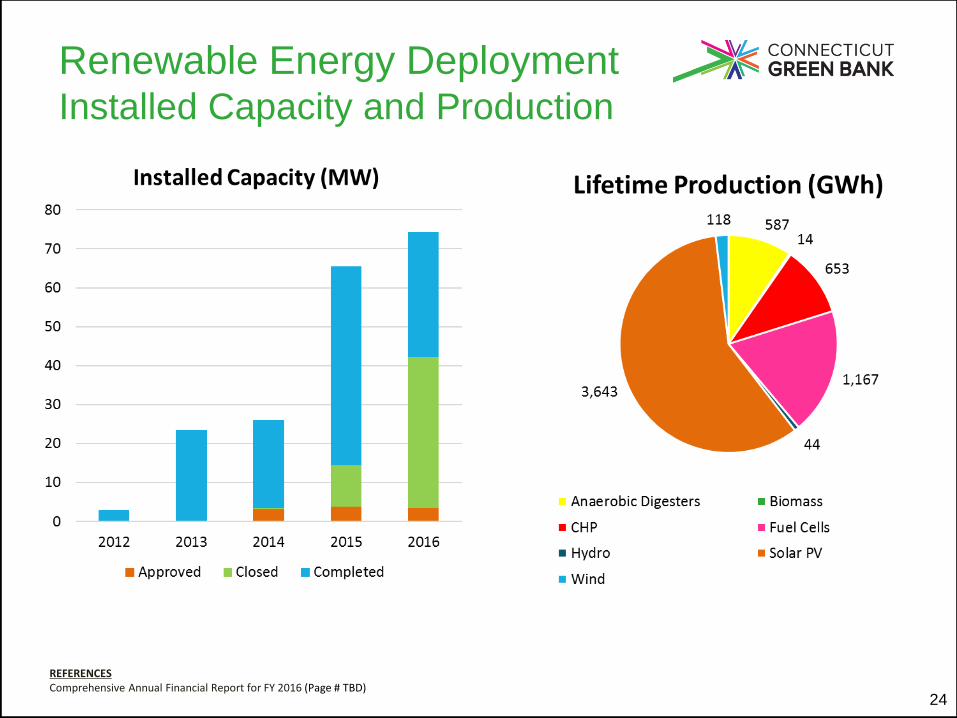
Growth – year-over-year growth
in the project pipeline with prior
year approvals being closed and
completed
Development Time – it takes
time to move approved projects
to completed (e.g., 1-24 months)
Residential – single-family varies with
multifamily up to 24 months
CI&I – can be 12 months or more
Infrastructure – RSIP can be up to 6
months with AD and CHP projects as
several years (i.e., permitting)
REFERENCESComprehensive Annual Financial Report for FY 2016 (Page # TBD)
Renewable Energy DeploymentInstalled Capacity and Production
24
REFERENCESComprehensive Annual Financial Report for FY 2016 (Page # TBD)
Objective Functions
25
REFERENCESComprehensive Annual Financial Report for FY 2016 (Page # TBD)
Objective Functions (cont’d)
26
REFERENCESComprehensive Annual Financial Report for FY 2016 (Page # TBD)
Decreasing Objective
Function – shows increasing
leverage of the Green Bank
Driven by decreasing costs of
technology and increase of
private capital
2013 Dip – Bridgeport Fuel Cell
Park led to the lowest objective
function in 2013 for installed
capacity and investment
27
Growth – year-over-year job
growth from project pipeline for
direct, indirect, and induced job-
years
Installed Costs – as a result of
declining installed costs leading
to more clean energy
deployment, there has been an
increase in jobs created
Estimates – the update in job
estimates by Navigant in the
Jobs Study aren’t reflected in
these numbers
Economic DevelopmentDirect, Indirect and Induced Job-Years
REFERENCESComprehensive Annual Financial Report for FY 2016 (Page # TBD)Includes approved, closed, and completed projects
28
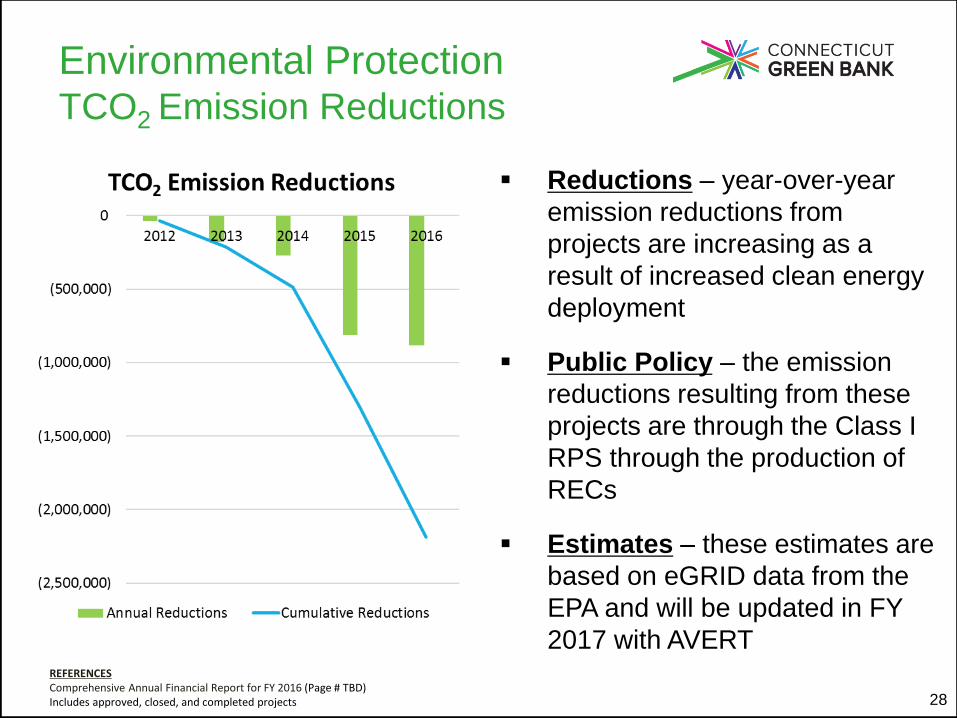
Reductions – year-over-year
emission reductions from
projects are increasing as a
result of increased clean energy
deployment
Public Policy – the emission
reductions resulting from these
projects are through the Class I
RPS through the production of
RECs
Estimates – these estimates are
based on eGRID data from the
EPA and will be updated in FY
2017 with AVERTREFERENCESComprehensive Annual Financial Report for FY 2016 (Page # TBD)Includes approved, closed, and completed projects
Environmental ProtectionTCO2 Emission Reductions
29
Mutually Beneficial – job
creation can coincide with GHG
emission reductions
Progress – year-to-year
increases in jobs created and
GHG emissions reduced
REFERENCESComprehensive Annual Financial Report for FY 2016 (Page # TBD)Includes approved, closed, and completed projects
Economy and EnvironmentJobs Created and CO2 Reductions
Community OutreachConnecticut Green Bank
Community Outreach
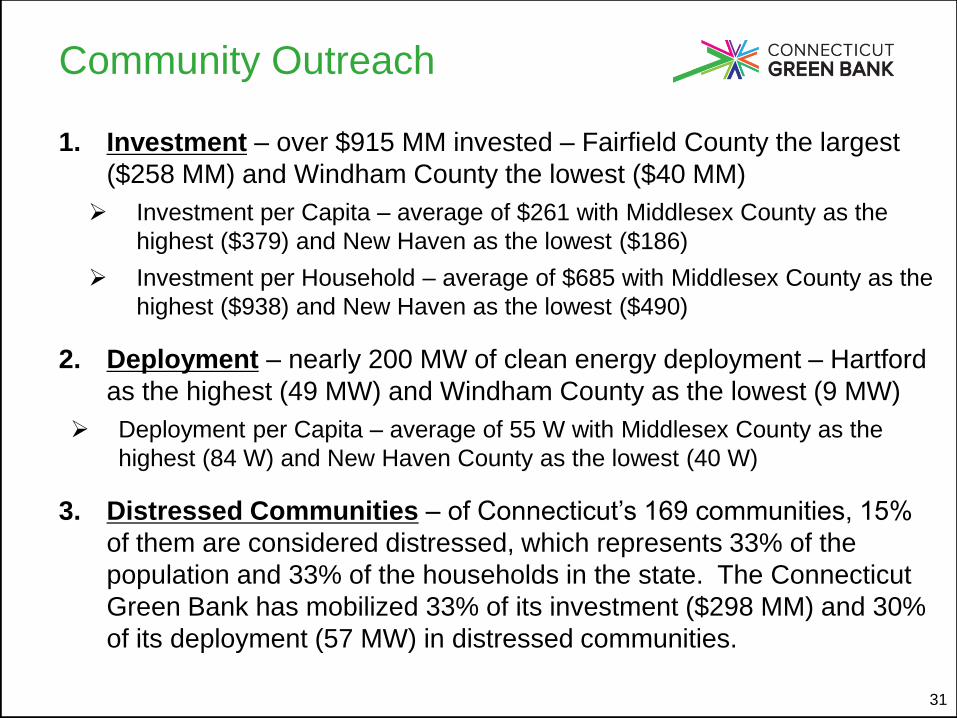
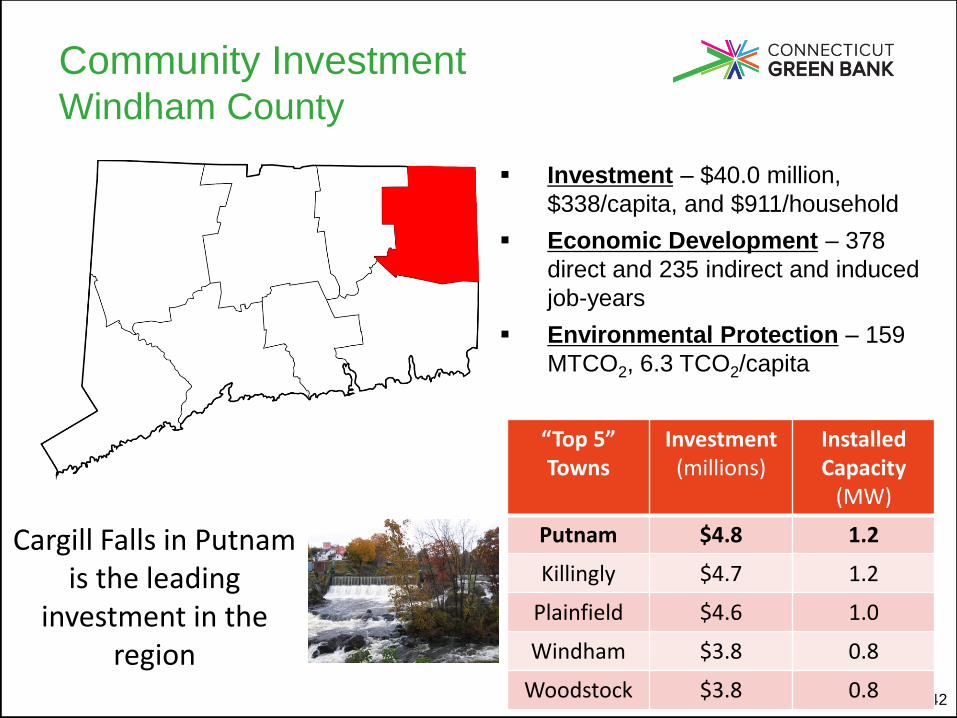
1. Investment – over $915 MM invested – Fairfield County the largest
($258 MM) and Windham County the lowest ($40 MM)
Investment per Capita – average of $261 with Middlesex County as the
highest ($379) and New Haven as the lowest ($186)
Investment per Household – average of $685 with Middlesex County as the
highest ($938) and New Haven as the lowest ($490)
2. Deployment – nearly 200 MW of clean energy deployment – Hartford
as the highest (49 MW) and Windham County as the lowest (9 MW)
Deployment per Capita – average of 55 W with Middlesex County as the
highest (84 W) and New Haven County as the lowest (40 W)
3. Distressed Communities – of Connecticut’s 169 communities, 15%
of them are considered distressed, which represents 33% of the
population and 33% of the households in the state. The Connecticut
Green Bank has mobilized 33% of its investment ($298 MM) and 30%
of its deployment (57 MW) in distressed communities.
31
Community InvestmentOverall Comparison
32
County Population Households Investment (millions)
Total 18,771 $915.8 $256 192.3 53.8 11,594 2,185,779
% Distressed 25% 33% 30% 32% 28%
44
Focus Not Distressed
Distressed Total % Distressed
# of Towns 144 25 169 15%
Population 2,406,785 1,167,312 3,574,097 33%
Households 899,083 438,675 1,337,758 33%
Working hard to attract investment in distressed communities!!!
REFERENCESDistressed Communities as defined by the Connecticut Department of Economic and Community Development
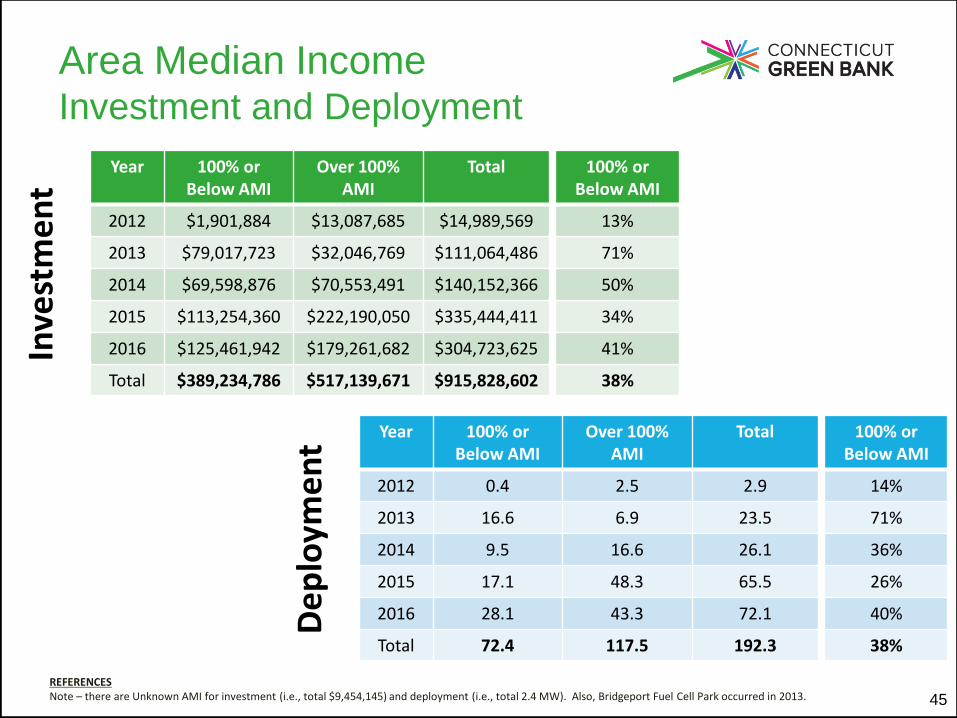
Area Median IncomeInvestment and Deployment
45
REFERENCESNote – there are Unknown AMI for investment (i.e., total $9,454,145) and deployment (i.e., total 2.4 MW). Also, Bridgeport Fuel Cell Park occurred in 2013.
Year 100% or Below AMI
Over 100% AMI
Total
2012 $1,901,884 $13,087,685 $14,989,569
2013 $79,017,723 $32,046,769 $111,064,486
2014 $69,598,876 $70,553,491 $140,152,366
2015 $113,254,360 $222,190,050 $335,444,411
2016 $125,461,942 $179,261,682 $304,723,625
Total $389,234,786 $517,139,671 $915,828,602
100% or Below AMI
13%
71%
50%
34%
41%
38%
Inve
stm
en
t
Year 100% or Below AMI
Over 100% AMI
Total
2012 0.4 2.5 2.9
2013 16.6 6.9 23.5
2014 9.5 16.6 26.1
2015 17.1 48.3 65.5
2016 28.1 43.3 72.1
Total 72.4 117.5 192.3
100% or Below AMI
14%
71%
36%
26%
40%
38%
De
plo
yme
nt
Area Median Income (cont’d)Deployment
46
REFERENCESNote – there are Unknown AMI for projects (i.e., total 140). Also, Bridgeport Fuel Cell Park occurred in 2013
Year 100% or Below AMI
Over 100% AMI
Total
2012 62 355 417
2013 184 934 1,118
2014 649 1,773 2,422
2015 1,995 4,545 6,540
2016 3,209 4,925 8,134
Total 6,099 12,532 18,771
100% or Below AMI
15%
16%
27%
31%
39%
32%
Pro
ject
s
Concentrated focus for LMI sector is required to make progress. LMI programs and approaches launched in
2015 and 2016 are starting to pay off.
Community OutreachAnnual Reporting to Cities and Towns
REFERENCES1. LLR yields high leverage – and it is 2nd loss and thus with no to low defaults, we haven’t used to date. IRB’s not considered in the leverage ratio.2. Foundation PRI is to HDF is guaranteed by the CGB in the case of MacArthur Foundation.3. Onyx Partnership has no upper limit and CGB currently has authorization to commit up to $15mm . The team expects to commit $5mm for the first $60-70mm.4. Foundation PRI and commercial loan are backed by CGB balance sheet in the case of the Kresge Foundation and Bank of America respectively.
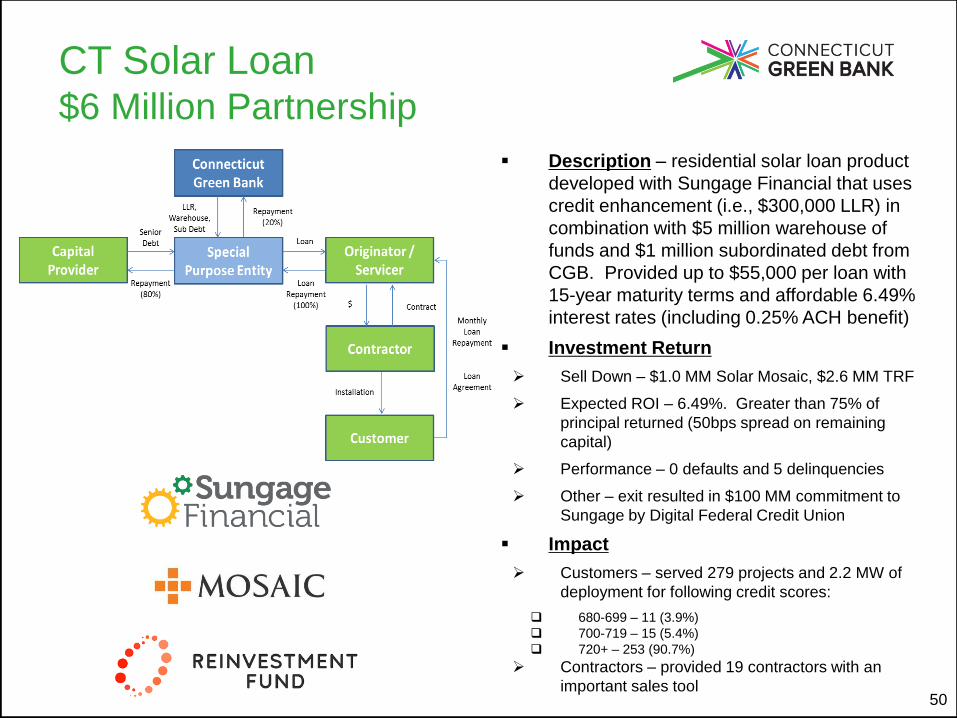
CT Solar Loan$6 Million Partnership
50
Description – residential solar loan product
developed with Sungage Financial that uses
credit enhancement (i.e., $300,000 LLR) in
combination with $5 million warehouse of
funds and $1 million subordinated debt from
CGB. Provided up to $55,000 per loan with
15-year maturity terms and affordable 6.49%
interest rates (including 0.25% ACH benefit)
Investment Return
Sell Down – $1.0 MM Solar Mosaic, $2.6 MM TRF
Expected ROI – 6.49%. Greater than 75% of
principal returned (50bps spread on remaining
capital)
Performance – 0 defaults and 5 delinquencies
Other – exit resulted in $100 MM commitment to
Sungage by Digital Federal Credit Union
Impact
Customers – served 279 projects and 2.2 MW of
deployment for following credit scores:
680-699 – 11 (3.9%)
700-719 – 15 (5.4%)
720+ – 253 (90.7%)
Contractors – provided 19 contractors with an
important sales tool
CT Solar Lease$75 MM Partnership
51
Description – residential and commercial
solar lease product developed with tax equity
investor (i.e., US Bank) and syndicate of local
lenders (i.e., Key Bank and Webster Bank)
using a credit enhancement (i.e., $3.5 MM
LLR) in combination with $2.3 million in sub-
debt and $4.2 MM in sponsor equity from
CGB.
Investment Return
Expected ROI – 2-3%
Performance – 0 defaults and 2 delinquencies
Other – won CESA SLICE Award
Impact
Residential Customers – served 1,192 projects and
9.6 MW of deployment for following credit scores:
Below 640 – 1 (0.1%)
640-679 – 45 (3.8%)
680-699 – 39 (3.3%)
Commercial Customers – served 36 projects and 7.5
MW of deployment
Contractors – provided 20 residential and 11
commercial contractors with an important sales tool
700-719 – 78 (6.5%)
720+ – 1,029 (86.3%)
C-PACE$30 MM and $100 Partnerships
52
Description – CI&I product that uses a benefit
assessment to provide access to affordable
(i.e., up to 6.5%) and long-term (i.e., up to 25
years) debt for clean energy improvements.
Investment Return
Expected ROI:
Clean Fund – 5.42%
HAC-PACE – 10-12%
Performance – 0 defaults and 3 delinquencies
Other – 32 unique banks and 5 specialized lending
institutions have approved consent of benefit
assessment to be senior to their mortgage
Impact
Customers – served 114 projects, 15.7 MW of
deployment, and $72.5 MM in loans to date
Contractors – provided 50 contractors with an
important sales tool
Capital Providers – 1st securitization (i.e., $30 MM
with Clean Fund) and $100 MM public-private
partnership with Hannon Armstrong
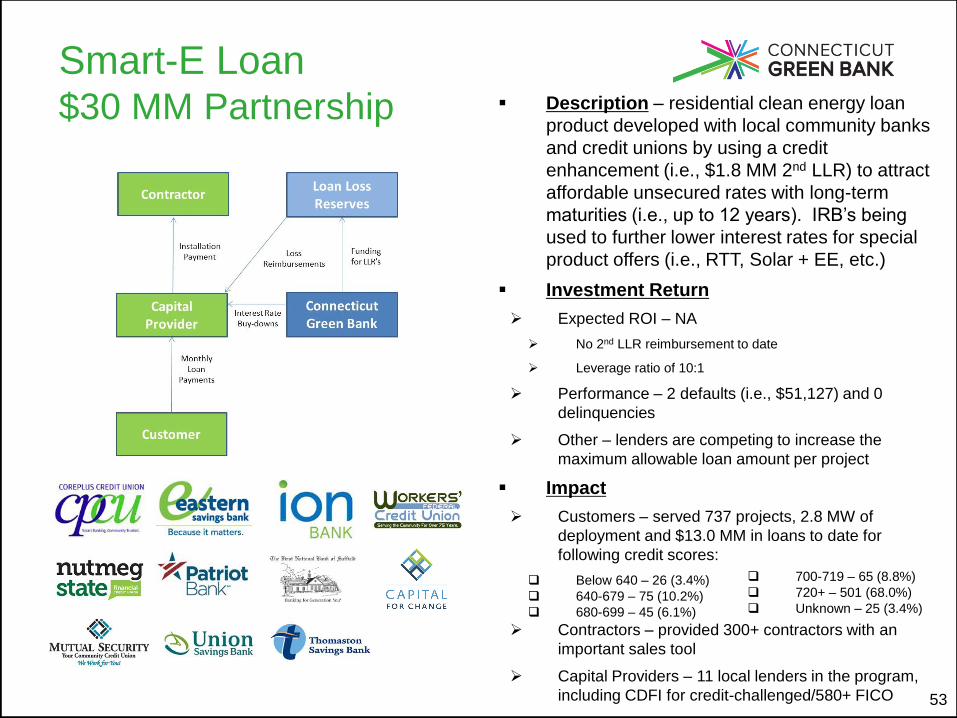
Smart-E Loan$30 MM Partnership
53
Description – residential clean energy loan
product developed with local community banks
and credit unions by using a credit
enhancement (i.e., $1.8 MM 2nd LLR) to attract
affordable unsecured rates with long-term
maturities (i.e., up to 12 years). IRB’s being
used to further lower interest rates for special
product offers (i.e., RTT, Solar + EE, etc.)
Investment Return
Expected ROI – NA
No 2nd LLR reimbursement to date
Leverage ratio of 10:1
Performance – 2 defaults (i.e., $51,127) and 0
delinquencies
Other – lenders are competing to increase the
maximum allowable loan amount per project
Impact
Customers – served 737 projects, 2.8 MW of
deployment and $13.0 MM in loans to date for
following credit scores:
Below 640 – 26 (3.4%)
640-679 – 75 (10.2%)
680-699 – 45 (6.1%)
Contractors – provided 300+ contractors with an
important sales tool
Capital Providers – 11 local lenders in the program,
including CDFI for credit-challenged/580+ FICO
700-719 – 65 (8.8%)
720+ – 501 (68.0%)
Unknown – 25 (3.4%)
PosiGen$20 MM Partnership
54
Description – residential low-to-moderate
income solar lease and energy efficiency ESA
product developed with PosiGen which
includes tax equity investor (i.e., US Bank) and
local senior debt lender (i.e., Enhanced
Capital) using sub-debt (i.e., $5.0 MM with
option to expand to $10.0 MM)
Investment Return
Expected ROI – 5%
Performance – 0 defaults and 4 delinquencies
Other – opportunity for further financial innovation on
the ESA
Impact
Customers – 508 projects and 3.3 MW of
deployment
100% of customers getting basic EE (via Home
Energy Solutions)
Over 65% of customers also signed up for the
energy efficiency ESA
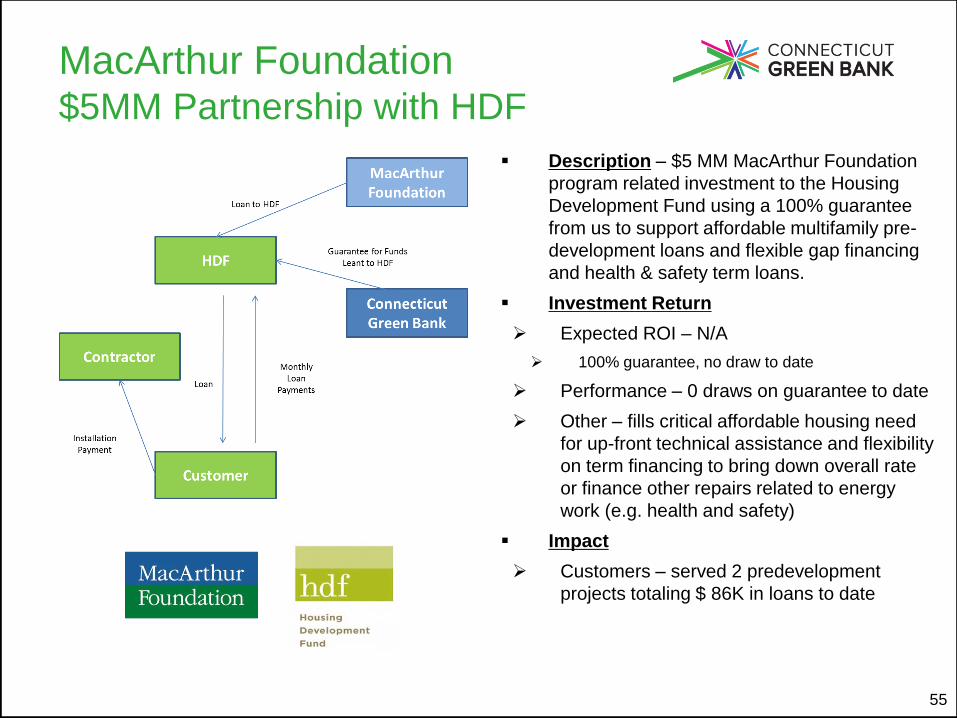
MacArthur Foundation$5MM Partnership with HDF
55
Description – $5 MM MacArthur Foundation
program related investment to the Housing
Development Fund using a 100% guarantee
from us to support affordable multifamily pre-
development loans and flexible gap financing
and health & safety term loans.
Investment Return
Expected ROI – N/A
100% guarantee, no draw to date
Performance – 0 draws on guarantee to date
Other – fills critical affordable housing need
for up-front technical assistance and flexibility
on term financing to bring down overall rate
or finance other repairs related to energy
work (e.g. health and safety)
Impact
Customers – served 2 predevelopment
projects totaling $ 86K in loans to date
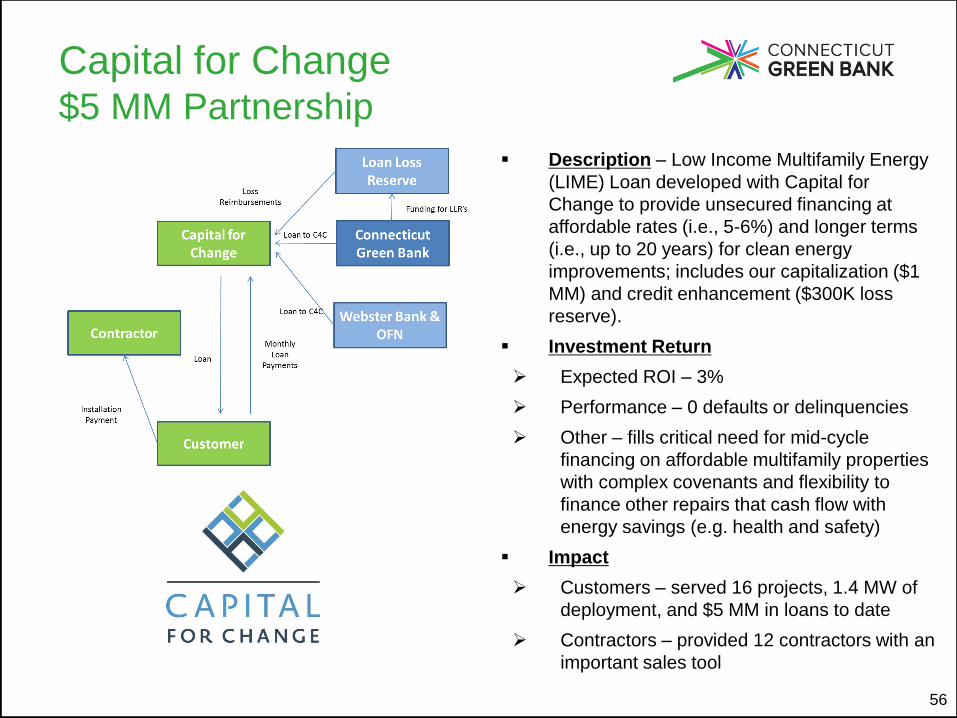
Capital for Change$5 MM Partnership
56
Description – Low Income Multifamily Energy
(LIME) Loan developed with Capital for
Change to provide unsecured financing at
affordable rates (i.e., 5-6%) and longer terms
(i.e., up to 20 years) for clean energy
improvements; includes our capitalization ($1
MM) and credit enhancement ($300K loss
reserve).
Investment Return
Expected ROI – 3%
Performance – 0 defaults or delinquencies
Other – fills critical need for mid-cycle
financing on affordable multifamily properties
with complex covenants and flexibility to
finance other repairs that cash flow with
energy savings (e.g. health and safety)
Impact
Customers – served 16 projects, 1.4 MW of
deployment, and $5 MM in loans to date
Contractors – provided 12 contractors with an
important sales tool
Resilience ProductKresge Foundation
57
Description – $3 MM Kresge Foundation
program related investment to the
Connecticut Green Bank to support
deployment of resilient renewable energy
projects (e.g. includes energy storage) in
urban and coastal communities
Investment Return
Program Related Investment (Loan) to Green
Bank for 10 years at 2% interest
Green Bank ROI to be determined
Other: low cost capital to develop a financing
model for an emerging technology
Impact
Customers – aim to fund 13 to 18 projects at
affordable multifamily, community/critical
facilities, and local businesses acting as
community hubs with initial focus on the
Greater Bridgeport, New Haven and Hartford
regions
1
Memo
To: Connecticut Green Bank Board of Directors
From: Bryan Garcia, Ben Healey, Bert Hunter, and Eric Shrago
Date: January 5, 2016
Re: Strategic Retreat Issue #2 – Financial Position of the Connecticut Green Bank; Leveraging
Resources for Public-Private Partnerships and Sustainability: Emerging Opportunities with
Bank of America
SITUATION The Connecticut Green Bank (Green Bank) has a strong balance sheet with $131,800,539 in assets, $18,239,265 in liabilities, and a net position of $116,136,641 as of November 30, 2016. How the Green Bank uses its financial resources to pursue a strategy of organizational sustainability presents an opportunity for consideration. Following the Plenary Session at the ACEEE Finance Forum1 on “The Green Bank Movement: Public-Private Partnerships to Accelerate Efficiency,” Dan Letendre, the CDFI Lending & Investing Executive for Bank of America (BofA) said “the Bank of America should be lending to green banks!” Hearing that, the team of the Green Bank connected with Mr. Letendre and subsequently scheduled a meeting in mid-August in NYC with him and Amy Brusiloff, Senior Vice President and internal liaison between CDFI Lending & Investing and the Catalytic Finance Initiative.2 At this meeting, BofA expressed a desire to lend to the the Green Bank. Over the past few months, the Green Bank team has been liaising with the BofA CDFI team to establish a lending relationship. We expect to be able to bring a transaction to the board of Directors for approval later this month where the Green Bank will borrow from BofA unsecured for 10 years at low interest rates. This desire by BofA to channel funds to Green Banks is consistent with its commitments to address climate change issues and to assist in the transition to a sustainable and low-carbon future. This initiative also builds on BofA's goal to deploy $125 billion in sustainable and low-carbon business by 2025 to address climate change and demands on natural resources.3 It is evident that the Green Bank leadership with the green bank movement, its demonstrated public-private partnership success with financial products, and its “best in class” leadership team made a positive impression on executives from BofA. This was a milestone moment for the Green Bank whereby a leading commercial bank was asking us what terms we would request from them to enable a public-private partnership between BofA and the Green Bank. At a follow-on call with BofA
1 2016 Energy Efficiency Finance Forum “Achieving Deep Energy Efficiency” was held in Newport, RI on May 22-24, 2016. 2 $10 billion initiative to accelerate clean energy investment that reduce carbon emissions. 3 http://newsroom.bankofamerica.com/press-releases/environment/bank-america-commits-carbon-neutrality-and-100-percent-renewable-electric
2
in early October, they expressed an interest in the Green Bank being the first BofA green bank client – as they expect to invest in domestic and international green banks in 2017. COMPLICATION There are a number of complications for the CGB with respect to using its balance sheet to receive a low-interest and long-term loan from BofA, including:
Unique Opportunity – outside of our partnerships with philanthropic foundations (i.e., MacArthur Foundation loan guaranty and Kresge Foundation program related investment), this is a unique opportunity whereby a for-profit commercial bank has approached us to lend us funds at below market rates in support of our mission;
Strategic Selection – per our Operating Procedures, there are certain circumstances where a strategic selection and award clearly outweigh the general public interest in an open and public process based on certain characteristics of a transaction; and
Legislative Diversion of Funds – despite having worked hard to build a strong balance sheet that would attract potential investors such as BofA, there is always the risk of the legislature diverting funds away from the Green Bank to address a revenue shortfall in the General Fund, particularly as stress on the State’s fiscal situation intensifies.
As the Green Bank continues to make progress accelerating the deployment of clean energy in Connecticut through public-private partnerships and a line of successful financing products, there is always the threat of state raids on its balance sheet.4, 5 Despite these complications, this is a unique situation that presents the CGB with an opportunity to deliver on our vision:
“To lead the green bank movement by accelerating private capital investment in clean energy deployment for Connecticut to achieve economic prosperity, create jobs, promote energy security and address climate change.”
This first-of-its-kind public-private partnership for clean energy finance to address climate change with BofA would also serve to elevate the national (and international) conversation on green banks.
NEXT STEPS To be discussed at the Strategic Retreat.
4 “Budget Robs Green Bank” by Jan Ellen Spiegel of the CT Mirror (June 5, 2013) 5 “Green Bank Raid Upsets Business, Environmental Communities” by Jan Ellen Spiegel of the CT Mirror (May 2, 2016)
1
Memo
To: Connecticut Green Bank Board of Directors
From: Bryan Garcia, George Bellas, Bert Hunter, and Eric Shrago
Date: January 5, 2016
Re: Strategic Retreat Issue #3 – Financial Position of the Connecticut Green Bank – Protecting
Resources from Transfer to the General Fund: Strategies and Communications
SITUATION The Connecticut Green Bank (Green Bank) has a strong balance sheet with $131,800,539 in assets, $18,239,265 in liabilities, and a net position of $116,136,641 as of November 30, 2016.1 The Green Bank has an operating budget of $20,508,815 for FY 2017 that covers program expenses and general operations and seeks to invest $43,259,581 in clean energy deployment through its financing programs. The organization is budgeted to recognize $39,887,689 in revenue from various sources this fiscal year, including financial returns on its portfolio of loans and investments. Revenue for the Green Bank primarily comes from rate payers in the state in the form of a system benefit charge on rate payers’ bills. This $26,704,434 constitutes 67% of budgeted FY 2017 revenues. The Green Bank also received revenue from quarterly auctions for cap-and-trade allowances held by the Regional Greenhouse Gas Initiative (RGGI), which for FY2017 the Green Bank budgeted $4,105,350 or 10% of total revenues. Interest income from portfolio investments and revenues from the sale of RECs provide the majority of the balance of budgeted revenues. The current representation of the balance sheet does not reflect all of the organization’s financial commitments that have been approved by the Board of Directors. The Green Bank has committed to fund $86,103,000 in projects through incentives and loans. The organization has guaranteed the obligations of third-party issuers up to a maximum of $19,552,000 as of November 30,2016. - see Summary of Unfunded Commitments and Loan Guarantees (page 10-11).
COMPLICATION The revenues anticipated to be received and the strength of our balance sheet for the organization are at risk of being repurposed by the Legislature to close a gap in the state’s budget.2 Presently, there is a $1.3 Billion budget deficit in Connecticut for the fiscal year commencing July 1, 2017 and if history serves as a guide, the legislature will look to the Green Bank as a source of funds (see Table 1):
1 Note: “Net Position” is not equal to “Assets” less “Liabilities” due to the need for GASB purposes to account for “Deferred Outflows and Inflows of Resources” 2 http://www.nhregister.com/general-news/20161204/green-bank-hopes-connecticut-lawyers-wont-dip-into-its-clean-energy-funds
Table 1. Transfer of Resources from the Connecticut Green Bank to the General Fund
Fiscal Year
Balance Sheet Re-appropriation
Revenue Re-appropriation
Bond Authorizations
2014 $6,200,000 - -
2015 $19,200,000 - -
2016 - $750,000 $10,500,000
Total $25,400,0003 $750,000 $10,500,000
Since FY 2014, the Connecticut Green Bank has transferred over $26,000,000 in cash to the General Fund and cancelled the authorization of over $10,000,000 in bond funds. Given the challenges of GAAP not truly reflecting the financial position of the organization on its balance sheet, the Green Bank needs to better reflect our future assets and liabilities in a way that will help us better communicate the true status of our resources during this legislative session, otherwise we risk the legislature diverting more resources to the General Fund than are actually available. We have identified the following possible ways to achieve a more accurate presentation of our financial position, including:
Reflect future liabilities: The Green Bank would reflect the future liabilities on its balance sheet thus reducing our net position. We have discussed this matter with our current audit firm and provide updates at the retreat.
A Third Party Commitment: The Green Bank would establish a legal commitment to a
third party thus restricting the cash assets of the organization. This would acknowledge certain commitments (e.g., PBI payments on the RSIP) and force the organization to fund these commitments in the present. This could take the form of restricted cash on the balance sheet. Designating cash resources as “restricted” is a process that would require an act or actions by the Green Bank’s Board of Directors as well as compliance with GAAP and GASB accounting standards that establish what cash resources are to be accounted for as “restricted”. Alternatively, the Green Bank could establish an external trust with the purpose of paying these future commitments. In this scenario, the Green Bank, working with internal and external counsel and a trustee at one of our financial partners could establish a separate legal entity, independent of the Green Bank in the form of a trust with the established responsibility of honoring specific commitments in the future as set forth in a trust agreement with the Green Bank. The Green Bank would fund the trust both initially by reallocating unrestricted cash from its balance sheet to the trust and through ongoing contributions to the trust to meet its commitments. By locking funds in this trust, future commitments would be guaranteed to be paid. Of concern would be the fact that once committed to the trust, the funds would be under the control of the trustee(s) with responsibility for managing the corpus of the trust until the commitments of the trust have been completely satisfied (at which point at some future date any residual in the trust could be structured to return to the Green Bank). Additional, the Legislature will likely have the ability to unwind such transaction if it so chooses.
3 It should be noted that all but approximately $1 million was returned to the Connecticut Green Bank through a reallocation of RGGI allowance proceeds for energy efficiency.
3
NEXT STEPS To be discussed at the Strategic Retreat.