Page 1
Romanian Journal of Information Technology and Automatic Control, Vol. 31, No. 3, 15-30, 2021 15
https://doi.org/10.33436/v31i3y202102
An application of a genetic algorithm based on Particle Swarm Optimization to a multiple responses problem
arising in the Tube Hydroforming Process
Hamza A. GHULMAN, Mohammed YUNUS*
Mechanical Engineering Department, College of Engineering and Islamic Architecture,
Umm Al-Qura University, Abdiah, Makkah, Kingdom of Saudi Arabia
[email protected] , [email protected]
*Corresponding author: Mohammed YUNUS
[email protected]
Abstract: Tube Hydroforming (THF) is a relatively new manufacturing process mainly used in the
automotive industry from the past decades, offering potential alternatives to lightweight materials. THF can
significantly govern saving energy, offering several advantages over stamping and welding processes.
Automotive sectors require complex-shaped extruded hollow tubes due to free-forming and calibration. THF
requires less thinning to provide improved structural strength and stiffness. Lightweight vehicle units
requiring less maintenance if THF are implemented with less formable Inconel 600 tubes. The impact of
Hydroforming parameters (HFP) like P (internal pressure), L (axial movement), and F (tube length) on the
tube output’s quality like Bulging and Thinning ratios (BR&TR) are studied. RSM (Response surface
methodology) was employed to develop empirical relations between HFP and experimental outputs. Particle
Swarm Optimization (PSO) algorithm is applied to obtain a large amount of optimized data set for HFPs
combination while simultaneously enhancing BR and reducing TR. Genetic algorithms improve the Pareto
front optimized solutions of PSO’s accuracy by prolonging convergence. Increasing P and L parameters
values will significantly affect the output’s quality. Proposed methods have performed outstanding (they
avoided tube’s local necking and failures like wrinkle and bursting) and the results were not possible with
other techniques.
Keywords: Hydroforming, Bulge ratio, Thinning ratio, pareto optimal front, Swarm Optimization.
1. Introduction
Hydroforming came into existence from 1940 to 1950 to reduce manufacturing costs for the
forming process of production compared to deep drawing components in small quantities (Davis,
1945). Later in 1990, an/ automotive field was increasingly attracted by the Hydroforming (HF)
method, a forming process using highly pressurized water /fluids to bend each component either by
tube or sheet hydroforming. A straight or pre-bent tube-shaped blank of required length held
between the die, which is closed with necessary clapping force in tube HF. Subsequently, an axial
force (AF) at the two ends of the tube is employed to bend the tube following the die shape using
highly pressurized water mixed with emulsion/ liquid into the pipe by engaging with axial cylinders,
the leakages of the liquid at both ends of the tube is prevented. High pressure exists inside the tube
where its material starts yielding and takes on the die cavity shape such that the component is
molded. Various experimentation and analytical investigations of bulge shaped tube HF assumed
that the entire tube length under tension and corresponding results for free bulge were reported
(Woo et al., 1973). The effect of lubricant and material (copper, brass, low carbon steel, and
aluminum) on HF using the T-shaped die under the oil-pressurizing medium is studied. Results are
shown as a function extrusion height accomplishable (Limb, Chakrabarty, Garber & Roberts, 1976 ).
The actual strain around necking using pre-strain value, strain-hardening exponential (SHE)
value, and stress ratio was derived (Sauer, Gotera, Robb & Huang, 1978). Using experiments and
thorough analysis of stresses and strains in case of anisotropy sheet metals by following “Hill’s
theory of plastic anisotropy” is explained (Woo & Woo, 1978). The impact of the SHE and
material anisotropy property on components produced by bulge hydroforming is explained with the
maximum pressure. It was applied inside the tube as a blank tubular diameter, thickness, SHE, and
strength coefficient considering without AF examined (Chebbah et al., 2016; Rudraksha et al.,
2017). Deforming ability and forming limits of thin-walled Al pipes were examined under the
combined effect of internal pressure (IP) and AF regulated using a computer-based regulator to
obtain a prespecified stress ratio (Manabe, Mori & Suzuki, 1984). The impact of material
Page 2
16 Revista Română de Informatică și Automatică, vol. 31, nr. 3, 15-30, 2021
http://www.rria.ici.ro
properties (such as SHE, plasto-anisotropic, and surplus compression stress) on free bulge HF has
been investigated (Fuchizawa et al., 1987; Manabe et al., 2002). The impact of IP and axial length
on extrusion height and height of components on ‘T’ and X shaped Al alloy tube were examined
(Fuchizawa, Narazaki & Yuki, 1993). The deformation of axisymmetric components and T- shaped
parts by enlargement due to IP and strengthening by AF were studied (Dohmann & Hartl, 1996).
The impact of various input factors of “Bulge Tube Hydroforming” (BTHF)was widely explained
with the structured, logical models ( Ahmed, & Hashmi, 1997). These models are employed to find
the constraints of free THF, the effect of control variables on the loading path, and the deformation
during their experimentation (Asnafi et al., 2020).
Many numerical simulation sequences and trials were conducted to investigate the tube
forming ability (Manabe, Mori & Suzuki, 1984). A self-feeding procedure was suggested to reduce
the explore for loading pathways to an appropriate reign of curves. They are only suitable for
axisymmetric BTHF parts and not suitable for T and Y-shaped parts (Manabe & Amino, 2002).
Optimal loading pathways via different optimization techniques like sensitivity analysis and
response surface were suggested (Yang et al., 2001; Genlin et al., 2002). The “Finite Element” (FE)
analysis using the sequence of simulations with commercial FE code was used to investigate the
cold-HF of a T shape parts (like fluid elongation, AF, and the opposing force) for bursting mode.
Comparatively, it is seen as a non-recoverable failure mode than buckling and wrinkling modes in
the BTHF process (Rudraksha & Gawande, 2017). FE analysis of BTHF for evaluating explosion
failure of ductile based fracture criterion using stress-strain results was briefed ( Kim, Kang, &
Kang, 2003). The explosion failure was predicted in BTHF, considering the plastic variability by
adopting a rising theory of plasticity in anisotropic material and the HF. The stress regulating
diagram was predicted from the scattered necking principle (Kim, Song, Kang & Kim, 2009).
Optimization technique (HEEDS software) accompanying the FEA (LS-DYNA) was used for
improving the forming factors in BTHF of high-strength steels. They maximize forming capability
by evaluating an optimal set of characteristics like IP and AF (Abedrabbo et al., 2009). The inverse
of FEA for anisotropic THF of T and Y shaped parts using classical EDIA of ABAQUS software
was carried out [4]. FE simulations and experimental results of BTHF on finding the impact of
factors shown a higher SHE. Selection of anisotropic substance for tube brings good forming
capability and maintaining appropriate lubrication get the uniform wall thickness distribution
(Asnafi et al., 2020).
From the literature, few gaps like the deformation behavior of superalloy Inconel 600 during
THF have not yet been sufficiently clarified. Further research work demands to know whether
forming capability and characteristics differ from changing the material. Proposed work includes
investigation on the impact of HF input parameters (HFIP) such as IP, AF, and tube length on the
output characteristics to maximize bulge and minimum thinning of the tube without necking failure
in THF. Also, the aim is to determine the optimal set of factors simultaneously satisfying the
conditions and forecasting the empirical form of models for the outputs of THF. It is observed that
the standard modeling tools applied for the analysis of the THF as of today are the Taguchi
technique, Grey Relational Analysis, “Artificial neural networks” ANN and other simulation tools
like LS DYNA, Workbench, etc., (Yunus et al., 2016; Yunus et al., 2018; Yunus et al., 2019;
Yunus et al., 2019; Yunus et al., 2020). These have certain limitations, such that they cannot find
more than one quantitative relationship between the HFIP and the responses, the accurate selection
and control of HFIP for optimum performance.
Hence, effective, efficient, and economical utilization of THF requires a precise modeling
and optimization methodology. The literature review reveals that the PSO (Particle swarm
optimization) is effective, inexpensive, and comparatively easy to use and yields accurate process
models with a maximum HFIP combination to use as a reference manual. This method has been
widely used for process modeling of several manufacturing processes. This method has not been
applied for modeling tube hydroforming parameters of Inconel 600 tubes to the/our best knowledge.
Besides, chosen responses, i.e., bulge ratio (BR), thinning ratio (TR), have been modeled and
optimized for the first-time using Minitab statistical and MATLAB programming. From literature,
the optimization methods used in earlier work were predominantly Taguchi based. Hence, in this
work, a population-based algorithm called a genetic algorithm, and the Pareto front solution
Page 3
Romanian Journal of Information Technology and Automatic Control, Vol. 31, No. 3, 15-30, 2021 17
http://www.rria.ici.ro
method, multi objectives using PSO technique are used to optimize the chosen objective functions.
The obtained solutions from optimization tool of MATLAB will be used as data sets for attaining
maximum BR with minimum TR to utilize as reference manual in future satisfying various
conditions of the process.
2. Materials and methodology
The 200-ton capacity THF machine has a controller for regulating IP and AF inputs
automatically using computer programming under the different strain paths with die arrangement
for the free bulge tests. A horizontally placed tube held between the two die portions and hydraulic
ram is applied with a satisfactory clamping force in the free bulge test. After closing two half
sections of dies properly, both axial punches were forwarded for closing both ends to protect the
tube for applying the AF (maximum capacity of 40 tons) to feed extra material in the expansion
region. The maximum F required is less than one-fourth of its capacity as higher than this leads to
buckling or wrinkle effect of the tube. The water is filled in the tube using the punch's left side and
then its movement back and forth to remove excess air and seal the tube again. The IP and AF are
regulated, and bulge height of heat-treated Inconel 600 tubes having fixed diameter (57.15mm) and
thickness (1.45mm) with varying lengths (195mm, 210mm, and 225mm) is measured using “Linear
variable Differential Transducer” (LVDT).
Using “Programmable Logical Controller” (PLC) and emergency stop, the required loading
path is regulated with the program provided to it. All the dimensions and Inconel 600 mechanical
characteristics of the tube were delivered before running the free bulge test (refer to Figure 1) of
THF. The aim is to attain maximum bulging defined by BR without any failure. The optimized
input factors are achieved by developing the mathematical expressions for predicting the responses.
The procedures suggested in the present investigation may be used to predict the empirical models.
Further, these empirical models can be solved by using any evolutionary algorithms.
Figure 1. Tube hydroforming technique [9]
Several scholars worked for the advancement of the THF process to simplify the process and
make suitable for forming. To decrease the number of trials for examining the impact of HFIP on
the THF process for minimizing the cost is condensed as per Taguchi orthogonal array (OA)
without upsetting the quality of the analysis because of its successful application in metal forming
(Sokolowski et al., 2000; Yang et al., 2001). L9 OA is selected to study the conduction of tests on
an annealed Inconel 600 tube and convert the trial results into mathematical equations by RSM
(response surface methodology). MM's competence developed by RSM is inspected using ANOVA
(analysis of variance) provided R2 (regression coefficient) value. Also, surface plots will be studied
for the impact of HFIP on the maximization of BR and minimization of TR using Minitab digital
Page 4
18 Revista Română de Informatică și Automatică, vol. 31, nr. 3, 15-30, 2021
http://www.rria.ici.ro
software. Two process responses namely, BR denoted by Df/Do (Df and Do are the final and original
diameter at bulge point and TR represented by (Ti-Tf) / Ti, (where Ti and Tf are the original and
final thickness at the highest bulging spot) are indicated in Figure 2.
Figure 2. Free bulge Specifications of hydroforming technique
(Sokolowski, Gerke, Ahmetoglu & Altan, 2000)
From the previous research and pilot experiments, it is noticed that the inside pressure (P),
axial movement (F), and tube length (L) are the most guiding factors affecting the maximum BR
and minimum TR variation of the tube. Three HFIPs were selected, altering one each time; nine expe-
riments were carried using the THF facility to find each HFIP's working levels as given in Table 1.
Table 1. Various levels of process variables
Input variables and Notations Units Levels
1 2 3
Internal Pressure (P) Bar 225 250 275
Axial Movement (F) mm/sec 0.2 0.35 0.5
Length of the Tube (L) Mm 190 210 230
The responses maximum bulge after hydroforming, toolmakers microscope, and digital
micrometer are used. The samples were then cut into two halves horizontally to measure the bulge
and thickness after THF using above said instruments. For every response combination, the result is
noted by an average of three values at three different locations of the maximum bulge point and
recorded as listed in Table 2. The present research explores the impact of factors on the maximum
bulge and minimum thickness variation.
Table 2. L9 Experimental observations as per Taguchi design
S.No. Pressure
(P)
Axial Force
(F)
Tube Length
(L) Df Tf Df/Do (Ti-Tf)/Ti
1 225 0.20 190 82.87 1.291 1.45 0.11
2 225 0.35 210 62.87 1.25 1.10 0.14
3 225 0.50 230 68.58 0.97 1.20 0.33
4 250 0.20 210 88.59 1.26 1.55 0.13
5 250 0.35 230 57.72 1.09 1.01 0.25
6 250 0.50 190 69.72 1.10 1.22 0.24
7 275 0.20 230 85.72 1.25 1.50 0.14
8 275 0.35 190 86.87 1.28 1.52 0.12
9 275 0.5 210 66.3 1.00 1.16 0.31
Page 5
Romanian Journal of Information Technology and Automatic Control, Vol. 31, No. 3, 15-30, 2021 19
http://www.rria.ici.ro
2.1. GA based PSO technique for Multi-Response Optimization using MATLAB
programming
On account of conflicting kinds of response qualities like BR and TR, the one set of
optimized value of factors does not justify the objectives. To get many sets of optimized values for
a combination of factors, under such a scenario, an evolutionary algorithm-based Multi-objective
Optimization using Particle Swarm Optimization (MRPSO) provides improved performance when
compared with the customary improvement strategies. Each data in the group has a flying velocity
of Vm(l) into the demonstration space is characterized along with the position Ym(l) vector. Several
input variables articulate their constituents. Alterations of the data location use its previous position
details and its current velocity (Walker et al., 2017). Thus,
Vm (l + 1) = Vm (l) + c1rand1 (Pbestm – Ym(l)) + c2rand2 (Gbestm – Ym(l)) (1)
Ym (l+ 1) = Vm (l) + Vm (l + 1) (2)
where Ym (l) and Vm (l) are the current position and velocity at iteration h; Gbestm and Pbestm "global
and the personal best position of particle "m; c1, c2, and rand " the cognition, social learning rate,
and the random numbers varying between 0 to 1" respectively. To prevent a violent increase in
velocity and the ambiguous random numbers instigated by the stochastic process of the 'search
algorithm' in velocities updated in PSO, the Pareto front in combination with a genetic algorithm
by conducting MRPSO will be used.
Multiple-response conditions provide an optimized group of HFIPs otherwise, optimizing
individually, each response comprises conflicting solutions like one objective is improving by
declining others in their final solution. The general and straightforward method is by establishing
an absolute Pareto-front-solutions group or a graphic subgroup. The non-dominated (ND) are
improved solutions obtained by reducing one or more responses, and by running an optimization of
multi-output, a group of ND results will be obtained. A Pareto group is obtained by stabilizing the
process within disagreeing responses. The projected work is to obtain an optimized combination set
of HFIPs for maximum BR and minimum TR.
3. Results and discussion
3.1. Empirical modeling, adequacy tests like ANOVA and multiple R2 for THF
using RSM
The trial's output data from Table 2 are employed in Minitab statistical software (Yunus &
Alsoufi, 2020), which computes the developed correlational model's (CM) regression coefficients.
The polynomial fit conditions are detailed for the following Eqs (3) and (4)
BR = 8.8 - 0.0028 P + 2.14 F - 0.0682 L - 0.0625 P*F + 0.000149 P*L + 0.0605 F*L (3)
TR = 3.56 - 0.0130 P - 1.93 F - 0.0174 L + 0.0011 P*F + 0.000063 P*L + 0.0110 F*L (4)
ANOVA for the output responses BR & TR are specified in Tables 3 and 4, respectively,
where generally models are considered vital if Probability >F but less than 0.05. BR and TR's
ANOVA results (refer to Tables 3 and 4) show that the developed CMs are significant.
Furthermore, to ensure the excellent agreement between developed models and the experiments,
the multiple regression coefficients (R2); the CMs to total experimental variability ratio are used to
check the fitness level (Fuchizawa, Narazaki & Yuki, 1993). In this work, R2 is very close to 1
indicates that the developed EMs are important and fit the experimental results. Referring to Tables
3, and 4, R2=0.94 (for BR) and 0.95 (for TR) represents that the EMs results fit experimental values
up to 94%, and 0.95 respectively.
Page 6
20 Revista Română de Informatică și Automatică, vol. 31, nr. 3, 15-30, 2021
http://www.rria.ici.ro
Table 3. ANOVA results of BR
Basis Degree of
Freedom Adjusted SS Adjusted MS
F-statistics
Value
Probability
Value
Model 6 0.055800 0.009300 4.89 0.179
Linear 3 0.045770 0.015257 8.03 0.113
P 1 0.000572 0.000572 0.30 0.638
F 1 0.025752 0.025752 13.55 0.067
L 1 0.005038 0.005038 2.65 0.245
2-Way Interaction 3 0.003700 0.001233 0.65 0.653
P*F 1 0.000021 0.000021 0.01 0.925
P*L 1 0.001152 0.001152 0.61 0.518
F*L 1 0.001260 0.001260 0.66 0.501
Error 2 0.003800 0.001900
Total 8 0.059600
R2 97.62% R2 (adjusted) 94.50%
Note: “Sum-of-Square (SS)” denotes the sum of squared differences from the average, and
“Mean Square (MS)” value is computed by dividing a SS by the corresponding degrees of freedom.
The adjusted R2 of BR (refer to Table 4) is 0.9582is close to actual R2 indicating that the
developed model is adequate to handle variation. Similarly, TR satisfies the adequacy conditions as
detailed in Table 4.
Table 4. TR from ANOVA results
Basis Degree of
Freedom
Adjusted F-statistics
Value
Probability
Value SS MS
Model 6 0.296819 0.049470 2.70 0.295
Linear 3 0.277389 0.092463 5.04 0.170
P 1 0.069215 0.069215 3.78 0.191
F 1 0.035438 0.035438 1.93 0.299
L 1 0.102021 0.102021 5.56 0.142
2-Way
Interaction 3 0.086536 0.028845 1.57 0.411
P*F 1 0.064038 0.064038 3.49 0.203
P*L 1 0.006438 0.006438 0.35 0.614
F*L 1 0.038402 0.038402 2.09 0.285
Error 2 0.036670 0.018335
Total 8 0.333489
R2 95.00% R2(adjusted) 93.02%
Page 7
Romanian Journal of Information Technology and Automatic Control, Vol. 31, No. 3, 15-30, 2021 21
http://www.rria.ici.ro
Also, these CMs are tested for competence utilizing NPD (normal probability distribution) of
residuals. Thus, the NPD of residuals of both outputs show all detailed data distribution is nearer
line means adequacy is very much acceptable (Mohanty, Mahapatra & Singh, 2016). In both
outputs (BR, TR), the distribution of data values is seen very near to or on the line of plots shown
in Figure 3 (a) and 3 (b), signifying that the distribution of the errors is normal.
(a) (b)
Figure 3. Normal probability distribution of residuals for (a) BR (b) TR
3.2. Confirmation experiments
The empirical equations of RSM are validated with the trial results using the combinations of
HFIPs for BR and TR if deviation lies within limits. Percentage deviation is found by comparing
the predicted and actual trial results presented in Table 5 by the ratio of the difference between trial
and expected to the expected value. Deviation shows a perfect acceptance limit for the adopted
methodology.
Table 5. Validation of results for BR and TR
No.
Process parameters Bulge ratio Thinning ratio
P in
Bar
F in
Mm/
sec
L in
mm Predicted
Experi-
ment
Deviatio
n (%) Predicted
Experi
-ment
Deviation
(%)
1 225 0.20 190 1.49625 1.45 3.09 0.10375 0.11 0.431
2 225 0.35 210 1.162125 1.10 5.35 0.177375 0.14 3.398
3 225 0.50 230 1.191 1.20 0.76 0.317 0.33 1.083
4 250 0.20 210 1.4445 1.55 7.30 0.0945 0.13 2.290
5 250 0.35 230 1.132 1.01 10.8 0.23675 0.25 1.312
6 250 0.50 190 1.2245 1.22 0.37 0.214 0.24 2.131
7 275 0.20 230 1.54175 1.50 2.71 0.14825 0.14 0.55
8 275 0.35 190 1.613875 1.52 5.82 0.132625 0.12 0.831
9 275 0.5 210 1.1415 1.16 1.621 0.3105 0.31 0.043
3.3. Impact of single and joint levels of HFIPs on BR
The influence of single HFIPs levels of IP shows a direct impact on BR variation like it
increments with an increase of IP and yields to the higher load on the tube sheet. Because of
Page 8
22 Revista Română de Informatică și Automatică, vol. 31, nr. 3, 15-30, 2021
http://www.rria.ici.ro
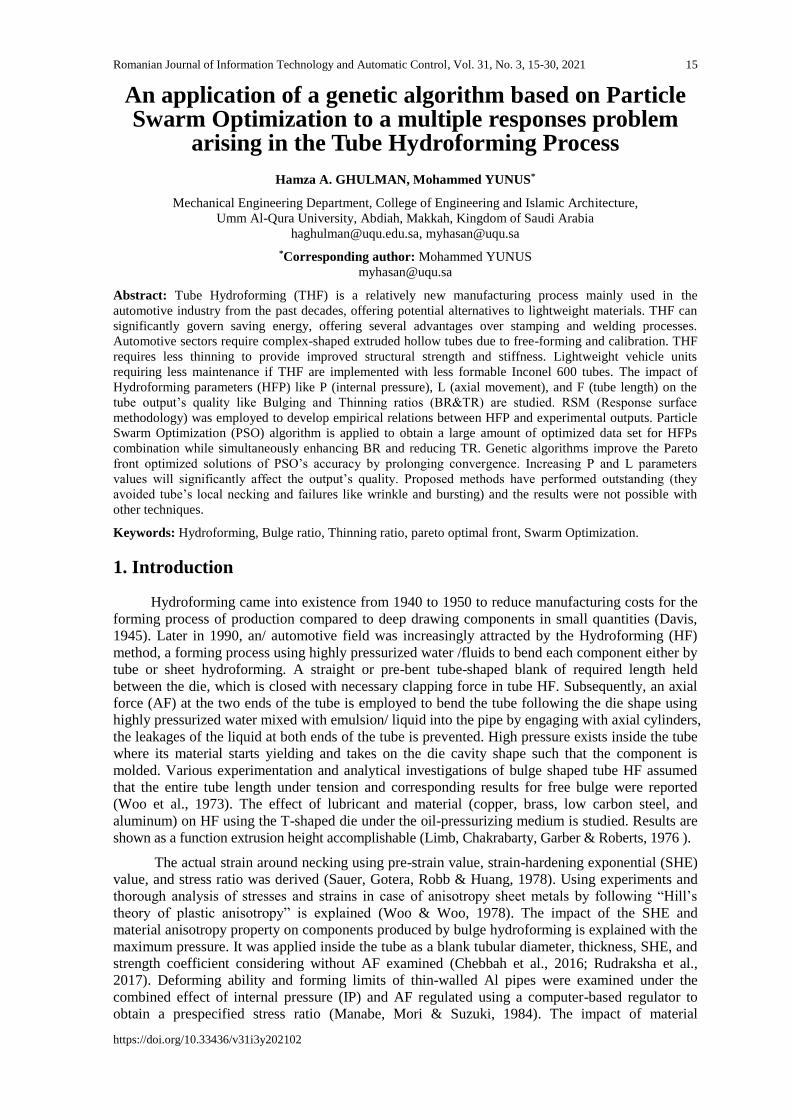
growing IP, the material keeps deforming until it reaches the ultimate strength. The impact of
single HFIP levels of F also shows the same effect on BR like P. As this F was increasing, its value
brought the material into an expansion state. Further material gets added to regulate and minimize
the tube size (thickness) at the maximum bulging point. It provides necessary material at the
expansion zone to attain the maximum bulging in this way.
Similarly, the influence of a third HFIP, L, on BR shows an inverse relationship as BR
decreases with increasing L because an excess substance is not provided to a forming region by an
AF. With the IP, the material gets thin at the maximum bulge point, and the tube will be under
bursting failure, as exhibited in Figure 4a. Figure 4b elucidates the increasing level of AF and IP
has a direct interactive influence on increasing BR. Due to the simultaneous increase of AF and IP,
the BR rises more than AF and IP's individual impact. Figure 4c illustrates the interactive influence
of L and IP on BR wherein BR increases with factor IP and decreasing with factor L. Joint impact
of L and IP on BR shows it increased reasonably with the rise of both factors L and IP. Similarly,
this is also true in the combined impact of HFIPs like L and AF, where BR increased moderately
with the increase of both L and AF. At their individual levels, the BR value rises with the decrease
of L and an increase of AF (refer to Figure 4d).
(a) (b)
(c) (d) (e)
Figure 4. Main effect of (a) IP, AF, & L and Interaction effect of (b) of all factors (c) AF & IP (d) L
& IP and (e) L & AF on BR
3.4. Single and joint level impact of HFIPs on TR
The importance of IP, AF, and L on TR are illustrated in Figure 5(a), show that the rise of
TR occurs when IP increases as it causes the maximum bulge by thinning the tube. The TR is the
ratio of difference of tube thickness to initial thickness. Therefore, a higher TR means additional
variation in the thickness of the THF process. Similarly, the AF on TR shows that TR decreased
Page 9
Romanian Journal of Information Technology and Automatic Control, Vol. 31, No. 3, 15-30, 2021 23
http://www.rria.ici.ro
with the AF increase as it causes extra material to be drawn into the expansion zone. Also, it
compensates for the thinning of the tube along with increased bulge of the tube. This produces the
wrinkles on the final shape of the tube. L's impact on the increasing TR is growing as the required
material does not reach the forming zone by the AF alone. With the increasing L, the higher AF is
expected to drive the substance into the forming region.
(a) (b)
(c) (d) (e)
Figure 5. Main effect of (a) IP, AF, & L and Interaction effect of (b) of all factors (c) AF & IP (d) L
& IP and (e) L & AF on TR
The Impact of factors increased TR with individual level of rising of IP and fall of AF. But at
their combined level, TR has been increased satisfactorily with increasing AF and IP, as displayed
in Figure 5b. Figure 5c demonstrates the TR increased with increasing combined levels of L and IP
significantly. Referring to Figure 5 (d), TR rises with L's rising and AF's decreasing values when
the individual HFIP levels are considered. The combined impact of L and AF showed that their
increasing levels raise the TR relatively.
3.5. Interpretation of optimized state using GA based PSO
In this investigation, minimizing the TR and the maximization of BR were considered as the
objective functions. Maximum BR/ bulging capacity signifies the tube material's distortion ability
to bear out any shape by the THF process. On the other hand, the tube thickness was found to
decrease with the increase of the bulging height, causing lower strength of the HF components. The
objective functions for the BR and TR are formulated as optimizing model is given as shown in
Figure 6 and Eqs (5) & (6) ( Mohanty, Mahapatra & Singh, 2016):
F (1) =(8.8-0.0028*P+2.14*F-0.0682*L-0.0625*P*F+0.000149*P*L+0.0605*F*L); (5)
F (2) =-(3.56-0.0130*P-1.93*F-0.0174*L+0.0011*P*F+0.000063*P*L+0.0110*F*L); (6)
Page 10
24 Revista Română de Informatică și Automatică, vol. 31, nr. 3, 15-30, 2021
http://www.rria.ici.ro
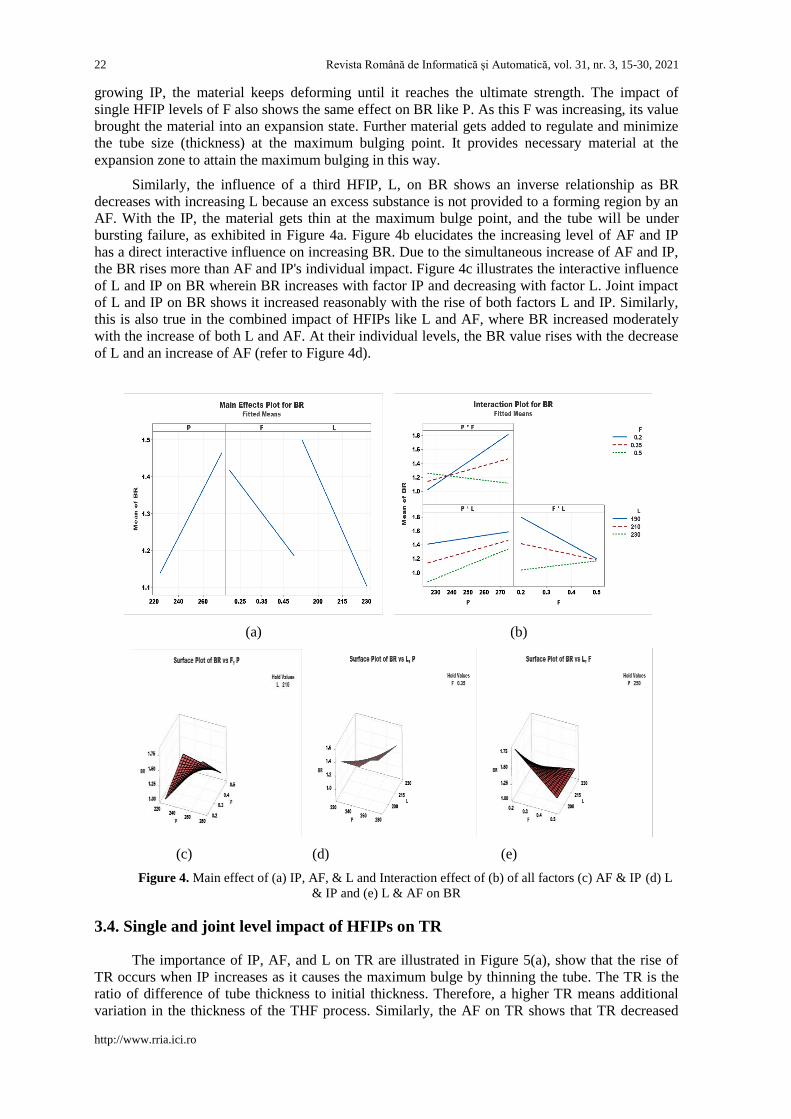
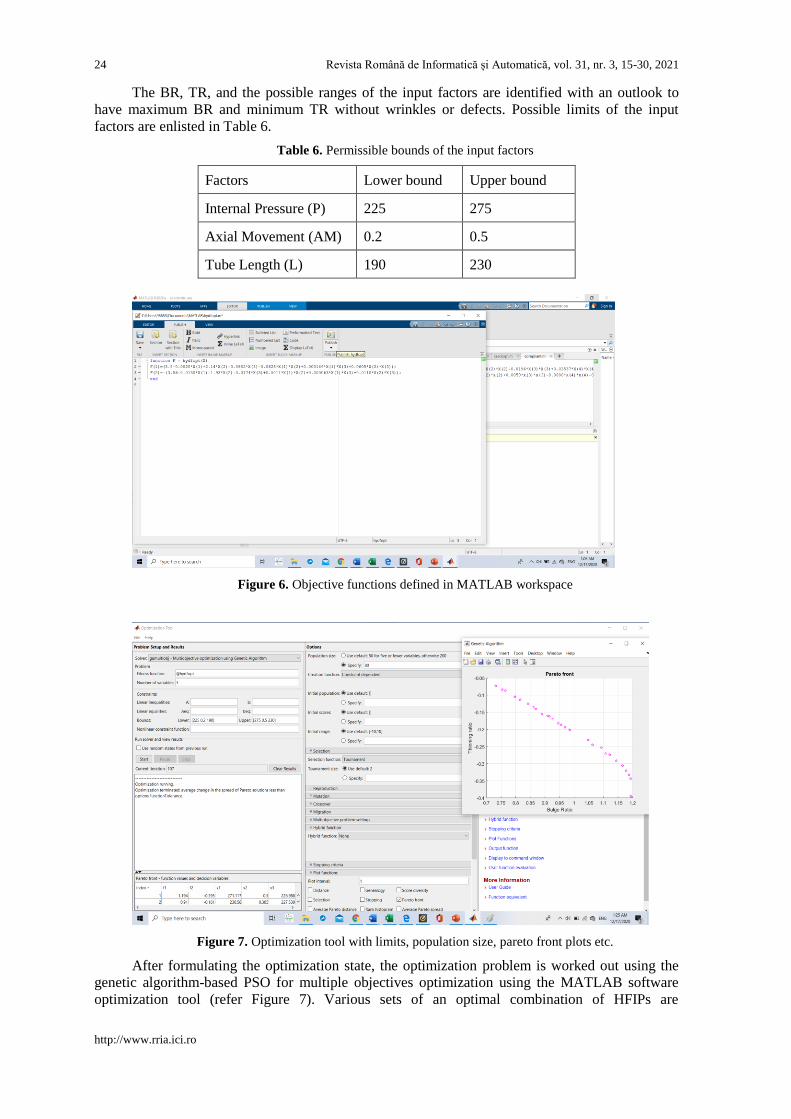
The BR, TR, and the possible ranges of the input factors are identified with an outlook to
have maximum BR and minimum TR without wrinkles or defects. Possible limits of the input
factors are enlisted in Table 6.
Table 6. Permissible bounds of the input factors
Factors Lower bound Upper bound
Internal Pressure (P) 225 275
Axial Movement (AM) 0.2 0.5
Tube Length (L) 190 230
Figure 6. Objective functions defined in MATLAB workspace
Figure 7. Optimization tool with limits, population size, pareto front plots etc.
After formulating the optimization state, the optimization problem is worked out using the
genetic algorithm-based PSO for multiple objectives optimization using the MATLAB software
optimization tool (refer Figure 7). Various sets of an optimal combination of HFIPs are
Page 11
Romanian Journal of Information Technology and Automatic Control, Vol. 31, No. 3, 15-30, 2021 25
http://www.rria.ici.ro
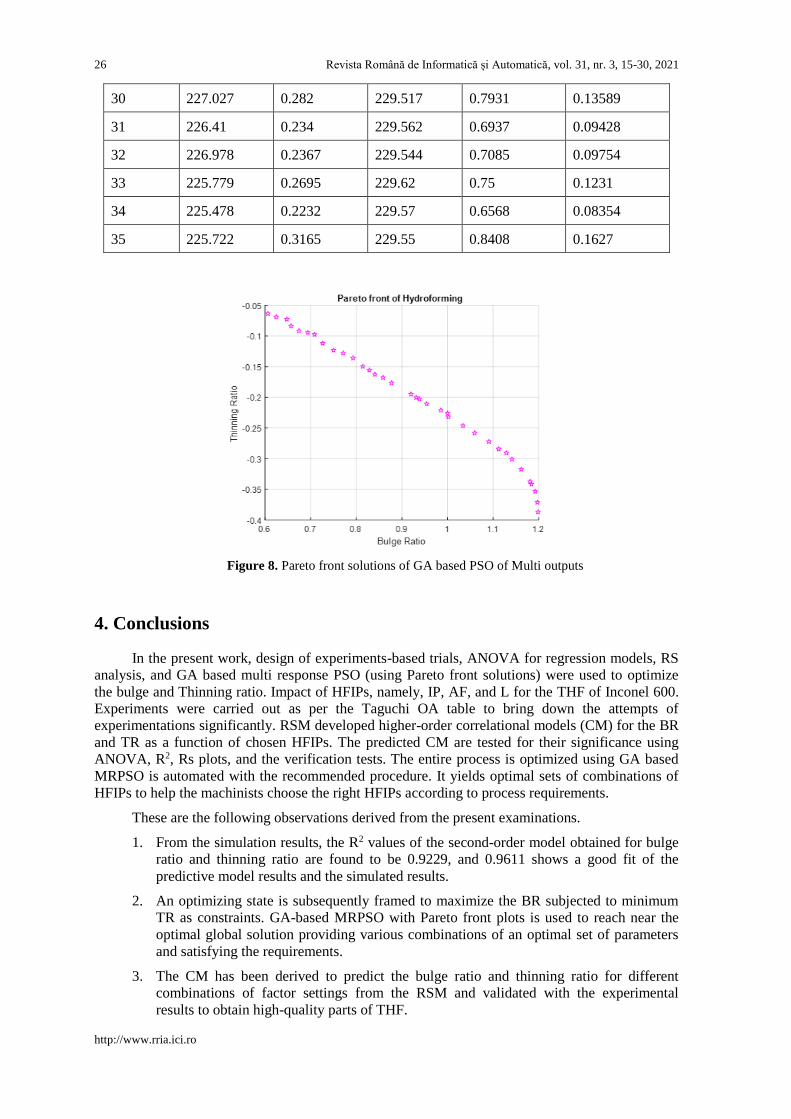
accomplished. An initial population of 80 is selected for evaluating objective functions, and it uses
the Pareto front plot for the best global optimal solutions obtained, as shown in Figure 8.
Corresponding values of plots are enlisted in Table 7.
Table 7. Best Global optimal solutions from PSO
S.No. P F L BR TR
1 225.5 0.206 229.5 0.62453 0.068779
2 260.43 0.5 229.5 1.19837 0.3870145
3 241.53 0.463 229.49 1.16154 0.317444
4 226.73 0.3713 229.541 0.954252 0.210734
5 226.726 0.3589 229.538 0.93130 0.200273
6 225.412 0.233 229.604 0.67433 0.091798
7 227.237 0.3604 229.559 0.93840 0.20253
8 245.218 0.4825 229.513 1.1839 0.3414
9 226.242 0.307 229.538 0.82873 0.1555
10 254.698 0.4952 229.488 1.19702 0.37123
11 226.722 0.2732 229.596 0.7712 0.12795
12 227.762 0.4252 229.512 1.0596 0.25818
13 225.883 0.2559 229.576 0.7264 0.11183
14 231.986 0.4321 229.5 1.0907 0.27222
15 226.527 0.2079 229.518 0.6478 0.07249
16 226.181 0.3 229.572 0.8144 0.14953
17 232.647 0.4643 229.526 1.1412 0.30092
18 239.6598 0.4364 229.484 1.1289 0.2907
19 226.608 0.3206 229.55 0.8588 0.16775
20 244.414 0.4799 229.489 1.181 0.3375
21 227.649 0.4112 229.523 1.0338 0.2462
22 225.237 0.2001 229.629 0.6062 0.0636
23 252.539 0.4794 229.534 1.1922 0.3533
24 227.6 0.394 229.586 1.002 0.2317
25 229.03 0.3785 229.539 0.9855 0.22114
26 233.591 0.4423 229.516 1.1122 0.2841
27 226.434 0.3313 229.515 0.8774 0.17647
28 226.7197 0.3525 229.493 0.92 0.19485
29 230.209 0.3818 229.537 1.0001 0.2262
Page 12
26 Revista Română de Informatică și Automatică, vol. 31, nr. 3, 15-30, 2021
http://www.rria.ici.ro
30 227.027 0.282 229.517 0.7931 0.13589
31 226.41 0.234 229.562 0.6937 0.09428
32 226.978 0.2367 229.544 0.7085 0.09754
33 225.779 0.2695 229.62 0.75 0.1231
34 225.478 0.2232 229.57 0.6568 0.08354
35 225.722 0.3165 229.55 0.8408 0.1627
Figure 8. Pareto front solutions of GA based PSO of Multi outputs
4. Conclusions
In the present work, design of experiments-based trials, ANOVA for regression models, RS
analysis, and GA based multi response PSO (using Pareto front solutions) were used to optimize
the bulge and Thinning ratio. Impact of HFIPs, namely, IP, AF, and L for the THF of Inconel 600.
Experiments were carried out as per the Taguchi OA table to bring down the attempts of
experimentations significantly. RSM developed higher-order correlational models (CM) for the BR
and TR as a function of chosen HFIPs. The predicted CM are tested for their significance using
ANOVA, R2, Rs plots, and the verification tests. The entire process is optimized using GA based
MRPSO is automated with the recommended procedure. It yields optimal sets of combinations of
HFIPs to help the machinists choose the right HFIPs according to process requirements.
These are the following observations derived from the present examinations.
1. From the simulation results, the R2 values of the second-order model obtained for bulge
ratio and thinning ratio are found to be 0.9229, and 0.9611 shows a good fit of the
predictive model results and the simulated results.
2. An optimizing state is subsequently framed to maximize the BR subjected to minimum
TR as constraints. GA-based MRPSO with Pareto front plots is used to reach near the
optimal global solution providing various combinations of an optimal set of parameters
and satisfying the requirements.
3. The CM has been derived to predict the bulge ratio and thinning ratio for different
combinations of factor settings from the RSM and validated with the experimental
results to obtain high-quality parts of THF.
Page 13
Romanian Journal of Information Technology and Automatic Control, Vol. 31, No. 3, 15-30, 2021 27
http://www.rria.ici.ro
4. From the simulated results, it is observed that the increase in IP has a significant effect
on the maximum BR and the effect of axial movement on TR has substantial influence
are validated with experiments.
5. A bulge ratio of 1.4497 and thinning ratio of 0.1095 from experimental values and bulge
ratio is increased to 1.464, and the thinning ratio is decreased to 0.106 after GA-MRPSO.
It is noted at IP=268 Bar, AF=0.38 mm/sec, and L=198 mm are validated through test
runs on the same experimental setup.
6. The interactive or combined effects of HFIPs like IP, AF, and L on the BR and TR are
demonstrated and analyzed, showed that the combined impact of AF and IP is more on
the enhancement of BR with lowering TR.
The present work was limited to a few HFIPs for conducting experiments and further
analysis by increasing them to 4 or 5 depending on availability and THF machine's capacity.
Furthermore, applying other available optimization techniques may also find the optimal HFIPs
like ANN (Artificial neural networks), GA, etc. Comparisons were made between the two
optimization techniques for suggesting the most suitable method. The present research is applied
only for the free-forming stage and can be extended to analyze the calibration stage.
REFERENCES
1. Abedrabbo, N. (2009). Optimization methods for the tube hydroforming process applied to
advanced high strength steels with experimental verification. Journal of Materials Processing
Technology, 209, 110-123.
2. Ahmed, M. & Hashmi, M. S. J. (1997). Estimation of machine parameters for hydraulic bulge
forming of tubular components. Journal of Material Processing Technology, 64(1–3), 9–23.
doi: 10.1016/S0924-0136(96)02549-6.
3. Asnafi, N. (2020). Analytical modelling of tube hydroforming. Thin-Walled Structures, 34(4),
295–330. 1999, Accessed: Aug. 08, 2020. [Online]. Available:https://www.academia.edu/
7516790/Analytical_modelling_of_tube_hydroforming.
4. Chebbah, M.-S. Hebbir, N. Kanit, T. & Dehimi, S. (2016). Application of the Inverse Finite
Element Approach for the Fast Simulation of Tube Hydroforming. Journal of Procedia
Technology, 22, 78–85. doi: 10.1016/j.protcy.2016.01.013.
5. Davis, E. A. (1945). Yield and fracture of medium-carbon steel under combined stress. Journal
of Applied Mechanics, A13-A24.
6. Dohmann, F. & Hartl, C. (1996). Hydroforming - A method to manufacture light-weight parts.
Journal of Material Processing Technology, 60(1–4), 669–676. doi: 10.1016/0924-
0136(96)02403-X.
7. Fuchizawa, S. (1987). Influence of Plastic Anisotropy on Deformation of Thin-walled Tubes in
Bulge Forming. Advanced Technology of Plasticity, 2, 727–732.
8. Fuchizawa, S., Narazaki, M. & Yuki, H. (1993). Bulge Test for Determining Stress-Strain
Characteristics of Thin Tubes. Beijing, International Academic Publishers.
9. Genlin, J. C. & Labergere, C. (2002). Numerical control strategies for the hydroforming of thin
walled metallic tubes. In Proceedings of International Conference and Workshop on
Page 14
28 Revista Română de Informatică și Automatică, vol. 31, nr. 3, 15-30, 2021
http://www.rria.ici.ro
Numerical Simulation of 3D Sheet Metal Forming Processes, (NUMISHEET ), 30(7), 499–
504. doi: 10.1002/adfm.201909537.
10. Hydro forming. https://www.slideshare.net/MehulPatel39/hydro-forming-27456214 (accessed
Aug. 09, 2020).
11. Kim, J., Kang, S. J. & Kang, B. S. (2003). A prediction of bursting failure in tube
hydroforming processes based on ductile fracture criterion. International Journal of Advanced
Manufacturing Technology, 22(5–6), 357–362. doi: 10.1007/s00170-002-1489-6.
12. Kim, S. W., Song, W. J., Kang, B. S. & Kim, J. (2009). Bursting failure prediction in tube
hydroforming using FLSD. International Journal of Advanced Manufacturing Technology,
41(3–4), 311–322. doi: 10.1007/s00170-008-1488-3.
13. Kwan C. T. & Lin, F. C. (2002). Investigation of T-shape tube hydroforming with finite element
method. International Journal of Advanced Manufacturing Technology, 21(6), 420–425. doi:
10.1007/s001700300049.
14. Limb, M. E., Chakrabarty, J., Garber, S. & Roberts, W. T. (1976). Hydraulic forming of tubes.
Sheet Metal Industries, 676489(10), 418–424.
15. Manabe, H. N. K. Mori, S. & Suzuki, K. (1984). Bulge Forming of Thin Walled Tubes by
Micro-Computer Controlled Hydraulic Press. In Proceedings of 1st International Centre for
Theoretical Physics (ICTP), 279–284.
16. Manabe, K-I. & Amino, M. (2002). Effects of process parameters and material properties on
deformation process in tube hydroforming. Journal of Material Processing Technology, 123,
285–291, doi: 10.1016/S0924-0136(02)00787-2.
17. Mohanty, C. P., Mahapatra, S. S. & Singh, M. R. (2016). A particle swarm approach for multi-
objective optimization of electrical discharge machining process. Journal of Intelligent
Manufacturing, 27(6), 1171-1190.
18. Oreijah, M. M. & Yunus, M. (2019). A parametric analysis to evaluate the performance
metrics of power generation system involving Trilateral Flash Cycle using three different
working fluids for low grade waste heat. AIMS Energy, 7(4), 483-492. doi:
10.3934/energy.2019.4.483.
19. Rudraksha, S. P. & Gawande, S. H. (2017). Optimization of Process Parameters to Study the
Influence of the Friction in Tube Hydroforming. Journal of Bio- and Tribo-Corrosion. 3(4), 56.
doi: 10.1007/s40735-017-0117-9.
20. Sauer, W. J., Gotera, A., Robb, F. & Huang, P. (1978). Free Forming of Tubes under Internal
Pressure and Axial Compression. In Proceedings of the 6th North American Manufacturing
Research Conference SME, Michigan (NAMRC-VI), 228-235.
21. Sokolowski, T. K., Gerke, M., Ahmetoglu & Altan, T. (2000). Evaluation of tube formability
and material characteristics: hydraulic bulge testing of tubes. Journal of Material Processing
Technology, 98(1), 34–40.
22. Sreenivasulu, B. & Prasanthi, G. (2017). Empirical modeling & Analysis of Tube
Hydroforming process of Inconel 600 using Response Surface Methodology. International
Journal of Mechanical & Mechatronics Engineering IJMME-IJENS, 17(01), 127-133.
23. Strano, M., Jirathearanat, S., Shr, S. G. & Altan, T. (2004). Virtual process development in tube
hydroforming. Journal of Material Processing Technology, 146(1), 130–136. doi:
10.1016/S0924-0136(03)00853-7.
24. Walker, B. (2017). Particle swarm optimization (PSO): advances in research and applications.
Nova Science Publishers.
25. Woo, D. M. (1973). Tube-bulging under internal pressure and axial force. Journal of
Engineering Material Technology Transactions, ASME, 95(4), 219–223. doi:
10.1115/1.3443156.
Page 15
Romanian Journal of Information Technology and Automatic Control, Vol. 31, No. 3, 15-30, 2021 29
http://www.rria.ici.ro
26. Woo D. & Woo, D. M. (1978). Development of a bulge forming process. Sheet Metal
Industries, 55(5), 623–625.
27. Yang, J.-B., Jeon, B.-H. & Oh, S.-I. (2001). Design sensitivity analysis and optimization of the
hydroforming process. Journal of Material Processing Technology, 113, 666–672.
28. Yunus, M. & Alsoufi, M. S. (2016). Multi-output optimization of tribological characteristics
control factors of thermally sprayed industrial ceramic coatings using hybrid Taguchi-grey
relation analysis. Friction, 4(3), 208–216. doi: 10.1007/s40544-016-0118-6.
29. Yunus, M. & Alsoufi, M. S. (2018). Mathematical Modelling of a Friction Stir Welding
Process to Predict the Joint Strength of Two Dissimilar Aluminium Alloys Using Experimental
Data and Genetic Programming. Modelling and Simulation in Engineering, 2018, Article ID
4183816, 18 pages. doi: 10.1155/2018/4183816.
30. Yunus, M. & Alsoufi, M. S. (2019). Development of a heat pipe and grey based taguchi
method for multi-output optimization to improve thermal performance using hybrid nanofluids.
Frontiers of Heat and Mass Transfer, 12 (11), 1-8. doi: 10.5098/hmt.12.11.
31. Yunus, M. & Alsoufi, M. S. (2019). Mathematical Modeling of Multiple Quality
Characteristics of a Laser Microdrilling Process Used in Al7075/SiCp Metal Matrix
Composite using Genetic Programming. Modelling and Simulation in Engineering, 2019.
Article ID 1024365, 15 pages, doi: 10.1155/2019/1024365.
32. Yunus M. & Alsoufi, M. S. (2020). Application of response surface methodology for the
optimization of the control factors of abrasive flow machining of multiple holes in zinc and
Al/SiCp MMC wires. Journal of Engineering Science and Technology, 15(1), 655-674.
Page 16
30 Revista Română de Informatică și Automatică, vol. 31, nr. 3, 15-30, 2021
http://www.rria.ici.ro
Hamza A. GHULMAN is an associate professor at the Department of Mechanical
Engineering, College of Engineering and Islamic Architecture, Umm Al-Qura University, Makkah,
Kingdom of Saudi Arabia. He majored in Mechanical EngineeringManufacturing from Ohio
University, USA. He held positions of Head of the Mechanical Engineering Department, Vice
Dean for Academic Affairs, Dean of the Custodian of the Two Holy Mosques institute of Hajj and
Umrah Studies, and Dean for the college of Engineering and Islamic Architecture from 2001 to
2018. He was also Chair of the Technical, Advisory and the National Committee for the Saudi
Building Code and Head of the technical team supervising the project designs to increase the
capacity of the terminal in the Holy Mosque of Makkah. The college obtained the ABET
international academic accreditation for two phases. He has published more than 80 research papers
and books that have been printed in scientific journals, conferences, seminars and workshops in
which he participated locally and internationally. He is a member in various national and
international associations such as the Saudi Council of Engineers (adviser), the American Society
of Engineers and Mechanics, the American Society of Engineers, the American Society of
Industrial Engineers, the Scientific Society in Physical, the Arab Institute for Operation and many
other societies.
Mohammed YUNUS is an Associate Professor (since 2014) in the Department of
Mechanical Engineering, College of Engineering and Islamic Architecture, Makkah, Kingdom of
Saudi Arabia. He graduated from the Faculty of Mechanical Engineering, Gulbarga University,
India (1997), and has a master's degree in Machine design – Visvesvaraya Technological
University, India (2000) and he also holds a Ph.D. Doctoral degree in Manufacturing, Thermal and
Design - Anna University, Chennai, India (2012). The main areas of interest for the research
activity include: Thermal Barrier Coatings, Composites, CAE, CFD, HVAC, Smart materials, CIM,
Aerospace Components, Surface Characterization, Solid Mechanics, Fluid Mechanics,
Optimization and Genetic Algorithm, renewable energy sources, water treatment, Compliant
Mechanisms etc.He served as Post Graduation head and Under graduate head from 2008 to 2012.
He has published more than 100 technical papers in reputed international, national journals and
conferences. He has one United state patent.