Journal of Tropical Fore.^t Sdence 17(2): 279-296 {2005) 279 AN ASSESSMENT OE CHANGES IN BIOMASS CARBON STOCKS IN TREE CROPS AND FORESTS IN MALAYSIA I. E. Henson* 24 Ashvale, Cambridge CB4 2SZ, United Kingdom I Received December 2003 ^ ._ HENSON, I. E. 2005. An assessment of changes in biomass carbon stocks in tree crops and forests in Malaysia. This study assesses changes in the biomass carbon stocks of forests and tree crops in Malaysia during the period 1981 to 2000; a time of rapid expansion in oil palm cultivation. Peninsular Malaysia and the East Malaysian states of Sahah and Sarawak are considered separately. Changes in the planted areas of oil palm, other tree crops (rnhher, cocoa, coconut) and forests are presented, as are changes in the total biomass of each vegetation type as estimated from the product of area and biomass density. Although oil palm area increased progressively in all three regions, total forest plus tree crop area was redticed in 2000 compared with 1980 by 0.87 million ha, thus perpetuating a historical trend. The decline was gradual in Peninsular Malaysia but more erratic in the East Malaysian states. The eflect of various asstirnptions on the outcomes ofthe analysis and the implications for carbon emissions and total carbon balance are discussed, and the contrihution of oil palm in reducing potential carbon emissions is evaluated. Key words: Oil palm - rubber - cocontit - cocoa - forest - carbon emission HENSON, I. E. 2005. Penilaian perubahan stok karbon biojisim dalam pokok tanaman dan butan di Malaysia. Kiijiaii ini menilai perubalian slok karbon biojisim dalam hutan dan pokok tanaman di Malaysia dari tahun 1981 hingga tahun 2000 yang tnerupakan tempoh perkembangan pesat penanaman kelapa sawit. Semenanjung Malaysia dan Sahah serta Sarawak di Malaysia Timur dikaji secara berasingan. Perubahan di kawasan yang diianam kelapa sawit. pokok tanaman lain (getah, koko dan kelapa) dan hutan diberi dalam kertas kerja ini. Begitu juga dengan data Jumlah biojisim setiap jenis tanaman seperti yang dianggarkan daripada hasil darab luas kawasan dan ketumpatan biojisim. Walaupun kawa.san kelapa sawit meningkat secara berperingkat-peringkat di ketiga-ketiga kawasan, jumlah kawasan hutan dan tanaman pokok berkuiangan sebanyak 0.87juta ha pada tahun 2000 berbanding tahun 1980. Penurtman ini beransur- ansur di Semenanjutig Malaysia tetapi lebih tidak menentu di Malaysia Timur. Kesan pelhagai tanggapan terhadap hasil anali.sis dan implikasi untuk pelepasan karbon serta imbangan jumlah karbon dibincangkan. Selain itu, stunbangan kelapa sawit dalaui mengurangkan pelepasan karbon dinilai. Introduction The area occupied by oil palm (Elaeis guineensis) in Malaysia has expanded rapidly such that in the year 2000 about 10% of the country was covered by the crop, representing 56% of the agricultural land area, thus dominating any other single agricultural activity (MPI 2001). In the early years of plantation development large areas of forest were cleared to establish plantations, e.g. especially in the west coast Present address: Malaysia Palm Oil Board, P. O. Box 10620, 50720, Kuala Lumpur, Malaysia. E-mail: [email protected]
Transcript
Journal of Tropical Fore.^t Sdence 17(2): 279-296 {2005) 279
AN ASSESSMENT OE CHANGES IN BIOMASS CARBONSTOCKS IN TREE CROPS AND FORESTS IN MALAYSIA
I. E. Henson*
24 Ashvale, Cambridge CB4 2SZ, United KingdomI
Received December 2003 ^ ._
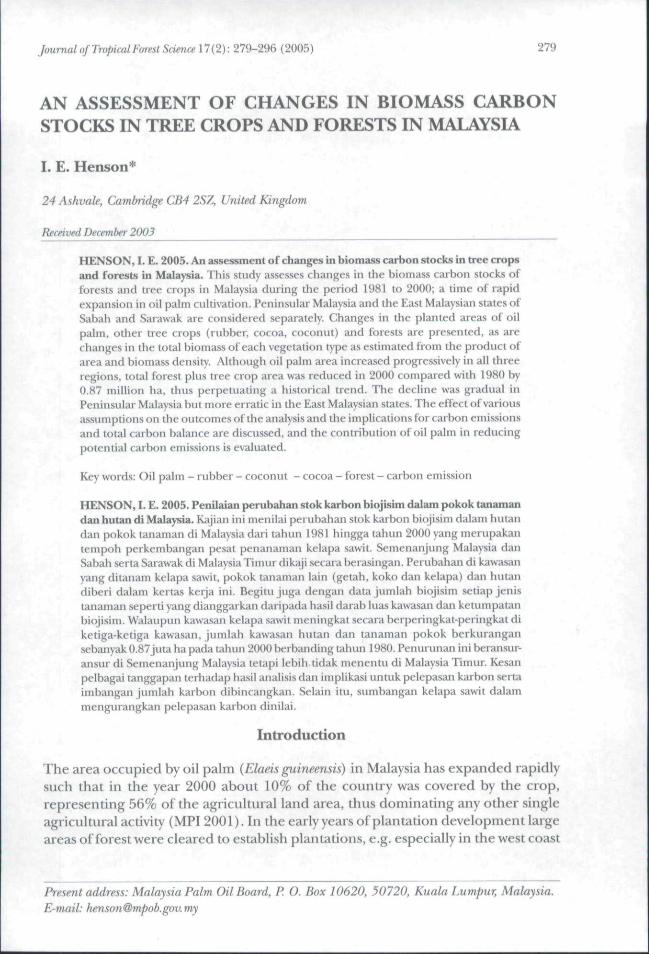
HENSON, I. E. 2005. An assessment of changes in biomass carbon stocks in tree cropsand forests in Malaysia. This study assesses changes in the biomass carbon stocks offorests and tree crops in Malaysia during the period 1981 to 2000; a time of rapidexpansion in oil palm cultivation. Peninsular Malaysia and the East Malaysian states ofSahah and Sarawak are considered separately. Changes in the planted areas of oilpalm, other tree crops (rnhher, cocoa, coconut) and forests are presented, as arechanges in the total biomass of each vegetation type as estimated from the product ofarea and biomass density. Although oil palm area increased progressively in all threeregions, total forest plus tree crop area was redticed in 2000 compared with 1980 by0.87 million ha, thus perpetuating a historical trend. The decline was gradual inPeninsular Malaysia but more erratic in the East Malaysian states. The eflect of variousasstirnptions on the outcomes ofthe analysis and the implications for carbon emissionsand total carbon balance are discussed, and the contrihution of oil palm in reducingpotential carbon emissions is evaluated.
HENSON, I. E. 2005. Penilaian perubahan stok karbon biojisim dalam pokok tanamandan butan di Malaysia. Kiijiaii ini menilai perubalian slok karbon biojisim dalam hutandan pokok tanaman di Malaysia dari tahun 1981 hingga tahun 2000 yang tnerupakantempoh perkembangan pesat penanaman kelapa sawit. Semenanjung Malaysia danSahah serta Sarawak di Malaysia Timur dikaji secara berasingan. Perubahan di kawasanyang diianam kelapa sawit. pokok tanaman lain (getah, koko dan kelapa) dan hutandiberi dalam kertas kerja ini. Begitu juga dengan data Jumlah biojisim setiap jenistanaman seperti yang dianggarkan daripada hasil darab luas kawasan dan ketumpatanbiojisim. Walaupun kawa.san kelapa sawit meningkat secara berperingkat-peringkat diketiga-ketiga kawasan, jumlah kawasan hutan dan tanaman pokok berkuiangansebanyak 0.87juta ha pada tahun 2000 berbanding tahun 1980. Penurtman ini beransur-ansur di Semenanjutig Malaysia tetapi lebih tidak menentu di Malaysia Timur. Kesanpelhagai tanggapan terhadap hasil anali.sis dan implikasi untuk pelepasan karbon sertaimbangan jumlah karbon dibincangkan. Selain itu, stunbangan kelapa sawit dalauimengurangkan pelepasan karbon dinilai.
Introduction
The area occupied by oil palm (Elaeis guineensis) in Malaysia has expanded rapidlysuch that in the year 2000 about 10% of the country was covered by the crop,representing 56% of the agricultural land area, thus dominating any other singleagricultural activity (MPI 2001). In the early years of plantation development largeareas of forest were cleared to establish plantations, e.g. especially in the west coast
Present address: Malaysia Palm Oil Board, P. O. Box 10620, 50720, Kuala Lumpur, Malaysia.E-mail: [email protected]
Journal of Tropical Forest Sdtmce 17(2): 279-296 (2005)
ofthe peninsula, this being the most fertile and productive area. More recently, oilpalm has been planted extensively in parts of East Malaysia on newly cleared forestland. Generally, recent oi! palm planting has replaced logged, degraded andsecondary forests. Further oil palm expansion has occurred by the replacement o!other tree crops such as rubber (Hevea brasiliensis), coconut {Cocos nucifera) andcocoa {Theobroma cacao), as these have become less profitable than oil palm.
Changes in landuse have implications for carbon cycling through emission ofCO2, a major greenhouse gas, to the atmosphere. Worldwide, forest denudation isseen as an important contributor to tlie rise in atmospheric CO? levels. Primaryrain forests have gradually accumulated carbon over centuries in both the vegetationand the soil. Much of this has been released following clearance or distm bance bylogging or slash and burn agriculture (Anderson &: Spencer 1991, Tinker el aL1996, FAO 2000). The quantities of carbon contained in primary forests in SoutheastAsia have been itemised in detail for relatively few sites (e.g. Anderson Sc Spencer1991, Okuda et al. 2003), but the total carbon stocks can be substantial, not only inthe vegetation but also in the soil (Chan 1982).
This paper examines the likely changes over the past two decades in total biomass,and hence carbon storage, of Malaysian forests and the major tree crops grown inMalaysia. In this time the oil palm planted area has expanded from 1.02 million hato over 3.38 million ha while forested areas and areas of rubljer and other treecrops have, in general, declined. As there are some differences in the area changesbetween Peninsular Malaysia and the East Malaysian states of Sabah and Sarawak,each of these was treated separately.
The study does not deal witli all vegeuition types to be found in the coimtry.However, other agricultural crops and non-forest natural vegetation have a muchlower biomass density than the 'tree' crops while changes in their areas will berelatively small.
Materials and methods
Areas
Data on areas planted with oil palm were obtained from MPOB (2001) while theaieasof rubber and coconuts were obtained from MPI (2001 and earlier editions)or DOS (1999 and earlier editions). yVreas for cocoa were as given on the April2002 website ofthe Malaysian Cocoa Board {Malaysian Cocoa Board 2002).
The forest areas were taken from four sources, namely, MPI (2001 and earliereditions). DOS (2000 and earlier editions), Molofsky el al. (1986) and the FAOwebsite (FAO 2002). Data from FAO (2002) were available only for certain yearsand were used for verification only. An FAO estimate quoted by Molofsky et al.(1986) was used for the 1980 forest area in Sabah (see Discussion). Otherwise,where available, DOS data were used in preference to MPI data since the formerwere more precise (the forest areas in MPI are generally given to the nearest10 000 ha only). A further reason for the use of DOS rather than MPI data was theoccurrence of some inconsistent values in the MPI datasets for Sarawak.
Journal of Tropical Forest Sdence }7 (2): 279-296 (2005) 281
Standing biomass
The total biomass of each vegetation type was estimated from the product ofarea and biomass density where the density includes provision for both roots andshoot. For oil palm, the biomass density was derived as described previously (Henson2003) with mean biomass densities being calculated for each year based on the agedistribution, with separate calculations for Peninsular Malaysia, Sabah and Sarawak.
For rubber, the mean biomass of mature stands obtained by Yew (2000) wasused. This was taken to represent the biomass at clearing. Biomass prior to this wasnot required for the calculations as only the changes in biomass since 1980 wereconsidered and the area of rubber has been declining since this time. Any possiblereplanting of rubber or its replacement prior to it reaching 'maturity' (i.e. normalage for clearing) was ignored.
For cocoa and coconut, the biomass estimated for mature stands was also tised.Assessing biomass for these crops was more problematic, especially for cocoa, asthe area of this crop both increased and decreased over the period. Furthermore,there were few a\'ailable data on biomass. For cocoa, the biomass at .seven years wascalculated from the data of Thong and Ng (1980) and doubled for stands atclearance. For coconut, a value of 80 tonnes ha"' was adopted. Due to theseassumptions the calculated changes in biomass for these two crops are indicativeonly. However, the overall results are little affected as the estimated maximumcontribution to changes in the total biomass of tree crops and forest was less than4.6% for cocoa and less than 2.7% for coconut.
Estimates of Malaysian forest biomass have been made in several ptiblications.In this study the changes in mean biomass density were calctilated by extrapolatingthe long-term trend in biomass carbon density presented by Richards and Flint(1994). Their value for 1980 of 239 tonnes ha'̂ is very close to the mean densityestimated for the same year for Malaysian logged forest by Hall and Uhlig (1991).Similar estimates of 223 tonnes ha' and 250 tonnes ha' were deduced for PeninsularMalaysia by Brown etal.{\99\,\ 993). Effects of the reduction of density over timeusing the Richard and Flint (1994) trend were compared with both the use of aslower rate of density decline and with the effect of assuming a constant density.
.Although the soil can contain as much or even more carbon than the vegetation(Chan 1982, Brown elal, 1993), changes in the soil and soil surface organic carbonwere not assessed as insufficient local data were available to determine the long- termimpacts of landuse change on these components. • . . .
Allowance for harvested biomass
Loss of standing biomass may be offset by long-term carbon storage, either asharvested material or carboti sequestered in soil organic matter. The main productsof relevance here are harvested logs from forests and rubber plantations. Thebiomass conserved in the form of rubber-wood logs was estimated as 56% of thebiomass at clearance (24-30 years after planting) (Yew 2000). Biomass conservedas forest logs was calculated from the log production volume data (MPI 2001 andearlier) assumingaspecificdensity of 0.57 (Chan 1982). Otber forms of harvested
282 Journal of Tropical Forest Sdence \7{2y. 279-296 (2005)
biomass, such as oil palm fruit bunches, are likely to have only a limited lifetimeand were not included in the analysis.
Calculation of carbon sequestration and emission
The balance between carbon gains and losses (given in Mt year') was calculatedassuming a mean carbon content of biomass of 45% (Chan 1982, Yew 2000).
Results
Area and biomass changes
Peninsular Malaysia
Changes in the areas of oil palm, other tree crops and forest are shown in Figure 1.Wbile the area occupied by oil palm increased considerably over the 20-year period,other tree areas, with the exception of cocoa, showed consistent reductions.However, the area of cocoa also declined in the later years.
The increase in oil palm area was initially greater than the recorded declines inareas of other tree crops and forest, implying that other categories of land musthave been utilised. However, from 1996 onward the increased oil palm area balancedthat released due to clearance of forest and other tree crops.
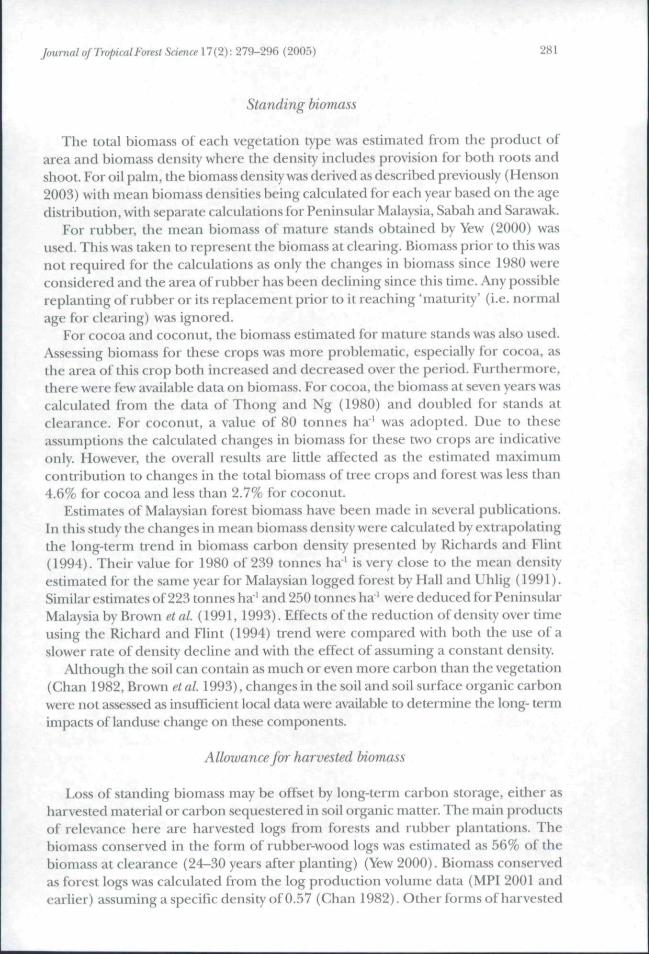
The biomass changes are shown in Figure 2, from which it is apparent tbatthere has been an overall loss of biomass even after allowing for stable productbiomass (forest logs and rubber wood), as losses, mainly in forest biomass,outweighed gains due to oil palm. Biomass loss was slow dtiring the first decadebut accelerated in the second decade with the decline in forest biomass densitycontributing substantially to the overall loss.
Sabah
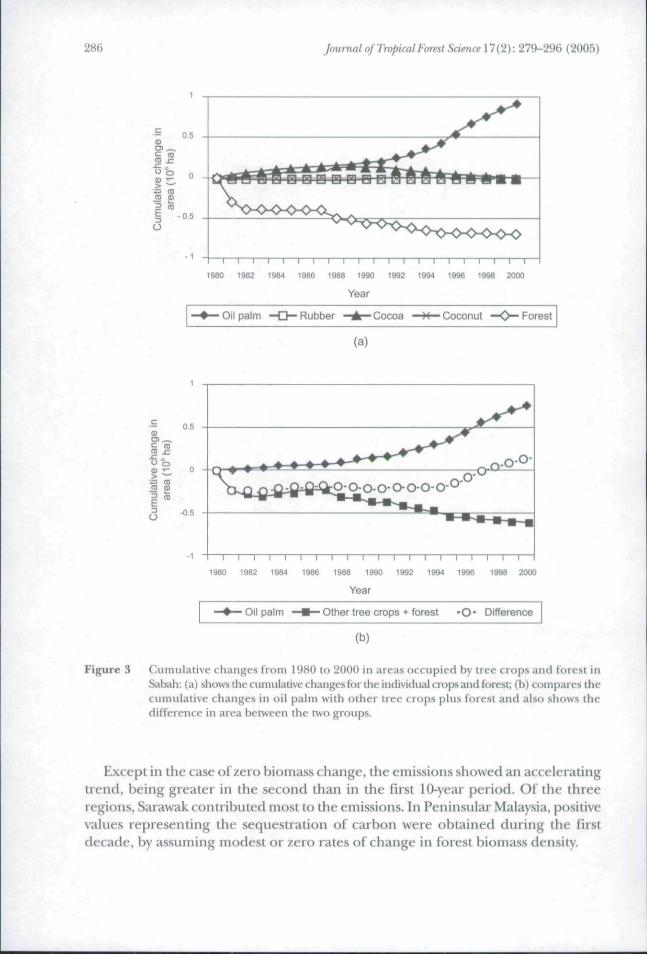
The changes in the areas of oil palm, other tree crops and forest aie shown inFigure 3. A different pattern is e\'ident from that of Peninsular Malaysia. None ofthe tree crops show any substantial reduction in area over tbe period while cocoashowed appreciable gains in the late ' 198O's. Only forest showed a substantial declineand most of this was accounted for by the high starting value in 1980. (The declinewould have been even greater had the MPI area for 1980 been used instead oftheFAO estimate; see Discussion.) There was also a steady decline in area of forestfrom 1987 to 1995.
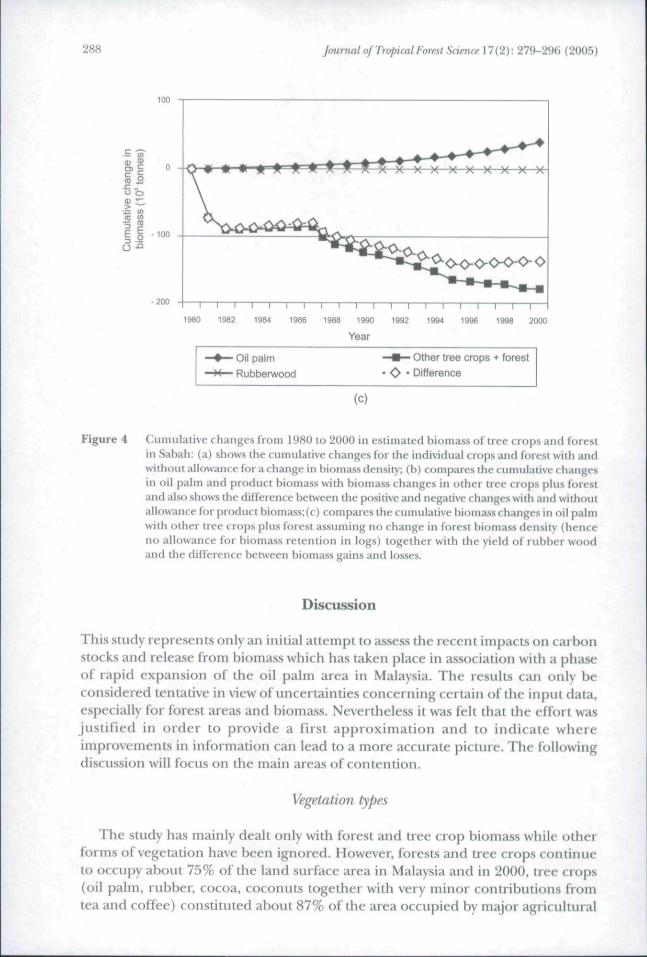
In Figure 3(b) it can be seen that initially, there was no shortage of land availablefor oil palm as a consequence of the large initial decline in forest area, despiteincreases in the other uee crops. However, from 1998 onwards there was an apparentshortage as indicated by the positive 'difference' values. Assuming the area data tobe correct, oil palm would have had to be planted on other land such as landreleased by forest clearance in earlier years but not utilised for tree crops. Thebiomass changes are shown in Figure 4. In Sabah, the changes in forest biomass
Journal of Tropical Forest Sdence 17{2): 279-296 (2005) 28S
Oil palm Other tree crops + forest • O* Difference
(b)
Figure 1 Cumulative changes from 1980 to 2000 in the areas occupied by tree crops and forestin Peninsular Malaysia: (a) shows the cumulative changes for the hidividual crops andfore.st; (b) compares the changes in oil palm with other tree crops plus forest and alsoshows the cumulative difference in area between the two groups.
were the dominant feature with other tree crops contributing much less. The patternof biomass loss is largely governed by the area changes so the initial rapid fall isheavily dependant on the initial starting value.
284 Journal of Tropical Fortsl Sdence \7 {2): 279-296 (2005)
Sarawak
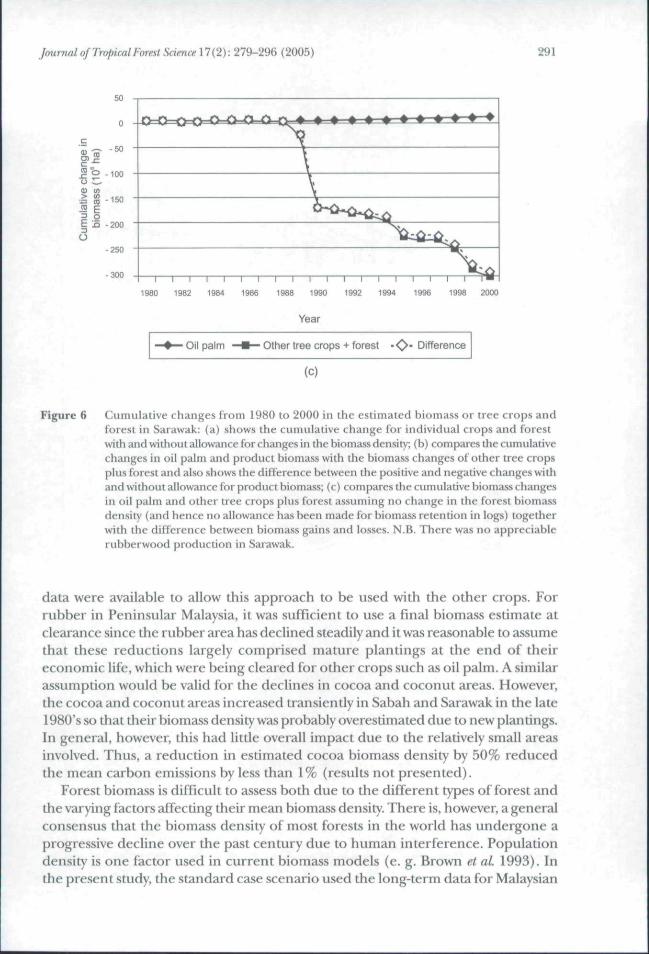
The changes in the areas of oil palm, otber tree crops and forest are shown inFigure 5. As for Sabah, but unlike Peninsular Malaysia, none of the tree cropsshowed any substantial reductions in area over the period while the small cocoaarea increased in the late 198O's prior to a fall. Forest showed an abrupt declinebetween 1989 and 1990. However, it is probable that this sudden 'decline' was aresult ofthe preceding area data being overestimates. Nevertheless, the long-term(20 years) trend indicated a substantial decline that has yet to be filled by plantingtree crops.
- D ^ Product biomassO • Difference excluding product biomass• - Difference including product biomass
(b)
Journal of Tropical Forest Sdence 17 {2): 279-296 (2005) 285
200
100
- 100
-200
-300 r I 1 I r I—I—I—1—I—I—I—I—I—I—I—1—I—I—I1980 1982 1984 1986 1988 1990 1992 1994 1996 1998 2000
Year
' Oil palmRubberwood
• Other tree crops + forest• O • Difference
(C)
Figure 2 Cumulative changes from 1980 to 2000 in estimated hiomass of tree crops and forest inPeninsular Malaysia: (a) shows the cumulative changes for individual crops and forestwith and without allowance for a change in biomass density; (b) compai es the cunuilativechanges in oil palm and product biomass with the cumulative biomass changes of otiiertree crops plus forest and also shows tlie difference between the positive luid negative changeswith and without allowance for the product biomass; (c) compares the cumulative biomasschanges in oil palm and other tree ciops plus forest assuming no change in forestbiomass density (and hence no allowance made for biomass retention in logs) togetherwith the yield of rubberwood and the difference between cumulative biomass gains andlosses.
The biomass changes in Sarawak are sbown in Figure 6. As with Sabah, thebiomass changes in Sarawak were dominated by forest and showed the effect ofthe abrupt change in area in 1990 referred to above. However, there was no suchabrupt change in the curve for log production (Figure 6b).
Total biomass changes and carbon release
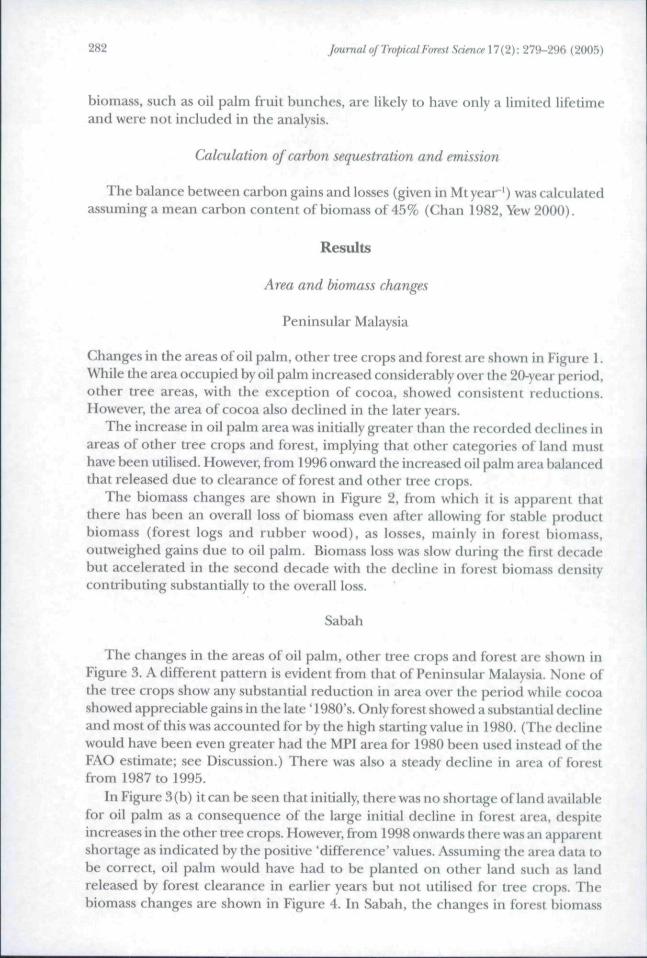
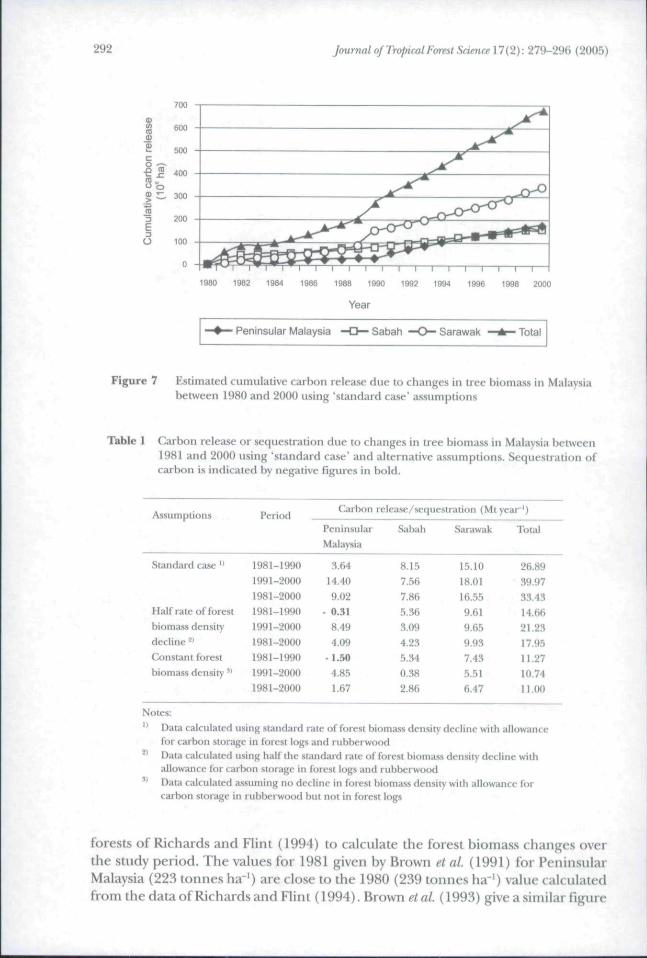
Figure 7 shows the total loss of biomass carbon over the two decades arisingfrom changes in tree biomass (tree crops plus forest). These data were calcttlatedwith allowance for changes in both the forest biomass density, as described above,and the carbon storage in product biomass (the 'standard case'). Calculations werealso performed assuming either a reduced rate of change or no change in forestbiomass density and for Sabah, the effect of using differing starting values of forestarea was also assessed. The results are summarised in Tables i and 2.
Using the 'standard case' assumptions, a mean carbon emission of 33.4 Mt year'was calculated for Malaysia as a whole between 1981 and 2000. This figure is,however, highly dependent on the assumed rate of forest biomass density reductionand, in the absence of any change in the biomass density, the emissions are reducedto about a third of this value.
286 Journal of Tropical FoTtst Sdence \7 (2): 279-296 (2005)
'Oil palm Other tree crops + forest - O - Difference
(b)
Figure 3 Cumulative changes from 1980 to 2000 in areas occupied hy tree crops and forest inSabah: (a) sliows tlie cumulativechangesfor the individual crops and forest; (h) compares thecumulative changes in oil pahii with other tree crops plus forest and also shows thedifference in area between the two groups.
Except in the case of zero biomass change, the emissions showed an acceleratingtrend, being greater in the second than in the first 10-year period. Of the threeregions, Sarawak contributed most to the emissions. In Peninsular Malaysia, positivevalues representing the sequestration of carbon were obtained during the firstdecade, by assuming modest or zero rates of change in forest biomass density.
Journal of Tropical Forest Sdence 17(2): 279-296 (2005) 287
Effect of oil palm planting on carbon release
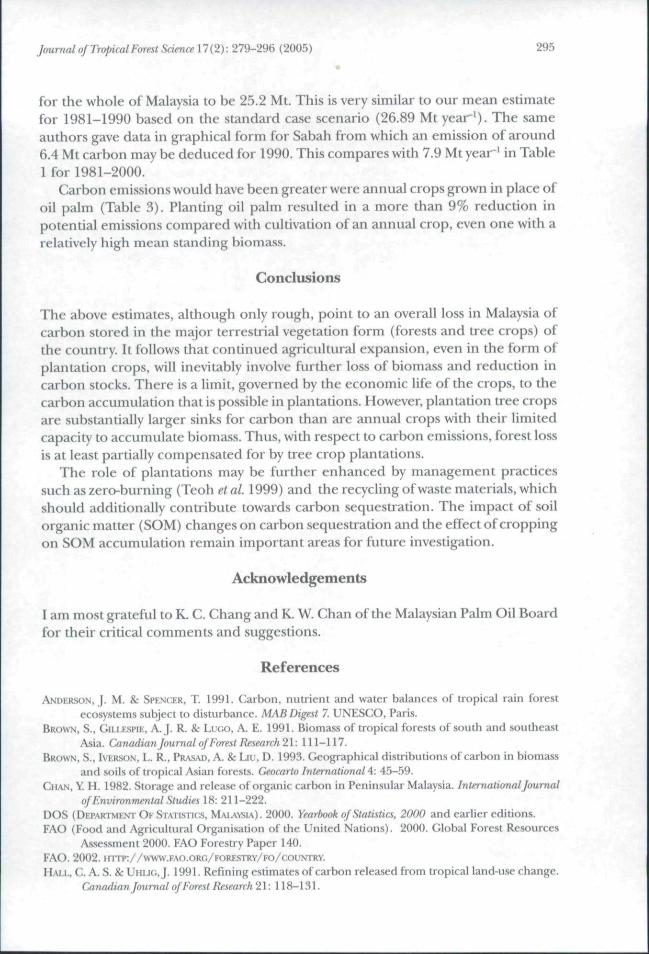
To assess the impact on carbon release of replacing forest with oil palm asopposed to no replacement crop, carbon stocks in oil palm were discounted whencalculating total emissions in the latter case. The effect was also examined ofreplacing oil palm with a relatively low biomass annual crop. The results ofthe firstexercise, given in Table 3, show an overall reduction due to oil palm in averageannual carbon emissions of almost 10% over the 20-year period. By contrast,substitution of oil palm by an annual crop, with an assumed mean standing biomassof 10 tonnes ha', resvilted in an overall reduction in total carbon emissions oflessthan 1%.
• Oil palm- • — Other tree crops + forest- C ^ Product biomass
O * Difference excluding product biomass• • • Difference including product biomass
(b)
Journal of Tropical Forest Sdence 17 (2): 279-296 (2005)
100
-200
1980 1982 2000
Oil palm
Rubberwood
Other tree crops + forest• Difference
(c)
Figure 4 Cumulative changes from 1980 to 2000 iti estimated hiomass of tree crops and forestin Sahah: (a) shows the ctimulative changes for the individual crops and forest with andwithout allowance for a change in hiomass density; (h) compares the cumulative changesin oil palm and product hiomass with biomass changes in other tree crops plus forestand also shows the difference hetween the positive and negative changes with and withoutallowance for product biomass; (c) compares the cumulative biomass changes in oil palmwith other tree crops plus forest assuming no change in forest hiomass density (henceno allowance for hiomass retention in logs) together with the yield of rubber woodand the difference between biomass gains and losses.
Discussion
This study represents only an initial attempt to assess the recent impacts on carbonstocks and release from biomass which has taken place in association with a phaseof rapid expansion of the oil palm area in Malaysia. The results can only beconsidered tentative in view of uncertainties concerning certain of the input data,especially for forest areas and biomass. Nevertheless it was felt that the effort wasjustified in order to provide a first approximation and to indicate whereimprovements in information can lead to a more accurate picture. The followingdiscussion will focus on tlie main areas of contention.
Vegetation types
The study has mainly dealt only with forest and tree crop biomass while otherfortiis of vegetation have been ignored. However, forests and tree crops continueto occupy about 75% ofthe land surface area in Malaysia and in 2000, tree crops(oil palm, rubber, cocoa, coconuts together with very minor contributions fromtea and coffee) constituted about 87% ofthe area occupied by major agricultural
Journal of Tropical Forvst Sdence \7 (2): 279-296 (2005) 289
• Oii palm ' Other tree crops + forest • O • Difference
(b)
Figure 5 Cumulative changes from 1980 to 2000 in the areas occupied by tree crops and forest inSarawak: (a) shows the cumulative changes for the individual crops and forest; (b)compares the cumulative changes in oil palm area with the area of other tree cropsplus forest and also shows the difference in area hetween the two groups.
crops; the only other crop of significance being rice. In terms of biomass, forestsand tree crops would be even more dominant, given their high biomass densitiesin comparison with values likely for non-arborescent vegetation.
Area data
There is inevitably some uncertainty in tbe area estimates used for thecalculations. This was particularly so for forest in East Malaysia with even the localofficial sources differing in the data presented. It is likely that this situation couldbe remedied in future by the use of satellite images but there will still be doubtconcerning the historical trends.
290 Journal of Tropical Forest Sdma>\7{2)\ 279-296 (2005)
Biomass
Assumptions were necessary with regard to biomass densities. Oil palm biomassdensity was calculated using a detailed model as described by Henson (2003), whichtook account of the changes in the oil palm age profile. However, insufficient
Other tree crops + forestProduct biomassDifference excluding product biomassDifference including product biomass
(b)
Journal of Tropical Forest Sdence 17 {2): 279-296 (2005) 291
<1> tfl> m
d
0 -
50 -
100 -
150 "
200
250 -
300 -
-C3=C
1
1980
i=Q=C
1 1
1982
•—Oil
1984
palm
—r\b-o.
1 1 1 1 1 ]
1986 1988 1990
Year
U Other tree crops
1 1 1 1
1992 1994
+ forest •o
• • • • •
1 1 1 1 1 "
1996 1998 2000
• Difference
(c)
Figure 6 Cumulative changes from 1980 to 2000 in the estimated biomass or tree crops andforest in Sarawak: (a) shows the cumulative change for individual crops and forestwith and without allo\vance for changes in the biomass densit)'; (b) compares the cumulativechanges in oil palm aud product biomass with the biomass changes of other tree cropsplus forest and also shows the difference hetween the positive and negative changes withand without allowance for product biomass; (c) compares the cumulative hiomass changesin oil palm and other tree crops plus forest assuming no change in the forest hiomassdensity {and hence no allowance has been made for biomass retendon in logs) togetherwith the difference between biomass gains and losses. N.B. There was no appreciablerubberwood production in Sarawak.
data were available to allow this approach to be used with the other crops. Forrubber in Peninsular Malaysia, it was sufficient to use a final biomass estimate atclearance since tbe rubber area has declined steadily and it was reasonable to assumethat these reductions largely comprised mature plantings at tbe end of theireconomic life, which were being cleared for other crops such as oil palm. A similarassumption would be valid for the declines in cocoa and coconut areas. However,the cocoa and coconut areas increased transiently in Sabah and Sarawak in the late198O's so that their biomass density was probably overestimated due to new plantings.In general, however, this had little overall impact due to the relatively small areasinvolved. Thus, a reduction in estimated cocoa biomass density by 50% reducedthe mean carbon emissions by less than 1% (results not presented).
Forest biomass is difficult to assess both due to the different types of forest andthe varying factors affecting their mean biomass density. There is, however, a generalconsensus that the biomass density of most forests in the world has undergone aprogressive decline over the past century due to human interference. Populationdensity is one factor used in current biomass models (e. g. Brown et aL 1993). Inthe present study, the standard case scenario used the long-term data for Malaysian
292 Journal of Tropical Forest Sdmcel7{2): 279-296 (2005)
Figure 7 Estimated cumulative carbon release due to changes in tree biomass in Malaysiabetween 1980 and '2000 using 'standard case' assumptions
Table 1 C^arbon release or sequestration due to changes in tree biomass in Malaysia between1981 and 2000 using 'standard case' and alternative assumptions. Sequestration ofcarbon is indicated hy negative figures in bold.
Assumptions
Standard case "
Half rate of forestbiomass densitydecline '-*Constant forestbiomass density '*
Notes:" Data calculated using standard rate of forest biomass density decline with allowance
for carbon stori^e in forest logs and rubberwood*' Data calculated using half the standard rate of forest biomass density decline with
allowance for carbon storage in forest logs and rubberwood" Data calculated assuming no decline in foresi biomass density with allowance for
carbon storage in rubberwood bui noi in forest logs
forests of Richards and Flint (1994) to calculate the forest biomass changes overthe study period. The values for 1981 given by Brown et al (1991) foi- PeninsularMalaysia (223 tonnes ha*') ate close to the 1980 (239 tonnes ha"') value calculatedfrom the data of Richards and Flint (1994). Brown et al. (1993) give a similar figure
Jmtmal of Tropical Forest Sdence \7 {2): 279-296 (2005) 293
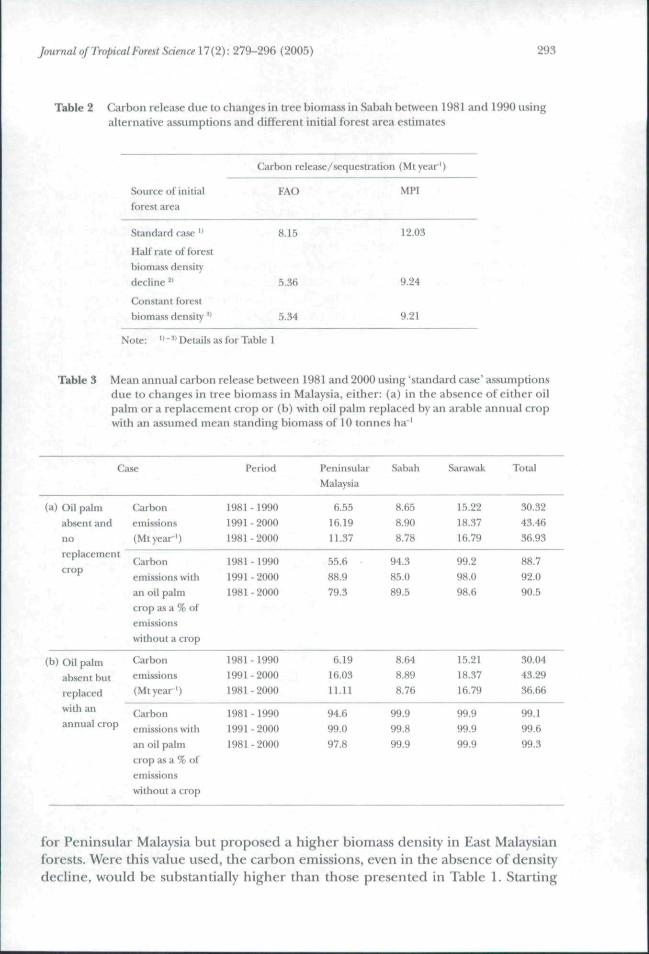
Table 2 Carbon release due to changes in tree biomass in Sabah between 1981 and 1990 usingalternative assumptions and different initial forest area estimates
Carbon release/sequestration (Mtyear')
Source of initialforest area
FAO MPI
Standard case "
Half rate of forestbiomass densitydecline '̂
Constant forestbiomass density *'
8.15
5.36
5.34
12.03
9.24
9.21
Note; " -'' Details as for Table 1
Table 3 Mean annual carbon release between 1981 and 2000 using 'standard case' assumptionsdue to changes in tree biomass in Malaysia, either: (a) in the absence of either oilpalm or a replacement crop or (b) with oil palm replaced hy an arable annual cropwith an assumed mean standing biomass of 10 tonnes ha""'
Case
(a) Oil palmabsent andno
replacement
crop
(b) Oil palmabsent butreplaced
with an
annual crop
Carbonemissions(Mt year')
Carbonemissions withan oil palmcrop as a % ofemissionswithout a crop
Carbonemissions(Mtyear-')
Carbonemissions withan oil palmcrop as a % ofemissionswithout a crop
Period
1981 -19901991-20001981-2000
1981 -19901991-20001981 - 2000
1981 -19901991 - 20001981 - 2000
1981 -19901991-20001981-2000
PeninsularMalaysia
6.5516.1911.37
55.688.979.3
6.1916.0311.11
94.699.097.8
Sabah
8,658.908.78
94.385.089.5
8.648.898.76
99.999.899.9
Sarawak
15.2218.3716.79
99.298.098.6
15.2118.3716.79
99.999.999.9
Total
30.3243.4636.93
88.792.090.5
30.0443.2936.66
99.199.699.3
for Peninsular Malaysia but proposed a higher biomass density in East Malaysianforests. Were this value used, the carbon emissions, even in the absence of densitydecline, would be substantially higher than those presented in Table 1. Starting
294 Journal of Tropical Forest Sdence 17 {2)-.279-296 (2005)
forest biomass density is, therefore, an important parameter influencing theemission estimates.
Carbon retention in biomass products
Logging is the likely main cause of biomass degradation in Malaysian forests. Itcan be argued, however, that timber products constitute a form of carbon retention.Recorded log production was, therefore, used to offset forest biomass losses, as waspotential carbon storage in rubberwood.
The proportion of usable timber that is 'exported' from the forest and effectivelyconserved from immediate decomposition {i.e. incorporated into semi-permanentfeatures such as furniture or buildings) is difficult to estimate with any degree ofprecision. Much timber is nowadays used in chipboard or paper manufacture, whichis less durable than cured unprocessed timber The amount of rubberwood assumedprobably represents an upper limit, and official data on rubberwood production(MPI 2001) falls much below the present estimates.
Carbon emission
To place the current emission estimates in perspective, the present data arecompared in Table 4 with other estimates of carbon loss from tropical ecosystemsin Malaysia and the Southeast Asian and south Asian regions.
Houghton (1991), using the data of Brown etal. (1991), calculated the carbonloss for Peninsular Malaysia between 1971 and 1981 to be 26.8 Mt year'. This isconsiderably larger than the present mean estimate for the period 1981 to 2000 of9.02 Mt year' using the standard case (Table 1). Using data from FAO, Hall andUhlig (1991) estimated the carbon emission in 1990 in response to landuse change
Table 4 Comparisons of estimates of carbon emissions due to vegetational change in differentregions
Region
Peninsular Malaysia
Malaysia
Southeast Asia "
South Asia *'
Period
19721971-1981
1980-2000198019901981-199019801970-1980
Vegetation
All
Forest
Forest/tree cropsForestForestForest/tree cropsAll
All
Carbon emission (range)
Mt year'
20-5026.8
1.7-9.06.4 - 9.916.1-25.211.3-26.9150 - 430562
Reference
Chan (1982)Houghton (1991)
This paperHall and Uhlig (1991)
This paperPalm rtfl/. (1986)Richards andHint(1994)
Notes: " Includes Indonesia. The Philippines. Malaysia, Thailand, Cambodia, Laos, Burma, Vietnam." Includes the above plus India. Bangladesh, Sri Lanka.
Journal of Tropical Forest Sdence 17(2): 279-296 (2005) 295
for the whole of Malaysia to be 25.2 Mt. This is very similar to our mean estimatefor 1981-1990 based on the standard case scenario (26.89 Mt year'). The sameauthors gave data in graphical form for Sabah from which an emission of around6.4 Mt carbon may be deduced for 1990. This compares with 7.9 Mt year' in Table1 for 1981-2000.
Carbon emissions would have been greater were annual crops grown in place ofoil palm (Table 3). Planting oil palm resulted in a more than 9% reduction inpotential emissions compared with cultivation of an annual crop, even one with arelatively high mean standing biomass.
Conclusions
The above estimates, although only rough, point to an overall loss in Malaysia ofcarbon stored in the major terrestrial vegetation form (forests and tree crops) ofthe country. It follows that continued agricultural expansion, even in the form ofplantation crops, will inevitably involve further loss of biomass and reduction incarbon stocks. There is a limit, governed by tbe economic life of the crops, to thecarbon accumulation that is possible in plantations. However, plantation tree cropsare substantially larger sinks for carbon than are annual crops with their limitedcapacity to accumulate biomass. Thus, with respect to carbon emissions, forest lossis at least partially compensated for by tree crop plantations.
The role of plantations may be further enhanced by management practicessuch as zero-burning (Teoh et al. 1999) and the recycling of waste materials, whichshould additionally contribute towards carbon sequestration. The impact of soilorganic matter (SOM) changes on carbon sequestration and the effect of croppingon SOM accumulation remain important areas for future investigation.
Acknowledgements
I am most grateful to K. C. Chang and K. W. Chan ofthe Malaysian Palm Oil Boardfor their critical comments and suggestions.
References
ANDERSON, J. M. 8c SPENCER, T. 1991. Carbon, nutiient and water halances of tropical rain forestecosystems subject to disturbance. MAB Digest 7. UNESCO, Paris.
BROWN, S., GILLESPIE, A. J. R. & LUGO, A. E. 1991. Biomass of tropical forests of south and southeast
Asia. Canadian Journal of Forest Research 21 :111-117 .
BROWN, S., IVERSON, L. R., PRASAD, A. & LIL:. D . 1993. Geographical distributions of carbon in biomass
and soils of ti opical Asian forests. Geocarto International 4: 45-59.CHAN, Y. H . 1982. Storage and release of organic carbon in Peninsular Malaysia. International Journal
of Environmental Studies 18: 211-222.DOS (DEPARTMENI O F STAn.'>rK:s, MALA\SIA). 2000. Yearbook of Statistics, 2000 and earlier editions.FAO (Food and Agricultural Organisation ofthe United Nations). 2000. Global Forest Resources
Assessment 2000. FAO Fore.stry Paper 140.FAO. 2002. HTTP://www.F.AO.ORG/FORESTRY/FO/COUNTRY.
HALL, C. A. S. Sc UHIJG.J. 1991. Refining estimates of carbon released from tropical land-use change.Canadian Journal of Forest Research 2 1 : 1 1 8 - 1 3 1 .
296 Journal of Tropical Forest Sdence 17(2): 279-296 (2005)
HENSON, I. E. 2003. Tbe Malaysian national average oil palm: concept and evaluation. Oil Palm Bulletin46: 15-27.
HoucHTON, R. A. 1991. Releases of carbon to the atmospbere from degradation of forests in tropicalAsia. Canadian Journal of Forest Research 21: 132-142.
MALAVSL\N COCOA BO.\RD. 2002. bttp://www.koko.gov.my/Industry/Statistics.MPI (MINISTRYOF PRIMARY INDUSTRIES MuAvstA). 2001. .S'iaiufici 071 O)mmo(/i7(>,v. 15tb and earlier editions.MPOU (MALAKIAN PAI.M OIL BOARD). 2001. Malaysian Oil Palm Statistics 2000. 20tb ediuon.MOLOFSKY, J., HAU., C . A. S. & MYERS, N . 1986. A Comparison of Tropical Forest Surveys. United States
Department of Energy, Virginia.OKUDA, T , MANOKARAN, N . . MATSUMOTO, Y., NriY.-̂ MA, K., THOMAS. S. C. & ASHTQN, P. S. 2003. Pasoh.
Ecology of a lowland Rain Forest in Southeast A.na. Springer-Verlag, Tokyo.PALM, C. A., HOUGHTON, R. A., MEUU.O, J. M. & SKOLE, D, L. 1986. Atniospberic carbon dioxide from
deforestation in Southeast Asia. Biotropica 18: 177-188.RICHARDS, J. F. & FLINT, E. P. 1994. Historic Land Use and Carbon Estimates for South and .Southeast Asia
1880-1980. R. C. Daniels (Ed). Carbon Dioxide Information Analysis Center, Oak RidgeNational l^aboratory, Tennessee.
TEOH, C. H. , MOHD. HASHIM, T., R̂ n.-yiuDZAMAN, A. & MOHD. ALI, A. 1999. Tlie zero burn tecbnique ofoil palm cultivation. Chapter 8. Pp. 137-142 in Gurmit Singh, Lini, K. H., Teo, L. & Lee. K. D.(Eds.) Oil Palm and the Environment. A Malaysian Perspective. Malaysian Oil Palm Growers'Council, Kuala Lumpur.
THONG, K. C. & NG, W. L. 1980. Growth and nulrient composition of monocrop cocoa plants oninland Malaysian soils. Pp. 262-286 in Proceedings of the International C/mference on Cocoa andCoconuts 1978. Incorporated Society of Planters, Kuala Lumpur.
TINKER, P. B., INGRAM.J. S.I 8C STRLWE, S. 1996. Effects of slash-and-burn agriculture and deforestationon climate cbange. Agriculture, Ecosystems and Environment, 58: 13-22.
, F. K. 2000. Impact of zero burning on biomass and nutrient turnover in rtibber replanting.Paper presented at International Symposium on Sustainable Land Management. SriKembangan, Kuala Lumpur.