51
QUADRENNIAL TECHNOLOGY REVIEW AN ASSESSMENT OF ENERGY TECHNOLOGIES AND RESEARCH OPPORTUNITIES Chapter 7: Advancing Systems and Technologies to Produce Cleaner Fuels September 2015

QUADRENNIAL TECHNOLOGY REVIEWAN ASSESSMENT OF ENERGY TECHNOLOGIES AND RESEARCH OPPORTUNITIES
Chapter 7 Advancing Systems and Technologies to Produce Cleaner FuelsSeptember 2015
Quadrennial Technology Review
7 Advancing Systems and Technologies to Produce Cleaner Fuels
Issues and RDDampD Opportunities
Fossil fuels account for 82 of total US primary energy use Each fuel has strengths and weaknesses in relation to energy security economic
competitiveness and environmental responsibility identified in Chapter 1 Low-cost fuels can contribute to economic prosperity Oil and gas can be low
cost but can also have volatile prices bioenergy technology costs have declined significantly but further improvements are needed and hydrogen costs vary significantly with the source energy used to create the hydrogen with further reductions needed
Energy security requires stable abundant domestic resources Oil and gas have large resource bases for domestic production Bioenergy has intermediate levels of potential supplies Fossil energy and bioenergy sources have land use constraints and controversies unique to each Hydrogen can be produced from any energy resourcemdashfossil nuclear renewablemdashso it can be domestically produced
Meeting environmental goals requires reduction of greenhouse gas emissions and other externalities Oil and gas have a poor carbon footprint and other environmental issues that require attention to carbon capture utilization (where possible) and storage (CCS) as described in Chapter 4 Bioenergy can have a good carbon footprint and when combined with CCS can provide a net reduction of atmospheric carbon dioxide levels Hydrogen can be carbon neutral or not depending on the source of the energy to produce it and whether CCS is used
The economy will rely on a broad mix of fuels balanced across their various strengths and shortcomings during the transition from a high-carbon to a low-carbon economy
Research development demonstration and deployment (RDDampD) can help address the shortcomings of these fuels while increasing economic competitiveness and energy independence
7 Advancing Systems and Technologies to Produce
Cleaner Fuels
71 Introduction
Fuels play a critical role throughout our economy In 2013 fuels directly supplied about 99 of the energy needed by our national transportation system 66 of that needed to generate our electricity 68 of that needed by our industry and 27 of that needed by our buildings1
For the purposes of this Quadrennial Technology Review (QTR) a ldquofuelrdquo is defined as a carrier of chemical energy that can be released via reaction to produce work heat or other energy services Fuel resources include oil coal natural gas and biomass The diversity of liquid and gaseous fuel use in the transportation sector is depicted in Figure 71 The source and mix of fuels used across these sectors is changing particularly the rapid increase in natural gas production from unconventional resources for electricity generation and the rapid increase in domestic production of shale oil Nuclear fuel and other energy resources such as geothermal hydropower solar and wind energy are treated separately in Chapter 4
Figure 71 Sankey Diagram of Transportation Fuel Use
Credit Lawrence Livermore National Laboratory
7
Quadrennial Technology Review228
7 Advancing Systems and Technologies to Produce Cleaner Fuels
Fossil fuels account for 82 of total US primary energy use because they are abundant have a relatively low cost of production and have a high energy densitymdashenabling easy transport and storage The infrastructure built over decades to supply fossil fuels is the worldrsquos largest enterprise with the largest market capitalization
While fuels are essential for the United States and the global economy they also pose challenges Security Fuels should be available to the nation in a reliable continuous way that supports national
security and economic needs Disruption of international fuel supply lines is a serious geopolitical risk Economy Fuels and the services they provide should be delivered to users and the markets at
competitive prices that encourage economic growth High fuel prices andor price volatility can impede this progress
Environment Fuels should be supplied and used in ways that have minimal environmental impacts on local national and global ecosystems and that enable their sustainability Waste streams from fossil fuel production such as produced water and from fossil fuel use such as carbon dioxide (CO2) emissions are causing serious problems in many locations across the globe Biofuels can raise potential land-use conflicts
Each fuel type has advantages and disadvantages with respect to our nationrsquos security economy and environment Since these needs are vital to the national interest it is essential to improve fuels in all three dimensions and maintain a robust set of options for rapidly changing conditions
In the long term to reduce US greenhouse gas (GHG) emissions significant deployment of carbon capture utilization and storage (CCS) coalbiomass to liquids (CBTL) andor bioenergy with carbon capture and storage (BECCS) will be needed to enable fossil fuels to continue to be robust contributors to our nationrsquos energy needs (CCS technology and economics is addressed in Chapter 4) Renewable fuels show promise but biofuels face land constraints and hydrogen production from renewables is currently expensive significant research development demonstration and deployment (RDDampD) remains to solve the challenges associated with scale and cost for these fuels
In the near to mid term multiple technological pathways need to be explored to serve as bridges to a low-carbon future Particular focus should be given to interim technologies that help alleviate GHG challenges while minimizing embedded infrastructure changes that would inhibit the transition to sustainable solutions Fuel sources such as natural gas and first generation biofuels if utilized properly could help enable this transition
Each type of fuel has an associated system to produce the resource upgrade and transport it to a facility for cleanup andor conversion into its final form for distribution to the end user Although many of these steps are unique for each particular fuel some do interconnect particularly as they enter distribution systems Here three major fuel systems and a few alternatives will be discussed Because the primary focus of this QTR is on RDDampD opportunities processes for mature fuel systems for which there is no longer a federal role are not considered further here
This chapter focuses on oil and gas and biomass production and conversion hydrogen production and a few alternatives such as CBTL with CCS with a particular emphasis on fuels for transportation (eg automobiles trucks off-road vehicles aircraft ships) The transportation sector represents one-third of global energy use one-third of global emissions and nearly 90 of oil use Because the fuels are carried on board the challenges for weight energy density and storage are particularly difficult for fuels to meet Transportation fuelsmdashoilmdashalso represent significant challenges with regard to domestic energy security balance of trade and environmental controls
The United States currently consumes about 290 billion gallons per year of fuels petrochemical products and other commodities manufactured primarily from crude oil Most of these fuels and products are used for transportation or for heavy equipment in the industrial sector Table 71 shows the current composition of this market and anticipated future changes as projected by the US Energy Information Administration (EIA)
229
7
The United States has large reserves of oil gas and coal with reserves of each among the top ten largest in the world Recent technology developments have led to improved abilities to extract these fossil resources particularly from unconventional sources significantly impacting fuel prices in the United States Increased domestic oil and gas production has brought the United States into production parity with Saudi Arabia which has important security implications However generally increasing global demand is expected to exert upward pressure on market prices over time
While fossil fuels have advantages from an economic and security perspective their emissions of greenhouse gases chiefly CO2 and methane (CH4) are the primary contributor to global warming Potential impacts on water systems are also a growing concern This has led to increased investment development and commercialization of fuels that would reduce climate water andor other impacts
Table 71 Market Size of US Liquid Fuels and Products (billion gallonsyear)
2013 2040 projected Growth 2012ndash2040 (percent per year)a
Gasoline 136 108 -08
Diesel 55 64 06
LPGb 38 50 10
Otherc 31 37 07
Jet fuel 22 29 10
Residual fuel oil 5 4 -04
Total 291 295 01
Source US Energy Information Administration 20152
a Growth rate is a compound annual growth rate assuming geometric growthb Includes ethane natural gasoline and refinery olefinsc Includes kerosene petrochemical feedstocks lubricants waxes asphalt and other commodities
Some fuels such as hydrogen and alcohols can be derived from both renewable and fossil resources Hydrocarbon fuels that are compatible with the existing fossil fuel infrastructure can also be synthesized from renewable resources These fuels have great potential as environmentally sound sustainable and domestic resources To achieve economic parity with fossil fuels more research is needed and potential environmental consequences will need to be addressed
This chapter considers three primary fuel pathwaysmdashoil and natural gas biomass and hydrogenmdashtheir associated economic security and environmental concerns and technology and industrial ecosystems For each current technology is reviewed and key RDDampD opportunities are identified that could help resolve their challenges In the oil and gas sector further research related to resource extraction could lower costs for producers as well as reduce some environmental impacts (Chapter 4) Biofuels can benefit from RDDampD across the entire value chain from resources through conversion to a variety of refined products Hydrogen can be produced via a variety of industrially proven technologies from fossil sources such as natural gas but further RDDampD for producing hydrogen from renewables could lower costs and risks Hydrogenrsquos other challenges include storage transmission and distribution infrastructure fuel cell cost and durability as well as economic
Quadrennial Technology Review230
7 Advancing Systems and Technologies to Produce Cleaner Fuels
scale-up across the entire value chain The chapter concludes with a brief survey of additional fuel pathways (CBTL dimethyl ether ammonia etc) each of which has intrinsic technological merit but all of which also face challenges
In addition to security concerns for imported oil and economic concerns over fuel prices and price volatility environmental concerns are important for the entire global fuel enterprise For fossil fuels used in buildings and some industries CCS systems near the point of use may often not be possible This provides motivation for converting fossil resources to low-carbon energy carriers such as electricity or hydrogen at a central location where CCS can be deployed and then using these energy carriers at the distributed locations Concurrently development of carbon-neutral fuels utilizing biomass or renewable energy sources is needed This chapter examines RDDampD opportunities associated with these transitions and their attendant challenges
72 Oil and Gas
Until recently US oil production was in decline Oil imports contributed more than half of domestic oil consumption Natural gas investment was moving toward expensive terminals to import natural gas Today the United States is the worldrsquos largest producer of oil and natural gas It is exporting more refined products and is on the path toward exporting liquefied natural gas (LNG)3 Figure 72 demonstrates historic shale gas production and future production potential
These considerable changes result primarily from technology developments in hydraulic fracturing and horizontal drilling that have allowed industry to produce oil and gas from low-permeability formations including shale and ldquotightrdquo formations often called ldquounconventional resourcesrdquo These advances were generated in part by DOErsquos technological investments in the early 1980s and in part by industryrsquos continued development and application of those technologies4 5 Together with increased work in rock mechanics and the understanding of fracture development and propagation
Figure 72 Shale Resources Remain the Dominant Source of US Natural Gas Production Growth6
Credit US Energy Information Administration
trill
ion
cubi
c fe
et
0
10
20
30
40
50
60
70
80
90
100
0
5
10
15
20
25
30
35
40
1990 1995 2000 2005 2010 2015 2020 2025 2030 2035 2040
Tight gas
Coalbed methane
Other lower 48 onshore
Shale gas and tight oil plays
AlaskaLower 48 offshore
ProjectionsHistory 2013
Figure 73 Expected Gains in Tight Oil Production Drive Projected Growth in Total US Crude Oil Production6
Credit US Energy Information Administration
0
5
10
15
20
1990 2000 2010 2020 2030 2040 2020 2030 2040 2020 2030 2040
US crude oil productionmillion barrels per day
Tight oil
Alaska
Lower 48 offshore
History 2013 2013 2013
US maximum production level of96 million barrels per day in 1970
Other lower 48 onshore
Reference High Oil and Gas Resource
Low Oil Price
231
7
to enhance production these technological advances have driven the rapid increase in production from unconventional resources Figure 73 shows the projected growth from tight oil production
Concurrent with these technological advances has been the drive to reduce the environmental impacts of oil and gas production especially following public concerns about hydraulic fracturing onshore and the BP Deepwater Horizon incident offshore (Figure 74) Government mandates to increase safety and environmental stewardship have advanced safety regulations and practices promoted development of safety cultures and developed accident mitigation technologies Industry has also responded with practices that reduce environmental and safety impacts and risks However ongoing environmental and safety challenges underscore the opportunity for continued RDDampD particularly in those areas where there may be significant public benefit but industry may see no returnmdashimmediate or otherwisemdashon that investment
721 Recent Technology Advancements
In 2011 the National Petroleum Council reported that the resource base for technically recoverable oil and gas was 23 quadrillion cubic feet of natural gas8 and 167 billion barrels of oil9 Advanced technology can help make these resources economically recoverable in an environmentally prudent way
Progress in technology development over the last five to ten years both offshore and onshore has been focused in several distinct areas
Sophisticated data acquisition processing and visualization applied across the sector from exploration to field maintenance and safe final plugging of wells
Water conservation and protection chiefly through treatments enabling water reuse as well as use of brines and non-potable water in oil and gas applications
Materials science especially in cements and metals used for wellbore isolation and integrity
Technologies to increase reservoir recovery factors in particular via stimulation
Figure 74 BP Deepwater Horizon Oil Spill April 20 20107
Credit US Coast Guard
On April 20 2010 the Macondo wellmdashlocated about fifty miles from New Orleans in more than 5000 feet of water with a pay depth of greater than 18000 feet subseamdashblew out costing the lives of eleven men and spilling more than four million barrels of crude oil into the Gulf of Mexico A presidential commission identified the root causes to be associated with zonal isolation during cementing and the failure to create a competent barrier to uncontrolled flow Other risk factors contributing to this disaster were associated with well monitoring equipment on the Deepwater Horizon including data displays and the lack of attentiveness to the risk resulting from deviation from the original designs for well construction
Quadrennial Technology Review232
7 Advancing Systems and Technologies to Produce Cleaner Fuels
Combining increased oil and gas recovery with carbon sequestration in a technique known as CO2 enhanced oil recovery (CO2-EOR)
Oil spill prevention technology for operations in deep and ultra-deep waters Research and development (RampD) for operations in extreme environments especially the Arctic which
contains significant oil and gas resources in environmentally sensitive areas
However the most profound technical developments have been in the field of drilling and completions including horizontal drilling and hydraulic fracturing
Onshore Well Construction Drilling Completion and Stimulation
Technologies are being developed that will result in the need for fewer wells overall with far lesser impact on the surface and subsurface environments Advances include reducing the drilling footprint through the use of drilling pads that allow multiple wells to be drilled from a single pad location10 Pad drilling can also enable rigs to be moved using railed systems More recent technology has led to ldquowalking rigsrdquo that can travel from pad to pad under their own power11 New technologies provide more precise information about the subsurface location of oil and gas zones Of key significance are technologies that allow operators to steer wells more precisely and with greater control12 Advances in the chemical formulations of drilling fluids have reduced their toxicity13
There have also been technological advances in well completion and stimulation Hydraulic fracturing of a single well at various points along the horizontal length in shale formations can dramatically increase initial production from new wells14 Advances in fracturing fluid technology plus technologies to treat flowback and produced water may enable production companies to recycle andor reuse the same water for hydraulic fracturing and other operations depending on technology transportation and economic factors15
Examples below of RDDampD for onshore and offshore completion technologies demonstrate how the above technology development areas have played a role in advancing hydrocarbon recovery and reducing environmental impact at the surface and in the subsurface
Offshore Well Construction and Operations
Drilling challenges in deep and ultra-deep water are different from those onshore because of the lower strength of these geologic formations which can increase the risk of loss of well control Technologies such as dual gradient and managed pressure drilling reduce this challenge allowing for more controlledmdashand safermdashdrilling
Much technology development has focused on oil spill prevention and mitigation The MacondoBP Deepwater Horizon incident focused attention on over-pressured zones and the integrity of the entire well construction system during the drilling process particularly on the components of the system such as casing cement and the seal that must be established between the rock and the well16 Progress has been made in expandable casing17 a technology that helps ensure integrity of the wellbore while allowing the well to maintain a larger diameter for a longer interval This has been accompanied by advances in metallurgy and cement chemistry resulting in downhole tubulars with lower fatigue and failure rates in the case of metallurgy18 and wellbores with enhanced integrity due to advances in cementing technology19
Substantial research has been conducted and is ongoing for foamed cement20 in applications where low density fluids and sealing materials are required and for alternatives to traditional cement Integrity monitoring of downhole tubulars and cement in real time through the placement of downhole temperature and pressure sensors has been introduced in an attempt to identify and mitigate potential failure
233
7
As in the onshore sector advances in logging-while-drilling and measurement-while-drilling21 including measurements at the drill bit allow for greater precision in steering deviated and lateral wells while identifying the potential for unexpected pressure anomalies
Technological advances with regard to metallurgical options and analysis of fatigue and failure in metal components especially with application to drilling risers (which connect the well to the drillship) are ongoing22 Existing metal properties are being examined23 and new alloys are being studied and developed Advances in remote inspection capabilities using remotely operated vehicles and autonomous underwater vehicles are being made24
Blowout preventer design has been reexamined and new technology developed for control systems and sealing and cutting rams In order to promptly contain the spill at or near the wellhead after a blowout or other loss of well control industry has invested significant resources in subsea spill containment capabilities25
Considerable progress has been made in subsea processing technologies allowing processing of produced fluids at the seafloor to be sent from the field to gathering pipeline systems via subsea pumping systems The corrosion caused by saltwater is another challenge unique to offshore production Inspection of Gulf of Mexico facilities especially older ones is important for continuation of safe operations offshore New technologies and analytical algorithms have been developed to allow subsea inspection of offshore facilities to identify failed or at-risk structural components26
Enhanced Oil Recovery (including CO2-EOR and ROZ)
Improved oil recovery (IOR) and EOR are technical strategies used to increase the amount of oil andor gas recovered from a particular deposit In the past these terms have had more precise definitions but now the terms are used more generally to indicate any technical activity that can increase the ultimate recovery from oil and gas reservoirs These technologies generally include the injection of water steam gas chemicals or microbes or other techniques to address some particular barrier in the reservoir that is preventing greater recovery of hydrocarbons Each has its strengths and all have increased costs that affect project economics
The potential application for CO2-EOR has gained interest because of the potential for sequestering CO2 while improving recovery of hydrocarbons In two common approaches CO2 either naturally occurring or captured from industrial or power generation processes (anthropogenic CO2) is injected into oil bearing formations either alternating with water (water-alternating-gas) or as a continuous flood in the reservoir CO2-EOR has a lower carbon footprint compared to other EORIOR technologies such as the use of steam Currently CO2-EOR accounts for about 300000 barrels or almost 4 of US daily production of crude oil27
CO2-EOR is now being used to exploit recently identified residual oil zones (ROZ) ROZs exist in many mature fields and in migration fairways between fields Within fields residual oil can be found below the oilwater contact or in areas that were bypassed in the normal production processes CO2-EOR for producing oil in ROZs began in the 1990s The oil in the ROZ is immobile (ie at irreducible saturation) and cannot be produced by primary or secondary recovery means However it does appear to respond well to CO2-EOR and eight fields within the United States produce oil using this technique It appears possible in some formations to produce oil with a near-zero carbon footprint28 More research would help industry understand the size and extent of ROZs and how to minimize their carbon footprint ROZ resources located predominantly in the Permian Basin have more than 250 billion barrels of oil in place
Quadrennial Technology Review234
7 Advancing Systems and Technologies to Produce Cleaner Fuels
Natural Gas Hydrates
Traditional assessments of gas hydrate resources produce a wide range of very large estimates Scientific drilling experimental studies and numerical simulation consistently indicate that high-concentration deposits in sand-rich sediments are amenable to traditional oil and gas exploration and production approaches29 The latest but very poorly constrained assessment of this portion of the gas hydrate resource pyramid (Figure 75)
is on the order of ~100 trillion cubic feet (Tcf) in Alaska31 and perhaps 1000s to 10000 Tcf in the United States offshore One global assessment reports an estimate of 40000 Tcf in resource grade deposits worldwide32 the equivalent of more than 300 years of global gas consumption today
Gas hydrate research continues to escalate internationally with programs currently underway in the United States Japan Korea India and China These efforts continue to improve the technologies for gas hydrate characterization via remote sensing and field sampling and analysis and mature the
scientific understanding on the nature occurrence and dynamic development of gas hydrate systems The most aggressive program is underway in Japan where extensive past drilling has suggested ~200 Tcf of resource potential and enabled advanced characterization of prospective reservoirs off the nationrsquos southeastern coast
A series of scientific field production experiments conducted in the Arctic by Japan the United States and Canada has led to the identification of depressurization as the most promising base technology for gas production from gas hydrates In 2013 Japan tested this approach for the first time in a deepwater setting with promising results and has announced their plan for RampD Detailed geologic descriptions of actual gas hydrate reservoirs have only recently been matched with advanced numerical simulation capabilities that honor the complex thermodynamics of gas hydrate dissociation
Safety and environmental risks from gas hydrate production are comparable to those in all oil and gas production Well control risks are more limited because of the shallow low-pressure setting of gas hydrate reservoirs Reservoir subsidence and resultant instability in overburden and at the seafloor is a risk that may be most relevant to gas hydrate production particularly in marine applications given the shallow and generally unconsolidated nature of most potential gas hydrate reservoirs
722 Emerging Research Opportunities
Large strides in technology safety and environmental practices have been made yet a set of persistent and emerging challenges remain which points to a set of research opportunities (Table 72) Some opportunities are important to address in the near term in part because of the driving needs of policymakers regulators and
Figure 75 Gas Hydrate Resource Pyramid30
235
7
Table 72 Emerging Issues Around Hydrocarbon Production Near term medium term and long term refer to potential outcomes with substantial impacts within the time frame
Key research opportunities Near term (2ndash5 years)
Medium term (5ndash10 years)
Long term (gt10 years)
Environmentally sustainable drilling and completion technologies and methodologies 33
Unconventional oil and gas environmental challenges
Offshore and Arctic oil spill prevention
Gas hydrates characterization
other public stakeholders Other opportunities are less so but may either dramatically improve environmental performance or dramatically increase resource availability
In recognition of these emerging challenges many groups in industry government and academia have highlighted potential RDDampD efforts including the National Academy of Sciences federal advisory groups such as the National Petroleum Council (NPC) and the Secretary of Energy Advisory Board environmental organizations such as the Environmental Defense Fund Natural Resources Defense Council and World Resources Institute and state governments The oil and gas industry is engaged in significant but often proprietary RDDampD efforts These challenges can be grouped and divided into the four themes discussed below
Environmentally Sound Drilling and Completions
ldquoGolden Rulesrdquo or Best Practices
The International Energy Agency recently published a set of principles or ldquoGolden Rulesrdquo applicable to operations in unconventional oil and gas (UOG)34 These practices include measurement disclosure and engagement with stakeholders prudent choice of drilling locations proper well construction designed to protect the environment from wellbore fluids prudent use of water resources protection of air quality and cognizance of the cumulative impacts of UOG development (Figure 76) The American Petroleum Institute also publishes standards outlining best practices for all significant activities associated with conventional and unconventional oil and gas development36 Analysis and research can help improve understanding of the costs and potential benefits associated with widespread deployment of these practices and how much they could be improved to reduce risk to the environment in terms of methane (CH4) leakage water quality and quantity truck traffic and the subsurface footprint
Figure 76 Emerging Issues of UOG Development35
Quadrennial Technology Review236
7 Advancing Systems and Technologies to Produce Cleaner Fuels
Protection of Natural Waters (Groundwater)
Protection of groundwater encompasses a range of biological chemical and physical systems for both surface (lakes and streams as well as near-shore oceans) and subsurface waters (aquifers) Public concern regarding UOG development is related to potential water quality impacts on ecosystems and human well-being Research opportunities in this area include improved quantitative evaluations of contaminant pathways in water resources that can be used to assess potential human and ecological health effects Research would also help quantify understanding of water quality impacts over the entire cycle of UOG operations (site preparation water acquisition drilling completion and fracturing production wastewater disposal pipeline construction and site closure) and how these impacts may vary over time and space and may be attributed to differences in UOG operations
Energy-Water Crosscutting Research
Understanding the true impacts of water used and produced during UOG operations is a key challenge This is important because a small fraction of the estimated 151000 wastewater injection wells permitted in the United States have documented incidents of felt seismic events resulting from injection activities37 A significant increase in these seismic events has been observed in central Oklahoma that is inconsistent with any natural processes this increase is likely the result of wastewater injection associated with a rapid growth in oil and gas production
RDDampD opportunities include reducing water use in UOG activities such as developing treatment technologies for wastewater reuse or recycle Understanding physical subsurface conditions and mitigation strategies that affect seismic events related to wastewater injection is essential
DOE has established an integrated technology team the Energy Water Technology Team to identify and pursue crosscutting technology data modeling analysis and policy priorities relevant to the issues that crosscut energy production and water availability use treatment and reuse
Efficient and Reduced Use of Water
Water is used in the drilling completion and stimulation (ie hydraulic fracturing) of oil and gas wells Sometimes large volumes of water are produced with the oil and gas Key challenges include understanding the true impacts of water withdrawn from surface and groundwater systems and water produced during the active phase of a UOG operation Produced and flowback wastewaters are important because instead of injection as wastewater38 they can potentially be reused for drilling or in hydraulic fracturing thereby reducing total freshwater withdrawals They may also be treated and returned to the environment potentially reducing demands on the local water budget Water coproduced with oil and natural gas can range from relatively clean to a high brine concentration depending on the geological setting in which it exists Several companies produce water from their oil and gas operations of such a quality that it requires only limited treatment before it can be reused to hydraulically fracture other wells or for other production operations activities Research questions relate to how UOG activities may impact the quantity and availability of water required for hydraulic fracturing possibly contaminate drinking water resources and how new technology can mitigate or otherwise reduce the impact on ground and surface water resources Research challenges and opportunities exist in a number of areas including alternative water sources reducing the volume of water used during hydraulic fracturing technologies and approaches for beneficial treatments of produced water and low-water to waterless hydraulic fracturing techniques
237
7
Waterless Stimulation
Several hydraulic fracturing methods that have been investigated in the past decades use little or no water and some have been adopted into commercial practice According to data contained in the FracFocus database 609 stimulations were performed using compressed gases in the 2011ndash2012 time frame (less than 2ndash3 of the hydraulic fracturing in the United States and 20ndash30 of the hydraulic fracturing performed in Canada) Even though nitrogen- and carbon dioxide-based stimulation methods have been available since the 1970s they still represent a niche share of the market ldquoWaterlessrdquo hydraulic fracturing fluids and techniques include nitrogen-based foam CO2-based foam CO2-sand fracturing straight nitrogen- or straight CO2-based fracturing gelled liquefied petroleum gas (LPG) fracturing and liquefied natural gas (LNG) fracturing Each has its own strengths limitations and costs Continued RDDampD into improving the environmental performance and cost of these techniques could yield major environmental benefits
Subsurface Crosscutting Research
The many oil and gas wells that have been drilled to date have contributed immensely to current understanding of subsurface environments Shared interests for example include wellbore integrity which is important in subsurface extraction of resources energy storage disposition of civilian and defense waste streams and the remediation of sites contaminated from past endeavors Future oil and gas development would benefit from additional knowledge of the subsurface stress state in order to predict and control the growth of hydraulically induced fractures re-opening of faults and address concerns related to induced seismicity Current capabilities to measure or infer the in situ stress directly do not provide a detailed picture of the variations in stress throughout the subsurface To guide and optimize sustainable energy strategies while simultaneously reducing the environmental risk of subsurface injection radically new approaches could help quantify the subsurface stress regime DOE has established an integrated technology teammdashSubsurface Technology and Engineering Researchmdashthat includes the DOE offices involved in subsurface activities that are aligned with energy productionextraction subsurface storage of energy and CO2 subsurface waste disposal and environmental remediation
Other Environmental Challenges for Unconventional Oil and Gas
Induced Seismicity
During 2014 Oklahoma surpassed Alaska and California in the number of annual earthquakes Geophysicists have long known about the potential for human activity to cause seismic activity from petroleum extraction to water reservoir impoundments and fluid injection into the subsurface Changes in fluid volume and pore pressure through fluid injection can induce and in fact have induced seismic events Thus the three stages of the UOG life cycle that could potentially cause such events are 1) the disposal of UOG-produced and flowback wastewaters via deep injection wells 2) long-term extraction of oil and gas and 3) large-stage hydraulic fracturing Current understanding suggests that the potential risk of felt or damaging earthquakes is greatest from wastewater disposal in deep injection wells39 Induced seismicity can also occur during other activities such as enhanced geothermal systems and carbon dioxide development storage and operations There is a need for more data and analysis to relate UOG operations to induced seismic events to connect these events to specific operational parameters and geologic conditions and to develop and assess possible mitigation options for use by technical andor regulatory decision makers in an attempt to minimize seismic risks
Quadrennial Technology Review238
7 Advancing Systems and Technologies to Produce Cleaner Fuels
Truck Traffic and Alternatives
UOG development sometimes occurs near communities previously unfamiliar with oil and gas operations UOG operations involve the transport of equipment fluids and other materials usually by trucks As a result truck traffic increases significantly in communities where increased developmental activities occur The largest contributor to this increased truck traffic is the transportation of fracturing fluids to fields and produced water to disposal sites Associated with increased truck traffic is increased noise dust and air emissions from the trucks Community engagement can be important for mitigating community concerns Research is needed to develop alternative methods of transporting fluids technologies that use less or no water and pollution and noise mitigation technologies
Control of Methane Leaks
CH4 leakage during the production distribution and use of natural gas has the potential to undermine and possibly even reverse the GHG advantage that natural gas has over coal or oil40 This is because CH4 is a potent GHG Methanersquos lifetime in the atmosphere is much shorter than CO2 but CH4 traps more radiation than CO2 The comparative impact of CH4 on climate change is more than twenty times greater than CO2 over a one hundred-year period41 and eighty-six times greater over a twenty-year period42 The US Environmental Protection Agencyrsquos (EPA) national Greenhouse Gas Inventory estimates that in 2012 CH4 contributed roughly 10 of gross GHG emissions (on a CO2-equivalent basis) from US anthropogenic sources nearly one quarter of which were emitted by natural gas systems43 RampD to resolve these emissions sources with unambiguous and reconciled data is needed Beyond that technology is needed to reduce CH4 leaks associated with pipelines and compressors in the midstream infrastructure and to increase the operational efficiency of natural gas infrastructure as a whole Research opportunities include improved pipeline inspection technologies external monitoring technologies and real-time leak detection including sensors ldquoliverdquo pipeline repair technologies improved gas compression and compressor controls and response time to changing demand profiles and gas storage alternatives
Flaring of Associated Natural Gas40
Some tight oil production tends to be gas rich Increased flaring occurs when associated natural gas cannot be economically captured and used (often due to lack of infrastructure) As a result North Dakota has been flaring 30 or more of all the gas produced in the state In comparison the national average for gas flaring is less than 1 of marketed production Flaring of associated gas from oil production is often allowed so that oil production can start subsequent revenues can flow associated taxes and fees can be paid and prospective gas volumes can be estimated Where appropriate gas infrastructuremdashgathering lines processing plants and compressorsmdashcan be planned and eventually built
New technologies that could use and convert into useful products methane that might otherwise be flared remain an important technology challenge and RDDampD opportunity
Reducing Subsurface Footprint
Near- and long-term cumulative environmental impacts of UOG development are dependent largely on the nature and pace of the development process and the geologic and geographic setting where development occurs At present industry is striving to increase the low recovery efficiencies typical of UOG development by employing increasingly intensive activities including more closely spaced wells stacked wells and more
239
7
fracture stages per wellbore Technological solutions that enable a prudent balance of maximum recovery efficiency with minimum development intensity require research These include fit-for-purpose simulation tools novel stimulation technologies (eg energetic stimulation materials) and improved process control systems Such technology will need to be based on an improved scientific understanding of the fundamental nature of UOG reservoirs as well as the processes that govern the storage release and flow of hydrocarbons in response to alternative stimulation designs and approaches
Emerging Research Opportunities for Offshore Oil Spill Prevention
The offshore environment can be characterized by geologic meteorologic oceanographic and hydrologic uncertainties that require better understanding to reduce the risk to the environment during oil and gas resource development In the Gulf of Mexico water depths of greater than 1000 feet create substantial logistical and operational challenges In the Arctic extreme cold creates surface ice and other logistical issues (eg oil flow) Spill prevention is very important and technologies are needed that ensure well control A more detailed understanding of the geologic environment where hydrocarbons exist could prevent hazards from leading to failures Technologies and processes that protect the environment during the drilling and completion of wells and the umbilicals and systems that bring the production to the surface could minimize potential environmental damage Increased reliability of subsea systems could reduce both cost and environmental risks
For example protection of the environment at and below the seafloor during drilling and completion could be improved with novel designs and materials for better wellbore integrity comprehensive knowledge of wellbore intervention and remediation technologies (pre- and post-decommissioning) and the advancement of capabilities for human interface with sophisticated technology and monitoring systems Challenges associated with surface systems and umbilicals include large-scale system designs and technology to improve safety and long-term durability and to increase automation in support of decision making
As discussed in the recent NPC study Arctic Potential44 spill prevention is especially important in avoiding the need to implement a spill response in Arctic waters Research priorities are similar to those for offshore Gulf of Mexico except that surface temperatures and the presence of ice require enhancements to surface systems and equipment to address drilling and production in extreme environments
Gas Hydrates Assessment and Safe and Effective Production
Gas hydrate is a material very much tied to its environmentmdashit requires very specific conditions to form and remain stable Pressure temperature and availability of sufficient quantities of water and CH4 are the primary factors controlling gas hydrate formation and stability although geochemistry and the type of sediment also play a part If the pressure and temperature are just right free methane gas and water will form and sustain solid gas hydrate Gas hydrates can be found in pipelines in the subsurface and on the seafloor
Despite being a large resource (Figure 75) gas hydrates are far from a viable option for meeting potential domestic energy supply needs in the mid-term To tap this resource science and technology advancement on three fronts would be needed First the United Statesrsquo resource must be more fully characterized and confirmed to better understand the opportunity and challenges While the assessment of gas hydrate onshore in Alaska is relatively advanced the bulk of the resource lies offshore Although a joint industry drilling program by DOE the US Geological Survey (USGS) and the Bureau of Ocean Energy Management (BOEM) confirmed gas hydrate resource occurrence and exploration approaches in 200945 these represent the only wells to validate the BOEM assessment of ~20000 Tcf of resource-grade gas in the United Statesrsquo Outer Continental Shelf46 This estimate is an order of magnitude more gas than the entire United Statesrsquo technically recoverable natural gas resource base47
Quadrennial Technology Review240
7 Advancing Systems and Technologies to Produce Cleaner Fuels
Second production approaches demonstrated over sufficient time frames can generate reliable estimates of gaswater production Multiple long-term tests would identify and provide insight into potential production issues (such as sand production seal integrity and others) While depressurization will be the base technology for commercial applications the optimal use of chemical mechanical and thermal stimulation could affect site-specific production levels significantly Initial field experiments are likely to occur in the Arctic with lessons learned subsequently demonstrated in the deepwater of the Gulf of Mexico Commercial applications will also likely leverage drilling approaches tailored to the shallow depths at which gas hydrate occurs
Third concerns regarding gas hydratersquos potential contribution to ongoing climate change must be addressed through continued integration of gas hydrate science into ocean process and global climate models Gas hydrate geohazard issues particularly on shallow arctic shelves are an area of increasing concern
There is currently little or no domestic industry investment in this area either on a proprietary basis or in collaboration with government Effective collaboration between federal and state research international research programs and government agencies would improve any future research in this area
In summary the oil and gas sector has undergone significant changes due in large part to advanced technologies Oil and gas are relatively low cost and represent a large secure domestic resource However to ensure prudent development of the US oil and gas resource base both onshore and offshore technological advances are still needed to address the remaining challenges
For UOG this includes improving water and air quality reducing the surface and subsurface footprint and addressing induced seismicity For water the concern is protecting groundwater reducing the amount of water used in UOG development efficient use of water and water-less stimulation For induced seismicity we need to understand the specific relationship between seismic events and UOG operationsmdashis it related to the disposal of wastewater Is it related to the size of the hydraulic fracturing treatment Can faults be identified before they move We need to understand these relationships and their mechanisms in order to predict and mitigate induced seismicity Another important challenge is the intensity of development of UOG The low recovery factor from these wells is leading to more frequent and more intensive stimulation Understanding the scale and nature of UOG formations could help reduce this intensity which in turn could lead to many environmental benefits such as fewer wells reduced water use reduced truck traffic and improved air quality
Moving to the offshore the challenges are associated with the complexity of dealing with deep water and deep formations in the Gulf of Mexico and surface temperatures and ice in the Arctic The technology opportunity space for oil spill prevention in the Gulf of Mexico includes understanding the geologic hazards in the subsurface before the drilling program is designed and then being able to handle any anomalies during drilling This intersection of the natural system with the engineered systems is the point of highest risk in oil and gas development This risk is exacerbated when drilling through thousands of feet of water into pay zones that can be miles deep and located more than one hundred miles from shore Once the well is in production the risk continues The umbilicals and the surface systems are subject to hurricanes on the surface and to currents and corrosion subsea Finally many of the subsea and seafloor systems are automated so reliability of the components is critical Arctic development has significant challenges due to low temperatures ice and the remoteness of the location The recent NPC study Arctic Potential48 advises of the need ldquoto validate technologies for improved well controlhelliprdquo
The issues affecting future supply from gas hydrates focus on two main concerns 1) how to commercially produce certain hydrate deposits and 2) how to identify the conditions for stability of noncommercial hydrate deposits The technology space to address these concerns is framed by three key thrusts 1) characterization of the resource 2) production approaches for commercial deposits and 3) conditions of hydrate stability for noncommercial deposits
241
7
Underlying all of these is the need to address carbon emissions to the atmosphere Technology can help overcome some of the shortcomings associated with oil and gas during the transition to a low-carbon economy More information on oil and gas is included in the Supplemental Information to this chapter
Federal Roles
The oil and gas industry is a mature worldwide commercial entity The federal role in this enterprise is necessarily focused on ensuring the public good and manifests itself in activities that protect the environment improve safety and contribute to the nationrsquos energy security The federal role includes partnering across industry on such activities as developing technologies in the public domain that can sustain domestic supply minimize the footprint of operations by reducing the number of wells drilled protect water and air quality reduce the risk of oil spills and mitigate the risk of pipeline leaks and fugitive emissions
73 Bioenergy for Fuels and Products
731 Bioenergy Overview
Bioenergy can help meet the need for liquid fuel with lower emissions through production of biofuels and other bioproducts This requires developing producing and collecting sustainable feedstocks efficient conversion processes and a competitive final fuel product that has the necessary physical and chemical properties Properties that are required include appropriate energy content and characteristics for use acceptable transport characteristics ability to withstand temperature extremes and storage suitability
In general bioenergy pathways consist of production and collection of feedstock supply conversion of that feedstock through a wide variety of processes into the desired fuel and distribution in the energy infrastructure for use (Figure 77) In addition biogenic wastes (eg manures biosolids [treated sewage] food wastes and municipal solid waste) can be converted into liquid fuels and products This section describes a variety of technologies across these generalized pathways and associated metrics used to assess the viability and desirability of these technologies
Figure 77 Overall Pathway for Production of Fuels from Biomass
Feedstock Supply
BiomassProduction
FeedstockLogistics
Conversion
Deconstruction Upgrading
Bioenergy Infrastructure
End UseDistribution
Bioenergy can provide options to replace oil especially in challenging applications like aircraft fuels diesel and bioproducts that can substitute biomass for petroleum feedstocks (Figure 78) Renewable fuels are needed for reducing GHG emissions from these sectors because other approaches like electrification are not viable in the near term A fuel that is compatible with existing infrastructure may increase the ability of the fuel to serve many needs and reduce barriers to deployment
Bioenergy is considered renewable because it can be replenished through plant growth or use of waste streams Carbon dioxide emitted from biofuel combustion is generally discounted as an emission because it was captured from the atmosphere in growing the biomass Cultivation production collection and processing of biomass into fuels and products often involves the use of fossil fuels which means the resulting life-cycle
Quadrennial Technology Review242
7 Advancing Systems and Technologies to Produce Cleaner Fuels
Figure 78 RampD options are available to address most products from the whole barrel of oil Bioenergy can address jet fuel and other products two fractions that have few other substitutes
Credit US Energy Information Administration
Options to Reduce or Replace
Products Made from aBarrel of Oil 2013
bull Heavy-Duty Vehicle Efficiency and Natural Gas Trucksbull Renewable Diesel and Heating Oil
bull Heavy-Duty Vehicle Efficiencybull Electric and Fuel Cell Vehiclesbull Cellulosic Ethanolbull Renewable Gasoline
Renewable Jet Fuel
Diesel and Heating Oil 28
Jet Fuel 9
Other Products 15
Heavy Fuel Oil (Residual) 3Liquefied Petroleum Gases 4
Gasoline 42
BioproductsValue-added chemicals produced frombiomass to manufacture bio-based plastics lubricants and other products
Source httpgousagovkYqV
Note A 42-US gallon barrel of crude oil yieldsabout 45 gallons of petroleum products
Efficiency offsets diesel and gasoline because it reduces demand while maintaining the same service
Reducing and Replacing Petroleum Use
energy may not be completely renewable or emissions-free Growth of biomass may also impact soil carbon or standing biomass Challenges associated with large-scale utilization of biomass include the need for a large land area to grow biomass feedstocks water and nutrient requirements for feedstock cultivation and the impact of feedstock growth because of climate issues
Life-cycle assessment (LCA) is a technique used to evaluate total energy use and GHG emissions associated with biofuels and compare energy pathway performances Pathway emissions depend on factors such as the energy needs of the feedstock logistics energy use fertilizer requirements conversion efficiency and chemistry and biorefinery energy needs RampD can identify ways to improve the conversion efficiency for many pathways Fuels under development can reduce the life-cycle emissions
of GHGs in comparison to existing fossil-derived transportation fuels (Figure 710) Some topics such as land-use change can be challenging to include in an LCA framework and are a subject of ongoing research
Total Bioenergy Potential
The total emissions reductions and petroleum displacement potential of biofuels and hydrogen depend on factors such as the total sustainable resource the availability of a cost-effective resource and the efficiency of conversion technologies (Figure 79) More than one billion dry tons of biomass may be available sustainably for use as bioenergy by 2030 (Figure 710 and Table 73)49 With technology improvement and a mature market this available bioenergy could provide approximately 58 billion gallons of fuels to replace gasoline diesel and jet fuelmdashproduced from approximately 18 quadrillion British thermal units (Btu) of biomass feedstock by 205050 Capturing this total potential would require significant success in RDampD and market deployment activities
Even in high-usage scenarios bioenergy would not supply sufficient energy to totally replace petroleum at current use levels However when combined with efficiency and other strategies in transportation (Chapter 8) and industry (Chapter 6) bioenergy can represent a key part of a clean energy future especially by meeting
243
7
Figure 79 Life-Cycle Greenhouse Gas Emissions of Selected Pathways These are point estimates but significant uncertainty and geographic variation remains regarding the specific emissions associated with each technology or specific biorefinery Data from Greenhouse Gases Regulated Emissions and Energy Use in Transportation Model (GREET 2014)
00
20
40
60
80
100
120
US
Aver
age
Corn
Stov
er
Fore
st Re
sidue
Corn
Switc
hgra
ss
Corn
Stov
er
Corn
Stov
er
Fore
st Re
sidue
Pyrolysis GasolineGasoline Ethanol Pyrolysis Diesel
kgCO
2egg
e
Figure 710 Total Estimated Sustainable Bioenergy Resource Potential Supply Curve at Marginal Prices Between $20 and $200 per Dry Metric Ton in 2022
Key dt = dry ton
Quadrennial Technology Review244
7 Advancing Systems and Technologies to Produce Cleaner Fuels
Table 73 Current and Future Potential Impacts of the Bioeconomy As one possible scenario of potential biomass use in the future the 2030 vision for the bioeconomy uses one billion dry metric tonnes of biomassmdashapproximately 18 quads of primary energymdashto produce the power fuels chemicals and pellets listed below The biofuels allocation is 146 billion gallons of ethanol 218 billion gallons of advanced drop-in fuels 55 billion gallons of jetaviation fuels and 159 billion gallons of diesel and heating oil for a total of 58 billion gallons of liquid fuels which would represent approximately 20 of current total annual petroleum use Power generation of 90 billion kWh would represent about 25 of current electricity generation51
Bioeconomy parameter Current Future potential
Biomass utilization 200 million dry metric tons (DMT) 1 billion DMT
Biopower production30 billion kWh 90 billion kWh
(22 million DMT) (60 million DMT)
Biofuels production15 billion gallons 58 billion gallons
(164 million DMT) (918 million DMT)
Biochemicals production25 billion pounds 16 billion pounds
(7 million DMT) (44 million DMT)
Wood pellet production14 billion pounds 34 billion pounds
(7 million DMT) (17 million DMT)
liquid fuel needs in uses like jet fuel that are challenging to replace Conversion technologies need to be developed utilizing lignocellulosic feedstocks waste materials and algae that minimize land-use change and deforestation around the world
Impact of Success Growing the Bioeconomy
The bioeconomy has potential to provide jobs and economic opportunities support a secure renewable energy future and contribute to improved environmental quality While the United States has always maintained an active bioeconomy the potential exists to expand it and use up to one billion dry tons of biomass annually producing renewable fuels power and products This effort would require sustainable production of biomass feedstocks construction of biorefineries and manufacturing facilities market growth in biofuels and other biomass-derived products and development of feedstock production to support the industry Table 73 shows the current and anticipated outcomes from a fully mature bioeconomy
Increasing utilization of a diverse blend of domestic resources including renewable fuels such as biofuels offers a pathway to increase energy security and reduce market uncertainty by increasing diversity
732 Current Status
While not as extensive as petroleum-based systems biofuels have established markets infrastructure and industrial processes for production and use in the United States and worldwide In some parts of the world biofuels are competitive as a drop-in transportation fuel In 2013 the United States produced 135 billion gallons of ethanol from 211 biorefineries for use as a transportation fuel This development has scaled up rapidly from less than two billion gallons of capacity in 2000 (Figure 711)
245
7
Figure 711 Growth in US Ethanol Production Capacity (Source Bioenergy Technology Office Multi Year Program Plan)52
Ethanol from corn remains the largest component of this market It is consumed in the light-duty vehicle fleet as blends of ethanolgasoline Approved blends in the United Statesrsquo market are E10 (10 ethanol 90 gasoline suitable for most vehicles in the road today) E15 (for 2001 and newer light-duty vehicles) and E85 (for flex-fuel vehicles) Biodiesel from soybean and waste oils is also being used in heavy-duty vehicles at blends up to B20 displacing approximately 2 of the diesel market
Cellulosic biofuels mandated by the Federal Renewable Fuel Standard and favored by the California Low Carbon Fuel Standard53 have been slower to enter the market Recently there has been significant RampD progress that should lead to reductions in the production cost of biochemically produced cellulosic ethanol To realize the benefits of this technology more plants must be built at commercial scale (approximately 50 million gallons per year) and the current technologies must mature as the industry gains experience
Four commercial-scale facilities have been constructed that can produce ethanol from lignocellulosic feedstocks (Abengoamdash25 million gallons per year DuPontmdash30 million gallons per year INEOSmdash8 million gallons per year and POET-DSMmdash25 million gallons per year) These facilities convert corn stover citrus waste and other types of agricultural residues into ethanol Although these accomplishments are substantial and represent important benchmarks for technology demonstration they remain a small part of the fuels market
Three additional commercial-scale cellulosic biofuel projects (Emerald Biofuels Fulcrum BioEnergy and Red Rock Biofuels)54 are in the construction phase These projects will use municipal solid waste waste oils and greases and woody biomass to produce renewable jet fuel and renewable diesel These fuels are nearly identical to their fossil-derived counterparts and are approved for blending at 5050 levels with conventional jet fueldiesel in the civil and military aviation sectors Production from these facilities is expected to begin in 2017 and when fully operational they will produce 100 million gallonsyear of renewable diesel and jet fuel
Despite recent progress key barriers remain for advanced bioenergy technologies Although there are more than seventeen million vehicles on the road that can use E85 various factors have limited E85 use in practice and E15 is not yet widely deployed This means that additional ethanol cannot simply be added to the fuel mix beyond the current 10
Quadrennial Technology Review246
7 Advancing Systems and Technologies to Produce Cleaner Fuels
733 Feedstocks and Logistics
The sustainable supply of quality cost-effective feedstocks is fundamental to growing the bioenergy industry However the inherently dispersed nature of biomass remains a central challenge Four broad categories of feedstock are discussed here 1) terrestrial feedstocks 2) lignin 3) algal feedstocks and 4) waste feedstocks
Terrestrial Feedstocks
About 200 million dry tons of biomass is currently used today The largest energy use of biomass (44) is in the industrial sector where woodwood waste is used in paper mills to provide heat and steam via boilers The transportation sector uses the next largest share of biomass (31) in the form of corn-based ethanol and soybean-waste oils-based biodiesel Corn and soybean harvesting logistics and collection systems are mature following many years of fine-tuning and development The remaining biomass consumption is fuelwood in residential and commercial sectors A small amount of biomass is consumed by the electric power sector About 65 of the biomass is woody material and comes from forest sources The delivered price for pulpwood ranges from $30ndash$40green ton (Figure 712)
Figure 712 Historical and Projected Volumes of Biomass Available at a Delivered Cost of $80Dry Metric Ton for Various Biomass Types Accommodating Multiple Conversion Processes NOTE Higher projected volumes are attributable to a variety of factors including increased biomass yields capacity and efficiency improvements in logistics systems and logistics strategies such as blending
Today a quality affordable feedstock supply uses conventional logistics systems developed for traditional agriculture and forestry systems These are designed to move biomass short distances for limited-time storage (less than one year) It appears that such systems are not well configured for a diverse much larger set of feedstocks and their associated transportation requirements especially in medium-to-low yield areas Advanced purpose-designed economical systems designed to deliver feedstocks with predictable physical
247
7
and chemical characteristics longer-term stability during storage and high-capacity bulk material handling characteristics can facilitate economic transport over longer distances and lower costs of biofuels One approach to achieving this is applying preprocessing techniques such as blending55
Energy crops are produced primarily to be feedstocks for energy productionmdashas opposed to agricultural or forest residue which are byproducts of another commodity Examples of energy crops include switchgrass miscanthus and energy cane Farmgate price is defined as the price needed for biomass producers to supply biomass to the roadside It includes when appropriate planting maintenance (eg fertilization weed control pest management) harvest and transport of biomass in the form of bales or chips (or other appropriate formsmdasheg billets bundles) to the farmgate or forest landing
Biomass price projections with quality information obtained from the Biomass Resource Library and Properties Database56 have shown that gains in projected volumes can be realized by transitioning to a blended feedstock approach
Traditionally terrestrial feedstock logistics research has focused on improving conventional systems Through 2012 conventional woody supply system costs were reduced by improving existing equipment efficiencies adopting innovative ways of mitigating moisture content and increasing grinder performance Many researchers have since concluded that conventional feedstock supply systems would remain inadequate for a competitive biofuels industry and focused on advanced logistical systems and nonideal feedstock supply areas to increase the total volume of material that could be processed enable more biorefinery options address quality and meet the 2017 cost target of $80 per dry ton delivered to the biorefinery inlet Advanced systems could gradually bring in larger quantities of feedstock from an even broader resource base after 2017 as well as incorporate environmental impact criteria into availability determinations and continue to meet both quality requirements and the $80 per dry ton cost target (Figure 713)
Figure 713 Historical and Projected Delivered Woody Feedstock Costs Modeled for Pyrolysis Conversion
Key SOT = State of technology
Quadrennial Technology Review248
7 Advancing Systems and Technologies to Produce Cleaner Fuels
A feedstock cost target of $80 per dry ton is estimated to be sufficient to supply biomass that meets a set of required specifications (ash content moisture particle size distribution amount of material) for fuel conversion facilities57 The cost includes a grower payment to the farmer to reflect the added inputs needed to grow andor harvest the material A conversion facility can expect to achieve an efficiency of about 70 gallons of fueldry ton Feedstock cost of $80 per dry metric ton adds about $114 per gallon to the fuel conversion cost
Lignin
Lignin is a large molecule and component of woody biomass cell walls that gives wood its distinctive structure A total resource availability of 300 billion metric tons of lignin exists in the biosphere58 making it one of the most abundant natural polymers on Earth Assuming an energy content of 25 kJg the renewable resource is equivalent to nearly 8000 quads worldwide Of course only a small fraction of this energy can be used for bioenergy or bioproducts
Burning wood for heat energy is among the oldest forms of human energy use Commercial experience with lignin is also long-lived in 1927 the Marathon Corporation began investigation into commercial uses for lignin other than as boiler fuel Successive uses have included a diverse slate of products from bulk chemicals like agricultural dispersants to specialty chemicals like vanillin Other companies have recently developed injection molding substances from lignin (Tecnaro GmbH) and produced expanded polyurethane foam using lignin
The higher heating value (HHV) of different types of biomass samples correlates with the samplersquos lignin content (Figure 714) For biofuel production particularly through biochemical conversion technology routes lignin is often an under-utilized biomass component due its digestion resistance Most often it is used on-site at the biorefinery to generate energy and process heat Lignin can make up as little as 15 of herbaceous plant composite and as high as 35 of some softwood species Lignin is too high of a percentage of biomass to ignore for biofuel cost-competitiveness
One solution to costs and logistical issues is blending Feedstock blending allows a biorefinery to collect less of any one feedstock and thus move down the cost versus supply curve enabling biorefineries to pay a lower average price The blended feedstock concept is being explored by two lignocellulosic biomass conversion facilities Abengoa in Kansas and POET in Iowa Preliminary results suggest that blending multiple preprocessed feedstocks enables the acquisition of higher biomass volumes and reduces feedstock variability to meet biorefinery in-feed specifications while delivering feedstock to the biorefinery at $80dry metric ton
Figure 714 Correlation Between Lignin and Energy Content in Biomass Samples59
Credit Reprinted from Energy Conversion and Management 42 Demirbas A Relationships between lignin contents and heating values of biomass 183-188 Copyright (2001) with permission from Elsevier
1016
17
18
19
20
21
22
23
20 30 40 50 60
High
er h
eatin
g va
lue
(kJg
-1)
Lignin content (wt )
249
7
Algae
Algal biomass includes micro- and macro-algae and cyanobacteria all abundant in the earthrsquos oceans and freshwater causeways Because algae grow rapidly and thus potentially could scale as a commercial feedstock biofuels derived from algal biomass could contribute to a substantial domestic advanced biofuel market Advantages of algae-derived biofuels include the ability to grow on nonarable land (including potentially offshore) and the ability to use brackish or saline water and grow on waste nutrients and effluents including carbon dioxide from power plants Algae may also have a limited concentration of ash (the inorganic components of biomass) and can accumulate significant amounts of lipid
This high-lipid content has special merit for biorefining Algal species that accumulate significant amounts of lipid in their cell structure are particularly well suited for economic conversion to hydrocarbon-based fuels such as renewable diesel and jet fuel Research has the potential both to increase algal growth rates and maximize lipid content However algae have their own challenges Depending on the setting and production system production costs can be very high and both water and micronutrient requirements can be substantial RampD opportunities include reducing the cost of production of algal biomass and intermediates developing cultivation and logistics systems for producing fuels and products at commercial scale developing innovative dewatering technologies and developing algal species that can survive and maintain high productivity in nonlined open pond algal farms These costs must be substantially reduced for viable commercial competitiveness60
Table 74 shows projected minimum fuel selling prices for algae-based biofuels based on reasonable yield assumptions derived from literature and technical projections The greatest opportunity to reduce costs is in production systems through improved biomass yield and reduced cultivation capital costs Achieving the 2022 projection requires the following a fivefold improvement in biomass yield through increased productivity and extractable lipid content a factor of two reduction in capital costs for pond construction (including removing pond liners from the design) and significant capital and operability improvements in the harvest and preprocessing steps
Table 74 Summary of Cost Contributions ($gallon of product) for the Algal Lipid Upgrading Design 61
Unit operation 2010 state of technology 2014 projection 2018 projection 2022 projection
Feedstock $1650 $1060 $519 $305
Conversion $172 $156 $111 $111
Hydro-treating $184 $184 $184 $029
Anaerobic digestion $068 $065 $047 -$018
Balance of plant $000 $000 $000 $008
Total $2074 $1466 $861 $435
Quadrennial Technology Review250
7 Advancing Systems and Technologies to Produce Cleaner Fuels
Waste to Fuels
In addition to purpose-grown crops municipal industrial and agricultural waste streams constitute a significant resource for the production of fuels product precursors heat and electricity Waste feedstocks have an inherently attractive qualitymdashusing them likely provides solutions to problems of waste management and disposal Two facilities in the United States currently convert waste fats oils and greases into renewable diesel (Diamond Green Diesel facility in Louisianamdash130 million gallons per year and REGrsquos plant in Geismar Louisianamdash75 million gallons per year of renewable diesel)
The Biogas Opportunities Roadmap issued jointly by the US Department of Agriculture EPA and DOE estimates that the combination of biogas production from agricultural manure operations landfills and water resource recovery facilities could yield 654 billion cubic feet per year If converted to electricity the roadmap projects potential generation of more than 40 terawatt-hours more than 1 of the United Statesrsquo current consumption according to the EIA This figure is probably conservative as it does not include organic industrial wastes Biogas used in compressed or liquefied natural gas vehicles and biogas used to generate electricity to charge an electric vehicle both qualify as cellulosic biofuels under the Renewable Fuel Standard
734 Conversion Pathways
Biological feedstocks and their intermediate products (eg crude bio-oils syngas and sugars) must be upgraded to produce a finished product These finished products could be fuels or biochemicals or could be stabilized intermediates suitable for finishing in a petroleum refinery or chemical manufacturing plant To produce energy-dense liquid transportation fuels a variety of conversion technologies are being explored that can be combined into pathways from feedstock to product (Figure 715)
Figure 715 Conversion Pathways from Feedstock to Products
251
7
Historically these pathways have been roughly classified as either biochemical (using biological processes such as organisms or enzymes) or thermochemical (using chemical catalysis and chemistry) to reflect the primary catalytic conversion system employed as well as the intermediate building blocks produced Generally biochemical conversion technologies involve pathways that use sugars and lignin intermediates while thermochemical conversion technologies involve pathways that use bio-oil and gaseous intermediates Specific process variations impact performance (eg rate selectivity and yield) which determines economic viability and potential environmental impacts (eg life-cycle assessments)
Conversion Process Steps
Conversion can be broken down into two parts 1) deconstruction and fractionation and 2) synthesis and upgrading Figure 715 highlights key technologies within deconstruction and fractionation as well as synthesis and upgrading which are linked to form a complete conversion pathway from feedstock to products Research on multiple technologies along several pathways can address the broad range of physical and chemical characteristics of various feedstocks and reduce the risk that any specific technology could fail to reach commercial viability Additionally each linked set of conversion technologies results in the production of a unique product slate whose value will vary depending on market size and demand
Figure 716 Cost Projection Breakdown for the Fast Pyrolysis Design Case 2009ndash2017
$000
$200
$400
$600
$800
$1000
$1200
$1400
2009 SOT 2010 SOT 2011 SOT 2012 SOT 2013 SOT 2014 SOT 2015 Projection
2016 Projection
2017 Projection
Mod
eled
Min
imum
Fue
l Sel
ling
Pric
e ($
gge
tot
al fu
el)
Fuel Finishing to Gasoline and Diesel ($gge total fuel)
Upgrading to Stable Oil ($gge total fuel)
Fast Pyrolysis ($gge total fuel)
Feedstock Cost ($gge total fuel)
Balance of Plant ($gge total fuel)
$1340
$1027
$826$704
$577$526
$475$401
$339
Deconstruction and fractionation Deconstruction and fractionation processes break down biomass-derived polymeric feedstock into tractable intermediate streams After preprocessing andor pretreatment deconstruction processes can be divided into two categories high-temperature deconstruction (at or above 100degC) and low-temperature deconstruction
Development of a variety of conversion technologies is necessary to address the broad range of physical and chemical characteristics of various biomass feedstocks Preprocessing options include densification and blending of an expanded pool of feedstocks and also impact conversion
High-temperature deconstruction encompasses pyrolysis gasification and hydrothermal liquefaction Each of these approaches is a conventional chemical engineering process but application to biomass feedstocks is relatively new and issues of cost feed systems ash handling and other engineering and material handling topics remain important
Low-temperature deconstruction is the breakdown of feedstock into intermediates by pretreatment followed by hydrolysis In this context pretreatment is the preparation of feedstock for hydrolysis and separation of feedstock into soluble and insoluble components This process opens up the physical
Quadrennial Technology Review252
7 Advancing Systems and Technologies to Produce Cleaner Fuels
structure of plant cell walls revealing sugar polymers and other components Hydrolysis is the breakdown of these polymers either enzymatically or chemically into their component sugars andor aromatic monomers
One conversion method fast pyrolysis has made important progress since 2009 and appears on track for market parity prices with ethanol in the next five years The updated fast pyrolysis design case uses a blended formatted woody feedstock to produce gasoline and diesel blendstock with costs modeled for nth plant biorefineries This design case illustrates how the $3 per gallon of gasoline-equivalent cost goal can be achieved by 201762 The waterfall chart in Figure 716 shows that a 75 cost reduction is projected to be achieved from the 2009 state of technology (SOT) to the 2017 projection made possible by decreasing bio-oil upgrading costs through RampD efforts in catalyst improvement In addition to large cost reductions the renewable blendstocks produced are projected to have GHG reductions of greater than 60 compared to petroleum-based blendstocks
Thermochemical Conversion Fuels and PetroChemicals
The thermochemical process used today for cellulosic conversion is gasification including a gasifier syngas cleanup and catalytic fuel synthesis reactors Significant process engineering improvements have been achieved within the gasifier and fuel synthesis steps and technical improvements have been achieved in the syngas cleanup and catalytic fuels synthesis steps Notable past breakthroughs have included the optimization of an indirectly heated fluidized bed gasifier the development of tar- and methane-reforming catalysts that increased methane conversion to syngas from 20 to more than 80 and development of catalysts and operational strategies for the conversion of syngas to mixed alcohols production These key improvements have resulted in an increase in ethanol yield from 62 gallons to greater than 84 gallons per ton of biomass
Bioproducts
There are compelling economic and environmental reasons to pursue the development and manufacturing of biobased chemicals in addition to fuels The enabling research technology development and commercial demonstration of such technologies in the 1990s and early 2000s yielded substantial progress outcomes and commercial successes These include the DuPont Tate and Lylersquos 13-propanediol facility in Tennessee Natureworksrsquo polylactic acid facility in Nebraska and the Myriant succinic acid facility in Louisiana Each facility can generate more than a million pounds per year of renewable chemicals effectively displacing fossil precursors of these materials
Bioproduct markets are well developed and the bioproducts compete directly with petroleum counterparts on a basis of cost and purity Other bioderived chemicals may offer improved functionality compared to petroleum-derived chemicals Such bioproducts may have an inherently higher value but their markets will take time to develop increasing risk
Because biomass feedstocks are oxygenated compared to petroleum feedstocks biofuels and many other market chemicals normally require reducing the oxygen content relative to biomass feedstocks Conversely other market chemicals are oxygenatedmdashwhether they are direct replacements functional equivalents or provide new functionality In fact many chemical products are functionally more similar to biomass than fuels (Figure 717)
Overall bioproducts have only a tiny presence in the market and much RDDampD is needed to realize their potential
Biochemical Conversion
Key agents in biochemical conversion are enzymes and microbial consortia Biochemical conversion route costs have been significantly lowered through an approximately 90 reduction in enzyme cost enabled by development of new enzymes and enzyme cocktails Development of microorganisms that can more effectively
253
7
Figure 717 Producing oxygenated chemicals from olefins involves increasing the molecular weight via oxidation Hence the theoretical yield on a weight basis is greater than the weight of the olefin starting material Biomass is different because it is highly oxygenated the molecular weight is usually decreased On a weight basis the theoretical yield is less than the weight of the starting sugar or biomass resource Trying to match the oxidation state (or functional equivalency) can also be advantageous (most oxidized or most functional are presented on the right)
Credit Vennestroslashm P N R Osmundsen C M Christensen C H and Taarning E Beyond Petrochemicals The Renewable Chemicals Industry Angewandte Chemie International Edition 50 10502ndash10509 (2011) Reprinted with permission from John Wiley and Sons
0
BTX
butadiene
ethylenepropylenemethanolnaphta
crude oil
coal
natural gas
methane
acrolein
EO
higheralcohols
EtOH fatty acidsPE PP
BDOPG
EG
adipic acid
acetic acidacrylic acid
phthalic acid lactic acidglycol aldehyde carbohydrates
lignocellulose
glycerol
triglyceridesacetaldehyde
GVLlevulinic acidsorbitol
1
2
3
4
Effec
tive
HC
ratio
Foss
il pl
atfor
ms
Inte
rmed
iate
s
Inte
rmed
iate
s
Biom
ass p
latfo
rms
Tran
spor
tatio
nfu
els
Chem
ical
s
Processing
Fossilresources
Target chemicals
Biomassresources
Processing
utilize multiple sugars also contributed to cost reductions Key breakthroughs in biochemical process steps included the development of more efficient pretreatment processes improved enzyme production and enzyme load methods and more robust fermentation organisms that could use sugars in the presence of biomass-derived inhibitors Many of these were demonstrated between 2001 and 2012
The limited areas of biobased chemicals manufacturing available today are relatively mature and historically have used traditional sugars such as corn starch or sugar cane for feedstocks The opportunity for expansion to new pathways should focus on the utilization of cellulosic sugars lignin and other renewable feedstocks
Additional opportunities in biorefineries involve lignin as a feedstock (see Section 733) The lignin molecular structure itself suggests some applications including aromatic chemicals and polymers for applications that could include commodity chemicals currently produced from petroleum such as benzene toluene and xylene and potentially polymer applications such as carbon fibers63
In addition to these many applied research activities important fundamental research is still required For example basic research is being conducted by the DOE Office of Science at three centers focusing on transformational breakthroughs (see textbox Fundamental Research Bioenergy Research Centers)
Quadrennial Technology Review254
7 Advancing Systems and Technologies to Produce Cleaner Fuels
Fundamental Research Bioenergy Research Centers
DOE established three Bioenergy Research Centers (BRCs) in 2007 to accelerate transformational breakthroughs in the basic sciences needed to develop the cost-effective sustainable commercial production of cellulosic biofuels on a national scale Directed fundamental RDDampD approaches focused on creating new energy crops new methods for deconstructing the lignocellulosic material into chemical building blocks and new metabolic pathways inserted into microbial hosts to produce ethanol and other hydrocarbon fuels
The three centers engage national laboratories academic institutions and the private sector The BRCs coordinate research on the entire pathway from bioenergy crops to biofuel production The center-scale approach allows technology development specialists to design automated pipelines that streamline workflows and increase research efficiencies The BRCs offer an unusual opportunity for plant and microbial scientists to work with experts in chemical engineering computational biology analytical technology and many other disciplines to test research ideas from proof-of-concept to field trials The BRCs also develop intellectual property licensing agreements partnerships and targeted collaborative affiliations
More information can be found at the website for each center The BioEnergy Science Center (BESC httpbioenergycenterorgbescindexcfm) is focused on
the ability of plant cell walls to resist breakdown into their component cellulosic sugars Great Lakes Bioenergy Research Center (GLBRC httpswwwglbrcorg) aims to increase the
energy density of grasses and nontraditional oil crops by understanding and manipulating the metabolic and genetic circuits that control accumulation of oils in plant tissues
Joint Bioenergy Institute (JBEI httpwwwjbeiorg) is applying synthetic biology to engineering microorganisms that convert sugars into advanced biofuels
For more information on BRCs visit httpgenomicscienceenergygovcentersBRCs2014HRpdf
735 Fueling Infrastructure for Biofuels
The United States has about 160000 retail gasoline stations which distribute 134 billion gallons per year of motor gasoline Most vehicles on the road today are approved to use E10 which can absorb about 13 billion gallons per year of ethanol Corn-based ethanol production capacity of 15 billion gallons per year is saturating the gasoline market at E10 levels with the additional ethanol going into E85 and being exported to several countries (primarily Brazil) Ethanol in the form of E85 is available at about 2600 retail stations
While E85 has experienced growth over several years the number of retail stations and the mismatch in the distribution of retail E85 stations and flex-fuel vehicles means slow growth in E85 On the other hand the aviation sector consumes about 21 billion gallons per year of jet fuel The United Statesrsquo top thirty airports use more than 80 of the countryrsquos jet fuel The delivery infrastructure associated with renewable jet fuel is significantly less challenging than the delivery infrastructure required with ethanol
736 Research and Development Opportunities
Key research opportunities and timing are shown in Table 75 Cost competitiveness with conventional fuels and feedstocks is a key metric for each potential fuel production pathway Satisfactory chemical composition and performance is also essential and some renewable fuels offer benefits such as higher octane values
255
7
Table 75 Timing for Biomass Research Needs and Priorities
Research priorities Near term (2ndash5 years)
Medium term (5ndash10 years)
Long term (gt10 years)
Terrestrial feedstocks
Algae
Biochemical conversion
Thermochemical conversion
Bioproducts
Major focus areas for RampD are aviation biofuels refinery integration and bioproducts New conversion processes (biochemical thermochemical and hybrid) need to be developed to produce renewable diesel and renewable jet fuel in a cost competitive manner from waste-based lignocellulosic biomass Conversion processes can produce renewable dieseljet blend-stocks that meet all relevant specifications and can be blended with conventional jetdiesel An alternative approach is to produce a biocrude that can be used as a supplementary input (along with crude oil) to a refinery There are significant compatibility issues associated with this approach and refinery integration issues must be resolved for biocrudes produced from biomass via pyrolysis These biocrudes have high oxygen content and are acidic They need to be stabilized transported and minimally upgraded to ensure that they will not damage a petroleum refinery If acceptable oil can be produced that will be suitable for integration into a refinery the refinery can operate as usual with a supplemental volume of oil coming from biomass in addition to regular crude oil and use existing delivery infrastructure The higher-value products (eg bio-succinic acid 13-butadiene animal feed and fish feed) and use of existing infrastructure can help offset the cost of biofuels production
Developing a uniform format blended feedstock would yield substantial benefits One key criterion for building large integrated biorefineries is the biomass draw radius that with conventional feedstocks is limited to about seventy-five miles An advantage of uniform format blended feedstocks would be the ability to transport biomass over longer distances which would give significant flexibility to large biorefineries Energy crops need to be developed that have high biomass yield (tonsacre) can be grown in temperate climates can thrive on marginal soils and have reduced input requirements such as water and fertilizer Switchgrass and miscanthus are examples of crops that meet some of these criteria64
Specific areas of interest in biochemical conversion include developing better pretreatment processes creating lower-cost hydrolytic enzymes developing new enzymes limiting contaminants and creating a tractable lignin stream New microorganisms are needed that can tolerate high temperatures and highly acidic or basic conditions that are tolerant of contaminants and that can produce hydrocarbon-like fuels or precursors that can be easily converted to hydrocarbon fuels A promising area of research involves extremophiles occurring in the natural environment such as deep sea ocean thermal vents thermal geysers and hot springs Microorganisms isolated from these environments can tolerate high temperatures and acidic conditions and can obtain their metabolic energy from sulfur or other inorganic compounds instead of photosynthetically derived carbon dioxide molecules which increases the range of available energy pathways
In thermochemical conversion key focus areas include developing a better understanding of the fundamentals of gasification pyrolysis and hydrothermal liquefaction processes including reaction mechanisms improving reactor designs improving the quality of deconstructed intermediates developing more robust catalysts and catalyst regeneration processes and developing catalysts with improved specificity Considerable RampD is
Quadrennial Technology Review256
7 Advancing Systems and Technologies to Produce Cleaner Fuels
being conducted on catalyst life extension easier regeneration of catalysts and development of non-rare-earth catalysts Discoveries in these areas will reduce the cost of upgrading raw bio-oils and make pyrolysis-derived biofuels cost competitive65
74 Hydrogen Production and Delivery
As a clean fuel in the energy sector hydrogen can be used in highly efficient fuel cells for transportation and stationary power applications in internal combustion engines and as an energy carrier and storage medium in grid modernization and other applications66 In the United States more than 8000 fuel cell forklifts and more than 5000 fuel cell back-up power units have been deployed In addition light-duty fuel cell electric vehicles (FCEVs) are now becoming available for lease and for sale67 As discussed in Chapter 8 the use of hydrogen with FCEVs in the transportation sector can have a significant impact on reducing GHG emissions with greater than 80 reductions achievable Additionally environmental and energy benefits of hydrogen and fuel cells in energy storage and in power sectors are detailed in Chapters 3 and 4 respectively
Hydrogen is already a well established chemical commodity in various industrial sectors Today hydrogen is most commonly used as an industrial feedstock for refineries and ammonia production The refinery and fertilizer industries have produced and used hydrogen for decades and worldwide demand is increasing The United Statesrsquo hydrogen consumption including imports is more than 10 million tonnes per year and worldwide consumption is approximately 23 million tonnes per year68 The United States currently produces about nine million tonnes annually mainly from fossil fuels This production volume is equivalent to a little more than one quadrillion Btus per year (1 of the United Statesrsquo energy consumption)mdashenough to power at least 40 million FCEVs For diverse industrial applications hydrogen serves as a clean energy carrier that can be produced using a variety of domestic resources as illustrated in Figure 718
Figure 718 Hydrogen Offers Important Long-Term Value as a Clean Energy Carrier
257
7
The majority of the worldrsquos hydrogen is currently produced at or near the petroleum refineries and ammonia plants that require it as a chemical feedstock In North America hydrogen is most commonly produced using steam methane reforming (SMR) of natural gas According to the 2012 NPC Future Transportation Fuels Study Advancing Technology for Americarsquos Transportation Future69 large hydrogen production facilities (gt18000 kg per day) exist in nearly every state in the United States as illustrated in Figure 719 In other countries such as China and India coal is the primary feedstock70 In all these cases carbon capture use and storage can be used to lower or remove the carbon footprint of the hydrogen produced through the reforming of fossil feedstocks but this process is yet to be deployed at low cost and at scale
Figure 719 Existing Centralized Hydrogen Production Facilities in the United States (from the hydrogen chapter of the 2012 NPC Future Transportation Fuels Study)69
Credit National Petroleum Council
In the near term the hydrogen production and delivery infrastructure demands of the emerging FCEV market need to be met Leveraging the synergies between natural gas and hydrogen delivery infrastructure and existing hydrogen production capacity based on natural gas reforming can facilitate meeting these near term needs In the long term realizing the environmental and security benefits of hydrogen in the energy sector will require RDDampD of a portfolio of safe low-cost low-carbon hydrogen production and delivery methods relying on domestic resources
741 Hydrogen Production and Delivery Technologies
Hydrogen for transportation fuel can be produced off-site at central facilities and transported to retail fueling stations or produced at the station through a wide variety of pathways represented in Figure 720 When hydrogen is produced at the station it is referred to as distributed or forecourt production At the retail refueling station prior to dispensing to the vehicle hydrogen is compressed to high pressure for onboard storage71
Quadrennial Technology Review258
7 Advancing Systems and Technologies to Produce Cleaner Fuels
Figure 720 Many possible pathways for production and delivery of hydrogen exist They vary in scale (semi-central to central production ranges from 50000 to greater than 500000 kg per day while distributed production is up to 1500 kg per day) and time frame for development as well as in potential cost and GHG emissions78
Hydrogen Production
There are many different pathways to produce hydrogen72 Numerous low-carbon pathways include reforming of biomass or fossil fuels such as natural gas and coal with CCS and the splitting of water using sustainable andor renewable energy sources such nuclear wind solar geothermal and hydro-electric power Most of the hydrogen production technologies fall into three general categories thermal electrolytic and photolytic
Thermal processes include reforming of natural gas or biofuels gasification of coal and biomass and thermochemical processes73 Reforming the most widely deployed technology today uses high-temperature steam (700degCndash1000degC) to produce hydrogen from a methane source Sources can include natural gas biogas generated from various biogenic renewable sources and biomass74 Reforming is suitable for both the central and distributed scale Other thermochemical processes use heat (500degCndash2000degC) to drive a series of chemical reactions that produce hydrogen from water Thermochemical water-splitting processes are best suited for large-scale central production
Electrolytic processes produce hydrogen and oxygen from water using electricity in an electrolyzer75 Electrolyzers can range in size from small appliance-size equipment well suited for small-scale distributed hydrogen production to large-scale central production facilities Hydrogen produced via electrolysis can result in minimal GHG emissions when low-carbon or zero-carbon electricity is used Low-temperature electrolyzers are commercially available and are in use at some hydrogen fueling stations High-temperature electrolysis systems typically operated at temperatures greater than 750degC with higher electrical efficiency compared with lower temperature electrolyzers are applicable for use at nuclear reactors and solar thermal facilities taking advantage of the high-grade heat generated by these technologies
259
7
Photolytic processes use the energy in sunlight to separate water into hydrogen and oxygen and can be further classified into two general categories photoelectrochemical (PEC) and photobiological In PEC hydrogen production specialized semiconductor devices harness sunlight to split water76 In photobiological production specialized microorganisms such as green algae and cyanobacteria use the energy from sunlight to produce hydrogen77 These pathways have long-term potential for sustainable hydrogen production with low environmental impact but are in relatively early stages of RampD
Alternatively hydrogen can also be produced through microbial biomass conversion processes which do not require light such as fermentation or microbial electrolysis cells These microbes can consume organic matter like corn stover or wastewater to produce hydrogen This pathway could be suitable for central hydrogen production or even distributed production for waste stream feedstocks
Hydrogen Delivery
As seen in Figure 721 a wide range of hydrogen delivery technologies is available to serve existing and emerging markets Hydrogen delivery includes the infrastructure required to move and store hydrogen from the point of production to the vehicle This includes transmission distribution and refueling station operations There are three main transmission and distribution pathways pipeline tube trailer and liquid truck The gaseous hydrogen transmission and distribution pathway is very similar to natural gas distribution today Pipelines can be made with steel or fiber reinforced polymer pipe and operate at seventy to 100 bar Gaseous tube trailers carry hydrogen in large pressurized storage cylinders These can either be steel cylinders at 180 bar or high-pressure composite cylinders that can carry hydrogen at pressures as high as 500 bar Typical steel tube trailers can carry approximately 280 kilograms (kg) while the high-pressure tube trailers can carry close to 1000 kg Geologic storage is typically used in large-scale gaseous transmission and distribution
Figure 721 Hydrogen Production and Delivery RDDampD Opportunities and Key Focus Areas96
Hydrogen can be distributed as a liquid During this process the hydrogen is cooled below -253degC (-423degF) using liquid nitrogen and a series of compression and expansion steps The cryogenic liquid hydrogen is then stored in large insulated tanks loaded into delivery trucks and transported to the point of use or stored in vacuum-jacketed tanks until it is used After on-site production or distribution to the point of use the hydrogen goes through compression storage and dispensing at the retail fueling station in order to serve the vehicle market The hydrogen in light-duty FCEV tanks is pressurized to 700 bar in order to store the approximately five
Quadrennial Technology Review260
7 Advancing Systems and Technologies to Produce Cleaner Fuels
kg of hydrogen needed to enable a 300-mile vehicle range based on the mile per gallon of gasoline equivalent (mpgge) of todayrsquos FCEV within the space available onboard the vehicle79 80 The hydrogen is stored at 875ndash1000 bar which requires cooling during the compression process It must be pre-cooled during dispensing to achieve a three- to five-minute fill time without overheating the storage tank Therefore thermal management is a key consideration in cost-effective station design The heavy-duty vehicle market operates similarly except that the hydrogen onboard the vehicles is stored at 350 bar rather than 700 bar since larger vehicles are less constrained with respect to space and lower-pressure vessels provide a cost and weight advantage This is current practice for transit buses and it is expected that heavy-duty trucks would operate similarly
742 Current Status and Accomplishments
Hydrogen production and delivery technologies span a range of development stages A small number of hydrogen production technologies are currently used commercially or are approaching commercial readiness These include natural gas and biogas reforming as well as electrolysis Other technologies particularly renewable production pathways such as solar water splitting require additional RDDampD
Recent technology advancements have reduced the cost of distributed hydrogen at retail fueling stations to less than $450 per gallon of gasoline equivalent (gge) [assuming high-volume production and widespread deployment]81 This applies to hydrogen produced by SMR and dispensed at 700 bar and is valid over a wide range of natural gas prices At the lower end of the range of natural gas prices hydrogen cost drops below the 2020 target of less than $4 per gge82 for FCEV cost-competitiveness with other vehicle technologies83 For early markets the interim target is less than $7 per gge84 CCS would reduce the associated GHG emissions with the mature SMR pathway Ongoing demonstration projects (eg a DOE-sponsored project at a hydrogen production facility in Port Arthur Texas) that capture and store CO2 from SMR plants are aimed at demonstrating the viability of this CCS approach but widespread commercial deployment will depend on improvements in the benefit-cost ratio through further RDDampD In the near term low-carbon hydrogen can also be produced through reforming biogas (ie renewable natural gas) either through modified SMR or using high temperature fuel cells that can simultaneously generate power heat and hydrogen (typically called combined heat hydrogen and power or CHHP) with a lower carbon footprint than natural gas SMR85
Electrolysis is also a commercial technology typically used today for small- to mid-scale hydrogen production but scalable to larger megawatt-scale systems There is growing interest particularly in locations where emissions standards are in place (eg Europe California) for pairing water electrolysis with ldquogreenrdquo electricity as a way to use renewable electricity that otherwise would be curtailed during periods of low demand Biomass gasification is a promising near-term technology that has not yet been commercialized at scale Figure 722 summarizes the current range of production costs86 Through RDDampD in recent years production costs have dropped from nearly $650 per kg in 2006 to approximately $5 per kg in 2013 for electrolysis and from nearly $3 per kg in 2006 to about $250 per kg in 2013 for biomass gasification (at high volume)
Current industrial production capacity could potentially provide sufficient hydrogen fuel for early-market FCEV deployment87 Going forward demand growth would require increased capacity with a priority on hydrogen production from renewable andor low-carbon pathways To meet this demand a portfolio of low-carbon hydrogen production pathways would be needed including emerging options such as microbial biomass conversion photobiological production and solar-based thermo- and photoelectrochemical water-splitting which require additional RDDampD to reach commercial readiness
In all hydrogen production pathways high conversion efficiencies are critical to reducing the hydrogen cost To date feedstock-to-hydrogen energy conversion efficiencies exceeding 70 have been demonstrated for SMR while ~46 has been achieved in biomass gasification89 Hydrogen can also be produced by coupling
261
7
Figure 722 Current Range of Hydrogen Production Costs (undispensed and untaxed reported in $kg including feedstock and capital cost variability assuming high volume production and widespread commercialization)88
$00 $10 $20 $30 $40 $50 $60 $70
Biomass Gasification (Central)
PEM Electrolysis (Central and Distributed)
SMR (Central and Distributed)
Hydrogen Production Cost ($kg)
natural gas combined cycle power plants with water electrolysis systems Conversion efficiencies of ~32 have been achieved with this approach using commercial low-temperature electrolyzers (including 67 electric-to-hydrogen electrolyzer efficiency and 48 efficiency for the upstream natural gas combined cycle power plant) with efficiencies greater than 50 achievable using advanced high-temperature electrolyzers operating above 800degC90 Higher conversion efficiency reduces feedstock requirements and lowers cost Continued RDDampD focused on improving efficiencies can reduce hydrogen costs in all the near- to longer-term technologies
In conjunction with the current industrial production capacity to support early-market FCEV deployments significant hydrogen delivery infrastructure is in place to serve the industrial market The United States has more than 1500 miles of hydrogen pipelines primarily along the Gulf Coast91 The Praxair salt dome cavern on the Gulf Coast is one of the largest hydrogen storage systems in the world with 14 billion cubic feet of working storage California is the first state making significant investments in hydrogen infrastructure for the light-duty vehicle market working to achieve a target of one hundred hydrogen refueling stations by 202092 There will be twenty-eight stations open by the end of 2015 with twenty-three more stations planned to open in 201693 94
High-pressure gaseous tube trailer delivery is the lowest-cost delivery method to serve the near-term vehicle market (Table 76) This is attributable to the decrease in compression required at the station when the gas is delivered at high pressure Relatively small amounts of gaseous hydrogen can be transported short distances by high-pressure (up to 500 bar) tube trailers A modern high-pressure tube trailer is capable of transporting nearly 1000 kg of hydrogen Gaseous transmission and distribution through pipelines remains the lowest-cost delivery option for large volumes of hydrogen The high initial capital associated with this pathway constitutes a major barrier to the construction of new hydrogen pipelines
The liquid hydrogen pathway is a well-developed and competitive method of providing hydrogen for high-demand applications that are beyond the reach of hydrogen pipeline supplies It is more economical than gaseous trucking for high market demands (greater than 700 kg per day) and has longer delivery distances because a liquid tanker truck with a capacity of approximately 4000 kg can transport more than four times the capacity of a 500-bar gaseous tube trailer The nine existing liquefaction plants in North America vary in production size from 5400-62000 kg of hydrogen per day Table 74 shows the current costs for a range of hydrogen delivery pathways at high volume
Quadrennial Technology Review262
7 Advancing Systems and Technologies to Produce Cleaner Fuels
Table 76 Hydrogen Delivery Cost as a Function of Dispensed Gas Pressure and Delivery Pathway as Reported from the Hydrogen Delivery Scenario Analysis Model (to the nearest 005)95
Dispensing pathways 350 bar 700 bar
Delivery costs ($kg hydrogen delivered and dispensed)
Pipeline 445 485
Pipelinemdashtube trailer 315 320
Tube trailer 300 330
Pipelinemdashliquid tanker NA 375
Liquid tanker NA 325
743 RDDampD Opportunities
Cost reduction of at-scale technologies remains the key challenge in the production and delivery of hydrogen particularly from low-carbon sources for use in fuel cell electric vehicles The critical barriers and strategies for reducing the cost of hydrogen production and delivery are shown in Figure 723 Since high-volume market penetration is an essential factor for any cost reduction lowering the cost of hydrogen for 700 bar refueling to accelerate the introduction of FCEVs into the market place is an important near-term requirement Identifying RDDampD priorities will rely on techno-economic analysis and modeling to identify refueling station equipment and processes that can reduce refueling cost the most along with cost mitigation approaches based on technology improvements Broader RDDampD opportunities addressing longer-term needs include lowering the cost of hydrogen from renewable and low-carbon sources through process and materials development
The thermal production processes such as bioderived liquid reforming and coal and biomass gasification could achieve reduced capital cost through improved catalysts and low-cost separation and purification technologies Electrolysis systems are another near-term hydrogen production pathway that requires additional research to reduce costs and improve efficiency in particular Currently feedstock cost is the most significant contributor to the hydrogen cost from this pathway As a result it is important to focus on improving the process efficiency while reducing the capital cost Development of load-following capability would provide more economical system operation during times of low demand The cost of low-temperature electrolysis could be up to 10 lower if efficiency increased 10 from 67 production efficiency to 74 Chapter 4 discusses coal gasification cost and performance
The costs of all emerging production pathways need to be significantly reduced for hydrogen to become a major contributor to transportation fuel As material costs and performance improvements are needed for most of these pathways promising areas of RDDampD with impacts on multiple pathways are high throughputcombinatorial approaches to enable rapid identification and development of promising materials systems as appropriate PEC production requires RDDampD to develop materials with the appropriate band gap to both absorb sunlight and electrolyze water in a single device while solar thermochemical hydrogen production pathways require identification and development of efficient and durable materials to design a cost-effective reactor system Photobiological approaches require fundamental research in a number of areas such as direct water splitting using microalgae or cyanobacteria and optimization of energy flows and electron flux Microbial biomass conversion methods such as fermentation require research to improve hydrogen production yields and rates
263
7
A high-temperature advanced nuclear reactor coupled with one of the high-temperature technologies (thermochemical cycles electrolytic and hybrid thermochemicalelectrolytic) could achieve a thermal-to-hydrogen conversion efficiency of 45 to 55 However this technology is not yet ready for commercialization There are challenges regarding the high temperature and the design of corrosion-resistant materials To address these system design development is needed to study the hydrogen plant and its relationship to the reactor including configuration options and operating conditions system isolation issues and intermediate heat transfer loop design Chapter 4 on power technologies contains a discussion on related nuclear energy RDDampD
Hydrogenrsquos low volumetric density poses a challenge with respect to the costs of storage and delivery necessitating further RDDampD to improve the efficiency cost and reliability of compression storage and delivery technologies for 700-bar refueling This can be achieved through researching new materials for high-pressure dynamic and static seals developing new compression technologies such as linear motor metal hydride and thermal compressors and demonstrating alternative refueling and control algorithms to lessen the burden on the station Longer-term priorities in delivery include developing advanced technologies for liquefaction geologic storage and pipelines and pipeline compressors Issues such as hydrogen embrittlement and safety clearly must be addressed addressing these challenges requires continued materials compatibility RDDampD With successful technology development hydrogen delivery costs could be reduced by more than 50 (2020 target is less than $2 per gge97 versus todayrsquos cost of $3ndash$5gge) that would enable economic competitiveness of hydrogen FCEVs with gasoline ICEs
Figure 723 summarizes the near- medium- and long-term research areas For both production and delivery technology pathways it is necessary to continue developing and testing innovative materials components and systems
Figure 723 RDDampD areas and time frames for Hydrogen Production and Delivery
Research opportunitiesNear term
(2ndash5 years)
Medium term
(5ndash10 years)
Long term
(gt10 years)
Compression and storage at fueling stations
Distributed scale liquefaction and pipeline technologies
High-pressure ube trailers t
Bioliquids reforming biomass and coal gasification
Sustainable low-carbon hydrogen (eg biological thermochemical photo-electrochemical)
Quadrennial Technology Review264
7 Advancing Systems and Technologies to Produce Cleaner Fuels
The major challenge is to reduce the cost of producing and delivering hydrogen from renewable and low-carbon sources using a portfolio of technologies that are scalable and that meet industrial performance and safety requirements To reduce costs continued RDDampD is needed to improve materials systems and scaled technologies for diverse hydrogen production and delivery options Near-term cost reductions can be achieved by leveraging the synergies between natural gas and hydrogen delivery infrastructure and the existing hydrogen production capacity This is important to support the early market deployment of FCEVs and to promote development and deployment of the hydrogen production and delivery technologies and infrastructure needed to sustain market growth The longer-term priority is to transition to the sustainable and low-carbon options for hydrogen production and delivery to fuel growing markets in the transportation stationary heat and power and energy storage sectors
75 Other Alternative Transportation Fuels
Several alternatives to the three major classes of fuel discussed above (oil and gas biofuels and hydrogen) that have been and continue to be explored for potential environmental and security benefits Most of these options emit fewer GHGs over production and use cycles and fewer criteria pollutants at the point of use All can be produced from abundant domestic resources within the United States To date they all have some barriers to widespread deployment in the United States Some of these barriers are inherent in the fuels (eg methanolrsquos toxicity) while others require additional fundamental basic research The DOE Office of Science actively supports the development of several transformational technologies through activities such as the Joint Center for Artificial Photosynthesis (see textbox Joint Center for Artificial Photosynthesis)
Joint Center for Artificial Photosynthesis
Fuels from Sunlight Energy Innovation Hub Goals Challenges and Progress
Increased solar energy utilization is helping the United States meet growing energy demands The ability to generate commercial fuels directly from sunlight holds great promise as a new innovation in energy production potentially enabling fossil fuels to be replaced with solar fuels Through the process of photosynthesis plants and some microbes convert sunlight into energy-rich chemical fuels using the abundant feedstocks of water and carbon dioxide It would be enormously beneficial to develop an artificial system capable of generating fuels directly from sunlight using just water and carbon dioxide in a manner analogous to the natural photosynthetic system Despite decades of basic research advances however it is not yet possible to produce solar fuel generation systems with the required efficiency scalability and sustainability to be economically viable
In 2010 DOE established the Fuels from Sunlight Energy Innovation Hub the Joint Center for Artificial Photosynthesis (JCAP) which is focused on transformative advances needed to enable artificial photosynthesis The goal of this multidisciplinary multi-investigator and multi-institutional effort is demonstrating systems that convert sunlight water and carbon dioxide into a range of commercially useful fuels JCAPrsquos overall approach is to develop robust concepts and designs for complete solar-fuels generators define the essential assemblies of active components for the generators and then discover or adapt materials needed to fabricate the assemblies
More information on JCAP can be found at this website httpsolarfuelshuborg
265
7
751 Natural Gas as a Transportation Fuel
Natural gas fueled vehicles are a well-established mature industry Millions of natural gas vehicles are on the road worldwide today yet in the United States only a small fraction of cars and trucks use natural gas There are three principal ways in which natural gas is employed for vehicles 1) as compressed natural gas (CNG) 2) as liquefied natural gas (LNG) or 3) converted via chemical processes into a liquid fuel Historical barriers to expanded use of natural gas in vehicles include the lack of an infrastructure for distribution and vehicle fueling the significant additional cost of vehicle hardware such as natural gas fuel tanks and uncertainty concerning natural gas prices over the long term
LNG for Long-Haul Trucks
Displacing diesel fuel with LNG in Class 8 long-haul trucks (18-wheelers travelling long routes) is of increasing interest within private industry The lower cost of natural gas has the potential for significant fuel cost savings Developing a fueling infrastructure for LNG long-haul trucks presents a significant challenge but is one the market is beginning to pursue With a continued positive business case private industry is beginning to make the investments needed for such an infrastructure
CNG for Fleets
Widespread adoption of CNG centralized fleets of light- and medium-duty vehicles is primarily hindered by the higher initial vehicle purchase price and large up-front infrastructure costs Municipal buses delivery vehicles and other fleet vehicles have turned to natural gas primarily for air quality concerns not because of economic advantages Unlike long-haul trucks such fleets do not travel as many miles or use as much fuel which makes the payback period much longer For medium-duty vehicles the incremental cost typically takes twelve to fifteen years to recover out of a twenty- to thirty-year lifespan Light-duty vehicles may never recover the initial incremental cost premium because of their shorter service life There are also significant infrastructure costs that must be accounted for A CNG station is required ($400000ndash$1000000) and fleet maintenance facilities must be updated at additional cost to handle gaseous fuels
CNG for Private Vehicles
In the light-duty personal vehicle market lack of a ubiquitous fueling infrastructure and high vehicle cost (relative to gasoline-fueled vehicles) combine to present an overwhelming challenge to mass market consumer acceptance Today there are roughly 160000 gasoline service stations in the United States Creating a similar nationwide infrastructure for natural gas refueling at even a fraction of those service stations would be prohibitively expensive ($100 billion or more) Range limitations with natural gas represent an additional hurdle to widespread adoption
Chemical Conversion of Natural Gas to Liquid Fuels
Natural gas can be converted into liquid fuels using two main chemical processes but neither is commercially available at scale in the United States The first approach employs a widely used technology known as ldquoFischer-Tropschrdquo to produce a number of products including diesel fuel Additional discussions on this process can be found later in the section dealing with coal to liquids Another approach is used to produce methanol from natural gas Methanol is already produced from natural gas in very large quantities for industrial purposes at costs roughly equivalent to gasoline It could be used as a blend much like ethanol or converted to gasoline through a commercially available process
Quadrennial Technology Review266
7 Advancing Systems and Technologies to Produce Cleaner Fuels
LNGCNG Distribution
CNG stations receive fuel via a local utility line at a pressure lower than that used for vehicle fueling The station compresses the gas to a higher pressure for vehicle fueling Described below are the three types of CNG stations fast-fill time-fill and combination-fill The main structural differences are the amount of storage capacity size of the compressor(s) and dispensing rate
Fast-fill The compressor and storage capacity for fast-fill stations are designed such that drivers experience fill times similar to those for gasoline or diesel fueling stations
Time-fill This equipment fills CNG vehicles over a period of hours and is typically used by fleets with vehicles that fuel at a central location each night The time it takes to fuel a vehicle depends on the number of vehicles the amount of fuel required and the throughput of the compressor Vehicles are unattended during the fueling process which can take minutes to hours
Combination-fill At combination-fill stations users have the ability to time-fill or fast-fill vehicles on demand Many fleets use the convenience of time-fill as the primary method of fueling with fast-fill available as needed
Conclusion
While sales of natural gas-powered cars and trucks are small the technology to build such vehicles is well known The primary barriers to expanded use of natural gas in vehicles have been concerns about the future price of natural gas and the absence of an infrastructure to deliver the gas Centrally fueled fleet vehicles (such as medium-duty trucks) offer the most mature market for using natural gas directly in the transportation sector but this market represents a small percentage of our on-road fuel consumption It would be significantly more complex to create an infrastructure that would allow a significant fraction of cars to operate on natural gas In addition there are climate concerns about methane and carbon emissions
Technology improvements that could encourage expanded use of natural gas include the following Cheaper onboard fuel storage and home-fueling compressors Broader range of available engine options for medium- and heavy-duty trucks Improved techniques for conversion of natural gas to conventional fuel (gas-to-liquids)
752 Ammonia and Carbon-Free Energy Carriers
Controlling carbon emissions from fossil energy resources will require systems for CCS In the transportation fuels space fossil resources can be converted to carbon-free energy carriers at a central location where CCS can be used and then fuel can be distributed for use The most common forms of such energy carriers currently recognized are electricity (discussed in Chapter 6) and hydrogen (discussed in Chapter 8)
An important question is what other carbon-free energy carriers might be used One proposed option is ammonia Along with hydrogen ammonia has no carbon emission when combusted because it doesnrsquot contain carbon Existing infrastructure and current transportation energy systems are compatible with ammonia with relatively modest changes Ammonia also has a high octane rating (about 120 versus gasoline at 86ndash93) and can be used in high compression engines However it has a relatively low energy density per gallonmdashabout half of gasolinemdashso its fuel mileage is about half of gasolinersquos mileage Issues also remain with toxicity especially from ammonia vapor
753 Coal (Biomass and Hybrid Systems) to Liquids
Coal-to-liquids (CTL) account for a small share of world liquids production but is expected to increase assuming petroleum costs rise in the future In particular CTL accounted for the equivalent of 019 million
267
7
barrels per day in 2012 EIA98 projects that number to grow to 112 million barrels per day by 2040 Nearly all of this increase is expected in China
Historically the CTL process has been used to convert coal into a substitute for liquid fuels in countries with a large coal resource and limited petroleum supplies CTL includes both direct coal liquefaction technologies and coal gasification combined with Fischer-Tropsch synthesis to produce liquid fuels Following the oil crisis of the 1970s significant coal liquefaction RampD was undertaken in Australia Europe Japan and the United States but much of this RampD was put on hold as oil prices stabilized from the mid-1980s through the 1990s Owing to higher oil prices following that period interest increased in CTL and biomass to liquids including coprocessing coal and biomass (CBTL) China in particular has aggressively pursued conversion of CTL Since 2005 China has developed three demonstration level CTL plants producing 4500 barrels per day of products Their largest CTL plantmdashproducing 100000 barrels per daymdashwill be completed in 2016 and six more mega projects are scheduled The most ambitious project will be the largest CTL plant in the world producing four million tons per year
Ongoing interest in reducing GHG emissions from energy production has resulted in increased effort to reduce GHGs from CTL production since conversion results in GHG emissions significantly higher than conventional petroleum Approaches for reducing GHGs include the following
Capturing and geologically storing CO2 produced during the CTL process This is attractive because 91 of CO2 produced in the coal conversion process is in a concentrated stream that can be easily captured
Coprocessing coal and biomass to produce liquid fuels Adding CCS to this CBTL process dramatically reduces GHGs because biomass conversion results in low GHGs and when CCS is introduced the biomass component becomes carbon negative
A 2009 study99 found that for a commercial process that converts coal into diesel fuel coupling the process with carbon sequestration is relatively inexpensive adding only seven cents per gallon Furthermore this small investment reduces the GHG emissions dramatically from 147 above the petroleum-derived diesel baseline to 5 below it The study looked at one technology enhancement (addition of an auto thermal reactor) that further reduced GHGs but it did not consider ongoing RampD that will make the gasification process even more efficient and cost-effective
Systems combining various inputs of biomass and coal converting them at a central facility to liquid fuels and electric power and using CCS on CO2 released at that facility have been analyzed and these studies variously identify net positive neutral or negative carbon emissions100 The differences between cases depends on the balances of inputs and outputs The fraction of input energy from biomass is a key factor as biomass draws CO2 from the atmosphere during growth then when the biomass is converted to fuels and power using CCS can enable a net drawdown of CO2 from the atmosphere for that portion This is balanced against the portion used as fuel for which CCS is not practical The challenge is that these fuel conversion and CCS systems have cost savings from increasing scales but biomass feedstock costs increase with the scale of the facility due to the large required collection areas and logistical costs Research to reduce costs for smaller facilities and to improve biomass productivity and logistics could help address these factors
754 Fuel Methanol and Dimethyl Ether
Methanol (CH3OH) also known as wood alcohol is considered an alternative fuel under the Energy Policy Act of 1992 Methanol was marketed in the 1990s as an alternative fuel for compatible vehicles At its peak nearly six million gasoline gallon equivalents of 100 methanol and 85 methanol15 gasoline blends were used annually in alternative fuel vehicles in the United States As an engine fuel methanol has chemical and physical fuel properties similar to ethanol Methanol use in vehicles has declined dramatically since the early 1990s
Quadrennial Technology Review268
7 Advancing Systems and Technologies to Produce Cleaner Fuels
and automakers no longer manufacture methanol vehicles in the United States although it is still a popular fuel worldwide It is generally produced by steam-reforming natural gas to create a synthesis gas Feeding this synthesis gas into a reactor with a catalyst produces methanol and water vapor Various feedstocks can produce methanol but natural gas is currently the most economical in North America (in China coal is preferred)
Methanol can be an alternative to conventional transportation fuels The benefits of methanol include the following
Lower production costs Methanol is inexpensive to produce relative to other alternative fuels Improved safety Methanol has a lower risk of flammability compared to gasoline Increased energy security Methanol can be manufactured from a variety of carbon-based
feedstocks such as natural gas and coal Its use could also help reduce the United Statesrsquo dependence on imported petroleum
Dimethyl ether (DME) represents an alternative to CNG and LNG as a natural gas-derived transportation fuel It can be synthesized from methanol via dehydration In contrast to CNG which requires onboard storage at high pressures (250 bar3600 psi) and LNG which requires low temperatures (-162degC) DME behaves like propane in that it is liquid at ambient temperatures and moderate pressures Its combustion characteristics are well suited for use in diesel applications such as trucks buses and construction equipment As a compression ignition fuel DME is considered ldquoclean burningrdquo in that it is less likely to produce particulate (soot) emissions than diesel or bunker fuel DME is also nontoxic and is not itself a GHG DME has lower energy density (189 megajoules per liter) however than diesel (373 megajoules per liter) Combustion studies and engine demonstrations of DME as a compression ignition fuel were performed throughout the 1990s but further activity was halted when the price of natural gas increased nearly tenfold in 2000 Three important developments offer new research opportunities for DME 1) the discovery of large domestic supplies of natural gas and subsequent price stabilization 2) recent developments in advanced combustion regimes for engines and 3) process developments to convert natural gas to DME in retail outlet quantities By making and dispensing DME on-site distribution through the existing natural gas infrastructure could provide a pathway to DME-fueled transportation with minimal infrastructure upgrades Of course the combustion products of DME include CO2 which must be controlled to address climate change
76 Conclusion
Each fuel has strengths and shortcomings and the fuel system must meet several challenging needs economic prosperity requires low-cost fuels energy security requires stable abundant domestic resources and meeting environmental goals requires reduction of greenhouse gas emissions and other externalities This chapter explores options to address each of these challenges in oil and gas in bioenergy for fuels and in hydrogen production and distribution as well as for other fuel options
Oil and Gas
Until recently domestic oil and natural gas production was in decline but because of technology advances in hydraulic fracturing among others the United States is now the worldrsquos largest producer of these fuels While oil and gas are low cost have good economics are abundant and support national security they have a poor carbon footprint and other environmental challenges
Bioenergy for Fuels
Bioenergy from a variety of feedstocks can be converted to a wide variety of products and liquid fuels and offer the potential to significantly reduce the GHG emissions associated with liquid fuel use While ethanol from corn is an established industry advanced pathways to use cellulosic lignin and waste inputs are just now
269
7
beginning to enter the market but could scale up domestic low-carbon fuel production if key technology cost scalability and land use challenges can be met
Hydrogen
Hydrogen is an energy carrier that can be produced from a variety of energy resources It is produced in large quantities today from natural gas Technology options such as electrolysis from low-carbon electricity direct reforming of fossil fuels with CCS or production from biomass (possibly with CCS to achieve negative carbon emissions) can produce hydrogen for fuel with a very low carbon footprint from domestically available energy resources Challenges include technology costs of these low-carbon resources as well as distribution and fueling infrastructure
Future Prospects
The QTR identifies many opportunities for RDDampD to support the future of fuels in the United States After several decades of generally flat (gas) or declining (oil) production production of shale gas and oil has sharply increased in the United States in the past half-dozen years Commercial production of cellulosic biomass fuels began in 2014 after many years of research and development Public-private partnerships are now beginning to supply hydrogen for the new consumer FCEV market Each of these fuels will pose tradeoffsmdashcost performance infrastructure security climate impact and othersmdashacross different time frames A strong understanding of the technological options in the fuels sector through the QTR can support an informed RampD strategy going forward (Table 77)
Table 77 Summary of RDDampD Opportunities
Area RDDampD opportunities
Oil and gas Minimizing the safety and environmental impacts of unconventional oil and gas development protecting groundwater increasing water availability and protecting air quality
Mitigating risk of offshore oil spills Reducing methane leaks associated with pipelines and compressors Understanding induced seismicity Develop understanding required for commercial production of natural gas from natural
hydrate deposits Controlling carbon emissions with CCS where used at scale
Bioenergy for fuels Reducing costs of feedstock production and improving logistics and conversion Producing and managing a consistent aerobically stable suite of lignocellulosic feedstocks Improving enzymes and microorganisms for biochemical pathways and improving
catalysts and processes for thermochemical pathways Producing high-value bioproducts and biobased inputs to chemicals
Hydrogen Reducing costs of converting the end-to-end fuels infrastructure to accommodate hydrogen Reducing costs of hydrogen production from low- or zero-carbon resources Exploring new materials to improve efficiencies performance durability cost and safety
Quadrennial Technology Review270
7 Advancing Systems and Technologies to Produce Cleaner Fuels
Technology AssessmentsChapter 7 Advancing Systems and Technologies to Produce Cleaner Fuels
7A Bioenergy Conversion
7B Biomass Feedstocks and Logistics
7C Gas Hydrates Research and Development
7D Hydrogen Production and Delivery
7E Natural Gas Delivery Infrastructure
7F Offshore Safety and Spill Reduction
7G Unconventional Oil and Gas[See online version]
Supplemental Information
Oil and Gas Technologies
Subsurface Science and Technology
[See online version]
Endnotes1 Energy Information Administration ldquoAnnual Energy Outlookrdquo 2015 Table A2 Note For industry and buildings most of the energy not
directly supplied by fuels is from electricity for which upstream electricity-related generation and other losses are included in the total for energy use by the sector and in the calculation for the share of energy that direct fuel use provides
2 Energy Information Administration ldquoAnnual Energy Outlookrdquo 2015 Table 373 As of June 24 2015 the US Department of Energy has granted final approval to export LNG to non-Federal Transit Administration countries
from the following LNG Terminals Sabine Pass LNG Terminal (22 Bcfd) Freeport LNG Terminal (18 Bcfd) Cameron LNG Terminal (17 Bcfd) Dominion Cove Point (077 Bcfd) Corpus Christi LNG Terminal (21 Bcfd)
4 Energy Information Administration ldquoAnnual Energy Outlookrdquo 20155 National Research Council Council on Benefits of DOE RampD on Energy Efficiency and Fossil Energy Board on Energy and Environmental
Systems Division on Engineering and Physical Sciences ldquoEnergy Research at DOE Was it Worth Itrdquo 2001 Energy Efficiency and Fossil Energy Research 1978 to 2000 2001 p 201
6 Energy Information Administration ldquoAnnual Energy Outlookrdquo 20157 In Re Oil Spill by the Oil Rig ldquoDeepwater Horizonrdquo in the Gulf of Mexico on April 20 2010 No 10-2771 and No 10-4536 Findings of Fact
and Conclusions of Law Phase Two Trial at 43-44 (EDLA Jan 15 2015) Available at httpwww2epagovsitesproductionfiles2015-01documentsphase2rulingpdf
8 National Petroleum Council ldquoPrudent Development Realizing the Potential of North Americarsquos Abundant Natural Gas and Oil Resourcesrdquo 2011 Table 1-3 Natural Gas Resource Base p 72
9 Ibid Table 1-1 Natural Gas Resource Base p 65
271
7
10 Energy Information Administration ldquoToday in Energy September 11 2012 Pad Drilling and Rig Mobility Lead to More Efficient Drillingrdquo Available at httpwwweiagovtodayinenergydetailcfmid=7910
11 Ibid12 Society of Petroleum Engineers PetroWiki Available at httppetrowikiorgDirectional_deviation_tools13 US Department of Energy Office of Fossil Energy ldquoEnvironmental Benefits of Advanced Oil and Gas Exploration and Production Technologyrdquo
Available at httpwwwnetldoegovkmdcdsdisk25oilandgaspdf14 US Department of Energy ldquoModern Shale Gas Development in the United States A Primerrdquo April 2009 p ES-315 US Environmental Protection Agency ldquoTechnical Workshops for the Hydraulic Fracturing March 2011 Novel and Emerging Technologies for
Produced Water Treatmentrdquo Available at httpwww2epagovsitesproductionfilesdocuments18_Xu_-_Treatment_Technologies_508pdf16 National Commission on the BP Deepwater Horizon Oil Spill and Offshore Drilling Report to the President ldquoDeepwater the Gulf Oil Disaster
and the Future of Offshore Drillingrdquo Chapter 417 Society of Petroleum Engineers PetroWiki ldquoExpandable Tubularsrdquo Available at httppetrowikiorgExpandable_tubulars18 US Department of Energy National Energy Technology Laboratory ldquoPartners Progressrdquo March 1999 p 4 Available at httpwwwnetldoe
govkmdcdsdisk23N-NewslettersNational20Lab20Partnership20Newsletters5C1999-03pdf19 US Department of Energy National Energy Technology Laboratory ldquoCementrdquo (article section) Available at httpwwwnetldoegovkmdcds
disk11advdrillinghtm20 US Department of Energy National Energy Technology Laboratory ldquoFact Sheet Evaluation of Foamed Wellbore Cement Stability Under Deep
Water Conditionsrdquo Available at httpwwwnetldoegovpublicationsfactsheetsrdRampD187pdf21 US Department of Energy National Energy Technology Laboratory ldquoSmart Drillingrdquo (article) Available at httpwwwnetldoegovkmdcds
disk11smartdrillinghtm22 US Department of the Interior 101115OMAE2011-49537 Conference ldquoASME 2011 30th International Conference on Ocean Offshore
and Arctic Engineering A Modelling Framework for Describing the Corrosion Fatigue Behavior of Carbon Steel Pipelines and Risersrdquo 2011 Available at httpwwwresearchgatenetpublication267606263_A_Modelling_Framework_for_Describing_the_Corrosion_Fatigue_Behaviour_of_Carbon_Steel_Pipelines_and_Risers
23 US Department of Energy Final Report RPSEA Project 2012 07121-DW-1603D Rice University ldquoStructural Health Monitoring System for Deepwater Risers with Vortex Induced Vibrationrdquo Available at httpwwwrpseaorgmediafilesprojecte4a4357607121-1603d-FR-Robotic_MFL_Sensor_Monitoring_Inspection_Deepwater_Risers-07-02-12_Ppdf
24 US Department of Energy RPSEA ldquoSubsea Robotics Making Science Fiction a Reality for Offshore Oil and Gasrdquo 2012 Available at httpwwwrpseaorgarticlessubsea-robotics-making-science-fiction-a-reality-for-offshore-oil-and-gas
25 US Department of the Interior Bureau of Safety and Envrionmental Envorcement July 30 2012 ldquoBSEE Announces Successful Completion of Deepwater Well Containment Exercise in the Gulfrdquo Available at httpwwwbseegovBSEE-NewsroomPress-Releases2012BSEE-Announces-Successful-Completion-of-Deepwater-Well-Containment-Exercise-in-the-Gulf
26 US Department of Energy RPSEA Final Report ldquoSubsea Processingrdquo 07-1901 July 2011 Available at httpwwwrpseaorgmediafilesprojectd4215bf607121-1901-FR-Subsea_Processing_Simulator-07-15-11_Ppdf
27 Energy Information Administration ldquoShort-Term Energy Outlookrdquo May 12 201528 US Department of Energy National Energy Technology Laboratory ldquoCarbon Dioxide Enhanced Oil Recovery Untapped Domestic Energy
Supply and Long Term Carbon Storage Solutionrdquo Available at httpswwwnetldoegovfile20libraryresearchoil-gassmall_CO2_EOR_Primerpdf
29 Hancock S Moridis G Wilson S Robertson A ldquoWell Design Requirements for Deepwater and Arctic Onshore Gas Hydrate Production Wellsrdquo Proceedings Offshore Technology Conference OTC-21015 2010 7 pp
30 Modified by R Boswell from the original source Boswell R ldquoIs Gas Hydrate Energy Within Reach Science (325) 2009 pp 957ndash95831 Collett T Agena W Lee M et al ldquoAssessment of Gas Hydrate Resources on the North Slope Alaskardquo US Geological Survey Fact Sheet 2008-
3073 2008 4 pp32 Rogner H-H et al Chapter 7 ldquoEnergy Resources and Potentialsrdquo In Global Energy AssessmentmdashToward a Sustainable Future Cambridge
University Press Cambridge UK and New York NY USA and the International Institute for Applied Systems Analysis Laxenburg Austria pp 423ndash512
33 Development intensity is a phenomenon associated with shale development in part owing to the low recovery per well Improved drilling and completion technologies are needed to reduce the number of wells drilling for the same recovery volume Drilling intensity is discussed in the following report by Leonardo Maugeri Associate Environment and Natural Resources ProgramGeopolitics of Energy Project Discussion Paper 2013-05 Belfer Center for Science and International Affairs Harvard Kennedy School ldquoThe Shale Oil Boom A US Phenomenonrdquo 2013 Quote from report as follows ldquoDrilling intensity in US shale oil plays skyrocketed from a few hundred wells brought online (eg becoming productive) before 2011 to more than 4000 in 2012mdasha figure that outpaces the total number of oil and gas wells (both conventional and unconventional) brought online in the same year in the rest of the world (except Canada)rdquo Available at httpbelfercenterksgharvardedupublication23191shale_oil_boomhtml
Quadrennial Technology Review272
7 Advancing Systems and Technologies to Produce Cleaner Fuels
34 International Energy Agency ldquoGolden Rules for the Golden Age of Gasrdquo World Energy Outlook Special Report on Unconventional Gas 201235 US Department of Energy US Department of the Interior US Environmental Protection Agency ldquoFederal Multiagency Collaboration on
Unconventional Oil and Gas Research A Multi-Year Strategy for Research and Developmentrdquo 201436 Since 1924 the American Petroleum Institute has been developing equipment and operating standards for the oil and natural gas industry
Available at httpwwwapiorg37 Ellsworth W L ldquoInjection-Induced Earthquakesrdquo Journal Article 2013 July 12 2013 Science 101126science1225942 341 6142 Available at
httpwwwsciencemagorgcontent3416142122594238 National Research Council ldquoInduced Seismicity Potential in Energy Technologiesrdquo 2013 p 939 US Department of Energy US Department of the Interior US Environmental Protection Agency ldquoFederal Multiagency Collaboration on
Unconventional Oil and Gas Research A Multi-Year Strategy for Research and Developmentrdquo 201440 Presentation of the Department of Mineral Resources review of North Dakota Petroleum Council Flaring Task Force Report and Consideration
of Implementation Steps March 3 201441 EPA Climate Change Overview of Greenhouse Gases Table ldquoProperties of Methanerdquo Available at httpepagovclimatechangeghgemissionsgasesch4html42 Intergovernmental Panel on Climate Change ldquoClimate Change 2013 The Physical Science Basisrdquo Table 8A143 Environmental Protection Agency ldquoInventory of Greenhouse Gas Emissions and Sinks 1990-2012rdquo Table ES-2 2014 Available at httpwww
epagovclimatechangeDownloadsghgemissionsUS-GHG-Inventory-2014-Chapter-Executive-Summarypdf44 National Petroleum Council ldquoArctic Potential Realizing the Promise of US Arctic Oil and Gas Resourcesrdquo 2015 Available at httpwww
npcarcticpotentialreportorg45 Boswell R Collett T Frye M Shedd W McConnell D Shelander D ldquoSubsurface Gas Hydrates in the Northern Gulf of Mexicordquo Journal of
Marine and Petroleum Geology (341) 2012 pp 4-3046 Bureau of Ocean Energy Management ldquoAssessment of In-place Gas Hydrate Resources of the Lower 48 United States Outer Continental Shelfrdquo
BOEM Fact Sheet RED-2012-01 201247 National Petroleum Council ldquoPrudent Development Realizing the Potential of North Americarsquos Abundant Natural Gas and Oil Resourcesrdquo
2011 Table 1-3 Natural Gas Resource Base p 7248 National Petroleum Council ldquoArctic Potential Realizing the Promise of US Arctic Oil and Gas Resourcesrdquo 2015 Available at httpwww
npcarcticpotentialreportorg49 US Department of Energy 2011 US Billion-Ton Update Biomass Supply for a Bioenergy and Bioproducts Industry RD Perlack and BJ
Stokes (Leads) ORNLTM-2011224 Oak Ridge National Laboratory Oak Ridge TN 227p50 Ruth M Mai T Newes E Aden A Warner E Uriarte C Inman D Simpkins T Argo A (March 2013) Projected Biomass Utilization for
Fuels and Power in a Mature Market Transportation Energy Futures Series Prepared for the US Department of Energy by National Renewable Energy Laboratory Golden CO DOEGO-102013-3707 153 pp httpwwwnrelgovdocsfy13osti53336pdf
51 Ibid52 ldquoBioenergy Technology Office Multi-Year Program Planrdquo 2015 Available at httpenergygovsitesprodfiles201504f22mypp_beto_
march2015pdf53 Further information is available at httpepagovotaqfuelsrenewablefuelsindexhtm and httpwwwarbcagovfuelslcfslcfshtm54 Jointly funded by the Department of Navy US Department of Energy and US Department of Agriculture with cost share from the private sector55 Kenney K L et al ldquoFeedstock Supply System Design and Economics for Conversion of Lignocellulosic Biomass to Hydrocarbon Fuels-
Conversion Pathway Biological Conversion of Sugars to Hydrocarbonsrdquo INLEXT-13-30342 2013 Available at httpsinlportalinlgovportalserverptopen=512ampobjID=421ampparentname=CommunityPageampparentid=4ampmode=2
56 Biomass Resource and Development Library funded by BETO and house at Idaho National Lab Idaho Falls ID Available at httpsinlportalinlgovportalserverptcommunityrenewable_energy_home419biomass_resource_library
57 ldquoBioenergy Technology Office Multi-Year Program Planrdquo 2015 Available at httpenergygovsitesprodfiles201504f22mypp_beto_march2015pdf
58 Gregorova A et al ldquoStabilization Effect of Lignin in Natural Rubberrdquo Polymer Degradation and Stability (91229) 200659 Demirbas A ldquoRelationship Between Lignin Contents and Heating Values of Biomassrdquo Energy Conversion and Management (42183) 200160 ldquoNational Algal Biofuels Technology Roadmaprdquo May 2010 Available at httpwwwenergygovsitesprodfiles201403f14algal_biofuels_
roadmappdf61 [1] Davis R Fishman D Frank E et al ldquoRenewable Diesel from Algal Lipids An Integrated Baseline for Cost Emissions and Resource
Potential from a Harmonized Modelrdquo Argonne National Laboratory ANLESDA12-4 2012 Available at httpgreetesanlgovpublication-algae-harmonization-2012
[2] Davis R Kinchin C Markham J Tran E C D et al ldquoProcess Design and Economics for the Conversion of Algal Biomass to Biofuelsrdquo National Renewable Laboratory 2014
273
7
62 Jones S Tan E Jacobson J et al ldquoProcess Design and Economics for the Conversion of Lignocellulosic Biomass to Hydrocarbon Fuels Fast Pyrolysis and Hydrotreating Bio-oil Pathwayrdquo PNNL-23053 NRELTP-5100-61178 2013 Pacific Northwest National Laboratory National Renewable Energy Laboratory and Idaho National Laboratory Available at httpwwwpnnlgovmainpublicationsexternaltechnical_reportsPNNL-23053pdf
63 JE Holladay White JF Bozell JJ Johnson D ldquoTop Value-Added Chemicals from Biomass Volume II ndash Results of Screening for Potential Candidates from Biorefinery Ligninrdquo Pacific Northwest National Laboratory PNNL-16983 (2007) Available at httpwwwpnlgovmainpublicationsexternaltechnical_reportsPNNL-16983pdf
64 ldquoUS Billion Ton Update Biomass Supply for a Bioenergy and Bioproducts Industryrdquo August 2011 Available at httpwwwenergygovsitesprodfiles201501f19billion_ton_update_0pdf
65 ldquoBreaking the Chemical and Engineering Barriers to Lignocellulosic Biofuels Next Generation Hydrocarbon Biorefineriesrdquo March 2008 Available at httpenergygovsitesprodfiles201404f14Roadmap2-08pdf
66 For more information see the ldquoHydrogenrdquo chapter in the ldquoNPC Future Transportation Fuels Study Advancing Technology for Americarsquos Transportation Futurerdquo 2012 Available at httpwwwnpcorgFTF-80112html See also the NREL report ldquoHydrogen Pathways Updated Cost Well-to-Wheels Energy Use and Emissions for the Current Technology Status of Ten Hydrogen Production Delivery and Distribution Scenariosrdquo 2013 Available at httpwwwnrelgovdocsfy14osti60528pdf See also the ldquoReport of the Hydrogen Production Expert Panel A Subcommittee of the Hydrogen amp Fuel Cell Technical Advisory Committeerdquo 2013 Available at httpwwwhydrogenenergygovpdfshpep_report_2013pdf
67 Public announcements by Hyundai Toyota and others with confirmation by the California Air Resources Board (in correspondence between Catherine Dunwoody and Tien Nguyen of the US Department of Energy Fuel Cell Technologies Office)
68 US Department of Energy Fuel Cell Technologies Office Program Record 12014 ldquoCurrent US Hydrogen Productionrdquo Available at httpwwwhydrogenenergygovpdfs12014_current_us_hydrogen_productionpdf
69 From the ldquoHydrogenrdquo chapter in the NPC Report ldquoLarge Hydrogen Production Facilities (gt18000 kgday) Exist in Nearly Every State Supplying Approximately 1000 Locations with Bulk Hydrogenrdquo Available at httpwwwnpcorgFTF-80112html
70 Estimated emissions from hydrogen production in China exceed 150 million tons per year 71 To achieve a range comparable to commercial gasoline vehicles FCEV tanks are filled to a pressure of 700 bar to provide 56 kg of hydrogen
within the volume available When range is not critical to the application or larger volumes are available (such as on board a bus) 350 bar storage systems may be used Lower-pressure systems offer improved reliability and cost benefits over the high pressure systems Note that 1 kg of hydrogen has approximately the same energy as 1 gallon of gasoline (ie 1 gasoline gallon equivalent) See Fuel Cell Technologies Office Program Record 13010 ldquoOnboard Type IV Compressed Hydrogen Storage SystemsmdashCurrent Performance and Costrdquo Available at httpwwwhydrogenenergygovpdfs13010_onboard_storage_performance_costpdf
72 For more information on hydrogen production pathways see the ldquoUS Drive Hydrogen Production Technical Team Roadmap (2013)rdquo Available at httpwww1eereenergygovvehiclesandfuelspdfsprogramhptt_roadmap_june2013pdf and the 2013 NREL ldquoHydrogen Pathways Reportrdquo Available at httpwwwnrelgovdocsfy14osti60528pdf
73 For more information on gasification see Chapter 4 ldquoPower Generationrdquo74 US Department of Energy National Renewable Energy Laboratory ldquoBiogas and Fuel Cells Workshop Summary Reportrdquo January 2013
Available at httpenergygoveerefuelcellsdownloadsbiogas-and-fuel-cells-workshop-summary-report-proceedings-biogas-and-fuel75 US Department of Energy Fuel Cell Technologies Office July 2014 ldquo2014 Electrolytic Hydrogen Production Summary Reportrdquo Available at
httpenergygovsitesprodfiles201408f18fcto_2014_electrolytic_hydrogen_production_workshop_summary_reportpdf76 For more information see httpenergygoveerefuelcellsphotoelectrochemical-working-group High solar-to-hydrogen (STH) conversion
efficiencies are possible in the emerging production pathways such as photoelectrochemical (PEC) water splitting For example a dual band gap PEC solar water splitting system developed by stacking two materials in tandem has an ideal theoretical efficiency of 41 with a chemical solar-to-hydrogen conversion efficiency of 27 when including losses owing to the fraction of unused energy per absorbed photon (Chemical Reviews [11011] 2010 pp 6448-6449) To date laboratory-scale demonstrations exceeding 15 STH have been achieved but cost durability and scale-up issues remain (Energy Environ Sci [6] 2013 p 1984)
77 US Department of Energy Fuel Cell Technologies Office ldquo2013 Biological Hydrogen Workshop Summary Reportrdquo November 2013 Available at httpenergygoveerefuelcellsdownloads2013-biological-hydrogen-production-workshop-summary-report Hydrogen production efficiencies in the biological pathways remain low Genetic manipulation of the hydrogen-producing organisms is needed to improve efficiency rate and yield
78 Hydrogen production and delivery pathway roadmaps have been developed by the USDRIVE Hydrogen Production and Hydrogen Delivery Technical Teams Available at httpwww1eereenergygovvehiclesandfuelspdfsprogramhptt_roadmap_june2013pdf httpenergygovsitesprodfiles201402f8hdtt_roadmap_june2013pdf An updated combined version is available at httpwwwhydrogenenergygovpdfsreview15pd000_miller_2015_opdf
79 Fuel economies for all fuelvehicle systems were determined by using Argonne National Laboratoryrsquos autonomie modeling system See httpwwwtransportationanlgovmodeling_simulationPSATautonomiehtml
80 US Department of Energy Fuel Cell Technologies Office Program Record 13013 ldquoOn-Board Type IV Compressed Hydrogen Storage SystemsmdashCurrent Performance and Costrdquo 2013 Available at httpwwwhydrogenenergygovpdfs13010_onboard_storage_performance_costpdf
Quadrennial Technology Review274
7 Advancing Systems and Technologies to Produce Cleaner Fuels
81 US Department of Energy Fuel Cell Technologies Office Program Record 12024 ldquoHydrogen Production Cost Using Low-Cost Natural Gasrdquo 2012 Available at httpwwwhydrogenenergygovpdfs12024_h2_production_cost_natural_gaspdf
82 US Department of Energy Fuel Cell Technologies Office Program Record 11007 ldquoHydrogen Threshold Cost Calculationrdquo 2011 Available at httpwwwhydrogenenergygovpdfs11007_h2_threshold_costspdf
83 Cost targets include the onboard efficiency benefits of FCEVs as described in the Fuel Cell Technologies Office Program Record 13006 ldquoLife-Cycle Costs of Mid-size Light-Duty Vehiclesrdquo Available at httpwwwhydrogenenergygovprogram_recordshtml
84 For additional details please see Fuel Cell Technologies Office Program Record 14013 Available at httpwwwhydrogenenergygovpdfs14013_hydrogen_early_market_cost_targetpdf
85 For more information on CHHP see Chapter 4 ldquoPower Generationrdquo86 Analysis was completed by using the H2A Hydrogen Production Model (available at httpwwwhydrogenenergygovh2a_prod_studieshtml)
and assumes high volume Ranges reflect variability in major feedstock pricing as well as a bounded range for capital cost estimates as described in the Fuel Cell Technologies Office Program Record 14005 ldquoHydrogen Production Status 2006ndash2013rdquo Available at httpwwwhydrogenenergygovpdfs14005_hydrogen_production_status_2006-2013pdf
87 The amount of hydrogen fuel required in the near term can be extrapolated from the California Air Resources Boardrsquos ldquoAnnual Evaluation of Fuel Cell Electric Vehicle Deployment and Hydrogen Fuel Station Network Developmentrdquo June 2014 For additional information see NRELrsquos 2013 ldquoResource Assessment for Hydrogen Production Hydrogen Production Potential from Fossil and Renewable Energy Resourcesrdquo (available at httpwwwnrelgovdocsfy13osti55626pdf) the National Hydrogen Associationrsquos 2010 market report (available at wwwttcorpcompdfmarketReportpdf) andor the IEArsquos North American Roadmap workshop (available at httpwwwieaorgmediaworkshops2014hydrogenroadmap7doeericmillerpdf) Additional public hydrogen fueling stations will however be required to meet vehicle demand
88 Feedstock cost ranges used in the case studies are $4ndash$10 per MMBTU for SMR $003ndash$008 per kWh for PEM electrolysis and $40ndash$120 per dry short ton for biomass gasification consistent with the Fuel Cell Technologies Office Program Record 14005
89 See the 2013 NREL ldquoHydrogen Pathways Reportrdquo Available at httpwwwnrelgovdocsfy14osti60528pdf90 International Atomic Energy Agency Nuclear Hydrogen Production Technology Available at httpwwwiaeaorgAboutPolicyGCGC57
GC57InfDocumentsEnglishgc57inf-2-att1_enpdf91 US Department of Energy ldquoFuel Cell Technologies Office Multi-Year Research Development and Demonstration Plan Hydrogen Deliveryrdquo
2015 p 32-2 Available at httpenergygovsitesprodfiles201505f22fcto_myrdd_delivery_0pdf92 Dunwoody C ldquoCalifornia Fuel Cell Partnership 2014 FCEVs and H2 in Californiardquo httpwwwhydrogenenergygovpdfsreview14
dunwoody_plenary_2014_amrpdf93 California Fuel Cell Partnership ldquoCA H2 Station Mapsrdquo 2015 Available at httpcafcporgsitesfilesH2-Stations-CA-map-Open-
Funded-2015pdf94 Information throughout this paragraph is from the US Department of Transportation industry sources market research firms and other
sources (source EERE Fuel Cell Technologies Office Tien Nguyen)95 US Department of Energy Fuel Cell Technologies Office Program Record 13013 ldquoOn-Board Type IV Compressed Hydrogen Storage Systemsmdash
Current Performance and Costrdquo 2013 Available at httpwwwhydrogenenergygovpdfs13010_onboard_storage_performance_costpdf96 Chapter 8 on transportation includes a discussion of RDampD needs and performance targets for onboard hydrogen storage in vehicles Part of
the RDampD on advanced storage materials and systems for onboard storage may be applicable to the storage systems used for tube trailers and at hydrogen fueling stations (refer to Chapter 8 for RDampD needs and priorities) Chapter 6 discusses RDampD for components and materials for energy technologies Similarly low-carbon electricity sources are discussed in the power chapter and are not addressed here
97 US Department of Energy Fuel Cell Technologies Office ldquoMulti-Year Research Development and Demonstration Planrdquo 2012 update Available at httpenergygoveerefuelcellsdownloadsfuel-cell-technologies-office-multi-year-research-development-and-22
98 EIA ldquoAnnual Energy Outlook 2014 World Production of Liquid Fuels from Biomass Coal and Natural Gas Increases Available at httpwwweiagovforecastsaeoMT_intlcfm
99 ldquoAffordable Low-Carbon Diesel Fuel from Domestic Coal and Biomassrdquo DOENETL-20091349 January 14 2009 Available at httpwwwnetldoegovFile20LibraryResearchEnergy20AnalysisCoalCBTL-Final-Reportpdf
100 Lin G Larson ED Williams RH Guo Xiangbo ldquoGasoline from Coal andor Biomass with CO2 Capture and Storage 1 Process Designs and Performance Analysisrdquo Energy amp Fuels 2015 V29 pp1830-1844 See also ldquoAffordable Low-Carbon Diesel Fuel from Domestic Coal and Biomassrdquo DOENETL-20091349 January 14 2009 Available at httpwww netldoegovFile20LibraryResearchEnergy20AnalysisCoalCBTL-Final-Reportpdf
275
7
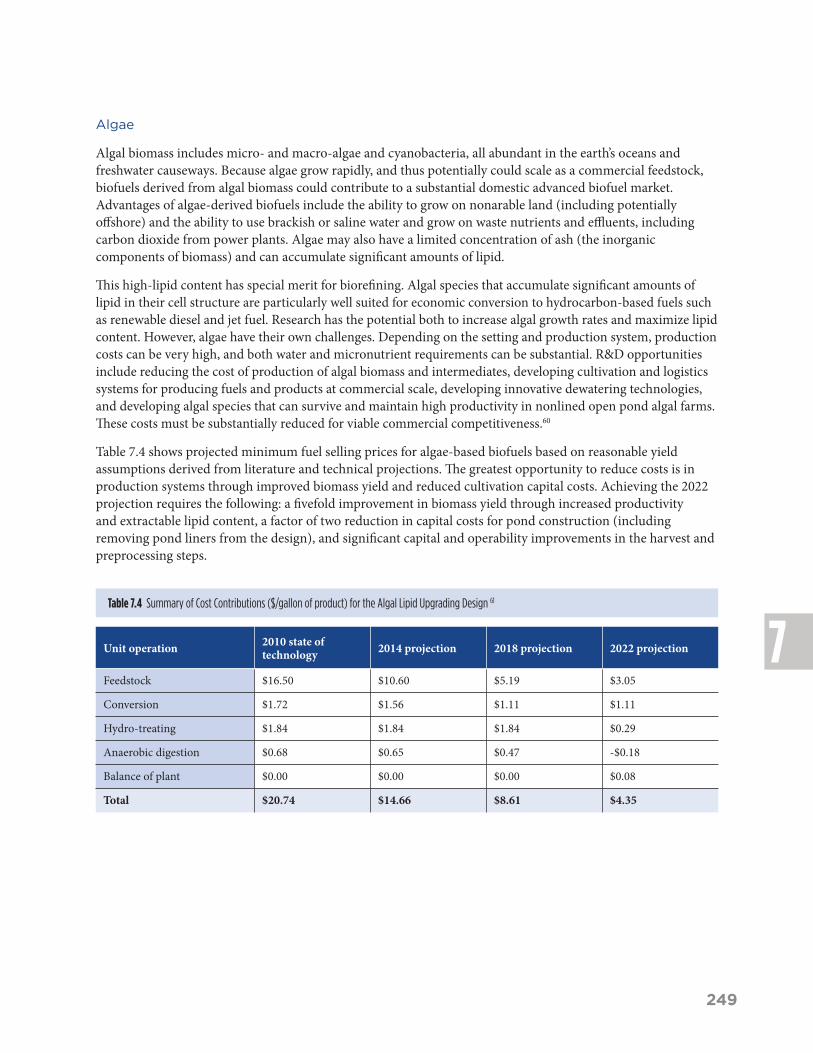

275
7


