Page 1
University of South CarolinaScholar Commons
Theses and Dissertations
1-1-2013
An Assessment of Instructional Coaching: Resultsof a Survey of Selected School Districts in SouthCarolinaHeather Clayton GordonUniversity of South Carolina
Follow this and additional works at: https://scholarcommons.sc.edu/etd
Part of the Educational Administration and Supervision Commons
This Open Access Dissertation is brought to you by Scholar Commons. It has been accepted for inclusion in Theses and Dissertations by an authorizedadministrator of Scholar Commons. For more information, please contact [email protected] .
Recommended CitationGordon, H. C.(2013). An Assessment of Instructional Coaching: Results of a Survey of Selected School Districts in South Carolina.(Doctoral dissertation). Retrieved from https://scholarcommons.sc.edu/etd/2378
Page 2
An Assessment of Instructional Coaching: Results of a Survey of Selected School
Districts in South Carolina
by
Heather Gordon
Bachelor of Science
The University of South Carolina – Upstate, 1997
Master of Arts
Furman University, 2002
Education Specialist
The University of South Carolina, 2008
______________________________________________________________
Submitted in Partial Fulfillment of the Requirements
For the Degree of Doctor of Philosophy in
Educational Administration
College of Education
The University of South Carolina
2013
Accepted by:
Zach Kelehear, Major Professor
Lynn Harrill, Committee Member
Diane Harwell, Committee Member
Rhonda Jeffries, Committee Member
Lacy Ford, Vice Provost and Dean of Graduate Studies
Page 3
ii
© Copyright by Heather Gordon, 2013
All Rights Reserved
Page 4
iii
Dedication
I would like to dedicate this dissertation to the two people who have been most
influential in this process and in my life.
For my mother, Diane Hendrix, thank you for always helping me to see and to
understand the importance of my education. Since I was a child, you always told me I
could accomplish anything I put my mind to and put hard work into.
For my husband, Robert Gordon, thank you for always encouraging me, believing
in me, and supporting me, even when I was not sure I would ever finish. Thank you for
helping me to refocus and to prioritize my life better. I could have never completed this
journey without your ever present faith in me.
Page 5
iv
Acknowledgements
I would like to thank those who have been a tremendous source of support and
help in the undertaking of completing this dissertation.
Thank you to my entire dissertation committee, Dr. Lynn Harrill, Dr. Diane
Harwell, Dr. Rhonda Jeffries, and Dr. Zach Kelehear for offering suggestions and for
enduring my constant questions. I appreciate your help and support in this process.
Thank you for JoLynn Allen, English Teacher Extraordinaire, for your editorial
assistance and encouragement. I cannot possibly thank you enough.
Thank you to the wonderful staff at Northwest Middle School for always being
willing to allow me pick your brains and bounce ideas off of you. You are such a
blessing to me.
Thank you to Dr. Jeff Rogers for getting me started on this road. I will never
forget the phone call on that January Monday telling me “we” were starting classes for
our Ph. D. on that Wednesday. We solved the world’s problems to and from class each
week, or at least we tried. Thank you for a great ride.
Throughout my life I have had some of the most amazing educators and mentors.
Each has influenced me in many different ways. Thank you to those educators who have
been most influential in my life, Marva Williams, Kaye Solesbee, Doris Khoe, Rick
McClure, and my aunt, Elaine Guffy. I would also like to thank Mike and Kathy
Bullock for being so influential throughout my childhood.
Page 6
v
A most heartfelt thank you to Dr. Lynn Harrill for instilling in me a love for
curriculum and instruction, way back when I was taking his curriculum class at Furman
University. Thank you for your continued faith in my capabilities and thank you for
sharing your passion with me.
And finally, I would like to thank Dr. Zach Kelehear for encouraging me, pushing
me, and never having doubt that I was going to finish this journey. Thank you for being
the best advisor I could have ever asked for. You have truly been a mentor to me.
Page 7
vi
Abstract
The purpose of this study was to determine teachers’ perceptions of instructional
coaching. Four research-based instructional coaching best practices were identified for
the development of a survey. The four instructional coaching best practices were:
collaborating with teachers to address school-wide instructional concerns and practices,
collaboratively planning with a teacher to identify when and how an instructional
intervention might be implemented, modeling instructional practices in teachers’
classrooms, and observing teachers and providing teachers with feedback. Data were
collected through the researcher constructed Teachers’ Perceptions of Instructional
Coaching survey. Elementary teachers in four school districts in the Upstate of South
Carolina participated in this study. An analysis of the data was conducted utilizing
descriptive statistics as well as measures of central tendency. The results showed that
teachers perceive the utilization of instructional coaching best practices for their
instructional benefit as occurring below the usually range but above the sometimes range.
The results of the study also determined that teacher demographic data, collected in the
areas of level of education, years of teaching experience, and education as a first career,
had no statistical significance on teachers’ perceptions. Following an analysis of the
data, recommendations for further research included a qualitative study of teachers’
perceptions and principals’ support and understanding of instructional coaching best
practices as well as the professional development provided to instructional coaches on
best practices.
Page 8
vii
Table of Contents
Dedication…..…………………………..………………………………………………...iii
Acknowledgements………………..…..………………………………………………….iv
Abstract……………………………..………...………………………………………….vi
List of Tables………………………..……..……………………………………………...x
List of Figures……………………..………..…………………………………………….xi
Chapter 1: Introduction..……………………….………………………………………….1
Qualities of Instructional Coaches……..……….………….……………………..3
Teachers’ Perceptions of Instructional Coaching…….……..……………………4
Purpose of Study…………….……………………………..…………………….6
Significance of Study…………………………….………..……………………..7
Research Questions……………………………………………………………..10
Theoretical Framework………...……………………………………………….11
Data Collections and Research Design…………………………………………12
Conceptual Framework…………………………………………………………14
Definitions……………………………………………………………………...15
Delimitations……………………………………………………………………15
Organization of Study…………………………………………………………..17
Chapter 2: Literature Review…………………………………………………………..18
Adult Learning Theory…………………………………………………………19
What is Instructional Coaching?………………….……………………………23
Page 9
viii
Administration’s Role in Instructional Coaching………………………………26
Best Practices in Instructional Coaching………………………….……………32
Summary…………………………………………………………………...….. 35
Chapter 3: Methodology of the Study…………………………………………………38
Purpose of Study……………………………………………………………….38
Research Design………………………………………………………………..40
Population and Sample…………………………………………………………42
Instrumentation………………………...……………………………………....44
Data Collection Procedures and Analysis………………………………………46
Limitations………………………………………………………...................…47
Conclusion……………………………………………………………………...48
Chapter 4: Analysis of Data……………………………………………………………49
Research Questions……………………………………………………………..49
Description of Population………………………………………………………50
Instrumentation…………………………………………………………………52
Descriptive Data……………………………………………………………...…53
Statistical Analysis of the Research Questions…………………………………55
Research Question One…………………………………………………………56
Research Question Two………………………………………………………...60
Research Question Three……………………………………………………….65
Research Question Four………………………………………………………...69
Best Practices Overall Summary………………………………………………..73
Demographic Data Analysis……………………………………………………74
Page 10
ix
Demographic Summary………………………………………………………...83
Conclusion……………………………………………………………………...83
Chapter 5: Summary, Conclusions and Recommendations……………………………85
Summary of Study……………………….……………………………………...85
Researcher’s Interpretations…………………………………………………….88
Discussion of Research Questions Findings .…...……….………………..…….93
Demographic Impact……………………………………………………………94
Conclusions……………………………….……………………………………..95
Recommendations for Further Study…...………………………………………96
References…………………………………………………………………………….100
Appendix A: Email/Letter to Superintendent…………………………………….......106
Appendix B: Principal Email…………………………………………………………108
Appendix C: Teacher Participation Letter……………………………………………109
Appendix D: Teacher Survey…………………………………………………………110
Appendix E: Survey Item Results – All Data………..………….……………………115
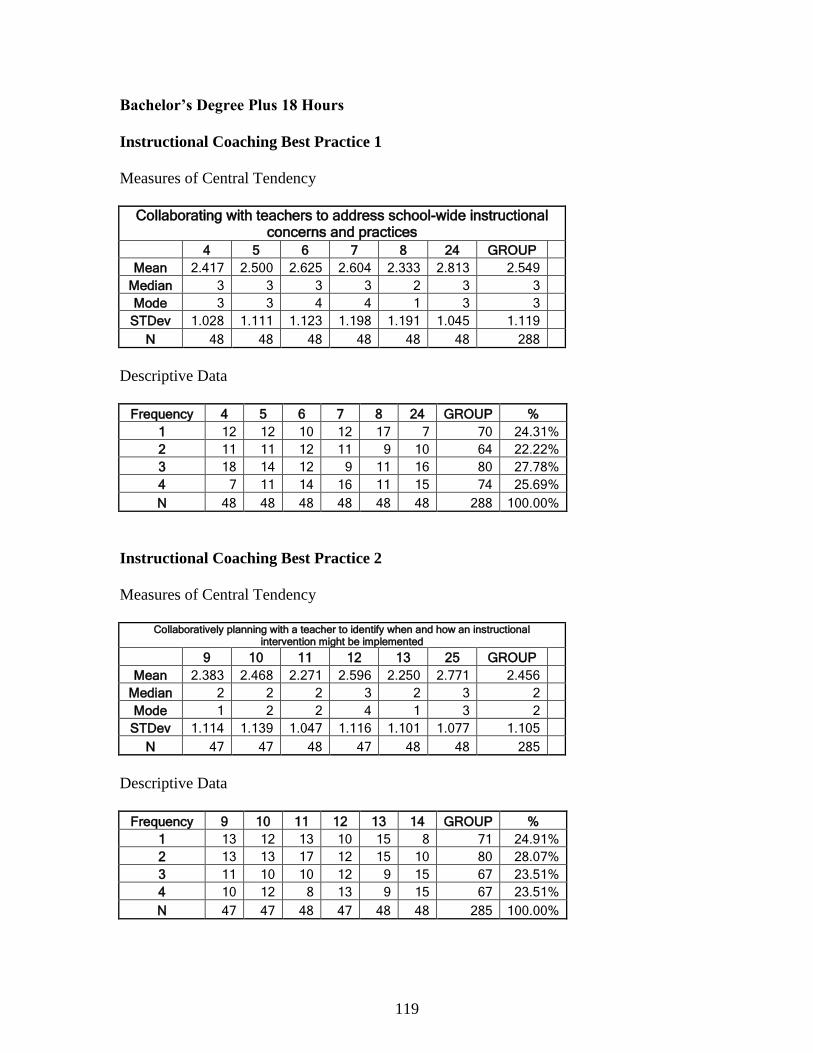
Appendix F: Demographic Groups – Education Level…..…………………………...117
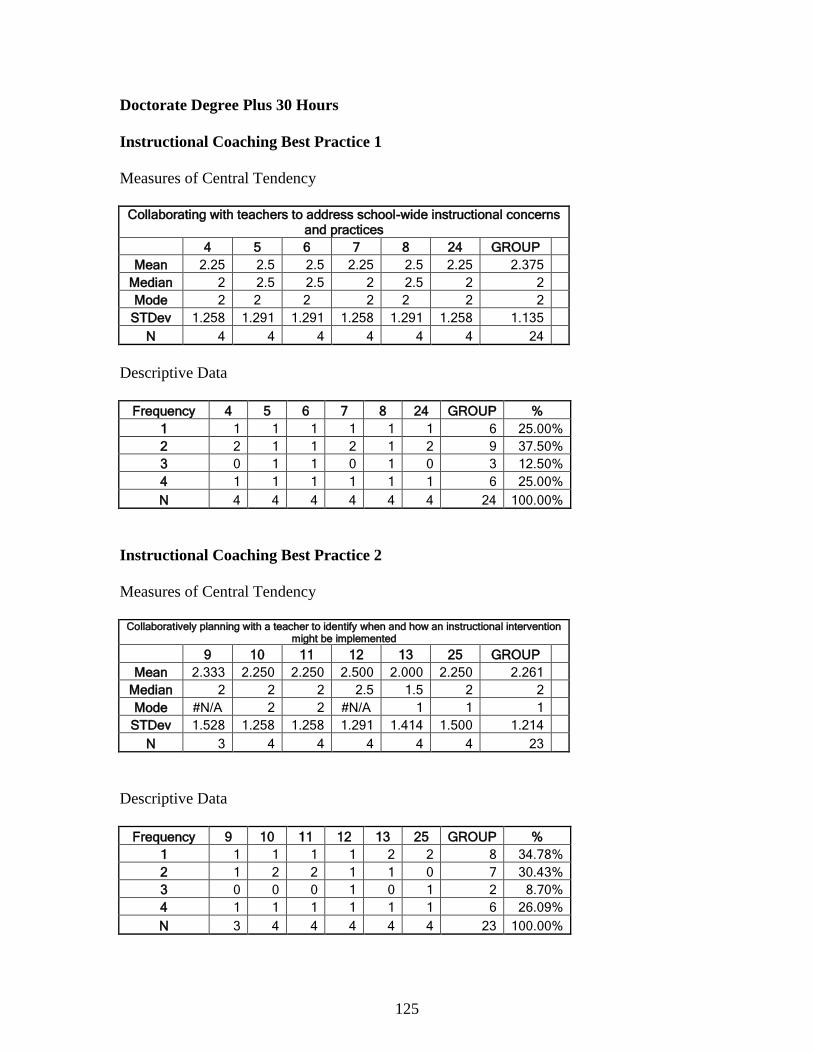
Appendix G: Demographic... Groups – Years of Teaching Experience……………...127
Appendix H: Demographic Groups – Education as a First Career………...…………137
Page 11
x
List of Tables
Table 4.1 Frequency Distribution of Highest Level of Education……………....………53
Table 4.2 Frequency Distribution of Years of Teaching Experience………..…..…...….54
Table 4.3 Frequency Distribution of Education as a Career……………………………..54
Table 4.4 Measures of Central Tendency – Instructional Coaching Best Practice 1...…..57
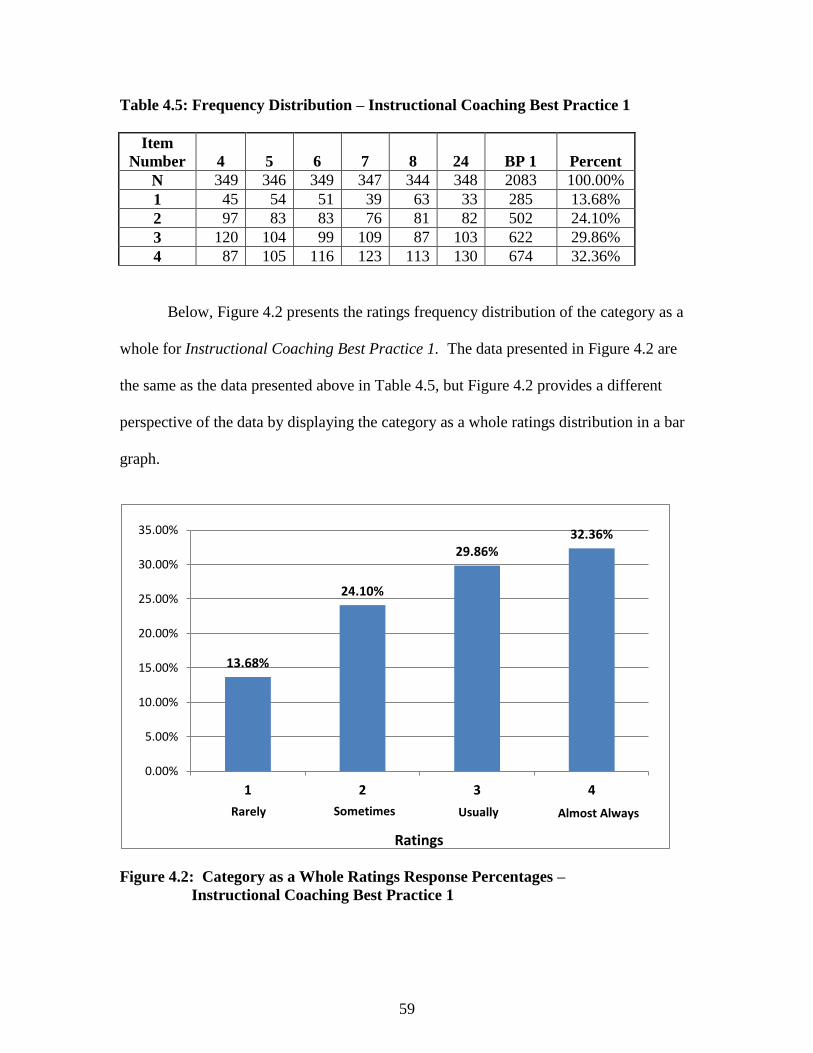
Table 4.5 Frequency Distribution – Instructional Coaching Best Practice 1…………….59
Table 4.6 Measures of Central Tendency – Instructional Coaching Best Practice 2…….61
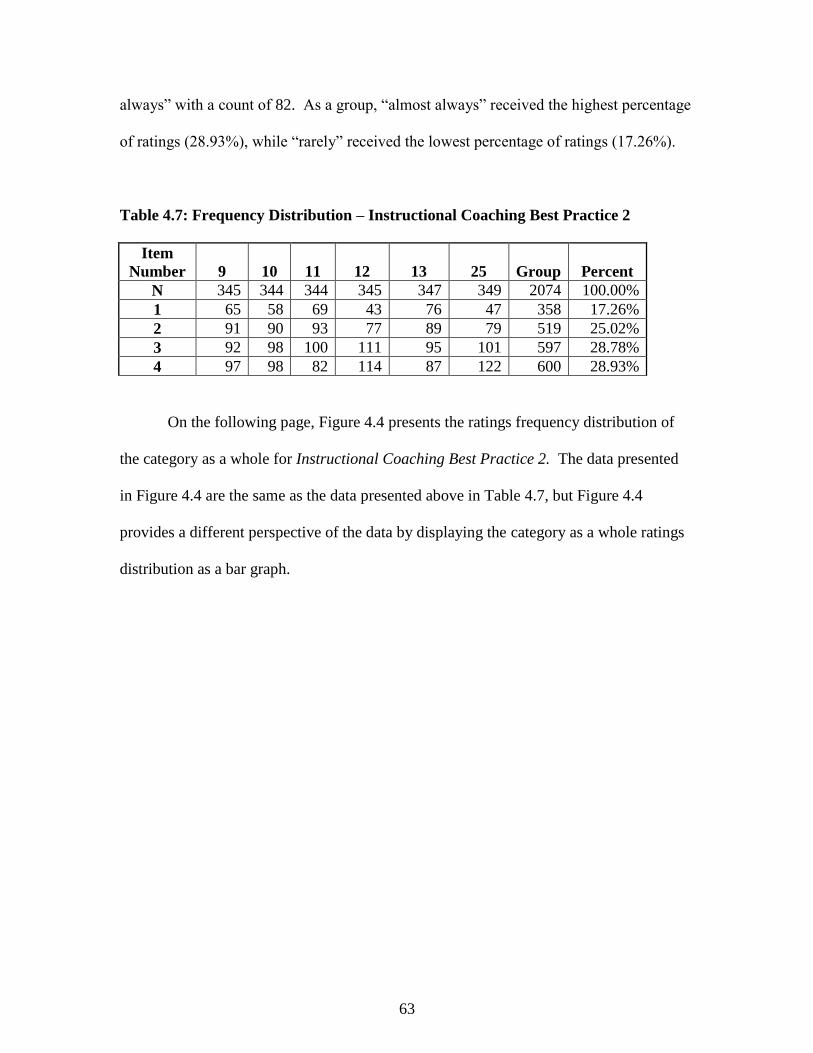
Table 4.7 Frequency Distribution – Instructional Coaching Best Practice 2……...……..63
Table 4.8 Measures of Central Tendency – Instructional Coaching Best Practice 3….…66
Table 4.9 Frequency Distribution – Instructional Coaching Best Practice 3…..………..68
Table 4.10 Measures of Central Tendency – Instructional Coaching Best Practice 4…...70
Table 4.11 Frequency Distribution – Instructional Coaching Best Practice 4……….…..72
Page 12
xi
List of Figures
Figure 1.1 Conceptual Framework………………………………………………………14
Figure 4.1 Survey Items’ Mean – Instructional Coaching Best Practice 1……………...58
Figure 4.2 Category as a Whole Ratings Responses Percentages – Instructional Coaching
Best Practice 1…………………………………………………………………..59
Figure 4.3 Survey Item Mean – Instructional Coaching Best Practice 2……………….62
Figure 4.4 Category as a Whole Ratings Responses Percentages – Instructional Coaching
Best Practice 2…………..………………………………………………………64
Figure 4.5 Survey Item Mean – Instructional Coaching Best Practice 3…..….……….67
Figure 4.6 Category as a Whole Ratings Responses Percentages – Instructional Coaching
Best Practice 3……………………………………………………………..…….68
Figure 4.7 Survey Item Mean – Instructional Coaching Best Practice 4……….….……71
Figure 4.8 Category as a Whole Ratings Responses Percentages – Instructional Coaching
Best Practice 4………………………………………………………….………..72
Figure 4.9 Means of the Best Practice Categories for the School Level Component...…74
Figure 4.10 Demographic Subgroup Means as Compared to the Category as a Whole
Mean Instructional Coaching Best Practice 1……………………………………76
Figure 4.11 Demographic Subgroup Means as Compared to the Category as a Whole
Mean Instructional Coaching Best Practice 2……………………………………78
Figure 4.12 Demographic Subgroup Means as Compared to the Category as a Whole
Mean Instructional Coaching Best Practice 3……………………………………80
Page 13
xii
Figure 4.13 Demographic Subgroup Means as Compared to the Category as a Whole
Mean Instructional Coaching Best Practice 4…………..………………………82
Page 14
1
Chapter One
Introduction
In a time when there is greater emphasis on accountability in education, school
districts across the nation are looking for effective measures that will improve classroom
instruction and in turn increase student achievement. One such measure is the
implementation of instructional coaches in schools. According to Jim Knight at the
University of Kansas Center for Research and Learning, an instructional coach is an on-
site teacher of teachers (2004a). As DuFour states, “The traditional notion that regarded
staff development as an occasional event that occurred off the school site has gradually
given way to the idea that the best staff development is in the workplace, not in a
workshop” (2004, p. 63).
Quick fixes never last, and teachers resent them. They resent going to in-services
where someone is going to tell them what to do but not help them follow up.
Teachers want someone who’s going to be there, who’s going to help them for the
duration, not a fly-by-night program that’s here today, gone tomorrow (Knight,
2004a, p. 32).
Instructional coaches (ICs) provide on-site professional development and work directly
with teachers on the implementation of proven research-based instructional practices in a
school. Instructional coaches use a variety of approaches to meet school and teacher
specific professional development needs. They provide “on-the spot, everyday
professional development” (Knight, 2004a, p. 33). Among the practices utilized by
Page 15
2
instructional coaches are: meeting with teachers one-on-one and in groups to guide them
through researched-based instructional strategies; collaboratively planning with teachers;
modeling instructional practices in classrooms; observing teachers to provide feedback;
and assisting teachers in the navigation of curriculum (Knight, 2004b).
Professional development decisions made at the district level and mandated to
schools for implementation are often ineffective because they lack a connection to the
school’s site-specific needs (Black, 2007). Often the needs of the individual schools,
teachers, and students are not taken into account using this model. Shifting staff
development to principals could be seen as yet another burden, but with the assistance of
an instructional coach, school level staff development decisions can better align learning
for teachers towards school level goals for the advancement of student achievement
(Killion, 2004). A professional development program that focuses on the needs of a
particular school and its teachers can better equip school leaders with facing the ever
present challenges that students, curriculum, and accountability measures bring.
Classrooms are the center of learning when the instructional coaching method is
appropriately implemented.
The impact instructional coaching has on a school depends greatly on how the
principal supports the role of an instructional coach. The relationship between the
principal and the instructional coach is critical (Pankake & Moller, 2007). The
instructional coach and principal should meet frequently and collaborate on the school’s
professional development plan and instructional needs. The principal should also provide
resources and time to the instructional coach, which includes opportunities to work with
teachers in group settings as well as individually (Pankake & Moller). The most
Page 16
3
important component of effective instructional coaching utilization is for the principal to
be cautious not to use the instructional coach as a quasi administrator. Coaches must be
given opportunities to build trusting relationships with teachers and should not be
assigned duties that could hinder the trust building efforts (Brady, 2007). Specifically,
instructional coaches should not be assigned any responsibility that could be seen as
evaluative in nature.
Qualities of Instructional Coaches
An instructional coach can have a significant impact on the instructional program
of a school. “Job-embedded staff development, by definition, will move the focus of
professional learning to the school site” (DuFour, 2004, p. 63). According to Feger,
Hickman, and Woleck (2004), instructional coaches need specific knowledge and skill
sets: interpersonal skills, content knowledge, pedagogical knowledge, knowledge of the
curriculum, awareness of coaching resources, and knowledge of the practice of coaching.
Interpersonal Skills: Coaches must be able to communicate effectively with
teachers. This communication includes the development of a trusting
relationship, providing appropriate feedback in a collaborative manner, and
advocating for teachers while working with administrators to move forward
with school specific-goals.
Content Knowledge: Coaches must have a deep understanding of subject
matter, particularly how the content knowledge is developed.
Page 17
4
Pedagogical Knowledge: Coaches must understand how students learn and
have a strong understanding of research-based instructional strategies.
Knowledge of Curriculum: Coaches must have an understanding of the
essential foundation behind curriculum and how curriculum connects across
grade levels.
Awareness of Coaching Resources: Coaches must have specific knowledge of
professional development resources to include materials and research
literature that may be used to support the development of a teacher’s
knowledge and skills in curriculum, instruction, and assessment.
Knowledge of the Practice of Coaching: Coaches must know and understand
coaching strategies they should employ to assist teachers, and coaches must
understand the many roles they play in a school (Feger et al., pp. 14 – 15).
Although Feger et al. list six knowledge and skill sets that coaches should possess; they
emphasize the importance of a coach establishing a collaborative and reflective
relationship with a teacher. They stress that coaches must not “tell the teacher what to
do, but should serve instead as a knowledge resource and a mediator to help the teacher
reflect” (p. 15).
Teachers’ Perceptions of Instructional Coaching
There is a great deal of research on instructional coaching and the practices
instructional coaches should employ to be effective. There is also much research on the
impact of instructional coaches in terms of student achievement; however, there is very
Page 18
5
little research on the perceptions of teachers on the effectiveness of instructional
coaching. Teachers’ perceptions are directly affected by the implementation model of
instructional coaching, and their perceptions have a large impact on the effectiveness and
implementation of instructional coaching. A teacher who does not view instructional
coaching as a key component to improving classroom instruction and student
achievement is less likely to collaborate with an instructional coach and is less likely to
support the utilization of the research-based instructional coaching model. Teachers who
do not see the benefits of collaborating with an instructional coach will not tap into the
resources offered by an instructional coach to improve their classroom instruction. The
perceptions of teachers provide information and data that can impact how schools and
school districts implement the instructional coaching model, how schools and school
districts choose instructional coaches, and how schools and school districts should
provide professional development for instructional coaches. Although instructional
coaching typically involves only the adults in a school, it is the students who reap the
benefits of an effective instructional coaching program in a school. Research from the
Pathways to Success program on implementation rates after teachers attended a summer
workshop that was followed-up with instructional coaching was 85% while earlier
research concludes there is a less than 10% implementation rate following traditional
workshops with no follow-up (Knight, 2005).
Instructional coaches should apply the theoretical frameworks of research-based
instructional strategies, student learning styles, student performance data, and
professional development to assist teachers in improving classroom instruction in order to
improve overall student achievement (Knight, 2004a). To be able to adhere to the
Page 19
6
research-based protocol of instructional coaching, instructional coaches must establish
trusting relationships with teachers, understand the principles of adult learning, master
the art of coaching, and clearly communicate with the principal (Brady, 2007).
There are many titles given to teachers who function in the role of an instructional
coach in their schools. For the purposes of this study, the title instructional coach will be
used for curriculum facilitator, curriculum resource teacher, literacy coach, lead
instructional teacher, lead curriculum teacher, master teacher, math coach, reading coach,
and science coach.
Purpose of Study
The purpose of this study is to examine teachers’ perceptions of instructional
coaching in schools within the Upstate region of South Carolina. This study will
examine the perception of teachers on research-based instructional coaching best
practices and will further examine teachers’ perception of instructional coaching best-
practices within specific demographic groups to determine if demographic data has an
impact on teachers’ perception of instructional coaching. The quantitative aspect of this
study consists of the utilization of a survey to gain broad scope of the perceptions from
teachers in schools in several school districts in the Upstate of South Carolina.
Page 20
7
Significance of Study
A number of studies have been conducted on the role of an instructional coach;
however, research that examines the perceptions of teachers about instructional coaching
is minimal. The perceptions of teachers are critical to the successful implementation of
instructional coaching. If there is a lack of “buy-in” from teachers, the successful
implementation of instructional coaching will be compromised. This study could also
shed light on the teachers for whom the instructional coach should focus attention rather
than waste time on people who are less likely to participate or will not participate in a
coaching model. This study provides an instructional coach with a better idea of who is
and who is not “coachable.” For school leaders, this study will examine the importance
of the utilization of instructional coaching best practices to teachers’ perceptions of
instructional coaching as a professional development tool and will provide school leaders
with areas of needed professional development for instructional coaches.
With the passage of the Education Accountability Act of 1998 by the South
Carolina state legislature and No Child Left Behind in 2001 followed by its
reauthorization in 2009 by the United States Congress, the accountability of schools at
the state and national levels has been elevated to a greater level of scrutiny. In South
Carolina the legislature, governor, and state superintendent of education are continuously
attacking public education, and measures such as tax credits and vouchers are on the
forefront to reduce funding for public education in the state. There is also greater
scrutiny of student test scores with teacher performance pay on the agenda.
Accountability is not something to be feared; it is something that needs greater
understanding than what state mandated testing programs can provide. Adding to the
Page 21
8
challenges of the current accountability measures in South Carolina, the state enacted a
public education funding model that has replaced the primary funding source for schools,
the Property Tax Valuation Reform Act of 2006. The property tax reform law has
essentially ended the fiscal authority of local school boards by eliminating their power to
raise funds through local property tax increases. This prevents a local school board from
raising funds for local initiatives and needs. An extra sales tax was added in lieu of
property taxes for public education funding. A property tax is a more stable form of
revenue than a sales tax because sales tax revenue is dependent upon fluctuations in the
economy. When there is a recession, such as the one the United States has experienced
over the last several years, there is a decrease in sales which results in less tax revenue for
school funding. As a result of the new funding model in South Carolina, there has been a
dramatic decrease in overall funding for all public school districts in South Carolina. To
complicate further the reduction in funding for school districts, the Upstate of South
Carolina has experienced a negative impact of the funding model because most districts
in the Upstate continue to experience rapid student population growth and the funding
formula does not allow for an increase in funding for rapid student population growth.
With tighter school budgets, districts are being forced to eliminate programs, especially
those that do not directly impact the classroom teacher to student ratio. Districts have
been forced to eliminate personnel as a solution to desperate economic times in an effort
to keep student to teacher ratios at the lowest possible levels. Although instructional
coaches have been a casualty of current desperate budget situations, some
superintendents continue to see the value of having instructional coaches in schools and
Page 22
9
work to maintain the presence of instructional coaches in schools. One Upstate South
Carolina superintendent, Lee D’Andrea, states,
I have long been a supporter of instructional coaches in the schools. Based on
volumes of research, an effective teacher in the classroom has the greatest
potential for a student’s academic achievement. The question then becomes how
do we best enhance the chance that the school /district has a highly effective
teacher in the classroom. I believe that an individual, trained in adult learning
strategies, well-versed in effective instructional strategies and modeling life-long
learning techniques has the best chance of ensuring that every teacher in the
building is highly effective. This obviously implies that the district invest in
effective professional development for instructional coaches. My strong belief is
that the return on the investment is one of the highest returns a district can yield
when planned and implemented as described (personal communication, May 27,
2011).
Instructional coaching is one of the programs that districts are continuing to
evaluate in terms of its direct impact on student achievement. If teachers, principals, and
instructional coaches do not believe the implementation of instructional coaching in
schools is effective for improving student achievement, the program could be eliminated;
however, if instructional coaching is perceived to be an effective tool for the
improvement of student achievement, the program could be spared from budget cuts.
The results of this study could have an impact on district policy makers when
determining their commitment to continue to fund instructional coaches with their
increasingly shrinking budgets.
Page 23
10
Research Questions
The overall research theme of the study is to determine to what extent the
utilization of research-based instructional coaching best practices impacts teachers’
perceptions of instructional coaching. The following research questions will be
addressed by this study:
1. To what extent does an instructional coach’s collaborating with teachers to
address school-wide instructional concerns and practices impact a teacher’s
perception of instructional coaching?
2. To what extent does an instructional coach’s collaboratively planning with a
teacher to identify when and how an instructional intervention or practice might
be implemented impact a teacher’s perception of instructional coaching?
3. To what extent does an instructional coach’s modeling instructional practices in a
teacher’s classroom impact a teacher’s perception of instructional coaching?
4. To what extent does an instructional coach’s observing teachers and providing
teachers with feedback impact a teacher’s perception of instructional coaching?
This study further examines participants’ demographic data impact on teachers’
perceptions of instructional coaching best practices. The demographic data will be
collected in three areas: years of teaching experience, level of education, and education
as the first career choice.
Page 24
11
Theoretical Framework
In examining theory, it is imperative to consider the framework that impacts the
implementation of an instructional coaching model. Marion describes theory as “a
worldview, a paradigm, a philosophy, a way of understanding reality” (2002, p. 4). This
view is imperative to understand better how people function in their daily work and how
they interact with those around them. Culture theory provides the paradigm, the
understanding for this study. Culture is “any stable order that emerges from interactive,
social dynamics” (Marion, p. 225). Since this study also focuses on teachers’
perspectives through various means of demographic data, the established culture among
these demographic groups impacts the implementation of an instructional coach.
Schools are places where people come together, whether it is the students or the
adults. Culture plays an important role in schools whether it is where students sit in the
cafeteria or how teachers interact with one another. As Marion (2002) states, “Members
of a given culture have a somewhat common perception of reality…these perceptions are,
for them, reality itself, which suggests that reality is more a perceived than a concrete
state” (p. 229). The relationship between an instructional coach and a teacher is part of
the school culture.
When teachers come together in a long-term work relationship, they experience
interaction and interdependency of the individual natures. Stable and enduring
relationships based on correlated outlooks emerge as teachers seek
accommodation among themselves and between the school and its environment
(Marion, p. 226).
Page 25
12
An awareness of how the culture impacts the relationship between an instructional coach
and a teacher is a critical component to the impact instructional coaching can have on a
school’s instructional program.
Data Collection and Research Design
The design used to evaluate teachers’ perceptions of instructional coaching is
based upon quantitative methodology. Superintendents or the designees from eight
school districts across the Upstate of South Carolina were contacted to gain access to the
principals in the districts. The eight school districts have been identified as utilizing
instructional coaches in their elementary schools. Once the superintendents or designees
granted access, principals were contacted and asked to facilitate the distribution of the
informational letter describing the study as well as the purpose and goals of the study and
the surveys for the study.
Teachers were asked to complete an online survey concerning their perceptions of
instructional coaching. These surveys included demographic data collection from the
study participants.
The study was designed to examine the perceptions teachers have of instructional
coaching. The perceptions of instructional coaching were determined through the
administration of a survey with a series of questions in which participants answered the
survey questions utilizing a typical four point Likert-type scale with “1” being Rarely and
“4” being Almost Always. The survey was administered to teachers in schools that are
implementing an instructional coaching model. The survey was sent to elementary
Page 26
13
school teachers in school districts in the Upstate of South Carolina. The survey had
several questions for the collection of demographic data on the study’s participants.
The conceptual framework applied in this study analyzed the survey data
collected from all of the participants divided into four categories of research-based best
practices of instructional coaching. The data were also subdivided into demographic areas
of years of teaching experience, level of formal education, and education as the first
career. The purpose of analyzing the data by demographics was to determine if the
perceptions of instructional coaching differ by the demographic subgroups.
All participants and schools in the study will remain anonymous. The participants
were assured of this by not requiring them to provide any information that could be used
to identify themselves other than the demographic data in the survey. The purpose of the
anonymity was for the participants to provide honest feedback on their perceptions of
instructional coaching.
Page 27
14
Conceptual Framework
Instructional Coaching Best Practices
Collaborating with teachers to address
school-wide instructional concerns
and practices
Collaboratively planning with a teacher to identify when and how an instructional
intervention or practice might be implemented
Observing teachers
and providing teachers
with feedback
Modeling instructional
practices in teachers’
classrooms
Demographics Levels of Education Years of Experience
Career Choice
Figure 1.1 Conceptual Framework
14
Page 28
15
Definitions
For the purpose of this study, the following terms are defined as follows:
Effectiveness – using researched-based methodology to improve the
overall instructional program in a school.
Instructional Coach (IC) – on-site professional developers who teach
educators how to use proven teaching methods to improve classroom
instructional delivery.
Instructional Coaching Best Practices–research-based practices identified
by the researcher for the purposes of this study:
o Collaborating with teachers to address instructional concerns and
practices.
o Planning collaboratively with a teacher to identify when and how
an instructional intervention or practice might be implemented.
o Modeling instructional practices in teachers’ classrooms.
o Observing teachers and providing teachers with feedback.
Delimitations
The implementation of an instructional coaching model is becoming more
widespread in schools and school districts across the nation. Teachers and principals at
all levels must understand the research-based functions of an instructional coach for the
Page 29
16
appropriate and the effective utilization of instructional coaching. This research will
bring attention to the everyday use and functions of instructional coaching in schools.
The participants in this study were in schools with instructional coaching
programs, but the participants’ degree of knowledge concerning instructional coaching
strategies could skew the collected data. Teachers’ opinions of specific personnel serving
in the role of the instruction coach could also skew the collected data. This study is
comprised of teachers from school districts in the Upstate of South Carolina. School
districts in the Upstate of South Carolina were utilized for the data collection due to the
diversity of school districts in the area as well as for the familiarity and professional
contacts of the researcher. The data collected from the surveys relies upon teachers’ self-
reporting their opinions and perceptions. As with any self-reporting survey, the data are
limited to the participants’ interpretation of the items, time and effort in responding to the
questions, and honesty in answering the items. The number of participants in the
research sample was based upon superintendents or designees granting permission for
this study to be conducted in their districts and the number of principals who
disseminated the study information to the appropriate personnel. Altogether, eight
superintendents or designees were contacted for permission to conduct the study in their
districts.
The culture of the schools is also a delimitation for this study. Just as culture
theory is used to understand the study better, culture theory is also a delimitation because
each school has its own unique culture that can have an impact on the experiences
teachers may have with instructional coaching. Instructional coaching may look very
different from one school to the next.
Page 30
17
The identity of the survey respondents and their specific schools will be
anonymous; however, the participating school districts will be known to the researcher.
The findings from this study are limited to the sample of teachers in the Upstate of South
Carolina participating in the study and any generalizations should be made with caution.
Organization of Study
This study is organized into five chapters, references, and appendixes. Chapter
two presents a review of the literature concerning instructional coaching and the
implementation of instructional coaching programs. Chapter three describes the details
of the research design and methodology of the study. The survey used to gather the data
will be described as well as the protocol followed for the analysis of the data. Chapter
four is an analysis of the data collected and a discussion of the findings from the data.
Chapter five summarizes the study and provides the conclusions drawn from the study.
Chapter five also contains further research recommendations. The study concludes with
references and appendixes. The appendix consists of a survey item analysis, the letters
sent to district superintendents or designees and to teachers, and the email sent to
principals.
Page 31
18
Chapter Two
Literature Review
With the ever increasing scrutiny being placed on schools, school leaders are
continuously examining programs to improve student learning. Often included in school
mission statements is the idea of creating a culture of life-long learning for students.
School leaders recognize and understand that life-long learning is not only important for
students, but it is also vital for teachers. The continued increase in accountability on
achievement for each student has brought greater emphasis for comprehensive
professional development programs in schools. Continued education and professional
development should be a central tenet for all educators and schools. “Traditionally,
teachers took workshops they were interested in or thought would be fun to learn” (Hall,
2005, p. 38). With a comprehensive professional development plan, the focus of
professional development has shifted to student learning, growth, and achievement. With
the passage of No Child Left Behind in 2001 and its reauthorization in 2009, school
districts have increased opportunities for funds to support professional development.
One of the tools school leaders are utilizing to provide teachers with a comprehensive
model of professional development is the use of instructional coaches. Schools began the
wide-spread implementation of the instructional coach model in the 1980s, but it has
become more prevalent in schools within the last decade.
Page 32
19
Adult Learning Theory
All too often teacher training is approached as a quick fix, with little to no follow
through to ensure long-term implementation. The format would typically be conducted
off-site and by a consultant paid to provide a single training session, rather than providing
school-specific, purposeful professional development. Practice such as this brings
attention to training, rather than professional development. With high stakes
accountability being placed on teachers and school administrators, more attention is being
given to the professional development of teachers and ways to improve classroom
instruction. Evidence has long existed that an individual teacher can have a significant
impact on student achievement, positive or negative (Marzano, Pickering & Pollock,
2001). According to research conducted by Sanders and Rivers (1996) of more than
100,000 students across the US, the most important factor affecting student learning is
the teacher.
Effective teachers appear to be effective with students of all achievement levels,
regardless of the level of heterogeneity in their classroom. If the teacher is
ineffective, students under the teacher’s tutelage will show inadequate progress
academically regardless of how similar or different they are regarding their
academic achievement (Wright, Horn, & Sanders, 1997, p. 63).
With teachers having a great impact on student achievement, school leaders have begun
to focus on a more comprehensive professional development model, part of which
includes the implementation of instructional coaching. Since instructional coaching
focuses on the adult, attention must be given to how adults learn best. Although
educators have long studied child and adolescent learning theory (pedagogy) in an effort
Page 33
20
to improve education, very little attention has been given to adult learning theory
(andragogy) or how to implement an effective professional development program for
teachers. Adult learning has been studied since the 1950s; it has most recently begun to
gain further attention with the rapidly progressing rates of college attendance not only
with traditional pathways of education, but also with online education.
Malcolm Knowles was one of the earliest American researchers of adult learning
in the 1970s. Knowles, Holton, and Swanson (2005) identified six guiding principles of
adult learning:
1. Adults need to know why they should learn something, and they need to
understand how it will benefit them.
2. Adults need to be self-directed learners where they are responsible for their own
learning and the direction it takes.
3. Adults’ experiences should be utilized in their learning, and these experiences
should be included so that the adults may draw upon their experiences. Adults
should be acknowledged for their experiences.
4. Adults seek learning as a way to deal better with real world tasks and problems.
They have a readiness to learn.
5. Adult learners like to have their learning relate and be applicable to their life and
be more problem-solving oriented rather than subject-oriented.
6. Adult learners are compelled more by intrinsic motivation rather than extrinsic
factors. Learning often provides the adult with fulfillment and satisfaction
(Knowles et al.).
Page 34
21
Adult learning theory provides many instructional implications for instructional
coaches working with teachers. Adult learners’ approach to learning shifts the
responsibility of learning from being placed on the teacher to the responsibility of
learning being placed on the student. Effective adult learning takes place in an interactive
environment, where the teacher takes on the role of a facilitator. The coach often works
as a mentor, providing a system of support rather than serving as a purveyor of
knowledge and skill. In learning, adults are often the best resources for one another;
therefore, discussion and collaborative group assignments should be employed when
teaching adults (Alkadhi, n.d). Knowles (1968, 1980) further identified several
implications that should be considered to support learning:
1. The environment should be comfortable, informal, and well lit.
2. The teacher must respectfully listen to what the students have to say.
3. Learner needs should be self-diagnosed and the evaluation of learning should
be left up to the student.
4. Adult learners should be involved in the planning of their learning and the
teacher should act as the facilitator (Knowles).
Knowles further determined the major difference between pedagogy and andragogy is
that children are dependent learners, while adults are autonomous learners (1980).
Additionally, Frey and Alman (2003) state, “Adult learning theory helps faculty to
understand their students and to design more meaningful learning experiences for them”
(p. 8). The implication is imperative for instructional coaches to understand because
most instructional coaches come directly from classrooms where they have worked
mostly with children, to now being a coach to teachers, adult learners.
Page 35
22
Klatt (1999) further expands on adult learning by identifying three important
principles to follow when working with adults in any learning environment. Klatt’s first
principle states that adults bring a wide variety of experiences with them to training
sessions; therefore, they have something to contribute to the learning process. Adults
learn at their own pace and in their own manner and have something to lose by sharing
their thoughts and ideas. Adults value the experience they have and do not want to be
treated as if those experiences do not contribute. Regardless of the need, adults cannot be
forced to change. Klatt’s second principle states that adults prefer to focus on real-life,
with immediate implications, rather than focusing on theoretical situations. With this
perspective, adults view learning as a means to an end rather than the end itself. With
adults the learning must take on personal meaning and have immediate value to their
practices and/or situations. Klatt’s third principle states that adults are accustomed to
being active and self-directing; therefore, the best learning is based on experience.
Adults learn best when they work cooperatively with others and must be provided
opportunities to engage actively in activities where they can discover solutions.
The effectiveness of instructional coaching is dependent upon understanding how
adults learn and carefully planning learning opportunities. In creating professional
development opportunities for teachers, school leaders should examine not only the
content to be learned but also ways the learning will take place. If adult learning theory
is not considered, schools could be in danger of merely providing training rather than a
comprehensive professional development program.
Page 36
23
What is Instructional Coaching?
Although there has been widespread implementation of instructional coaches in
schools across the country, there is not a standard model for instructional coaching.
Implementation varies greatly from state to state and even within states from district to
district. Models include district level coaches who split time between schools to coaches
who work full time in one school. Coaching models also vary to include schools having
content specific coaches. Regardless of the implementation model, the ultimate goal of
the coach is to improve classroom instruction. Kise (2006) defines coaching as “the art
of identifying and developing a person’s strengths. Even when a teacher needs to build
skills in areas that are natural weaknesses for them, coaches help them do that through
techniques that utilize strengths” (p. 139).
Knight (2004a) from the University of Kansas Center for Research on Learning
defines an instructional coach as an on-site professional developer who teaches educators
how to utilize research-based instructional strategies in the classroom. According to
Knight, instructional coaches work as partners to facilitate teachers’ professional learning
through mutually enriching, healthy relationships (p. 4). Knight further defines
instructional coaches as on-site professional developers who work with teachers to assist
them with the incorporation of research-based instructional practices, work with students
to demonstrate effective practices to teachers, and collaborate with teachers in choosing
and implementing research-based interventions to improve classroom instruction (Knight,
2007b). Knight’s model of instructional coaching establishes the instructional coaching
relationship as a partnership with teachers. His approach is built around seven core
Page 37
24
principles for a partnership: equality, choice, voice, dialogue, reflection, praxis, and
reciprocity.
Equality – Building relationships with teachers as equals. When collaborating
with teachers, each is considered equal; therefore, no one’s view is more
important than anyone else’s.
Choice – One individual does not make decisions for another. Teacher choice
is understood in the partnership and to every extent possible, teachers have a
great deal of choice in what and how they learn.
Voice – Individuals must have an opportunity to express their points of view.
With instructional coaching, teachers must know they are free to express their
own opinions about the intended learning. Since instructional coaching
involves many teachers, an instructional coach should encourage instructional
conversation among teachers and heed the opinions of the teachers.
Dialogue – Encouragement of others to speak their minds and to listen to
others authentically. For an instructional coach, dialogue is more about
listening than speaking. Instructional coaching involves engaging teachers in
conversation about content and instructional practices. Instructional coaching
involves learning alongside teachers.
Reflection – Respect professionalism and provide enough information to
facilitate decision-making. Instructional coaching encourages collaboration
among teachers to consider ideas before adopting them. Reflection provides
opportunity for teachers to choose or reject ideas rather than merely perform a
task without thinking.
Page 38
25
Praxis – Reconstruct and use content in the manner that is most useful.
Instructional coaching involves facilitation of teacher collaboration focusing
on how to use new ideas and methods in the classroom.
Reciprocity – Rewarding all members with individual contributions.
Instructional coaching involves learning not only by the teachers but also by
the instructional coach. The instructional coach learns about teachers’
classrooms and the strength and weaknesses of new instructional strategies in
action in classrooms. Instructional coaches believe that teachers’ knowledge
and expertise are just as important as their own, and they have confidence in
teachers’ abilities to apply new instructional strategies to their own classrooms
(pp. 24-26).
Marzano’s research in What Works in Schools: Translating Research Into Action
(2003) determines that in order for schools to improve student learning, schools must
have an understanding of and implementation of a strong and viable curriculum,
challenging goals, and effective feedback. With the ultimate goal of instructional
coaching being improved classroom instruction and Marzano’s research findings, Moran
(2007) states there are three essential principles to coaching: establishing a school culture
that recognizes collaboration as an asset, developing individual and group capacity to
engage in creative problem solving and self-reflection, and providing a continuum of
professional learning opportunities for adults to acquire and use specific knowledge,
skills, and strategies (p. 6). All too often teachers work in isolation rather than utilizing
each other’s expertise and strengths to guide improved instructional practices. An
instructional coach plays a pivotal role in facilitating collaboration, not only between the
Page 39
26
instructional coach and a teacher but also among teachers. Instructional coaching is a
partnership between a coach and a teacher as well as a coach and a school (Kise, 2006).
Administration’s Role in Instructional Coaching
Research indicates school leadership has a substantial impact on student
achievement (Marzano, Waters, & McNulty, 2005). One of the key components of
school leadership is the principal in the role of instructional leader. Regardless of the
many things a principal must do on any given day, the role as the instructional leader is
one of the most crucial roles in moving a school forward. Research also indicates “that
an administrator’s ability and willingness to provide input regarding classroom practices
was one of the most highly valued characteristics reported by teachers” (Marzano et al.,
p. 54). Marzano et al.’s research further states that a school leader’s involvement in
curriculum, instruction, and assessment has a correlation of .20 and knowledge of
curriculum, instruction, and assessment has a .25 correlation to student achievement (pp.
42 – 43). A principal who is involved in curriculum, instruction, and assessment or is
knowledgeable of curriculum, instruction, and assessment better understands the
importance of improving a school’s instructional program. Part of the instructional
leadership role of a principal in a school or district utilizing an instructional coaching
model is working with the instructional coach on a daily basis and providing the
instructional coach with the resources needed to help teachers. School leaders must be
cautious with the implementation of instructional coaching as a model of school reform.
Principals must understand the true role of instructional coaching and be cautious not to
Page 40
27
use the instructional coach as another administrator. “Principals who do not understand
the importance of protecting the coaching relationship may act in ways that make it
difficult for a coach to be successful” (Knight, 2006, p.24). Kowal and Steiner (2007)
state that principals must play a pivotal role in the development of the instructional
coaching program in a school.
Because instructional coaching models vary tremendously, school leaders need to
identify the coaching approach or program that will best meet their instructional
goals. Initially, this means recognizing the differences between these various
approaches. While some coaches train teachers how to use a particular approach
within a content area, such as literacy or mathematics, others work to improve
general instructional practices, such as data assessment and classroom
management, or to promote a more collaborative culture among the faculty. In
some cases, coaching programs have multiple goals. Whatever the design, it is
clear that instructional coaching is not a program that simply can be adopted and
“stamped” on a school. A successful effort requires shaping the program to meet
teachers’ needs and to address meaningful goals for student learning (Kowal &
Steiner, p.1).
Steiner and Kowal further state that there are three critical components in shaping the
implementation of an instructional coaching program that school leaders must take.
School leaders must clarify the coach’s roles in a school, structure time strategically to
allow for teachers to participate in coaching activities, and provide the instructional coach
with clear, visible support (p. 5). Along with providing sufficient time for nurturing a
Page 41
28
system that enables instructional coaches to perform effective professional development,
Tallerico (2007) states that principals must also honor history and strengthen the political
basis for support.
Evidence is slowly emerging that instructional coaching can improve classroom
instruction and ultimately student achievement, but according to Black (2007), school
administrators must provide certain conditions for the success. First, coaches must be
given sufficient time to work directly with teachers on classroom instruction. School
administrators must make sure coaches are not assigned to be a substitute teacher or
tasked to complete clerical duties. Secondly, coaches must have on-going professional
development and training in research-based practices such as classroom instruction,
curriculum, assessment, and classroom management. Coaches must also have training in
communicating and demonstrating effective practices in the classroom. Third, coaches
must build trusting partnerships with teachers before offering suggestions for change.
Fourth, coaches must work closely with the principal on the school’s instructional
program and must play a significant role in the school’s comprehensive improvement
plan and must be committed to raising student achievement. Fifth, coaches must be
master teachers who are respected and who are flexible, friendly, and likeable. Sixth,
coaches must be part of the design for their own evaluation and never server as a teacher
evaluator (p. 44).
Pankake and Moller (2007) outline eight strategies that principals must utilize that
encourage and support coaching models. The first strategy is the principal and the
instructional coach must collaboratively develop an action plan for the students’
instructional needs. This plan should delineate specific roles and responsibilities with a
Page 42
29
timeline for short-term and long-term goals. The second strategy is the principal and
coach must acknowledge each other’s differing needs in the relationship to meet those
needs. The principal must have frequent, but brief, meetings with the coach to keep up to
date on the interactions throughout the school; advise the coach on the selection of
individuals for committees, etc.; provide specific agenda items for staff meetings for the
coach to report progress and acknowledgement of teachers; and understand that change
will take time as the coach forges new relationships with teachers. The third strategy is
the principal must be accessible as a resource to the coach. As a resource the principal
assists the coach in generating ideas for dealing with conflicts among staff members,
brainstorming ideas for scheduling conflicts, and discussing professional development
opportunities and ideas for some or all teachers. The fourth strategy is the principal
provides access to both human and fiscal resources. Without providing coaches with the
necessary resources, a principal can set up an instructional coaching program for failure.
Resources come in a variety of forms such as student data, time, space, contacts at other
schools or other levels within the school system, secretarial assistance, technology, and
professional development. The fifth strategy is the principal maintains the instructional
coaching focus for the instructional coach. The principal must only allow a coach to be
utilized for activities that are related to teaching and learning. Activities related to
managerial and operational activities such as student discipline, textbook inventory, or
buses cannot be part of an instructional coaching program. The sixth strategy for a
principal is to help the instructional coach maintain balance. Principals must resist giving
an instructional coach additional responsibilities because he or she performs well. The
seventh strategy is the principal must protect the coach’s relationship with peers. The
Page 43
30
transition from being a classroom teacher to an instructional coach is delicate. Principals
must anticipate fragile relationships between the coach and teachers, particularly in the
beginning. The principal should share information coaches may need to know regarding
teachers’ obligations at school, existing conflicts among teachers, school and district
policies, and budget parameters. The principal should initially assign low-risk tasks to
help ensure coaching success, celebrate small successes, and find opportunities for
coaches to share successes with people outside of the school. Building the confidence of
the instructional coach helps better ensure an effective instructional coaching program.
The eighth strategy is for the principal to provide the instructional coach with leadership
development opportunities. Just because a teacher is confident in leading students does
not mean he or she will be confident in leading adults. Principals must find opportunities
for coaches to learn to work with diverse adult perspectives (Pankake & Moller, pp. 33 –
36).
Across the nation, there is very little consistency with the formal qualifications of
instructional coaches. No state officially certifies instructional coaching. With that, the
qualities and skills of an instructional coach are important for school leaders to
understand. Kowal and Steiner (2007) developed three broad categories of skills that an
effective instructional coach should possess: pedagogical knowledge, content expertise,
and interpersonal skills. Regardless of the researcher, it is virtually unanimous that an
effective instructional coach should be an expert master teacher who possesses a
thorough understanding of how students learn and be skilled in implementing research-
based effective instructional strategies. “A good instructional coach must be able to go
into any classroom and provide a model lesson that responds to an individual teacher’s
Page 44
31
needs” (Knight, 2004b, p. 18). Hiring the right instructional coach is important to the
success of the implementation model. “Next to the principal, coaches are the most
crucial change agent in a school” (Fullan and Knight, 2011, p. 50).Instructional coaches
must be disciplined, organized, professional, flexible, likable, good listeners with great
people skills, and committed to learning (Richard, 2004). Guiney (2001) states that
instructional coaching requires a person to possess “a calm disposition and the trust-
building skills of a mediator combined with the steely determination and perseverance of
an innovator” as well as “the ability to know when to push and when to stand back and
regroup in the long-term process of adopting new approaches to galvanize a school to
function differently” (pp. 741 – 742). Feger et al. (2004) state that coaches should have
interpersonal skills, content knowledge, pedagogical knowledge, knowledge of
curriculum, awareness of coaching resources, and knowledge of the practice of coaching.
The conclusion of a broad range of research on school improvement clearly points
to the principal as having the pivotal role for instructional leadership. Kowal and Steiner
(2007) state that there is growing recognition among scholars and practitioners that the
demands placed on school administrators often make the role as the instructional leader
unrealistic because of the managerial aspects of their job. With the many challenges in
the principalship, it is imperative for a principal to work to establish an effective
instructional coaching model to improve a school’s instructional program and provide the
instructional coach with the needed support. “For an instructional coaching program to
be effective, school leaders need to play an active role in selecting trained coaches,
developing a targeted coaching strategy, and evaluating whether coaches are having the
desired impact on teaching and learning” (Kowal and Steiner, p. 1). Principals and
Page 45
32
coaches share equal responsibility for an effective and successful instructional coaching
program (Killion, 2007).
Best Practices in Instructional Coaching
One of the biggest mistakes a school district or school can make with the
implementation of instructional coaching is not to have a model or focus. “The intense
pressure to foster significant improvements in student achievement can lead some leaders
to promote many school improvement efforts within a single year. However, promoting
too many interventions can actually be counterproductive” (Knight, 2005, p. 20). In
Instructional Coaching: A Partnership Approach to Improving Instruction, Knight
(2007b) refers to four instructional issues that instructional coaches should bring to focus:
behavior, content knowledge, direct instruction, and formative assessment. Knight states
for behavior, “Coaches can help by guiding teachers to articulate and teach expectations,
effectively correct behavior, increase the effectiveness of praise statements, and increase
students’ opportunities to respond” (p. 23). For content knowledge, “Coaches must know
how to access state standards for courses and how to help teachers translate those
standards into lesson plans” (p. 23). For direct instruction, coaches work with teachers
on implementing instructional practices such as “advanced organizers, model the thinking
involved in whatever processes are being learned, ask a variety of high-level questions,
and ensure that students are experiencing engaging, meaningful activities” (p. 23). For
formative assessment, coaches work with teachers on implementing assessments so that
the teachers “know whether their students are learning the content and reasoning being
Page 46
33
taught and whether each student’s skills or disposition is being affected by instruction”
(p. 23).
According to Brady (2007), there are six critical areas of practice for instructional
coaching to be effective. First, the instructional coach must establish trusting
relationships and open communication. Coaches must “discuss instructional issues with
teachers in a way that enlightens without threatening or offending the teachers. The
coach must establish and maintain the trust and respect of teachers” (p. 47). Second, the
instructional coach must understand adult learners. “Coaches must demonstrate that they
know how adults learn, give colleagues time to process new information, and resist
sending the message that someone is trying to ‘fix’ them” (p. 47). Third, instructional
coaches must continually update their knowledge of subject content and instructional best
practices. Fourth, instructional coaches must master the art of teaching.
Coaches and their principals must be ahead of the curve in learning how to help a
teacher in a nonthreatening way to dissect a lesson and promote internal reflection
and problem solving. The goal is to build teachers’ capacity to analyze what they
are doing in the classroom so they can expand on what works and change what
doesn’t (p. 48).
Fifth, instructional coaches must link student work to data and assessments so that
teachers will make adjustments to instruction. “The coach at times must confront a
reluctant teacher with hard data to demonstrate that a teacher’s instructional style is not
promoting learning among his or her students” (p. 48). Sixth, the instructional coach
must network with other instructional coaches. Just as teachers must collaborate with
Page 47
34
other teachers, instructional coaches must collaborate with other instructional coaches.
“These support networks allow coaches to remain grounded in the work of student
achievement and operate strategically as catalyst for change” (p. 49). In earlier research,
Brady (2005) lists behavior characteristics of high-performing coaches as: confidence,
leadership, open communication, collaboration, relationship savvy, persistence, inquiry
orientation, organization, resourcefulness, optimism, authentic, and compassionate, yet
focuses on student data.
Best practices of instructional coaching are well grounded in the development of a
partnership between the coach and the teacher. Knight (2007a) discusses the importance
of instructional coaching practices being a balance of “bottom-up and top-down strategies
to be effective. Coaches should position themselves as equal partners with fellow
teachers, basing their professional actions on partnership principles” (p. 27). Knight
further states that in order for teachers to change their ineffective teaching habits,
instructional coaches “must offer a practice that is both more powerful and easier to use
than the current strategy” (p. 28). Knight also states that instructional coaches must use a
variety of communications strategies, plan first encounters with teachers that are quick,
easy, powerful, and highly effective, and target teacher leaders within the school as early
adopters (2007a). In earlier research, Knight (2004b) describes best practices of
instructional coaching: conducting one-to-one or small-group meetings with teachers;
identifying how best to collaborate with a teacher or teachers to address their most
pressing concerns; guiding teachers through instructional manuals, checklists, and other
materials; collaboratively planning with teachers to identify when and how an
intervention might be implemented; preparing materials for teachers to assist with
Page 48
35
instruction; modeling instructional practices in teachers’ classrooms; observing teachers;
and providing teachers with feedback (p. 1). Pankake and Moller (2007) describe
instructional coaching best practices as: helping staff see how new instructional
approaches relate to the shared vision for student learning; leading decision making for
the school’s professional learning plan; designing professional learning experiences;
facilitating groups to examine, design, and use appropriate teaching and learning
strategies; being available daily to answer teachers’ questions about teaching and
learning; mentoring new teachers; working with individual teachers who request
assistance; pulling together assessment data for teachers to use in their decision-making;
and seeking outside resources for teachers (p. 34).
Summary
With an ultimate goal of improving student achievement, instructional coaching
relies on three overarching principles:
1. Coaching should help establish a school culture that recognizes collaboration
as an asset.
2. Coaching should develop individual and group capacity to engage in creative
problem solving and self-reflection.
3. Coaching should provide a continuum of professional learning opportunities
to support adults in their acquisition and use of specific knowledge, skills, and
strategies (Moran, 2007, p. 6).
Page 49
36
Research will never be able to identify strategies that work with every student in every
classroom or every teacher in every school, but it can tell us which strategies have the
best chance of working well (Marzano, 2007). The utilization of an instructional
coaching program in a school provides an on-site professional developer to work with
teachers daily on the three areas Marzano states are characteristics of effective teaching:
1. Use of effective instructional strategies.
2. Use of effective classroom management strategies.
3. Effective classroom curriculum design (Marzano, 2007, p. 5).
As Knight (2005) states, “Instructional coaching is not a quick fix, but when it
comes to creating an exemplary faculty, quick fixes are rarely the answer. Instructional
coaching involves dedicated, persistent, meaningful collaboration among teachers,
coaches, and principals” (p. 21). The student learning goals may differ from school to
school, with school needs varying greatly. With the wide-spread implementation of
instructional coaching programs, school leaders must continue to examine research on
adult learning, instructional coaching as a practice, the administration’s role in
instructional coaching, and best practices of instructional coaching. As Knight states,
When highly qualified instructional coaches are in place, when they focus on the
right teaching methods, and when they take a partnership approach, real
improvement can happen. Most principals find it difficult to find time to do
everything they need to do to support the professional growth of their teachers.
However, when an instructional coach and a principal work together in a true
partnership, the instructional coach can significantly help a principal with the
Page 50
37
challenging, time-consuming, and important work of developing an exemplary
faculty (2005, p. 21).
Page 51
38
Chapter Three
Methodology of the Study
The purpose of this study was to examine teachers’ perceptions of research-based
instructional coaching best practices in schools within the Upstate region of South
Carolina and to determine to what extent the demographic groups for teachers impact
teachers’ perceptions of instructional coaching best practices. The researcher identified
four researched-based instructional coaching best practices: collaborating with a teacher
or teachers to address instructional concerns and practices, planning collaboratively with
teachers to identify when and how instructional intervention or practice might be
implemented, modeling instructional practices in teachers’ classrooms, and observing
teachers and providing them with feedback. Specifically, the research examined data
within instructional coaching best practices categories and answered four research
questions:
1. To what extent does an instructional coach’s collaborating with teachers to
address school-wide instructional concerns and practices impact a teacher’s
perception of instructional coaching?
2. To what extent does an instructional coach’s collaboratively planning with a
teacher to identify when and how an instructional intervention or practice might
be implemented impact a teacher’s perception of instructional coaching?
Page 52
39
3. To what extent does an instructional coach’s modeling instructional practices in a
teacher’s classroom impact a teacher’s perception of instructional coaching?
4. To what extent does an instructional coach’s observing teachers and providing
teachers with feedback impact a teacher’s perception of instructional coaching?
Additionally, the data were analyzed by three demographic groups: years of
teaching experience, level of education, and education as the first career choice. To
answer the research questions, the researcher designed a survey (Teachers’ Perceptions
of Instructional Coaching) to determine to what extent teachers perceive specific
instructional coaching best practices as beneficial professional development practices.
To determine the demographic data, the survey included items specific to each
demographic group. The demographic subgroup for years of teaching experience was
developed as a survey item in increments of 5 years up to 20 years and more, which is
currently the typical number of years of teaching experience required for retirement in
South Carolina. The subgroups were 0 – 5 years, 6 – 10 years, 11 – 15 years, 16 – 20
years, and more than 20 years. The demographic group for level of education was
developed as a survey item modeled after the South Carolina teachers’ licensure
educational levels. The educational level subgroups are bachelor’s degree, bachelor’s
degree plus 18 hours, master’s degree, master’s degree plus 30 hours, and doctorate. The
demographic group for education as the first career was developed as a survey item in the
form of a question, “Is education your first career?” The answer options are “yes” or
“no.”
Page 53
40
To secure data for Research Question 1, the survey included items regarding the
instructional coaching best practice identified as collaborating with teachers to address
school-wide instructional concerns and practices. To secure data for Research Question
2, the survey included items regarding the instructional coaching best practice identified
as planning collaboratively with a teacher to identify when and how an instructional
intervention or practice might be implemented. To secure data for Research Question 3,
the survey included items regarding the instructional coaching best practice identified as
modeling instructional practices in teachers’ classrooms. To secure data for Research
Question 4, the survey included items regarding the instructional coaching best practice
identified as observing teachers and providing teachers with feedback. The researcher
identified four research-based instructional coaching best practices and created five
survey items for each best practice that are focused on the teacher reflecting on his own
practice. The researcher also created survey items that focus on each of the four
research-based instructional coaching best practices as instructional coaching practices in
the teacher’s school.
Research Design
This study utilized quantitative research methodology. Specifically, the research
was based upon the measures of central tendency and dispersion. “Measures of central
tendency are statistics that provide a summarizing number that characterizes what is
typical or average for those data” (Rea & Parker, 2005, p. 89). Quantitative data were
collected through survey analysis. The quantitative data were disaggregated into four
Page 54
41
instructional coaching best practice categories and the utilization of specific instructional
coaching best practices as identified by the researcher were compared in each of the
categories. The data were also disaggregated by the three demographic groups: level of
education, years of teaching experience, and education as the first career choice. The
combined level of data analysis allowed for more than one level of data analysis in order
to determine specific teacher demographic perspectives on instructional coaching as a
practice. The demographic disaggregation allowed for there to be targeted groups for
instructional coaches and school leaders as they begin instructional coaching programs or
when a new instructional coach is hired. It is important for instructional coaches to have
early successes (Knight, 2007b). By having targeted audiences at the onset of
instructional coaching, the chances of success are greater.
For the data collection, a survey was utilized. The use of survey data “provides a
quantitative or numeric description of trends, attitudes, or opinions of a population by
studying a sample of that population” (Creswell, 2009, p. 145). Teachers in elementary
schools will complete a researcher-designed survey, Teachers’ Perceptions of
Instructional Coaching. Survey research was selected because the methodology allows
the researcher to gather data and information about a larger targeted population by
studying only a small portion of that population (Rea & Parker, 2005). “If the researcher
needs personal, self-reporting information that is not available elsewhere, and if
generalization of findings to a larger population is desired, sample survey research is the
most appropriate” (Rea & Parker, 2005, p. 4). Using the survey data from the population
sample allowed for the generalization of the data for the entire population. “A special-
Page 55
42
purpose survey may be the only way to ensure that all the data needed for a given
analysis are available and can be related” (Fowler, 2009, p. 3).
The survey items were grouped into five categories. The first category was
demographic data. The remaining four categories were based upon the researcher
identified instructional coaching best practices. Categories two through five were each
based on a specific instructional coaching best practice and each had six items specific to
that category. Each category had survey items based upon the utilization of the identified
instructional coaching best practice for the participants’ and for the participants’ schools.
The best practices were not identified to the survey participants.
Population and Sample
The participants in this study were teachers in elementary schools in the Upstate
region of South Carolina. The Upstate region was selected because of the proximity to
the researcher and professional relationships of the researcher, and elementary school
level was selected because instructional coaches are more prevalent at the elementary
school level than at the middle or high school levels. The actual number of participants
depended upon which school districts had instructional coaches and which
superintendents or the designee granted permission for the study to be conducted in their
districts. District and school websites were reviewed and eight school districts in the
Upstate of South Carolina were identified as having instructional coaches in elementary
schools. Of the eight districts, the size and demographics of the districts and the schools
varied greatly. One district is the largest school district in South Carolina; other districts
Page 56
43
are medium to small in size, with the two smallest districts having only four elementary
schools each. The eight districts represented urban and suburban as well rural schools
and the schools’ socioeconomic status spans across the entire spectrum. Although the
school districts varied in size, each was under the direction of its own superintendent.
The survey participants did not identify the school or the school district in which they
taught so that the research might be generalized.
An email (see Appendix A) was sent to seven of the eight superintendents or the
designees requesting permission to conduct the survey research in their districts. After
four days, another email was sent to the four superintendents who had not responded to
the previous email. One week after the initial email, a letter containing the same
information as the email (see Appendix A) was sent to the districts that had not
responded to the email. The eighth district required the researcher to complete a
“Request to Conduct Research” application. This district required the researcher to
contact the elementary principals in that district requesting their schools’ participation in
the study. Once permission was granted by the principals (twenty-three), the researcher
compiled a list of schools that were willing to have the survey link emailed to the
teachers. The researcher then provided the district designee with the list, and the
application was approved.
The assistance of the superintendent or the designee was necessary and was a
critical component in gaining access to principals, and ultimately, access to teachers.
Permission to conduct research was granted by four of the eight school districts. Once
permission was granted by the superintendent and/or the designee, the principals of the
elementary schools in the participating districts were contacted via email (see Appendix
Page 57
44
B). The email described the goals of the study, the procedure for distributing the survey,
and contact information of the researcher. A letter for the teachers (see Appendix C) was
attached to the principal email for distribution to teachers. The teacher letter described the
purpose of the research and the goal of the survey. The letter contained Internet links to
the survey and included contact information of the researcher and the researcher’s advisor
in case there were any questions or concerns regarding participation in the survey. The
correspondence included a statement of anonymity as well. Phone calls and emails were
made to principals who are known professionally by the researcher.
The survey data collection period was approximately four weeks due to the timing
of district- level approval. The survey was administered to teachers from mid February
to mid March of the 2012-2013 school year. The timing of the survey allowed teachers
approximately seven months of the school year to have worked in a school with an
instructional coach.
Instrumentation
A survey (Teachers’ Perceptions of Instructional Coaching – see Appendix D)
was utilized to collect data. The survey was researcher developed and consisted of close-
ended questions. The survey was developed following a review of the literature on
instructional coaching. The close-ended questions utilized a four point ordinal Likert-
type scale with “1” being Rarely, “2” being Sometimes, “3” being Usually, and “4” being
Almost Always. The first three items on the survey were based upon demographic data
from the respondents and were utilized to disaggregate further the data collected to
Page 58
45
determine teachers’ perceptions of instructional coaching within the demographic groups
of years of teaching experience, formal level of education, and education as the first
career choice. The demographic data were also closed-ended questions utilizing
categorically specific options for each item. By having close-ended questions, the
reliability of the survey data was enhanced because of the uniform data it provided (Fink,
2009). The surveys were self-administered by the teachers who work in schools where
there is an instructional coaching program. The survey was accessed on-line and took
approximately ten to twenty minutes to complete.
According to Fowler (2009), to increase the reliability of surveys, “each
respondent in a sample is asked the same set of questions” (p. 88). Fowler further states,
“In order to provide a consistent data collection experience for all respondents, a good
question has the following properties:
The researcher’s side of the question-and-answer process is entirely
scripted so that the questions as written fully prepare a respondent to
answer questions.
The question means the same thing to every respondent.
The kinds of answers that constitute an appropriate response to the
question are communicated consistently to all respondents” (Fowler, 2009,
p. 89).
All participants in this study were administered the same survey. To ensure internal
consistency and reliability of the survey items, the Cronbach alpha formula was applied
to the survey. Each participant of the survey was allowed to log into the website and
Page 59
46
answer the survey items only once. This further ensured data reliability. For content
validity, the survey was reviewed by district- level administrators and school level
administrators who work with instructional coaches. A focus group of three teachers was
further utilized for content validity. The teachers who participated in the focus group had
a variety of teaching experiences such as years of experience varied from being a first
year teacher to having taught for over 30 years. Each of the focus group teachers also
had education experiences in other states and in other schools. Also, the survey was
field tested by teachers who are in a school with an instructional coaching program but
whose data is not a part of the study. The purpose of the field test was to provide the
researcher with clarity and understanding of the wording for each survey item, to
determine that the instructions for completing the survey were easily understandable, to
determine that sufficient detail was provided for survey items, and to determine that
adequate answer options were given. With feedback from the field test, survey items
were adjusted for better understanding by the respondents. The wording of several
survey items was simplified and made more concise to address only one component of
instructional coaching best practices per item and to utilize language that teachers were
more familiar with using.
Data Collection Procedures and Analysis
To collect the survey data, the researcher utilized an on-line survey instrument,
SurveyMonkey. An analysis of the survey responses was completed utilizing standard
Page 60
47
descriptive statistical procedures. The data were processed through the on-line survey
provider as well as Excel.
The data were disaggregated into several different categories for analysis. First,
the data were analyzed by all respondents regardless of the demographic groups to which
the respondents belonged. The data were analyzed using the measures of central
tendency for each of the four research-based best practices of instructional coaching to
determine teachers’ perspectives of instructional coaching as a professional development
practice. The data were then further disaggregated for analysis using the measures of
central tendency for each of the three demographic groups: years experience, education
level, and career choice for each instructional coaching best practice.
Limitations
A major limitation to this study was the participation from districts. Participation
in the study consisted only of elementary schools in the four districts for which the
superintendent or designee granted permission for the study to be conducted. A similar
limitation was that the survey needed to be distributed to teachers in each school via the
school principal. If the principal chose not to disseminate the survey information to
teachers in his/her school, then the number of participants was lowered.
School and district identifying information was required for completion of the
survey. Information on whether the study participants were from small, medium, or large
schools or school districts was not acquired by the researcher. Comparisons were not
Page 61
48
made as to whether or not the size of the school and/or district contributed to teachers’
perceptions of instructional coaching.
Conclusion
In designing the research methods for this study, the researcher chose to utilize
survey data collection. The survey was developed by the researcher, and demographic
data from each respondent was collected. Although specific demographic data were
collected, the respondents’ identities as well as the schools and school districts remained
anonymous to the researcher. The survey data were gathered through close-ended ordinal
items responses. Chapter Four will present the data generated by the Teachers’
Perception of Instructional Coaching Survey as well as an analysis of all data collected.
Chapter Five will summarize the results of the study, draw conclusions, and discuss the
implications of the findings of the study.
Page 62
49
Chapter Four
Analysis of the Data
This study examined teachers’ perceptions of research-based best practices of
instructional coaching. Specifically, this study examined teachers’ perceptions of
instructional coaching as a means of collaborating with teachers to address school-wide
instructional concerns and practices, collaboratively planning with a teacher to identify
when and how an instructional intervention or practice might be implemented, modeling
instructional practices in a teacher’s classroom, and observing teachers and providing
teachers with feedback. The data were collected utilizing the researcher-designed survey,
Teachers’ Perceptions of Instructional Coaching and measures of central tendency and
descriptive statistics were utilized to analyze the data. This chapter presents an analysis
of the data collected from teachers in the Upstate of South Carolina utilizing the
Teachers’ Perceptions of Instructional Coaching survey data.
Research Questions
The overall research theme of this study is to determine to what extent the
utilization of research-based instructional coaching best practices impact teachers’
perceptions of instructional coaching. Four research questions were investigated in this
study:
Page 63
50
1. To what extent does an instructional coach’s collaborating with teachers to
address school-wide instructional concerns and practices impact a teacher’s
perception of instructional coaching?
2. To what extent does an instructional coach’s collaboratively planning with a
teacher to identify when and how an instructional intervention or practice might
be implemented impact a teacher’s perception of instructional coaching?
3. To what extent does an instructional coach’s modeling instructional practices in a
teacher’s classroom impact a teacher’s perception of instructional coaching?
4. To what extent does an instructional coach’s observing teachers and providing
teachers with feedback impact a teacher’s perception of instructional coaching?
This study further examined participants’ demographic data impact on teachers’
perceptions of instructional coaching best practices. The demographic data were
collected in three areas: level of education, years of teaching experience, and education
as the first career.
Description of Population
Elementary school teachers who work in four Upstate of South Carolina school
districts were the participants of this study. Through an analysis of Upstate school
districts’ programs, it was determined that eight districts utilize instructional coaching
programs in their elementary schools. An email (Appendix A) was sent to seven of the
eight districts’ superintendents or their designees. The email described the purpose of the
Page 64
51
study and requested permission to conduct the study in their respective districts. One
district required the researcher to complete a Permission to Conduct Research
application. For the districts that did not respond to the initial email, the email was resent
four days later and a follow-up letter containing the same information as the emails was
sent to the superintendent or the designee one week after the initial email. Of the eight
districts contacted, four districts granted permission for the research to be conducted in
their elementary schools. Once permission was granted, an email describing the purpose
of the study was sent to each of the districts’ elementary school principals (Appendix B).
The email requested that principals allow the survey to be conducted in their school and
to forward the electronic survey link using SurveyMonkey as well as a letter of invitation
to the teachers (Appendix C) at their school. The letter of invitation to the teachers
described the purpose of the study and also ensured teacher anonymity and
confidentiality of the study. Thirty-seven elementary school principals were sent the
survey link. Due to the staggered responses of districts, the survey window was
approximately four weeks.
Three hundred and fifty participants responded to the survey. Thirty-seven
principals were sent emails requesting the distribution of the survey link and invitation
letter, but due to the anonymity of the survey, it is not possible to know which principals
sent the survey information to the teachers in their schools. For the 37 schools, there
were approximately 1330 teachers. “All surveys hope for a high response rate. No
single rate is considered the standard, however” (Fink, 2009, p. 62).
Page 65
52
Instrumentation
The researcher developed the survey, Teachers’ Perceptions of Instructional
Coaching (Appendix D), which was used to gather data for this survey. The survey was
divided into five sections: demographics and the four instructional coaching best
practices categories: collaboration on school-wide instructional concerns, collaboration
on instructional intervention, modeling instructional practices, and observing and
providing feedback. Teachers were presented with 24 items, 6 items for each
instructional coaching best practice category. Each of the six items in each best practice
category was a specific instructional component of the identified best practice. The
categories of best practices were not made known to the participants. Likert scale type
items provided four options: rarely, sometimes, usually, and almost always. All items,
including demographic data, utilized close-ended questions. The demographic data
utilized categorically specific options for each item. The three demographic items were:
years of teaching experience, education level, and education as the first career. For years
of teaching experience, increments of five years from 0 to more than 20 years were
utilized. For education level, the subgroups were modeled after the South Carolina
teachers’ licensure educational levels of bachelor’s degree, bachelor’s degree plus 18
hours, master’s degree, master’s degree plus 30 hours, and doctorate. For education as
the first career, participants were asked, “Is education your first career?” The answer
options were “yes” or “no.”
The Cronbach alpha was used to measure the reliability of the survey. Cronbach
alpha coefficients were calculated for each of the best practices category. The Cronbach
alpha coefficient range for the four categories was .85 to .93 with a Cronbach alpha for
Page 66
53
the items collectively of .97. According to statistical practice, alpha values above .70 are
considered acceptable; therefore, the Teachers’ Perceptions of Instructional Coaching
survey was considered reliable.
Descriptive Data
Descriptive statistics were calculated for the Teachers’ Perception of
Instructional Coaching survey. These statistics are based upon three items from the
survey and are presented in Tables 4.1, 4.2, and 4.3. This information included the
highest level of education each teacher has completed, the number of years of teaching
experience, and teaching as each participant’s first career. All participants in this study
teach in elementary schools that consist of kindergarten through grades five or six.
The data results found in Table 4.1 suggest the majority of the participants had
advanced degrees. Participants with master’s degrees account for 43.4% and participants
with master’s plus 30 account for 20.6%. Participants with a doctorate degree were the
lowest, accounting for only 1.1 % of the study’s participants.
Table 4.1: Frequency Distribution of Highest Level of Education
Degree Level N Frequency Percent
Bachelor’s 350 74 21.1
Bachelor’s + 18 350 48 13.7
Master’s 350 152 43.4
Master’s + 30 350 72 20.6
Doctorate 350 4 1.1
Page 67
54
The data results found in Table 4.2 suggest there was a wide variability in years of
teaching experience among the participants. Teachers with 0 – 5 years of experience had
the lowest participant representation with 15.4 % while teachers with the greatest level of
experience of more than 20 years had the highest participant representation.
Table 4.2: Frequency Distribution of Years of Teaching Experience
Years of Experience N Frequency Percent
0 – 5 350 54 15.4
6 – 10 350 77 22
11 – 15 350 70 20
16 – 20 350 48 13.7
More than 20 350 101 28.9
The data results found in Table 4.3 suggest the education field is the first career
for most of the study’s participants, accounting for 84.3% of the participants. Teachers
who entered into education as a second or more career accounted for 15.7% of the
participants.
Table 4.3: Frequency Distribution of Education as a Career
Career N Frequency Percent
1st Career 350 295 84.3
2nd
or more Career 350 55 15.7
Page 68
55
The demographic data findings found in Tables 4.1, 4.2, and 4.3 will be further
examined later in the data analysis to determine the impact of the demographic groups on
teachers’ perceptions of instructional coaching.
Statistical Analysis of the Research Questions
The data collected from the Teachers’ Perception of Instructional Coaching
survey were analyzed to address each of the four research questions as well as the
demographic impact of teachers’ perceptions of instructional coaching. Measures of
central tendency and descriptive statistics were utilized to analyze the data. For the
purpose of data analysis, each instructional coaching best practice was categorized. The
instructional coaching best practice of collaborating with teachers to address school-wide
instructional concerns and practice was classified as Instructional Coaching Best Practice
1. The instructional coaching best practice collaboratively planning with a teacher to
identify when and how an instructional intervention or practice might be implemented
was classified as Instructional Coaching Best Practice 2. The instructional coaching
practice of modeling instructional practices in a teacher’s classroom was classified as
Instructional Coaching Best Practice 3. The instructional coaching best practice of
observing teachers and providing teachers with feedback was classified as Instructional
Coaching Best Practice 4.
Page 69
56
Research Question 1:
To what extent does an instructional coach’s collaborating with teachers to address
school-wide instructional concerns and practices impact a teacher’s perception of
instructional coaching?
To answer Research Question 1, teachers were presented with six survey items
utilizing a four-point Likert scale, with the responses ranging from 1 for “rarely” to 4 for
“almost always.” Survey Items 4 – 8 and Item 24 are the survey components for the
instructional coaching best practice category of Instructional Coaching Best Practice 1.
The research findings suggest the perceptions of teachers regarding the use of
instructional coaching for collaborating with teachers to address school-wide
instructional concerns and practices. The research findings for this instructional coaching
best practice category are found in Table 4.4, Figure 4.1, Table 4.5, and Figure 4.2.
As found in Table 4.4, the overall mean of the six survey items for Instructional
Coaching Best Practice 1 was 2.81 (SD = 1.04) on the four-point Likert scale. The
measures of central tendency presented in Table 4.4 have a mean range from 2.71 (SD =
.98) for Item 4, “Instructional coaching helps me maintain and facilitate professional,
two-way communication with other members of my school’s faculty,” to 2.94 (SD = .99)
for Item 24, “In my school, there is collaboration between the instructional coach and
teachers to address school-wide instructional concerns and practices.”
Page 70
57
Table 4.4: Measures of Central Tendency – Instructional Coaching Best Practice 1
Item
Number
Item Description N Mean Media
n
Mode SD
4 facilitates 2-way communication
with other faculty members
349 2.71 3 3 .98
5 helps me set high standards for
my teaching
346 2.75 3 4 1.05
6 helps me set high standards for
my students’ performance
349 2.80 3 4 1.06
7 helps me be involved with
promoting school-wide
commitment for CIA and student
learning
347 2.91 3 4 1.01
8 makes it more comfortable to
share ideas, suggestions with
other teachers
344 2.73 3 4 1.11
24 collaboration between IC and
teachers to address school-wide
instructional concerns and
practices
348 2.95 3 4 .99
BP 1 2084 2.81 3 4 1.04
On the following page, Figure 4.1 presents the research findings for the mean of
each survey item in Instructional Coaching Best Practice 1. The data presented in
Figure 4.1 show the same survey items as well as instructional coaching best practice
category mean as presented above in Table 4.4 but provides a different perspective of the
data by displaying individual survey items and group mean data as a bar graph.
Page 71
58
Figure 4.1: Survey Item Mean – Instructional Coaching Best Practice 1
Table 4.5 displays a frequency distribution for each of the six survey items as well
as the category as a whole for Instructional Coaching Best Practice 1. The frequency
data for this best practice category indicate there was a response count range from a low
of 344 for Item 8 to a high of 349 for Item 4. For all items in this best practice category,
Item 24 had the highest number of “almost always” ratings with a count of 130 as well as
the fewest “rarely” ratings with a count of 33. Item 8 had the highest number of “rarely”
ratings, while Item 4 had the fewest number of “almost always” ratings. As a group,
“almost always” received the highest percentage of ratings (32.36%), while “rarely”
received the lowest percentage of ratings (13.68%).
2.71
2.75
2.80
2.91
2.73
2.95
2.81
2.550
2.600
2.650
2.700
2.750
2.800
2.850
2.900
2.950
3.000
4 5 6 7 8 24 BP 1
Survey Items
Mean
Page 72
59
Table 4.5: Frequency Distribution – Instructional Coaching Best Practice 1
Item
Number 4 5 6 7 8 24 BP 1 Percent
N 349 346 349 347 344 348 2083 100.00%
1 45 54 51 39 63 33 285 13.68%
2 97 83 83 76 81 82 502 24.10%
3 120 104 99 109 87 103 622 29.86%
4 87 105 116 123 113 130 674 32.36%
Below, Figure 4.2 presents the ratings frequency distribution of the category as a
whole for Instructional Coaching Best Practice 1. The data presented in Figure 4.2 are
the same as the data presented above in Table 4.5, but Figure 4.2 provides a different
perspective of the data by displaying the category as a whole ratings distribution in a bar
graph.
Figure 4.2: Category as a Whole Ratings Response Percentages –
Instructional Coaching Best Practice 1
13.68%
24.10%
29.86% 32.36%
0.00%
5.00%
10.00%
15.00%
20.00%
25.00%
30.00%
35.00%
1 2 3 4
Ratings
Rarely Sometimes Usually Almost Always
Page 73
60
In summary, to answer Research Question 1, teachers were presented with six
survey items utilizing a four-point Likert scale, with the responses ranging from 1 for
“rarely” to 4 for “almost always.” Survey Items 4 – 8 and Item 24 are the survey
components for the instructional coaching best practice category of Instructional
Coaching Best Practice 1, which represented the instructional coaching best practice of
collaborating with teachers to address school-wide instructional concerns and practices.
Instructional Coaching Best Practice 1 had a mean of 2.81 and a range of .24 on the four-
point Likert scale for the six components of this instructional coaching best practice. This
instructional coaching best practice had the highest mean for the four instructional
coaching best practices examined in this study.
Research Question 2:
To what extent does an instructional coach’s collaboratively planning with a teacher to
identify when and how an instructional intervention or practice might be implemented
impact a teacher’s perception of instructional coaching?
To answer Research Question 2, teachers were presented with six survey items
utilizing a four-point Likert scale, with the responses ranging from 1 for “rarely” to 4 for
“almost always.” Survey Items 9 – 13 and Item 25 were the survey components for the
instructional coaching best practice category of Instructional Coaching Best Practice 2.
The research suggests the perceptions of teachers’ regarding the use of instructional
coaching for collaboratively planning with a teacher to identify when and how an
instructional intervention or practice might be implemented. The research findings for
Page 74
61
this instructional coaching best practice category are found in Table 4.6, Figure 4.3,
Table 4.7, and Figure 4.4.
As found in Table 4.6 below, the overall mean of the six survey items for
Instructional Coaching Best Practice 2 was 2.69 (SD = 1.07) on the four-point Likert
scale. The measures of central tendency presented in Table 4.6 have a mean range from
2.56 (SD = 1.09) for Item 13, “Instructional coaching assists me with the development of
appropriate student learning assessments,” to 2.86 (SD = 1.02) for Item 12, “Instructional
coaching provides me with a resource for improving curriculum and instruction in my
classroom.”
Table 4.6: Measures of Central Tendency – Instructional Coaching Best Practice 2
Item
Number
Item Description N Mea
n
Median Mode SD
9 identify and solve problems
related to my classroom
instruction
345 2.64 3 4 1.08
10 contributes to the improvement of
my classroom instruction
344 2.69 3 3 1.06
11 assists with developing
appropriate policies and
procedures for my classroom to
promote learning for all students
344 2.57 3 3 1.06
12 provides me with a resource for
improving curriculum and
instruction in my classroom
345 2.86 3 4 1.02
13 assists me with the development
of appropriate student learning
assessments
347 2.56 3 3 1.09
25 provides collaborative planning
opportunities between teachers
and the IC
349 2.85 3 4 1.05
BP 2 2074 2.69 3 4 1.07
Page 75
62
Below, Figure 4.3 presents the research findings for the mean of each survey item
in Instructional Coaching Best Practice 2. The data presented in Figure 4.3 are the same
survey item means as well as the instructional coaching best practice category as a whole
mean presented above in Table 4.6, but Figure 4.3 provides a different perspective of the
data by displaying the data as a bar graph.
Figure 4.3: Survey Item Mean - Instructional Coaching Best Practice 2
Table 4.7, displays a frequency distribution for each of the six survey items as
well as the category as a whole for Instructional Coaching Best Practice 2. The
frequency for this best practice category indicates there was response count range from a
low of 344 responses for Items 11 and 12 to a high of 349 responses for Item 25. Item 25
had the highest number of “almost always” ratings with a count of 122 and item 12 had
the fewest number of “rarely” ratings with a count of 43. Item 13 has the highest number
of “rarely” ratings with a count of 76, while Item 11 has the fewest number of “almost
2.64
2.69
2.57
2.86
2.56
2.85
2.69
2.400
2.450
2.500
2.550
2.600
2.650
2.700
2.750
2.800
2.850
2.900
9 10 11 12 13 25 BP 2
Survey Items
Mean
Page 76
63
always” with a count of 82. As a group, “almost always” received the highest percentage
of ratings (28.93%), while “rarely” received the lowest percentage of ratings (17.26%).
Table 4.7: Frequency Distribution – Instructional Coaching Best Practice 2
Item
Number 9 10 11 12 13 25 Group Percent
N 345 344 344 345 347 349 2074 100.00%
1 65 58 69 43 76 47 358 17.26%
2 91 90 93 77 89 79 519 25.02%
3 92 98 100 111 95 101 597 28.78%
4 97 98 82 114 87 122 600 28.93%
On the following page, Figure 4.4 presents the ratings frequency distribution of
the category as a whole for Instructional Coaching Best Practice 2. The data presented
in Figure 4.4 are the same as the data presented above in Table 4.7, but Figure 4.4
provides a different perspective of the data by displaying the category as a whole ratings
distribution as a bar graph.
Page 77
64
Figure 4.4: Category as a Whole Ratings Response Percentages –
Instructional Coaching Best Practice 2
In summary, to answer Research Question 2, teachers were presented with six
survey items utilizing a four-point Likert scale, with the responses ranging from 1 for
“rarely” to 4 for “almost always.” Survey Items 9 – 13 and Item 25 were the survey
components for the instructional coaching best practice category of Instructional
Coaching Best Practice 2, which represented the instructional coaching best practice for
collaboratively planning with a teacher to identify when and how an instructional
intervention or practice might be implemented. Instructional Coaching Best Practice 2
had a mean of 2.69 and a range of .30 on the four-point Likert scale for the six
components of this instructional coaching best practice. This instructional coaching best
practice had the second highest mean for the four instructional coaching best practices
examined in this study.
17.26%
25.02%
28.78% 28.93%
0.00%
5.00%
10.00%
15.00%
20.00%
25.00%
30.00%
35.00%
1 2 3 4
Ratings
Rarely Sometimes Usually Almost Always
Page 78
65
Research Question 3:
To what extent does an instructional coach’s modeling instructional practices in a
teacher’s classroom impact a teacher’s perception of instructional coaching?
To answer Research Question 3, teachers were presented with six survey items
utilizing a four-point Likert scale, with the responses ranging from 1 for “rarely” to 4 for
“almost always.” Survey Items 14 – 18 and Item 26 were the survey components for the
instructional coaching best practice category of Instructional Coaching Best Practice 3.
The research suggests the perceptions of teachers regarding the use of instructional
coaching for modeling instructional practices in a teacher’s classroom. The research
findings for this instructional coaching best practice category are found in Table 4.8,
Figure 4.5, Table 4.9, and Figure 4.6.
Table 4.8 shows that the overall mean of the six survey items for Instructional
Coaching Best Practice 3 was 2.43 (SD = 1.12) on the four-point Likert scale. The
measures of central tendency presented in Table 4.8 have a mean range from 2.15 (SD =
1.13) for Item 26, “In my school, the instructional coach models instructional practices in
teachers’ classroom,” to 2.73 (SD = 1.02) for Item 18, “Instructional coaching helps me
understand better how I can try new instructional practices in my classroom.”
Page 79
66
Table 4.8: Measures of Central Tendency – Instructional Coaching Best Practice 3
Item
Number
Item Description N Mean Median Mode SD
14 models effective instructional
practices by demonstrating
implementation in my classroom
344 2.31 2 1 1.14
15 provides me with demonstrations
of master teaching
345 2.27 2 1 1.12
16 assists me with technology
implementation in my classroom
344 2.45 2 1 1.12
17 helps me understand better how I
can try new instructional
practices in my classroom
342 2.69 3 4 1.06
18 provides me with information
from a variety of resources to
help me make changes in my
classroom instruction
343 2.73 3 3 1.02
26 models instructional practices in
teachers’ classrooms
343 2.15 2 1 1.13
Group 2061 2.43 2 1 1.12
On the following page, Figure 4.5 presents the research findings for the mean of
each survey item in Instructional Coaching Best Practice 3. The data presented in Figure
4.5 are the same survey item means as well as the instructional coaching best practice
category as a whole mean presented above in Table 4.8, but Figure 4.5 provides a
different perspective of the data by displaying the data as a bar graph.
Page 80
67
Figure 4.5: Survey Item Mean - Instructional Coaching Best Practice 3
Table 4.9, displays a frequency distribution for the six survey items as well as the
category as a whole for Instructional Coaching Best Practice 3. The frequency for this
best practice category indicates there was a response count range from a low of 342 for
Item 17 to a high of 345 responses for Item 15. Item 17 had the highest number of
“almost always” response ratings with a count of 99 and Item 18 had the fewest number
of “rarely” response ratings with a count of 48. Item 26 had the highest number of
“rarely” response ratings as well as the fewest number of “almost always” ratings with a
count of 60. As a group, “rarely” received the highest percentage of response ratings
(27.22%), while “almost always” received the lowest percentage of response ratings
(22.9%).
2.31 2.27 2.45
2.69 2.73
2.15
2.43
0.000
0.500
1.000
1.500
2.000
2.500
3.000
14 15 16 17 18 26 BP 3
Survey Items
Mean
Page 81
68
Table 4.9: Frequency Distribution – Instructional Coaching Best Practice 3
Item
Number 14 15 16 17 18 26 BP 3 %
N 344 345 344 342 343 343 2061 100.00%
1 112 117 93 56 48 135 561 27.22%
2 87 83 83 92 92 82 519 25.18%
3 72 79 90 95 107 66 509 24.70%
4 73 66 78 99 96 60 472 22.90%
Below, Figure 4.6 presents the ratings frequency distribution of the category as a
whole for Instructional Coaching Best Practice 3. The data presented in Figure 4.6 are
the same as the data presented above in Table 4.9, but Figure 4.6 provides a different
perspective of the data by displaying the category as a whole ratings distribution as a bar
graph.
Figure 4.6: Category as a Whole Ratings Frequency Distribution –
Instructional Coaching Best Practice 3
27.22%
25.18%
24.70%
22.90%
20.00%
21.00%
22.00%
23.00%
24.00%
25.00%
26.00%
27.00%
28.00%
1 2 3 4
Ratings Rarely Sometimes Usually Almost Always
Page 82
69
In summary, to answer Research Question 3, teachers were presented with six
survey items utilizing a four-point Likert scale, with the responses ranging from 1 for
“rarely” to 4 for “almost always.” Survey Items 14 – 18 and Item 26 were the survey
components for the instructional coaching best practice category of Instructional
Coaching Best Practice 3, which represented the instructional coaching best practice of
modeling instructional practices in a teacher’s classroom. Instructional Coaching Best
Practice 3 had a mean of 2.43 and a range of .58 on the four-point Likert scale for the six
components of this instructional coaching best practice. This instructional coaching best
practice had the lowest mean for the four instructional coaching best practices examined
in this study.
Research Question 4:
To what extent does an instructional coach’s observing teachers and providing teachers
with feedback impact a teacher’s perception of instructional coaching?
To answer Research Question 4, teachers were presented with six survey items
utilizing a four-point Likert scale, with the responses ranging from 1 for “rarely” to 4 for
“almost always.” Survey Items 19 – 23 and Item 27 were the survey components for the
instructional coaching best practice category Instructional Coaching Best Practice 4.
The research suggests the perceptions of teachers regarding the use of instructional
coaching for observing teachers and providing teachers with feedback. The research
findings for this instructional coaching best practice category are found in Table 4.10,
Figure 4.7, Table 4.11, and Figure 4.8.
Page 83
70
As found below in Table 4.10, the overall mean of the items for the six survey
items for Instructional Coaching Best Practice 4 was 2.5 (SD = 1.12) on the four-point
Likert scale. The measures of central tendency presented in Table 4.10 have a mean
range from 2.26 (SD = 1.16) for Item 20, “Instructional coaching has helped me become
more comfortable being observed while I am teaching,” to 2.75 (SD = 1.08) for Item 23,
“Instructional coaching has helped me be more reflective of my curriculum, instruction
and assessment practices.”
Table 4.10: Measures of Central Tendency – Instructional Coaching Best Practice 4
Item
Number
Item Description N Mean Median Mode SD
19 give me valuable feedback on my
classroom practices
346 2.4 2 2 1.1
20 helped me become more
comfortable being observed
345 2.26 2 1 1.16
21 enables me to look more closely
at my teaching
346 2.62 3 4 1.1
22 enabled me to build on my
teaching strengths
344 2.59 3 2 1.07
23 helped me be more reflective of
my curriculum, instruction, and
assessment practices
342 2.75 3 4 1.08
27 observes teachers and provides
them with feedback
246 2.37 2 2 1.12
Group 206
9
2.5 2 2 1.12
On the following page, Figure 4.7 presents the research findings for the mean of
each survey item in Instructional Coaching Best Practice 4. The data presented in Figure
4.7 are the same survey item means as well as the instructional coaching best practice
category as a whole mean presented above in Table 4.10, but Figure 4.7 provides a
different perspective of the data by displaying the data as a bar graph.
Page 84
71
Figure 4.7: Survey Item Mean - Instructional Coaching Best Practice 4
Table 4.11, on the following page, displays a frequency distribution for each of
the six survey items as well as the category as a whole for Instructional Coaching Best
Practice 4. The frequency for this best practice category indicates there was a response
count range from a low of 342 responses for Item 23 to a high of 346 responses for Items
19, 21, and 27. Item 23 had the highest number of “almost always” ratings with a count
of 109 as well as the fewest number of “rarely” ratings with a count of 56. Item 20 had
the highest number of “rarely” ratings with a count of 129 as well as the fewest number
of “almost always” ratings with a count of 71. As a group, “sometimes” received the
highest percentage of response ratings (25.81%), while “usually” received the lowest
percentage of response ratings (24.5%).
2.4 2.26
2.62 2.59 2.75
2.37 2.5
0.000
0.500
1.000
1.500
2.000
2.500
3.000
19 20 21 22 23 27 BP 4
Survey Items
Mean
Page 85
72
Table 4.11: Frequency Distribution – Instructional Coaching Best Practice 4
Item
Number 19 20 21 22 23 27 BP 4 Percent
N 346 345 346 344 342 346 2069 100.00%
1 93 129 70 67 56 97 512 24.75%
2 96 70 88 95 83 102 534 25.81%
3 84 75 92 93 94 69 507 24.50%
4 73 71 96 89 109 78 516 24.94%
Below, Figure 4.8 presents the ratings frequency distribution of the category as a
whole for Instructional Coaching Best Practice 4. The data presented in Figure 4.8 are
the same as the data presented above in Table 4.11, but Figure 4.8 provides a different
perspective of the data by displaying the category as a whole ratings distribution as a bar
graph.
Figure 4.8: Category as a Whole Ratings Response Percentages –
Instructional Coaching Best Practice 4
24.75%
25.81%
24.50%
24.94%
23.50%
24.00%
24.50%
25.00%
25.50%
26.00%
1 2 3 4
Ratings
Rarely Sometimes Usually Almost Always
Page 86
73
In summary, to answer Research Question 4, teachers were presented with six
survey items utilizing a four-point Likert scale, with the responses ranging from 1 for
“rarely” to 4 for “almost always.” Survey Items 19 – 23 and Item 27 were the survey
components for the instructional coaching best practice category Instructional Coaching
Best Practice 4, which represented the instructional coaching best practice of observing
teachers and providing teachers with feedback. Instructional Coaching Best Practice 4
had a mean of 2.5 and a range of .49 on the four-point Likert scale for the six components
of this instructional coaching best practice. This instructional coaching best practice had
the second lowest mean for the four instructional coaching best practices examined in this
study.
Best Practices Overall Summary
In summary each of the best practices in this study received an overall mean. The
participants rated highest the best practice of collaborating with teachers to address
school-wide instructional concerns and practices with a mean of 2.81. The second
highest rated best practice was collaboratively planning with a teacher to identify when
and how an instructional intervention or practice might be implemented with a mean of
2.69. The third ranking best practice was observing teachers and providing them with
feedback with a mean of 2.5. The lowest ranking best practice was modeling
instructional practices in a teacher’s classroom with a mean of 2.43.
Each instructional coaching best practice had one survey item that was a
component of the best practice at the school-wide level. Below, Figure 4.9 presents how
Page 87
74
the participants rated each of the instructional coaching best practices at the school-wide
level.
Figure 4.9: Means of the Best Practice Categories for the School Level Component
Demographic Data Analysis
Demographic data were collected from all of the study’s participants in three
groups: education level, years of teaching experience, and education as the first career.
For the education level demographic, the subgroups for the participants were modeled
after the South Carolina teachers’ licensure educational levels of bachelor’s degree,
bachelor’s degree plus 18 hours, master’s degree, master’s degree plus 30 hours, and
2.97 2.85
2.14 2.28
0
0.5
1
1.5
2
2.5
3
3.5
1 2 3 4
Mean
Best Practice Categories
Page 88
75
doctorate. For years of experience, increments of five years were utilized from 0 to more
than 20 years. For education as the first career, participants were asked, “Is education
your first career?” The answer options were “yes” or “no.”
As stated earlier in this chapter, there were 350 participants in this study. For
level of education, there were 74 teachers with a bachelor’s degree, 48 with a bachelor’s
degree plus 18 hours, 152 with a master’s degree, 72 with a master’s degree plus 30
hours, and 4 with a doctoral degree. For years of experience, there were 54 teachers with
0 – 5 years, 77 with 6 – 10 years, 70 with 11 – 15 years, 48 with 16 – 20 years, and 101
with more than 20 years. For education as a career, there were 295 teachers who are in
education as a first career and 55 who are in education as a second or more career.
In the same manner that the research questions were analyzed, the demographic
data analysis is presented by each instructional coaching best practice. Figure 4.9, Figure
4.10, Figure 4.11, and Figure 4.12 present the overall best practice categorical mean as
well as the mean disaggregated within each demographic category.
Instructional Coaching Best Practice 1: Collaborating with teachers to address
school-wide instructional concerns and practices
On the following page, Figure 4.10 presents the findings for the Instructional
Coaching Best Practice 1 mean disaggregated into each of the three demographic areas
educational level, years of experience, and education as the first career as well as the
overall mean for Instructional Coaching Best Practice 1. The overall mean for
Instructional Coaching Best Practice 1 was 2.81 (SD = 1.04). For the demographic
category of education level, participants with a bachelor’s degree had the highest mean
Page 89
76
with 2.96 (SD = .96), while participants with a doctorate degree had the lowest mean of
2.38 (SD = 1.14). For the demographic category of years of experience, participants with
0 – 5 years of experience had the highest mean with 2.87 (SD = 1.02), while participants
with more than 20 years had the lowest mean with 2.78 (SD = 1.07). For the education as
the first career category, participants who are in education as their first career had a mean
of 2.86 (SD = 1.02), while participants who are in education as a second or more career
had a mean of 2.53 (SD = 1.06).
Figure 4.10: Demographic Subgroup Means as Compared to the Category as a
Whole Mean – Instructional Coaching Best Practice 1
Above, Figure 4.10 presents the findings for the Instructional Coaching Best
Practice 1, collaborating with teachers to address school-wide instructional concerns and
practices, with the mean disaggregated into each of the three demographic areas of
educational level, years of experience, and education as the first career as well as the
2.96
2.55
2.84 2.79
2.38
2.81 2.87 2.81 2.8 2.81 2.78 2.81
2.53
2.86 2.81
0
0.5
1
1.5
2
2.5
3
3.5
Me
an
Demographics
Instructional Coaching Best Practice 1
Page 90
77
overall mean for Instructional Coaching Best Practice 1. The overall best practice
category mean was 2.81. The educational level demographic had a mean range span of
.58, years of experience had a mean range span of .09, and education as the first career
choice had a mean range span of .33. The overall difference from Instructional Coaching
Best Practice 1 mean of 2.81 to each of the demographic subgroups was minimal,
particularly in the years of experience category.
Instructional Coaching Best Practice 2: Collaboratively planning with a teacher to
identify when and how an instructional intervention might be implemented
On the following page, Figure 4.11 presents the findings for the Instructional
Coaching Best Practice 2 mean disaggregated into each of the demographic areas of
education level, years of experience, and education as the first career as well as the
overall mean for Instructional Coaching Best Practice 2. The overall mean for
Instructional Coaching Best Practice 2 was 2.69 (SD = 1.07). For the demographic
category of education level, participants with bachelor’s degree had the highest mean
with 2.79 (SD = 1.00), while participants with a doctoral degree had the lowest mean
with 2.26 (SD = 1.21). For the demographic category of years of experience, participants
with 0 – 5 years of experience had the highest mean with 2.77 (SD = 1.06), while
participants with more than 20 years experience had the lowest mean with 2.62 (SD =
1.09). For the education as the first career category, participants who are in education as
their first career had a mean of 2.74 (SD = 1.05), while participants who are in education
as a second or more career had a mean of 2.45 (SD = 1.1).
Page 91
78
Figure 4.11: Demographic Subgroup Means as Compared to the Category as a
Whole Mean – Instructional Coaching Best Practice 2
Above, Figure 4.11 presents the findings for the Instructional Coaching Best
Practice 2, collaboratively planning with a teacher to identify when and how an
instructional intervention might be implemented, with the mean disaggregated into each
of the three demographic areas of educational level, years of experience, and education as
the first career as well as the overall mean for Instructional Coaching Best Practice 2.
The overall best practice category mean was 2.69. The educational level demographic
had a mean range span of .53, while years of experience had a mean range span of .15
and education as the first career choice had a mean range span of .29. The overall
difference from Instructional Coaching Best Practice 2 mean of 2.69 to each of the
demographic subgroups was minimal, particularly in the years of experience category.
2.79
2.46
2.73 2.69
2.26
2.69 2.77 2.7 2.7 2.75 2.62 2.69
2.45 2.74 2.69
0
0.5
1
1.5
2
2.5
3M
ean
Demographics
Instructional Coaching Best Practice 2
Page 92
79
Instructional Coaching Best Practice 3: Modeling instructional practices in
teachers’ classrooms
On the following page, Figure 4.12 presents the findings for the Instructional
Coaching Best Practice 3 mean disaggregated into each of the demographic areas of
education level, years of experience, and education as the first career as well as the
overall mean for Instructional Coaching Best Practice 3. The overall mean for
Instructional Coaching Best Practice 3 was 2.43 (SD = 1.12). For the demographic
category of education level, participants with master’s degree had the highest mean with
2.49 (SD = 1. 13), while participants with a doctoral degree had the lowest mean with
2.04 (SD = 1.33). For the demographic category of years of experience, participants with
0 – 5 years of experience had the highest mean with 2.47 (SD = 1.15), while participants
with 11 – 15 years of experience had the lowest mean with 2.38 (SD = 1.12). For the
education as the first career category, participants who are in education as their first
career had a mean of 2.47 (SD = 1.12), while participants who are in education as a
second or more career had a mean of 2.21 (SD = 1.08).
Page 93
80
Figure 4.12: Demographic Subgroup Means as Compared to the Category as a
Whole Mean – Instructional Coaching Best Practice 3
Above, Figure 4.12 presents the findings for the Instructional Coaching Best
Practice 3, modeling instructional practices in teachers’ classrooms, with the mean
disaggregated into each of the three demographic areas of educational level, years of
experience, and education as the first career as well as the overall mean for Instructional
Coaching Best Practice 3. The overall best practice category mean was 2.43. The
educational level demographic had a mean range span of .45, while years of experience
had a mean range span of .09 and education as the first career choice had a mean range
span of .26. The overall difference from Instructional Coaching Best Practice 3 mean of
2.43 to each of the demographic subgroups was minimal, particularly in the years of
experience category.
2.43
2.2
2.49 2.49
2.04
2.43 2.47 2.46 2.38 2.43 2.43 2.43
2.21
2.47 2.43
0
0.5
1
1.5
2
2.5
3M
ean
Demographics
Instructional Coaching Best Practice 3
Page 94
81
Instructional Coaching Best Practice 4: Observing teachers and providing teachers
with feedback
On the following page, Figure 4.13 presents the findings for the Instructional
Coaching Best Practice 4 mean disaggregated into each of the demographic areas of
education level, years of experience, and education as the first career as well as the
overall mean for Instructional Coaching Best Practice 4. The overall mean for
Instructional Coaching Best Practice 4 was 2.5 (SD = 1.12). For the demographic
category of education level, participants with bachelor’s degree had the highest mean
with 2.57 (SD = 1. 07), while participants with a doctoral degree had the lowest mean
with 2.0 (SD = 1.25). For the demographic category of years of experience, participants
with 0 – 5 years of experience had the highest mean with 2. 6 (SD = 1.14), while
participants with 11 – 15 years of experience had the lowest mean with 2.45 (SD = 1.14).
For the education as the first career category, participants who are in education as their
first career had a mean of 2.56 (SD = 1.1), while participants who are in education as a
second or more career had a mean of 2.15 (SD = 1.13).
Page 95
82
Figure 4.13: Demographic Subgroup Means as Compared to the Category as a
Whole Mean – Instructional Coaching Best Practice 4
Above, Figure 4.13 presents the findings for the Instructional Coaching Best
Practice 4, observing teachers and providing teachers with feedback, with the mean
disaggregated into each of the three demographic areas of educational level, years of
experience, and education as the first career as well as the overall mean for Instructional
Coaching Best Practice 4. The overall best practice category mean was 2.5. The
educational level demographic had a mean range span of .57, while years of experience
had a mean range span of .15 and education as the first career choice had a mean range
span of .41. The overall difference from Instructional Coaching Best Practice 4 mean of
2.5 to each of the demographic subgroups was minimal, particularly in the years of
experience category.
2.57
2.27 2.54 2.5
2
2.5
2.6 2.53 2.45 2.5 2.45 2.5 2.56
2.15
2.5
0
0.5
1
1.5
2
2.5
3M
ean
Demographics
Instructional Coaching Best Practice 4
Page 96
83
Demographic Summary
A t-test was performed for each demographic categorical subgroup utilizing a
two-tailed paired t-test with a 95% confidence interval. With an examination of the
means for each demographic subgroup and the mean for all study participants, there is no
statistical significance for any subgroup. There is, however, a trend among the
demographic subgroups. For the educational level demographic subgroups of bachelor’s
plus 18, master’s plus 30, and doctorate means fall below all four instructional coaching
best practices categories’ overall data means as well as the means for the other
subgroups. This trend is also evident in the education as first career demographic. For
teachers who have entered education as a second or more career, the mean for each best
practice category fell below the overall data mean and below the mean of teachers who
are in education as their first career. The years of experience demographic had minimal
mean variance among the subgroups.
Conclusion
The findings presented in this chapter presented a detailed analysis of the data
gathered from the survey, Teachers’ Perceptions of Instructional Coaching, to answer
each of the four research questions as well as an analysis of teachers’ demographic
impact on teachers’ perception of instructional coaching. This study examined teachers’
perceptions of research-based best practices of instructional coaching. Specifically, this
study examined teachers’ perceptions of instructional coaching as a means of
collaborating with teachers to address school-wide instructional concerns and practices,
Page 97
84
collaboratively planning with a teacher to identify when and how an instructional
intervention or practice might be implemented, modeling instructional practices in a
teacher’s classroom, and observing teachers and providing teachers with feedback.
Chapter Five contains a summary of the research findings, insight into the
emergent themes concerning instructional coaching, recommendations for implementing
effective instructional coaching programs, and suggestions for further research.
Page 98
85
Chapter Five
Summary, Conclusions, and Recommendations
This chapter presents a summary of the research completed on teachers’
perception of instructional coaching in school districts in the Upstate of South Carolina
and the conclusions drawn from the quantitative data presented in Chapter Four. Also
included in this chapter are recommendations that school leaders could take in order to
implement an effective instructional coaching program and suggestions for further
research in this area.
Summary of Study
This study was conducted to determine teachers’ perceptions of instructional
coaching as measured by the extent for which research-based instructional coaching best
practices are utilized by instructional coaches in elementary schools in selected districts
in the Upstate of South Carolina. This study further examined certain demographic data
to determine if those demographics impact teachers’ perceptions of instructional
coaching. As noted in Chapter One, with an ever-increasing amount of accountability,
budget cuts, and scrutiny in public education in South Carolina, school leaders are
continually examining programs that have a direct impact on student achievement. One
such program is instructional coaching. While many schools have instructional coaching
Page 99
86
programs, the person delivering the coaching may have a title other than instructional
coach such as math coach, science coach, literacy coach, curriculum resource teacher, or
curriculum facilitator.
The overall research theme of this study is to determine to what extent the
utilization of research-based instructional coaching best practices impact teachers’
perceptions of instructional coaching. Four research questions were investigated in this
study:
1. To what extent does an instructional coach’s collaborating with teachers to
address school-wide instructional concerns and practices impact a teacher’s
perception of instructional coaching?
2. To what extent does an instructional coach’s collaboratively planning with a
teacher to identify when and how an instructional intervention or practice might
be implemented impact a teacher’s perception of instructional coaching?
3. To what extent does an instructional coach’s modeling instructional practices in a
teacher’s classroom impact a teacher’s perception of instructional coaching?
4. To what extent does an instructional coach’s observing teachers and providing
teachers with feedback impact a teacher’s perception of instructional coaching?
This study further examined participants’ demographic data impact on teachers’
perceptions of instructional coaching best practices. The demographic data were
collected in three areas: level of education, years of teaching experience, and education
as the first career.
Page 100
87
To determine the answers to these four questions and the demographic impact, the
researcher utilized a quantitative approach of descriptive statistics and measures of
central tendency. The data were gathered through the use of a researcher-developed
survey, Teachers’ Perceptions of Instructional Coaching. Eight Upstate of South
Carolina school districts currently have instructional coaching programs in their
elementary schools. The superintendents or their designees of those districts were
contacted to seek permission to conduct the study in their districts. Four out of the eight
districts allowed the study to be conducted in their districts.
Once permission was granted, principals were contacted via email. The purpose
of the research was explained in the email along with a website link to the survey and a
letter for the teachers explaining the purpose of the study. In all, 37 principals were
contacted and the survey window was approximately four weeks. Three hundred fifty
teachers completed the survey.
The survey was divided into five sections: demographics and the four
instructional coaching best practices categories. The demographic data collected were
education level, years of teaching experience, and education as first career. The four
instructional coaching best practice categories were: collaboration on school-wide
instructional concerns, collaboration on instructional intervention, modeling instructional
practices, and observing and providing feedback. Teachers were presented with 24 items,
six items for each instructional coaching best practice category. Each of the six items in
each best practice category was a specific instructional component of the identified best
practice. The categories of best practices were not made known to the participants.
Page 101
88
Likert scale type items provided four options: 1 “rarely,” 2 “sometimes,” 3 “usually,”
and 4 “almost always.”
Researcher’s Interpretations
Research Question 1
To what extent does an instructional coach’s collaborating with teachers to address
school-wide instructional concerns and practices impact a teacher’s perception of
instructional coaching?
The Teachers’ Perceptions of Instructional Coaching survey asked teachers six
questions which were components for the instructional coaching best practice of
collaborating with teachers to address school-wide instructional concerns and practices.
In the results, teachers ranked this instructional coaching best practice as the highest best
practice in this study. While the overall mean for this best practice was 2.81 on the four-
point Likert scale, the principal component of collaboration between the instructional
coach and teachers to address school-wide instructional practices had a mean of 2.95.
Interestingly, teachers ranked instructional coaches highest on the best practice
component that addressed the overall school instructional coaching program. The other
five components of this best practice focused on the individual participant experience.
These findings suggest the participants have either observed or perceived an instructional
coach collaborating with other teachers to address school-wide instructional concerns and
practices taking place in their school, but that as an individual teacher, participants have
not personally experienced as frequently the instructional coach beneficially working
Page 102
89
with them on this best practice. Teachers ranked instructional coaches lowest (Mean =
2.71) in facilitating two-way communication between a teacher and other faculty
members. This indicates that within this best practice, teachers are perceived to be
working more one-on-one with an instructional coach rather than as a group of teachers.
No component of this instructional coaching best practice received a “usually”
response rating, but each ranked high in the “sometimes” response rate. The range for
this best practice was .24 which indicates the participants were cohesive in their
perceptions of this best practice. Because this best practice had the smallest range and
was the highest ranking of the four best practices, it can be concluded that the participants
of this study were the most cohesive in their perceptions of this instructional coaching
best practice and perceived this best practice as being more beneficial than the other three
best practices in this study. Although the best practice was rated highest, it did not
receive a favorable perception of benefiting teachers’ instructional practices.
Research Question 2
To what extent does an instructional coach’s collaboratively planning with a teacher to
identify when and how an instructional intervention or practice might be implemented
impact a teacher’s perception of instructional coaching?
The Teachers’ Perceptions of Instructional Coaching survey asked teachers six
questions which were components for the instructional coaching best practice of
collaboratively planning with a teacher to identify when and how an instructional
intervention might be implemented. In the results, teachers ranked this instructional
coaching best practice as the second highest in this study. While the overall mean for this
Page 103
90
best practice was 2.69 on the four-point Likert scale, teachers ranked instructional
coaches highest (Mean = 2.86) in providing resources for improving curriculum and
instruction in their classroom. Teachers ranked instructional coaches lowest (Mean =
2.56) in assisting with the development of appropriate student learning assessments.
Each of these components focused on the individual teacher. The best practice
component that focused on the overall school instructional program, provides
collaborative planning opportunities between teachers and the instructional coach, ranked
closely to the component with the highest mean in this category with a mean of 2.85.
These findings suggest the participants observe or perceive an instructional coach is
collaboratively planning with other teachers more frequently than he or she is with them
to identify when and how an instructional intervention might be implemented. The range
for this instructional coaching best practice was .30. Again, with this small range, it can
be concluded that the participants of this study were cohesive in their ratings of the
components of this best practice. The rate for which the components of this best practice
are taking place is not favorable because no components of this instructional coaching
practice received a “usually” response rating, but each rated high in the “sometimes”
response rating.
Research Question 3
To what extent does an instructional coach’s modeling instructional practices in a
teacher’s classroom impact a teacher’s perception of instructional coaching?
The Teachers’ Perceptions of Instructional Coaching survey asked teachers six
questions which were components for the instructional coaching best practice of
Page 104
91
modeling instructional practices in teachers’ classrooms. Teachers ranked this
instructional coaching best practice as the lowest in this study. This best practice also
received the most “almost never” response ratings with 27.22% and the fewest “almost
always” response ratings with 22.9%. While the overall mean for this best practice was
2.43, teachers rated instructional coaches lowest in the school-wide component of this
best practice with a mean of 2.15 in models instructional practices in teachers’
classrooms. This mean was also the lowest mean of all of the survey items. Also ranking
low in this best practice with a mean of 2.27 was the best practice component of
providing a teacher with demonstrations of master teaching. The component with the
highest mean in this best practice was provides a teacher with information from a variety
of resources to help make changes in the teacher’s classroom instruction (Mean = 2.73).
These findings suggest the participants perceived instructional coaches utilizing this best
practice the least. Clearly, modeling instructional practices is perceived as not taking
place on a routine basis in classrooms, but participants felt that providing teachers with
resources is occurring with more frequency than other components of this best practice.
The range for this best practice was .58, the largest range of the four best practices in this
study, but this range remains relatively small. The increase in the range for this best
practice as compared to the other best practices suggests teachers were not as cohesive in
the response ratings of this best practice as they were with the other best practices;
however, the range was still relatively small. Again, no component of this instructional
coaching best practice received a “usually” ranking, but each was slightly above the
“sometimes” ranking.
Page 105
92
Research Question 4
To what extent does an instructional coach’s observing teachers and providing teachers
with feedback impact a teacher’s perception of instructional coaching?
The Teachers’ Perceptions of Instructional Coaching survey asked teachers six
questions which were components for the instructional coaching best practice of
observing teachers and providing teachers with feedback. In the results, teachers ranked
this instructional coaching best practice second lowest in this study. The overall mean
for this best practice was 2.5 on the four-point Likert scale. Teachers rated instructional
coaches highest in helping them be more reflective of their curriculum, instruction, and
assessment practices with a mean of 2.75. Teachers rated instructional coaches lowest in
the area of helping them become more comfortable being observed. Also, low for this
best practice was the school-wide component, observes teachers and provides them with
feedback, with a mean of 2.37. These findings suggest instructional coaches are having
some instructional conversations with teachers but are not observing teachers and
providing them with feedback of the observations on a consistent basis. These findings
also suggest teachers perceive the instructional coaches as observing other teachers and
providing them with feedback less frequently than the amount of time the instructional
coach is spending with the individual participants.
No components of this instructional coaching best practice received a “usually”
response rate, but each received a response rate above “sometimes.” The range for this
best practice was .49, again suggesting that the teachers were cohesive in their response
ratings of the components of this best practice.
Page 106
93
Discussion of Research Questions Findings
This study was designed to gather data on teachers’ perceptions of instructional
coaching. It relied on the perceptions of teachers for instructional coaching not only for
them as individual teachers but also for their school as a whole. The results of the study
showed teachers perceive instructional coaches collaborating with teachers to address
school-wide instructional concerns and practices as occurring most frequently to impact
their classroom practices. Instructional coaches modeling instructional practices in
teachers’ classrooms occurs the least frequently. Each of the four instructional coaching
best practices had a mean below the “usually” response rating but above the “sometimes”
response rating. This finding suggests cohesiveness among the study’s participants on
their perceptions of instructional coaching, regardless of the school or school district in
which the teacher works. This finding further suggests instructional coaches are either
ineffective with their implementation of instructional coaching best practices or that they
are not utilizing instructional coaching best practices. The reasons for these deficiencies
cannot be concluded from this study. The findings of this study could lead to the
conclusion that to support an instructional coaching program is not the most effective use
of resources to improve student achievement, but there are additional factors that must be
considered. The implementation of the instructional coaching program must be examined
at both the district level and the school level. Other factors that could have impacted the
study’s findings were instructional coaches’ professional development on best practices,
teachers’ knowledge of instructional coaching, principals’ knowledge of instructional
coaching, and responsibilities and duties assigned to the schools’ instructional coaches.
Page 107
94
Demographic Impact
In addition to the research questions, the data were analyzed by three
demographic groups: level of education, years of teaching experience, and education as
the first career choice. The demographic group for level of education was developed as a
survey item modeled after the South Carolina teachers’ licensure educational levels. The
educational level subgroups were bachelor’s degree, bachelor’s degree plus 18 hours,
master’s degree, master’s degree plus 30 hours, and doctorate. The demographic group
for years of teaching experience was developed as a survey item in increments of 5 years
and went up to 30 years, which is currently the typical number of years of teaching
experience required for retirement in South Carolina. The subgroups were 0 – 5 years, 6
– 10 years, 11 – 15 years, 16 – 20 years, 21 – 25 years, and 26 years or more. The
demographic group for education as the first career was developed as a survey item in the
form of a question, “Is education your first career?” The answer options were “yes” or
“no.”
Each instructional coaching best practice mean was compared to the mean of each
of the demographic subgroups in that best practice category. Each demographic data
disaggregation followed the same pattern in each of the instructional coaching best
practices categories. In education level, bachelor’s plus 18 hours and doctorate education
levels had means lower than the best practice mean as well as the other subgroups’
means. In years of experience, there was very little variance among the subgroups. In
education as a first career, teachers who were in education as a second or more career had
lower means than teachers who were in education as their first career.
Page 108
95
Although there was a clear pattern of differences among specific demographic
subgroups, none of the subgroup differences were statistically significant. This finding is
contrary to the thoughts of the researcher entering into the research. Based upon personal
experience, the researcher believed there would be a significant difference in teachers’
perceptions of instructional coaching, particularly in years of experience, which had the
least amount of variance, and in education as a first career.
Conclusions
Teachers’ perceptions of instructional coaching are pivotal to the success of an
instructional coaching program. Although an instructional coach works exclusively with
teachers, the ultimate goal of an instructional coaching program is to improve student
achievement. Effective implementation of an instructional coaching program is a key to
the success of the program, thus student achievement. As stated by Wright et al. (1997),
“the most important factor affecting student learning is the teacher” (p, 63). Wright et al.
further stated,
The immediate and clear implications of this finding is that seemingly more can
be done to improve education by improving the effectiveness of teachers than by
any other single factor. Effective teachers appear to be effective with students of
all achievement levels, regardless of the level of heterogeneity in their classrooms
(p. 63).
There are three critical components in shaping the implementation of an
instructional coaching program that school leaders must ensure are in place. School
Page 109
96
leaders must clarify the coach’s role in a school, structure time strategically to allow for
teachers to participate in coaching activities, and provide the instructional coach with
clear, visible support (Kowal and Steiner, 2007, p. 5). Often too much is placed on the
plate of an instructional coach thus becoming, a jack of all trades but a master of none. It
is appropriate to expect coaches to wear several hats, but school leaders must be cautious
not to overuse an instructional coach. School leaders and coaches must identify and
prioritize a few specific roles and behaviors in which the coach should be engaged to
maximize the effectiveness of the program (Wren & Vallejo, 2009).
Instructional coaching is a partnership, a partnership between teachers and the
instructional coach and between the principal and the instructional coach. School leaders
must critically assess their practices and expectations with instructional coaching for
teachers and students to reap fully the benefits of an effective program.
Recommendations for Further Research
This study investigated teachers’ perceptions of instructional coaching.
Specifically it examined the extent to which research-based instructional coaching best
practices are perceived to be beneficial for classroom instruction. The study further
examined the impact teacher demographics have on their perceptions of instructional
coaching. The study added to the body of literature on the topic and provides direction
for further research.
Further qualitative research should be conducted on teachers’ perceptions of
instructional coaching to add to the depth and understanding of teachers’
Page 110
97
perceptions. During the data collection component of this study, the
researcher received several emails from participants describing their
frustrations with instructional coaching. Most of their frustrations stemmed
not from the actual practice of instructional coaching but from the “other
things” the instructional coach was doing in their schools.
This study only examined teachers’ perceptions of instructional coaching.
Additional research is needed to determine the various roles, duties, tasks, and
responsibilities that instructional coaches actually do in their schools on a
regular basis. These data would provide insight into the things that may be
preventing an instructional coach from actually working with teachers on
instructional coaching best practices.
This study examined only elementary school teachers’ perceptions of
instructional coaching. Additional research is needed to determine if the level
of the school, elementary, middle, or high school has an impact on teachers’
perceptions of instructional coaching.
This study was limited to schools whose district superintendents granted
permission for the researcher to contact principals. This limitation resulted in
a smaller sample size. Further research, with an increased sample size would
yield valuable information on the extent to which instructional coaching is
being utilized to improve classroom instruction.
One of the major components to the successful implementation of an
instructional coaching program is a principal’s support and understanding of
research-based practices of instructional coaching. Additional research is
Page 111
98
needed to determine principals’ knowledge and understanding of effective
instructional coaching program implementation and whether principals are
using that knowledge to implement a research-based instructional coaching
program.
Additional research is needed to determine what professional development
school districts provide instructional coaches to prepare them for the
implementation of research-based best practices, whether the instructional
coach is new to the role or is a veteran instructional coach. What types of on-
going professional development do districts provide instructional coaches?
Also, what have district leaders done to support implementation of effective
instructional coaching programs in schools?
With the emergence of the adoption of the Common Core State Standards in
most states across the nation, further study of teachers’ instructional practices
may be warranted.
Research on instructional coaching has demonstrated that effectively implemented
instructional coaching programs can have a positive impact on student achievement as
well as sustained implementation of professional development (Knight, 2004b). This
study has shown that teachers’ perceive the utilization of instructional coaching best
practices as benefiting their classroom instructional practices sometimes but not
consistently. An instructional coach has many responsibilities, but the primary
responsibility must always be the professional growth of teachers in his or her school
(Wren & Vallejo, 2009). Reiman and Theis-Sprinthall (1998), quoting Dewey’s work
from 1916, provide a time-tested best practice, “Teacher learning and growth do not
Page 112
99
magically and spontaneously unfold. Instead, they depend on appropriate interaction
between the teacher and his or her colleagues” (p. 3).
Page 113
100
References
Alkadhi, S. (n.d.). Learning theory: Andragogy. Unpublished manuscript, California
State University, Monterey Bay.
Bintz, W.P & Dillard, J (2007). Teachers as reflective practitioners: examining teacher
stories of curricular change in the 4th
grade classroom. Reading Horizons, 47(3),
203 – 227.
Black, S. (2007). A line item for achievement. American School Board Journal, 194(3),
43 – 45.
Boone, E., Hartzman, M., & Mero, D. (2006). Influence by instructional leadership.
Principal Leadership (Middle School ed.), 6(10), 10 – 14.
Bossi, M. (2008). Six dimensions of leadership. Leadership, 37(3), 8 – 12.
Brady, C. H. (2005). School-based staff developers in high poverty schools: A report to
the Kauffman Foundation. Kansas City, MO: Cheryl Brady Associates.
Brady, C. H. (2007). Coaches’ voices bring 6 lessons to light. Journal of Staff
Development, 28(1), 46 – 29.
Clark, D. (1999). Andragogy. Retrieved July 29, 2012, from
http://nwlink.com/~donclark/har/history/andragogy.html.
Creswell, J. W. (2009) Research design: Qualitative, quantitative, and mixed methods
approaches (3rd
ed.). Thousand Oaks, CA: Sage.
Page 114
101
Danielson, C. (2007). The many faces of leadership. Educational Leadership, 65(1), 14
– 19.
DuFour, R. (2004). The best staff development is in the workplace, not in a workshop.
Journal of Staff Development, 25(2), 63 – 64.
Feger, S., Hickman, P., & Woleck, K. (2004).How to develop a coaching eye. Journal
of Staff Development, 25(2), 14 – 18.
Fink, A. (2009). How to conduct surveys: A step-by-step guide (4th
ed.). Thousand Oaks,
CA: Sage.
Fowler, Jr., F. J. (2009). Survey research methods (4th
ed.). Thousand Oaks, CA: Sage.
Frey, B. A., & Alman, S. W. (2003). Applying adult learning theory to the online
classroom. New Horizons in Adult Education, 17(1), 4 – 12.
Fullan, M. & Knight, J. (2011). Coaches as system leaders. Educational Leadership,
69(2), 50 – 53.
Griffin, N.C., Wholstetter, P., & Bharadwaja, L.C. (2001). Teacher coaching: A tool for
retention. School Administrator, 58(1), 38 – 40.
Guiney, E. (2001). Coaching isn’t just for athletes: The role of teacher leaders. Phi
Delta Kappan, 82(10), 740 – 743.
Hall, D. (2005). Moving from professional development to professional growth.
Learning and Leading With Technology, 32(5), 36 – 38.
Harrison, C. (2007). Web of support strengthens the effectiveness of school-based
coaches. Journal of Staff Development, 28(1), 10 – 12, 14 – 16, 18.
Harrison, C. & Killion, J. (2007).Ten roles for teacher leaders. Educational Leadership,
65(1), 74 – 77.
Page 115
102
Hemphill, S. & Duffield, J. (2007). Nuts and bolts of a district improvement effort in
Maryland centers on the staff development of teacher. Journal of Staff
Development, 28(1), 50 – 53.
Herll, S. & O’Drobinak, B. (2004). Role of the coach: Dream keeper, supporter, friend.
Journal of Staff Development, 25(2), 42 – 45.
Jamison, J. B. (2010). Understanding research methods in psychology. New York:
Worth Publishers.
Kendall, J. (2006, November 29). Three simple secrets of school-based coaching.
Teacher Magazine. Retrieved November 21, 2007, from
http://www.teachermagazine.org/tm/articles/2006/11/29/05tln_kendall.html?print
=1.
Killion, J. (2004). The code. Journal of Staff Development, 25(4), 59 – 60.
Killion, J. (2007). Web of support strengthens the effectiveness of school-based coaches.
Journal of Staff Development, 28(1), 11 – 18.
Kise, J. A. G, (2006). Differentiated coaching: A framework for helping teachers
change. Thousand Oaks, CA: Corwin.
Klatt, B. (1999). The ultimate training workshop handbook: A comprehensive guide to
leading successful workshops and training programs. New York: McGraw-Hill.
Knight, J. (2004a). Instructional coaches make progress through partnership. Journal of
Staff Development, 25(2), 32 - 37.
Knight, J. (2004b). Instructional coaching. StrateNotes: The University of
Kansas Center for Research on Learning, 13(3), 1-5.
Page 116
103
Knight, J. (2005). A primer on instructional coaches. Principal Leadership (Middle
School Edition), 5(9), 16 – 21.
Knight, J. (2006). Eight factors for realizing better classroom teaching through support,
feedback, and intensive, individualized professional learning. The School
Administrator, 63(4), 18 - 25.
Knight, J. (2007a). 5 key points to building a coaching program. Journal of Staff
Development, 28(1), 26 – 31.
Knight, J. (2007b). Instructional Coaching: A partnership approach to improving
instruction. Thousand Oaks, CA: Corwin.
Knowles, M. S. (1968). Andragogy not pedagogy! Adult Leadership, 350 – 352, 386.
Knowles, M. S. (1980). The modern practice of adult education. New York: Cambridge
Books.
Knowles, M. S., Holton III, E. F, & Swanson, R. A. (2005). The adult learning: The
definitive classic in adult education and human resource development (6th
ed.).
Burlington, MA: Elsevier.
Kowal, L. & Steiner, J. (2007). The principal as instructional leader: Designing a
coaching program that fits. The Center for Comprehensive School Reform and
Improvement, Issue Brief.
Manzo, K. K. (2005). States and districts send literacy coaches to the rescue. Education
Week, 24(43), 20 – 21.
Marion, R. (2002). Leadership in education: Organizational theory for the practioner.
Long Grove, IL: Waveland.
Page 117
104
Marzano, R. J. (2003). What works in schools: Translating research into action.
Alexandria, VA: Association for Supervision and Curriculum Development.
Marzano, R. J. (2007). The art and science of teaching: A comprehensive framework for
effective instruction. Alexandria, VA: Association for Supervision and
Curriculum Development.
Marzano, R. J., Pickering, D. J., & Pollack, J. E. (2001). Classroom instruction that
works: Research-based strategies for increasing student achievement. Alexandria,
VA: Association for Supervision and Curriculum Development.
Marzano, R. J., Waters, T, & McNulty, B. A. (2005). School leadership that works:
From research to results. Alexandria, VA: Association for Supervision and
Curriculum Development.
Merriam, S. B. & Caffarella, R. S. (1991). Learning in adulthood: A comprehensive
guide. San Francisco: Jossey-Bass.
Moran, M. C. (2007). Differentiated literacy coaching: Scaffolding for student and
teacher success. Alexandria, VA: Association for Supervision and Curriculum
Development.
Morse, J. M. (1991). Approaches to qualitative-quantitative methodological
triangulation. Nursing Research, 40(5), 120 – 123.
Norton, J. (2007). Adding layers of support: Alabama’s program helps site-based
coaches succeed. Journal of Staff Development, 28(1), 20 – 25.
Pankake, A. & Moller, G. (2007). What the teacher leader needs from the principal.
Journal of Staff Development, 28(1), 32 – 36.
Page 118
105
Rea, L. M. & Parker, R. A. (2005). Designing and conducting survey research: A
comprehensive guide (3rd
ed.). San Francisco: Jossey-Bass.
Richard, A. (2004). School-based support. Journal of Staff Development, 25(1), 10 –
45.
Reiman, A.J. & Thies-Sprinthall, L. (1998). Mentoring and supervision for teacher
development. New York: Addison Wesley Longman.
Sanders, W. L. & Rivers, J. C. (1996). Cumulative and residual effects of teachers on
future student academic achievement. Research Progress Report. Knoxville, TN:
University of Tennessee Value-Added Research and Assessment Center.
Sweeney, D. (2007) Mirror, mirror in the lab. Journal of Staff Development, 28(1), 38
– 41.
Tallerico, M. (2007). 3 strategies for administrators. Journal of Staff Development,
28(1), 42 – 45.
Wren, S. & Vallejo, D. (2009). Effective collaboration between instructional coaches
and principals. Retrieved April 2, 2013, from
http://www.balancedreading.com/Wren_&Wallejo_Coach_Principal_Relatinships
.pdf.
Wright, S. P., Horn, S. P., & Sanders, W. L. (1997). Teacher and classroom context
effects on student achievement: Implications for teacher evaluation. Journal of
Personnel Evaluation in Education, 11(1), 57 – 67.
Page 119
106
Appendix A: Email/Letter to Superintendent
(Superintendent)
(Address)
(City, State, Zip)
Dear Dr. (Superintendent):
My name is Heather Gordon, and I am a doctoral candidate in the Educational Leadership
and Policy Department at the University of South Carolina. I am conducting a research
study on teachers’ perceptions of instructional coaching as a practice in elementary
schools in the Upstate region of South Carolina. I am seeking your permission to allow
me to conduct a survey of elementary teachers in your school district.
The purpose of this research is to determine teachers’ perceptions of instructional
coaching best practices and the extent to which a teacher’s demographic category impacts
his/her perspective of instructional coaching. I am interested in discovering which best
practices teachers prefer and if there is a difference of perception based upon years of
teaching experience, formal education, and education as the teacher’s first career. For the
purpose of this research, instructional coaching may be delivered by an instructional
coach, curriculum facilitator, instructional facilitator, literacy coach, math coach, science
coach, etc. Information gained from the survey could be used to direct instructional
coaches to the best practice(s) teachers are most receptive to and direct instructional
coaches to the most receptive teacher group at the onset of an instructional coaching
program or for a new instructional coach.
Participation in this study is strictly voluntary and should take only 10-20 minutes to
complete. Teacher responses to this survey will be confidential. There will be no
identifying information regarding teachers, schools, or school districts in my data. The
only identifier will be that the schools and participants are from the Upstate region of
South Carolina. The results of this study will be presented as a dissertation and may be
published and/or presented at professional meetings.
I would be happy to answer any questions you have about the research. You can contact
me at 864-421-4776 (personal cell) or at 864-355-6922 (work). I may also be reached at
[email protected] . You may also contact my dissertation advisor, Dr. Zach
Kelehear, at 803-777-2822 or by email at [email protected] for additional information
regarding this research.
Page 120
107
Please contact me via email if you are willing to allow me to conduct this study in your
district. If permission is granted, I will contact principals in your district so that they may
assist me in the distribution of an invitation letter for possible participation. The survey
will be conducted online.
I appreciate any assistance you can give me in completing this final step in my doctoral
journey.
Sincerely,
Heather Gordon
108 Kingsland Way
Piedmont, SC 29673
864-421-4776
Page 121
108
Appendix B: Principal Email
To: (Email)
From: [email protected]
Subject: Instructional Coaching Dissertation Survey
Body:
Dear (Principal):
My name is Heather Gordon, and I am a doctoral candidate in the Educational Leadership
and Policy Department at the University of South Carolina. I am conducting a research
study on instructional coaching in the Upstate region of South Carolina. I am interested
in teachers’ perceptions of instructional coaching best practices. This survey is
completely anonymous with no identifying information for the teacher or school. For
the purpose of this study, instructional coaching may be facilitated by an instructional
coach, curriculum facilitator, literacy coach, math coach, science coach, etc.
I have been granted by (Superintendent/Designee) to conduct a survey in your school.
The survey should take no longer than 10 – 20 minutes to complete. Teachers may
access the survey via the link below. I have also attached to this email a letter for your
teachers. Please forward the letter and website link to teachers.
If you would like to contact me, you may email, [email protected] , or call (864)
421-4776.
Thank you for forwarding the survey information to your teachers. The survey link is:
(Survey link).
Again, thank you for your assistance!
Heather Gordon
Page 122
109
Appendix C: Teacher Participation Letter
Dear Teacher:
My name is Heather Gordon, and I am a doctoral candidate in the Educational Leadership
and Policy Department at the University of South Carolina. I am conducting a research
study on instructional coaching in the Upstate region of South Carolina. I am interested
in your perceptions of instructional coaching best practices. For the purpose of this
study, instructional coaching may be facilitated by an instructional coach, curriculum
facilitator, literacy coach, math coach, science coach, etc.
Teachers in elementary schools with an instructional coaching program in the Upstate of
South Carolina have been asked to complete this survey. The survey should take no
longer than 10 – 20 minutes to complete. I am very interested in your feedback. Your
responses to this survey will remain confidential. No identifying information about any
particular school’s instructional coaching program or teachers will be asked. There are
some questions regarding general teacher demographics such as years of experience,
education level, and education as a first career, but none of that information will be used
to identify any teacher, school, or school district.
Please feel free to call me or email me if you have any questions or concerns. I may be
contacted by cell phone at 864-421-4776 or by email at [email protected] .
Thank you in advance for your assistance and time. If you are interested, I would be
happy to share a summary of the results with you upon completion of this research.
Most appreciatively,
Heather Gordon
Doctoral student at the University of South Carolina
Page 123
110
Appendix D: Teacher Survey
Page 128
115
Appendix E: Survey Item Results – All Data
Instructional Coaching Best Practice 1
Measures of Central Tendency
Collaborating with teachers to address school-wide instructional concerns and
practices
4 5 6 7 8 24 GROUP
Mean 2.713 2.751 2.802 2.911 2.727 2.948 2.809
Median 3.000 3.000 3.000 3.000 3.000 3.000 3.000
Mode 3.000 4.000 4.000 4.000 4.000 4.000 4.000
STDev 0.982 1.053 1.058 1.009 1.107 0.994 1.037
N 349 346 349 347 344 348 2083
Descriptive Data
Frequency 4 5 6 7 8 24 GROUP %
1 45 54 51 39 63 33 285 13.68%
2 97 83 83 76 81 82 502 24.10%
3 120 104 99 109 87 103 622 29.86%
4 87 105 116 123 113 130 674 32.36%
N 349 346 349 347 344 348 2083 100.00%
Instructional Coaching Best Practice 2
Measures of Central Tendency
Collaboratively planning with a teacher to identify when and how an instructional intervention might be implemented
9 10 11 12 13 25 GROUP
Mean 2.641 2.686 2.567 2.858 2.556 2.854 2.694
Median 3.000 3.000 3.000 3.000 3.000 3.000 3.000
Mode 4.000 3.000 3.000 4.000 3.000 4.000 4.000
STDev 1.083 1.061 1.061 1.017 1.091 1.047 1.066
N 345 344 344 345 347 349 2074
Descriptive Data
Frequency 9 10 11 12 13 25 GROUP %
1 65 58 69 43 76 47 358 17.26%
2 91 90 93 77 89 79 519 25.02%
3 92 98 100 111 95 101 597 28.78%
4 97 98 82 114 87 122 600 28.93%
N 345 344 344 345 347 349 2074 100.00%
Page 129
116
Instructional Coaching Best Practice 3
Measures of Central Tendency
Modeling instructional practices in teachers' classrooms
14 15 16 17 18 26 GROUP
Mean 2.308 2.272 2.445 2.693 2.732 2.149 2.433
Median 2.000 2.000 2.000 3.000 3.000 2.000 2.000
Mode 1.000 1.000 1.000 4.000 3.000 1.000 1.000
STDev 1.137 1.124 1.116 1.059 1.019 1.126 1.117
N 344 345 344 342 343 343 2061
Descriptive Data
Frequency 14 15 16 17 18 26 GROUP %
1 112 117 93 56 48 135 561 27.22%
2 87 83 83 92 92 82 519 25.18%
3 72 79 90 95 107 66 509 24.70%
4 73 66 78 99 96 60 472 22.90%
N 344 345 344 342 343 343 2061 100.00%
Instructional Coaching Best Practice 4
Measures of Central Tendency
Observing teachers and providing teachers with feedback
19 20 21 22 23 27 GROUP
Mean 2.396 2.255 2.618 2.593 2.749 2.370 2.496
Median 2.000 2.000 3.000 3.000 3.000 2.000 2.000
Mode 2.000 1.000 4.000 2.000 4.000 2.000 2.000
STDev 1.096 1.163 1.095 1.073 1.075 1.117 1.115
N 346.000 345.000 346.000 344.000 342.000 346.000 2069.000
Descriptive Data
Frequency 19 20 21 22 23 27 GROUP %
1 93 129 70 67 56 97 512 24.75%
2 96 70 88 95 83 102 534 25.81%
3 84 75 92 93 94 69 507 24.50%
4 73 71 96 89 109 78 516 24.94%
N 346 345 346 344 342 346 2069 100.00%
Page 130
117
Appendix: F: Demographic Groups – Education Level
Bachelor’s Degree
Instructional Coaching Best Practice 1
Measures of Central Tendency
Collaborating with teachers to address school-wide instructional concerns and practices
4 5 6 7 8 24 GROUP
Mean 2.905 2.972 3.014 3.055 2.849 2.973 2.961
Median 3 3 3 3 3 3 3
Mode 3 3 4 4 4 3 4
STDev 0.863 0.993 0.986 0.926 1.023 0.950 0.955
N 74 72 74 73 73 74 440
Descriptive Data
Frequency 4 5 6 7 8 24 GROUP %
1 2 8 7 5 8 6 36 8.18%
2 25 12 14 14 20 16 101 22.95%
3 25 26 24 26 20 26 147 33.41%
4 22 26 29 28 25 26 156 35.45%
N 74 72 74 73 73 74 440 100.00%
Instructional Coaching Best Practice 2
Measures of Central Tendency
Collaboratively planning with a teacher to identify when and how an instructional intervention might be implemented
9 10 11 12 13 25 GROUP
Mean 2.770 2.750 2.797 2.973 2.622 2.851 2.794
Median 3 3 3 3 3 3 3
Mode 3 3 3 3 3 4 3
STDev 0.987 1.017 1.020 0.875 1.069 1.029 1.001
N 74 72 74 74 74 74 442
Descriptive Data
Frequency 9 10 11 12 13 25 GROUP %
1 9 10 10 4 15 8 56 12.67%
2 19 18 17 17 16 21 108 24.43%
3 26 24 25 30 25 19 149 33.71%
4 20 20 22 23 18 26 129 29.19%
N 74 72 74 74 74 74 442 100.00%
Page 131
118
Instructional Coaching Best Practice 3
Measures of Central Tendency
Modeling instructional practices in teachers' classrooms
14 15 16 17 18 26 GROUP
Mean 2.351 2.205 2.423 2.708 2.781 2.139 2.434
Median 2 2 3 3 3 2 2
Mode 1 1 3 3 3 1 3
STDev 1.116 1.092 1.091 0.985 0.975 1.130 1.087
N 74 73 71 72 73 72 435
Descriptive Data
Frequency 19 20 21 22 23 27 GROUP %
1 22 25 20 10 8 27 112 25.75%
2 19 20 14 18 20 22 113 25.98%
3 18 16 24 27 25 9 119 27.36%
4 15 12 13 17 20 14 91 20.92%
N 74 73 71 72 73 72 435 100.00%
Instructional Coaching Best Practice 4
Measures of Central Tendency
Observing teachers and providing teachers with feedback
19 20 21 22 23 27 GROUP
Mean 2.541 2.365 2.730 2.653 2.851 2.284 2.570
Median 3 2 3 3 3 2 3
Mode 2 1 3 2 3 1 3
STDev 1.036 1.130 1.024 1.009 0.961 1.153 1.067
N 74 74 74 72 74 74 442
Descriptive Data
Frequency 19 20 21 22 23 27 GROUP %
1 14 23 10 10 8 25 90 20.36%
2 22 16 21 23 16 19 117 26.47%
3 22 20 22 21 29 14 128 28.96%
4 16 15 21 18 21 16 107 24.21%
N 74 74 74 72 74 74 442 100.00%
Page 132
119
Bachelor’s Degree Plus 18 Hours
Instructional Coaching Best Practice 1
Measures of Central Tendency
Collaborating with teachers to address school-wide instructional concerns and practices
4 5 6 7 8 24 GROUP
Mean 2.417 2.500 2.625 2.604 2.333 2.813 2.549
Median 3 3 3 3 2 3 3
Mode 3 3 4 4 1 3 3
STDev 1.028 1.111 1.123 1.198 1.191 1.045 1.119
N 48 48 48 48 48 48 288
Descriptive Data
Frequency 4 5 6 7 8 24 GROUP %
1 12 12 10 12 17 7 70 24.31%
2 11 11 12 11 9 10 64 22.22%
3 18 14 12 9 11 16 80 27.78%
4 7 11 14 16 11 15 74 25.69%
N 48 48 48 48 48 48 288 100.00%
Instructional Coaching Best Practice 2
Measures of Central Tendency
Collaboratively planning with a teacher to identify when and how an instructional
intervention might be implemented
9 10 11 12 13 25 GROUP
Mean 2.383 2.468 2.271 2.596 2.250 2.771 2.456
Median 2 2 2 3 2 3 2
Mode 1 2 2 4 1 3 2
STDev 1.114 1.139 1.047 1.116 1.101 1.077 1.105
N 47 47 48 47 48 48 285
Descriptive Data
Frequency 9 10 11 12 13 14 GROUP %
1 13 12 13 10 15 8 71 24.91%
2 13 13 17 12 15 10 80 28.07%
3 11 10 10 12 9 15 67 23.51%
4 10 12 8 13 9 15 67 23.51%
N 47 47 48 47 48 48 285 100.00%
Page 133
120
Instructional Coaching Best Practice 3
Measures of Central Tendency
Modeling instructional practices in teachers' classrooms
14 15 16 17 18 26 GROUP
Mean 2.067 2.042 2.229 2.435 2.489 1.915 2.196
Median 2 2 2 2 3 2 2
Mode 1 1 1 2 3 1 1
STDev 1.116 1.071 1.096 1.088 1.040 1.100 1.096
N 45 48 48 46 47 47 281
Descriptive Data
Frequency 19 20 21 22 23 27 GROUP %
1 19 20 16 11 10 23 99 35.23%
2 11 12 13 14 13 12 75 26.69%
3 8 10 11 11 15 5 60 21.35%
4 7 6 8 10 9 7 47 16.73%
N 45 48 48 46 47 47 281 100.00%
Instructional Coaching Best Practice 4
Measures of Central Tendency
Observing teachers and providing teachers with feedback
19 20 21 22 23 27 GROUP
Mean 2.043 2.085 2.404 2.383 2.447 2.271 2.272
Median 2 2 2 2 2 2 2
Mode 1 1 2 1 2 1 1
STDev 1.083 1.139 1.077 1.114 1.119 1.125 1.111
N 47 47 47 47 47 48 283
Descriptive Data
Frequency 19 20 21 22 23 27 GROUP %
1 19 21 12 13 11 16 92 32.51%
2 14 8 13 13 16 12 76 26.86%
3 7 11 13 11 8 11 61 21.55%
4 7 7 9 10 12 9 54 19.08%
N 47 47 47 47 47 48 283 100.00%
Page 134
121
Master’s Degree
Instructional Coaching Best Practice 1
Measures of Central Tendency
Collaborating with teachers to address school-wide instructional concerns and practices
4 5 6 7 8 24 GROUP
Mean 2.743 2.722 2.770 2.960 2.811 3.013 2.836
Median 3 3 3 3 3 3 3
Mode 3 4 4 4 4 4 4
STDev 0.966 1.072 1.064 0.962 1.121 0.945 1.027
N 152 151 152 150 148 151 904
Descriptive Data
Frequency 4 5 6 7 8 24 GROUP %
1 17 23 21 12 25 10 108 11.95%
2 44 44 44 36 34 36 238 26.33%
3 52 36 36 48 33 47 252 27.88%
4 39 48 51 54 56 58 306 33.85%
N 152 151 152 150 148 151 904 100.00%
Instructional Coaching Best Practice 2
Measures of Central Tendency
Collaboratively planning with a teacher to identify when and how an instructional intervention
might be implemented
9 10 11 12 13 25 GROUP
Mean 2.702 2.733 2.577 2.868 2.611 2.908 2.734
Median 3 3 3 3 3 3 3
Mode 4 4 3 4 4 4 4
STDev 1.112 1.079 1.098 1.050 1.101 1.006 1.079
N 151 150 149 151 149 152 902
Descriptive Data
Frequency 9 10 11 12 13 25 GROUP %
1 28 25 32 20 31 17 153 16.96%
2 38 37 38 34 37 33 217 24.06%
3 36 41 40 43 40 49 249 27.61%
4 49 47 39 54 41 53 283 31.37%
N 151 150 149 151 149 152 902 100.00%
Page 135
122
Instructional Coaching Best Practice 3
Measures of Central Tendency
Modeling instructional practices in teachers' classrooms
19 20 21 22 23 27 GROUP
Mean 2.325 2.371 2.487 2.75 2.76 2.255 2.492
Median 2 2 2 3 3 2 2
Mode 1 1 1 4 3 1 1
STDev 1.169 1.164 1.128 1.069 1.015 1.146 1.131
N 151 151 152 152 150 149 905
Descriptive Data
Frequency 19 20 21 22 23 27 GROUP %
1 51 49 39 23 20 54 236 26.08%
2 35 32 38 41 39 32 217 23.98%
3 30 35 37 39 48 34 223 24.64%
4 35 35 38 49 43 29 229 25.30%
N 151 151 152 152 150 149 905 100.00%
Instructional Coaching Best Practice 4
Measures of Central Tendency
Observing teachers and providing teachers with feedback
19 20 21 22 23 27 GROUP
Mean 2.464 2.265 2.649 2.633 2.787 2.453 2.542
Median 2 2 3 3 3 2 3
Mode 2 1 4 3 4 2 4
STDev 1.106 1.187 1.109 1.071 1.084 1.097 1.119
N 151 151 151 150 150 150 903
Descriptive Data
Frequency 19 20 21 22 23 27 GROUP %
1 38 57 30 28 23 35 211 23.37%
2 40 31 38 39 38 48 234 25.91%
3 38 29 38 43 37 31 216 23.92%
4 35 34 45 40 52 36 242 26.80%
N 151 151 151 150 150 150 903 100.00%
Page 136
123
Master’s Degree Plus 30 Hours
Instructional Coaching Best Practice 1
Measures of Central Tendency
Collaborating with teachers to address school-wide instructional concerns
and practices
4 5 6 7 8 24 GROUP
Mean 2.676 2.775 2.789 2.903 2.704 2.915 2.794
Median 3 3 3 3 3 3 3
Mode 3 3 3 3 3 4 3
STDev 1.053 1.003 1.054 1.009 1.061 1.092 1.043
N 71 71 71 72 71 71 427
Descriptive Data
Frequency 4 5 6 7 8 24 GROUP %
1 13 10 12 9 12 9 65 15.22%
2 15 15 12 13 17 18 90 21.08%
3 25 27 26 26 22 14 140 32.79%
4 18 19 21 24 20 30 132 30.91%
N 71 71 71 72 71 71 427 100.00%
Instructional Coaching Best Practice 2
Measures of Central Tendency
Collaboratively planning with a teacher to identify when and how an instructional intervention
might be implemented
9 10 11 12 13 25 GROUP
Mean 2.557 2.690 2.522 2.913 2.611 2.831 2.687
Median 3 3 3 3 3 3 3
Mode 2 3 3 3 3 4 3
STDev 1.072 1.008 0.994 0.996 1.056 1.121 1.046
N 70 71 69 69 72 71 422
Descriptive Data
Frequency 9 10 11 12 13 25 GROUP %
1 14 10 13 8 13 12 70 16.59%
2 20 20 19 13 20 15 107 25.36%
3 19 23 25 25 21 17 130 30.81%
4 17 18 12 23 18 27 115 27.25%
N 70 71 69 69 72 71 422 100.00%
Page 137
124
Instructional Coaching Best Practice 3
Measures of Central Tendency
Modeling instructional practices in teachers' classrooms
14 15 16 17 18 26 GROUP
Mean 2.414 2.319 2.522 2.750 2.812 2.113 2.486
Median 2 2 3 3 3 2 2
Mode 2 1 3 4 4 1 2
STDev 1.083 1.078 1.106 1.084 1.047 1.076 1.100
N 70 69 69 68 69 71 416
Descriptive Data
Frequency 14 14 16 17 18 26 GROUP %
1 17 20 16 11 9 28 101 24.28%
2 22 19 18 17 18 16 110 26.44%
3 16 18 18 18 19 18 107 25.72%
4 15 12 17 22 23 9 98 23.56%
N 70 69 69 68 69 71 416 100.00%
Instructional Coaching Best Practice 4
Measures of Central Tendency
Observing teachers and providing teachers with feedback
19 20 21 22 23 27 GROUP
Mean 2.371 2.246 2.614 2.606 2.806 2.371 2.501
Median 2 2 3 3 3 2 3
Mode 2 1 4 4 4 2 1
STDev 1.092 1.168 1.133 1.115 1.104 1.119 1.131
N 70 69 70 71 67 70 417
Descriptive Data
Frequency 19 20 21 22 23 27 GROUP %
1 19 26 16 15 12 19 107 25.66%
2 20 14 15 18 12 22 101 24.22%
3 17 15 19 18 20 13 102 24.46%
4 14 14 20 20 23 16 107 25.66%
N 70 69 70 71 67 70 417 100.00%
Page 138
125
Doctorate Degree Plus 30 Hours
Instructional Coaching Best Practice 1
Measures of Central Tendency
Collaborating with teachers to address school-wide instructional concerns
and practices
4 5 6 7 8 24 GROUP
Mean 2.25 2.5 2.5 2.25 2.5 2.25 2.375
Median 2 2.5 2.5 2 2.5 2 2
Mode 2 2 2 2 2 2 2
STDev 1.258 1.291 1.291 1.258 1.291 1.258 1.135
N 4 4 4 4 4 4 24
Descriptive Data
Frequency 4 5 6 7 8 24 GROUP %
1 1 1 1 1 1 1 6 25.00%
2 2 1 1 2 1 2 9 37.50%
3 0 1 1 0 1 0 3 12.50%
4 1 1 1 1 1 1 6 25.00%
N 4 4 4 4 4 4 24 100.00%
Instructional Coaching Best Practice 2
Measures of Central Tendency
Collaboratively planning with a teacher to identify when and how an instructional intervention
might be implemented
9 10 11 12 13 25 GROUP
Mean 2.333 2.250 2.250 2.500 2.000 2.250 2.261
Median 2 2 2 2.5 1.5 2 2
Mode #N/A 2 2 #N/A 1 1 1
STDev 1.528 1.258 1.258 1.291 1.414 1.500 1.214
N 3 4 4 4 4 4 23
Descriptive Data
Frequency 9 10 11 12 13 25 GROUP %
1 1 1 1 1 2 2 8 34.78%
2 1 2 2 1 1 0 7 30.43%
3 0 0 0 1 0 1 2 8.70%
4 1 1 1 1 1 1 6 26.09%
N 3 4 4 4 4 4 23 100.00%
Page 139
126
Instructional Coaching Best Practice 3
Measures of Central Tendency
Modeling instructional practices in teachers' classrooms
14 15 16 17 18 26 GROUP
Mean 1.75 1.75 2.5 2.25 2.25 1.75 2.042
Median 1 1 2.5 2 2 1 1
Mode 1 1 1 2 2 1 1
STDev 1.5 1.5 1.732 1.258 1.258 1.5 1.334
N 4 4 4 4 4 4 24
Descriptive Data
Frequency 14 15 16 17 18 26 GROUP %
1 3 3 2 1 1 3 13 54.17%
2 0 0 0 2 2 0 4 16.67%
3 0 0 0 0 0 0 0 0.00%
4 1 1 2 1 1 1 7 29.17%
N 4 4 4 4 4 4 24 100.00%
Instructional Coaching Best Practice 4
Measures of Central Tendency
Observing teachers and providing teachers with feedback
19 20 21 22 23 27 GROUP
Mean 1.75 2 2 2.25 2 2 2
Median 1 1.5 1.5 2 1.5 1.5 1.5
Mode 1 1 1 2 1 1 1
STDev 1.5 1.414 1.414 1.258 1.414 1.414 1.251
N 4 4 4 4 4 4 24
Descriptive Data
Frequency 19 20 21 22 23 27 GROUP %
1 3 2 2 1 2 2 12 50.00%
2 0 1 1 2 1 1 6 25.00%
3 0 0 0 0 0 0 0 0.00%
4 1 1 1 1 1 1 6 25.00%
N 4 4 4 4 4 4 24 100.00%
Page 140
127
Appendix: G: Demographic Groups – Years of Teaching Experience
0 – 5 Years of Experience
Instructional Coaching Best Practice 1
Measures of Central Tendency
Collaborating with teachers to address school-wide instructional concerns and practices
4 5 6 7 8 24 GROUP
Mean 2.722 2.887 3.000 2.943 2.698 2.963 2.869
Median 3 3 3 3 3 3 3
Mode 3 3 4 4 4 4 4
STDev 0.940 0.974 0.991 1.045 1.153 0.990 1.016
N 54 53 54 53 53 54 321
Descriptive Data
Frequency 4 5 6 7 8 24 GROUP %
1 5 6 5 6 10 4 36 11.21%
2 18 10 11 12 15 15 81 25.23%
3 18 21 17 14 9 14 93 28.97%
4 13 16 21 21 19 21 111 34.58%
N 54 53 54 53 53 54 321 100.00%
Instructional Coaching Best Practice 2
Measures of Central Tendency
Collaboratively planning with a teacher to identify when and how an instructional intervention might be implemented
9 10 11 12 13 25 GROUP
Mean 2.759 2.725 2.679 2.904 2.547 3 2.770
Median 3 3 3 3 3 3 3
Mode 4 3 3 3 4 4 4
STDev 1.063 0.981 1.088 0.955 1.186 1.028 1.056
N 54 51 53 52 53 54 317
Descriptive Data
Frequency 9 10 11 12 13 25 GROUP %
1 8 6 10 5 14 6 49 15.46%
2 14 15 12 11 12 10 74 23.34%
3 15 17 16 20 11 16 95 29.97%
4 17 13 15 16 16 22 99 31.23%
N 54 51 53 52 53 54 317 100.00%
Page 141
128
Instructional Coaching Best Practice 3
Measures of Central Tendency
Modeling instructional practices in teachers' classrooms
14 15 16 17 18 26 GROUP
Mean 2.442 2.264 2.462 2.736 2.731 2.208 2.473
Median 2 2 2 3 3 2 2
Mode 2 1 1 4 3 1 1
STDev 1.127 1.195 1.179 1.059 0.992 1.261 1.149
N 52 53 52 53 52 53 315
Descriptive Data
Frequency 14 15 16 17 18 26 GROUP %
1 13 20 15 8 8 23 87 27.62%
2 16 11 12 14 10 10 73 23.17%
3 10 10 11 15 22 6 74 23.49%
4 13 12 14 16 12 14 81 25.71%
N 52 53 52 53 52 53 315 100.00%
Instructional Coaching Best Practice 4
Measures of Central Tendency
Observing teachers and providing teachers with feedback
19 20 21 22 23 27 GROUP
Mean 2.509 2.340 2.755 2.717 2.804 2.463 2.596
Median 2 2 3 3 3 2 3
Mode 2 1 4 2 4 4 4
STDev 1.187 1.224 1.072 1.045 1.020 1.255 1.142
N 53 53 53 53 51 54 317
Descriptive Data
Frequency 19 20 21 22 23 27 GROUP %
1 13 19 8 7 6 17 70 22.08%
2 17 11 14 17 14 13 86 27.13%
3 6 9 14 13 15 6 63 19.87%
4 17 14 17 16 16 18 98 30.91%
N 53 53 53 53 51 54 317 100.00%
Page 142
129
6 – 10 Years of Experience
Instructional Coaching Best Practice 1
Measures of Central Tendency
Collaborating with teachers to address school-wide instructional concerns
and practices
4 5 6 7 8 24 GROUP
Mean 2.766 2.763 2.766 2.947 2.724 2.870 2.806
Median 3 3 3 3 3 3 3
Mode 3 2 4 3 3 4 3
STDev 0.902 1.018 1.050 0.943 1.091 1.056 1.009
N 77 76 77 75 76 77 458
Descriptive Data
Frequency 4 5 6 7 8 24 GROUP %
1 7 9 11 6 14 11 58 12.66%
2 21 23 20 17 16 15 112 24.45%
3 32 21 22 27 23 24 149 32.53%
4 17 23 24 25 23 27 139 30.35%
N 77 76 77 75 76 77 458 100.00%
Instructional Coaching Best Practice 2
Measures of Central Tendency
Collaboratively planning with a teacher to identify when and how an instructional intervention
might be implemented
9 10 11 12 13 25 GROUP
Mean 2.697 2.684 2.618 2.909 2.520 2.740 2.696
Median 3 3 3 3 3 3 3
Mode 3 3 3 3 3 4 3
STDev 1.033 1.061 1.032 1.015 1.031 1.129 1.052
N 76 76 76 77 75 77 457
Descriptive Data
Frequency 9 10 11 12 13 25 GROUP %
1 12 13 14 10 15 16 80 17.51%
2 19 19 18 13 21 13 103 22.54%
3 25 23 27 28 24 23 150 32.82%
4 20 21 17 26 15 25 124 27.13%
N 76 76 76 77 75 77 457 100.00%
Page 143
130
Instructional Coaching Best Practice 3
Measures of Central Tendency
Modeling instructional practices in teachers' classrooms
14 15 16 17 18 26 GROUP
Mean 2.299 2.250 2.468 2.688 2.853 2.176 2.456
Median 2 2 3 3 3 2 2
Mode 2 1 3 3 3 1 3
STDev 1.052 1.109 1.107 1.042 0.954 1.127 1.089
N 77 76 77 77 75 74 456
Descriptive Data
Frequency 14 15 16 17 18 26 GROUP %
1 21 26 21 13 7 28 116 25.44%
2 25 18 15 18 19 18 113 24.78%
3 18 19 25 26 27 15 130 28.51%
4 13 13 16 20 22 13 97 21.27%
N 77 76 77 77 75 74 456 100.00%
Instructional Coaching Best Practice 4
Measures of Central Tendency
Observing teachers and providing teachers with feedback
19 20 21 22 23 27 GROUP
Mean 2.461 2.329 2.623 2.571 2.776 2.395 2.526
Median 3 2.5 3 3 3 2 3
Mode 3 1 4 3 3 1 3
STDev 1.076 1.148 1.124 1.093 1.053 1.190 1.119
N 76 76 77 77 76 76 458
Descriptive Data
Frequency 19 20 21 22 23 27 GROUP %
1 19 27 17 18 12 25 118 25.76%
2 18 11 17 15 16 15 92 20.09%
3 24 24 21 26 25 17 137 29.91%
4 15 14 22 18 23 19 111 24.24%
N 76 76 77 77 76 76 458 100.00%
Page 144
131
11 – 15 Years of Experience
Instructional Coaching Best Practice 1
Measures of Central Tendency
Collaborating with teachers to address school-wide instructional concerns
and practices
4 5 6 7 8 24 GROUP
Mean 2.743 2.667 2.771 2.871 2.765 2.986 2.800
Median 3 3 3 3 3 3 3
Mode 2 4 4 3 4 4 4
STDev 0.973 1.120 1.106 0.883 1.121 1.007 1.037
N 70 69 70 70 68 69 416
Descriptive Data
Frequency 4 5 6 7 8 24 GROUP %
1 7 14 12 4 12 6 55 13.22%
2 23 16 16 20 16 17 108 25.96%
3 21 18 18 27 16 18 118 28.37%
4 19 21 24 19 24 28 135 32.45%
N 70 69 70 70 68 69 416 100.00%
Instructional Coaching Best Practice 2
Measures of Central Tendency
Collaboratively planning with a teacher to identify when and how an instructional intervention
might be implemented
9 10 11 12 13 25 GROUP
Mean 2.710 2.743 2.529 2.824 2.600 2.786 2.698
Median 3 3 2 3 3 3 3
Mode 4 4 2 4 3 4 4
STDev 1.126 1.073 1.100 1.092 1.122 1.020 1.087
N 69 70 70 68 70 70 417
Descriptive Data
Frequency 9 10 11 12 13 25 GROUP %
1 13 10 15 10 16 8 72 17.27%
2 17 21 21 17 15 21 112 26.86%
3 16 16 16 16 20 19 103 24.70%
4 23 23 18 25 19 22 130 31.18%
N 69 70 70 68 70 70 417 100.00%
Page 145
132
Instructional Coaching Best Practice 3
Measures of Central Tendency
Modeling instructional practices in teachers' classrooms
14 15 16 17 18 26 GROUP
Mean 2.257 2.329 2.397 2.681 2.600 2.029 2.382
Median 2 2 2 3 3 2 2
Mode 1 1 3 4 2 1 1
STDev 1.200 1.113 1.095 1.105 1.055 1.029 1.115
N 70 70 68 69 70 69 416
Descriptive Data
Frequency 14 15 16 17 18 26 GROUP %
1 27 21 19 13 12 27 119 28.61%
2 14 19 16 17 22 21 109 26.20%
3 13 16 20 18 18 13 98 23.56%
4 16 14 13 21 18 8 90 21.63%
N 70 70 68 69 70 69 416 100.00%
Instructional Coaching Best Practice 4
Measures of Central Tendency
Observing teachers and providing teachers with feedback
19 20 21 22 23 27 GROUP
Mean 2.314 2.232 2.565 2.588 2.714 2.286 2.450
Median 2 2 3 3 3 2 2
Mode 1 1 4 4 4 2 1
STDev 1.097 1.190 1.144 1.149 1.131 1.065 1.137
N 70 69 69 68 70 70 416
Descriptive Data
Frequency 19 20 21 22 23 27 GROUP %
1 21 27 17 16 15 18 114 27.40%
2 19 14 15 16 12 28 104 25.00%
3 17 13 18 16 21 10 95 22.84%
4 13 15 19 20 22 14 103 24.76%
N 70 69 69 68 70 70 416 100.00%
Page 146
133
16 – 20 Years of Experience
Instructional Coaching Best Practice 1
Measures of Central Tendency
Collaborating with teachers to address school-wide instructional concerns
and practices
4 5 6 7 8 24 GROUP
Mean 2.729 2.646 2.729 2.979 2.804 2.979 2.811
Median 3 3 3 3 3 3 3
Mode 3 3 3 4 4 3 4
STDev 1.026 1.082 1.026 1.062 1.167 0.887 1.043
N 48 48 48 48 46 48 286
Descriptive Data
Frequency 4 5 6 7 8 24 GROUP %
1 7 9 7 7 9 2 41 14.34%
2 12 12 12 6 9 13 64 22.38%
3 16 14 16 16 10 17 89 31.12%
4 13 13 13 19 18 16 92 32.17%
N 48 48 48 48 46 48 286 100.00%
Instructional Coaching Best Practice 2
Measures of Central Tendency
Collaboratively planning with a teacher to identify when and how an instructional intervention
might be implemented
9 10 11 12 13 25 GROUP
Mean 2.696 2.792 2.739 2.854 2.542 2.896 2.754
Median 3 3 3 3 3 3 3
Mode 3 3 3 3 3 4 3
STDev 1.030 0.988 0.999 0.989 1.091 0.973 1.010
N 46 48 46 48 48 48 284
Descriptive Data
Frequency 9 10 11 12 13 25 GROUP %
1 7 6 6 6 11 4 40 14.08%
2 12 11 12 9 11 13 68 23.94%
3 15 18 16 19 15 15 98 34.51%
4 12 13 12 14 11 16 78 27.46%
N 46 48 46 48 48 48 284 100.00%
Page 147
134
Instructional Coaching Best Practice 3
Measures of Central Tendency
Modeling instructional practices in teachers' classrooms
14 15 16 17 18 26 GROUP
Mean 2.261 2.196 2.447 2.711 2.766 2.191 2.428
Median 2 2 2 3 3 2 2
Mode 1 1 2 3 4 1 2
STDev 1.124 1.088 1.080 1.014 1.068 1.116 1.098
N 46 46 47 45 47 47 278
Descriptive Data
Frequency 14 15 16 17 18 26 GROUP %
1 15 17 11 6 7 16 72 25.90%
2 13 9 14 13 12 15 76 27.34%
3 9 14 12 14 13 7 69 24.82%
4 9 6 10 12 15 9 61 21.94%
N 46 46 47 45 47 47 278 100.00%
Instructional Coaching Best Practice 4
Measures of Central Tendency
Observing teachers and providing teachers with feedback
19 20 21 22 23 27 GROUP
Mean 2.298 2.191 2.638 2.625 2.771 2.438 2.495
Median 2 2 3 3 3 2 2
Mode 2 1 2 2 4 2 2
STDev 1.061 1.116 1.072 1.003 1.096 1.029 1.073
N 47 47 47 48 48 48 285
Descriptive Data
Frequency 19 20 21 22 23 27 GROUP %
1 13 17 8 7 8 9 62 21.75%
2 15 12 14 15 11 19 86 30.18%
3 11 10 12 15 13 10 71 24.91%
4 8 8 13 11 16 10 66 23.16%
N 47 47 47 48 48 48 285 100.00%
Page 148
135
More than 20 Years of Experience
Instructional Coaching Best Practice 1
Measures of Central Tendency
Collaborating with teachers to address school-wide instructional concerns
and practices
4 5 6 7 8 24 GROUP
Mean 2.64 2.78 2.78 2.861 2.683 2.96 2.784
Median 3 3 3 3 3 3 3
Mode 3 4 4 4 4 4 4
STDev 1.059 1.069 1.088 1.105 1.076 1.004 1.068
N 100 100 100 101 101 100 602
Descriptive Data
Frequency 4 5 6 7 8 24 GROUP %
1 19 16 16 16 18 10 95 15.78%
2 23 22 24 21 25 22 137 22.76%
3 33 30 26 25 29 30 173 28.74%
4 25 32 34 39 29 38 197 32.72%
N 100 100 100 101 101 100 602 100.00%
Instructional Coaching Best Practice 2
Measures of Central Tendency
Collaboratively planning with a teacher to identify when and how an instructional intervention
might be implemented
9 10 11 12 13 25 GROUP
Mean 2.46 2.576 2.414 2.82 2.564 2.89 2.621
Median 2 3 2 3 3 3 3
Mode 2 4 2 4 2 4 4
STDev 1.123 1.135 1.069 1.029 1.081 1.053 1.092
N 100 99 99 100 101 100 599
Descriptive Data
Frequency 9 10 11 12 13 25 GROUP %
1 25 23 24 12 20 13 117 19.53%
2 29 24 30 27 30 22 162 27.05%
3 21 24 25 28 25 28 151 25.21%
4 25 28 20 33 26 37 169 28.21%
N 100 99 99 100 101 100 599 100.00%
Page 149
136
Instructional Coaching Best Practice 3
Measures of Central Tendency
Modeling instructional practices in teachers' classrooms
14 15 16 17 18 26 GROUP
Mean 2.303 2.29 2.45 2.673 2.717 2.16 2.431
Median 2 2 2 3 3 2 2
Mode 1 1 1 2 4 1 1
STDev 1.182 1.140 1.140 1.082 1.040 1.135 1.135
N 99 100 100 98 99 100 596
Descriptive Data
Frequency 14 15 16 17 18 26 GROUP %
1 36 33 27 16 14 41 167 28.02%
2 19 26 26 30 29 18 148 24.83%
3 22 20 22 22 27 25 138 23.15%
4 22 21 25 30 29 16 143 23.99%
N 99 100 100 98 99 100 596 100.00%
Instructional Coaching Best Practice 4
Measures of Central Tendency
Observing teachers and providing teachers with feedback
19 20 21 22 23 27 GROUP
Mean 2.39 2.2 2.57 2.531 2.711 2.327 2.454
Median 2 2 3 2 3 2 2
Mode 1 1 2 2 4 1 2
STDev 1.091 1.163 1.075 1.067 1.089 1.072 1.102
N 100 100 100 98 97 98 593
Descriptive Data
Frequency 19 20 21 22 23 27 GROUP %
1 27 39 20 19 15 28 148 24.96%
2 27 22 28 32 30 27 166 27.99%
3 26 19 27 23 20 26 141 23.78%
4 20 20 25 24 32 17 138 23.27%
N 100 100 100 98 97 98 593 100.00%
Page 150
137
Appendix: H: Demographic Groups – Education as a First Career
Yes
Instructional Coaching Best Practice 1
Measures of Central Tendency
Collaborating with teachers to address school-wide instructional concerns and practices
4 5 6 7 8 24 GROUP
Mean 2.756 2.801 2.864 2.946 2.785 3.007 2.860
Median 3 3 3 3 3 3 3
Mode 3 3 4 4 4 4 4
STDev 0.973 1.040 1.031 1.000 1.091 0.993 1.024
N 295 292 295 294 289 295 1760
Descriptive Data
Frequency 4 5 6 7 8 24 GROUP %
1 34 42 36 31 48 26 217 12.33%
2 82 66 71 62 65 66 412 23.41%
3 101 92 85 93 77 83 531 30.17%
4 78 92 103 108 99 120 600 34.09%
N 295 292 295 294 289 295 1760 100.00%
Instructional Coaching Best Practice 2
Measures of Central Tendency
Collaboratively planning with a teacher to identify when and how an instructional intervention might be implemented
9 10 11 12 13 25 GROUP
Mean 2.677 2.723 2.613 2.911 2.603 2.908 2.739
Median 3 3 3 3 3 3 3
Mode 4 4 3 4 3 4 4
STDev 1.069 1.064 1.038 0.993 1.081 1.038 1.054
N 291 289 292 291 292 295 1750
Descriptive Data
Frequency 9 10 11 12 13 25 GROUP %
1 50 47 51 30 58 35 271 15.49%
2 78 73 82 67 77 68 445 25.43%
3 79 82 88 93 80 81 503 28.74%
4 84 87 71 101 77 111 531 30.34%
N 291 289 292 291 292 295 1750 100.00%
Page 151
138
Instructional Coaching Best Practice 3
Measures of Central Tendency
Modeling instructional practices in teachers' classrooms
14 15 16 17 18 26 GROUP
Mean 2.349 2.298 2.481 2.740 2.784 2.192 2.474
Median 2 2 3 3 3 2 2
Mode 1 1 3 4 3 1 1
STDev 1.148 1.126 1.109 1.057 1.009 1.134 1.119
N 289 292 291 289 291 291 1743
Descriptive Data
Frequency 14 15 16 17 18 26 GROUP %
1 91 95 74 44 38 109 451 25.87%
2 72 74 71 76 72 72 437 25.07%
3 60 64 78 80 96 55 433 24.84%
4 66 59 68 89 85 55 422 24.21%
N 289 292 291 289 291 291 1743 100.00%
Instructional Coaching Best Practice 4
Measures of Central Tendency
Observing teachers and providing teachers with feedback
19 20 21 22 23 27 GROUP
Mean 2.468 2.312 2.685 2.666 2.817 2.413 2.559
Median 2 2 3 3 3 2 3
Mode 2 1 4 4 4 2 2
STDev 1.084 1.162 1.073 1.063 1.041 1.112 1.102
N 293 292 292 290 290 293 1750
Descriptive Data
Frequency 19 20 21 22 23 27 GROUP %
1 69 102 50 50 38 75 384 21.94%
2 84 60 78 78 74 92 466 26.63%
3 74 67 78 81 81 56 437 24.97%
4 66 63 86 81 97 70 463 26.46%
N 293 292 292 290 290 293 1750 100.00%
Page 152
139
No
Instructional Coaching Best Practice 1
Measures of Central Tendency
Collaborating with teachers to address school-wide instructional concerns
and practices
4 5 6 7 8 24 GROUP
Mean 2.481 2.481 2.463 2.717 2.418 2.623 2.529
Median 3 2 2.5 3 2 3 3
Mode 3 2 1 3 2 3 3
STDev 1.005 1.094 1.145 1.045 1.150 0.945 1.064
N 54 54 54 53 55 53 323
Descriptive Data
Frequency 4 5 6 7 8 24 GROUP %
1 11 12 15 8 15 7 68 21.05%
2 15 17 12 14 16 16 90 27.86%
3 19 12 14 16 10 20 91 28.17%
4 9 13 13 15 14 10 74 22.91%
N 54 54 54 53 55 53 323 100.00%
Instructional Coaching Best Practice 2
Measures of Central Tendency
Collaboratively planning with a teacher to identify when and how an instructional intervention
might be implemented
9 10 11 12 13 25 GROUP
Mean 2.444 2.491 2.308 2.574 2.309 2.556 2.448
Median 2 2 2 3 2 3 3
Mode 1 2 1 3 1 3 3
STDev 1.144 1.034 1.164 1.109 1.120 1.058 1.102
N 54 55 52 54 55 54 324
Descriptive Data
Frequency 9 10 11 12 13 25 GROUP %
1 15 11 18 13 18 12 87 26.85%
2 13 17 11 10 12 11 74 22.84%
3 13 16 12 18 15 20 94 29.01%
4 13 11 11 13 10 11 69 21.30%
N 54 55 52 54 55 54 324 100.00%
Page 153
140
Instructional Coaching Best Practice 3
Measures of Central Tendency
Modeling instructional practices in teachers' classrooms
14 15 16 17 18 26 GROUP
Mean 2.091 2.132 2.245 2.434 2.442 1.904 2.208
Median 2 2 2 2 2 1.5 2
Mode 1 1 1 2 2 1 1
STDev 1.059 1.110 1.142 1.047 1.037 1.053 1.084
N 55 53 53 53 52 52 318
Descriptive Data
Frequency 14 15 16 17 18 26 GROUP %
1 21 22 19 12 10 26 110 34.59%
2 15 9 12 16 20 10 82 25.79%
3 12 15 12 15 11 11 76 23.90%
4 7 7 10 10 11 5 50 15.72%
N 55 53 53 53 52 52 318 100.00%
Instructional Coaching Best Practice 4
Measures of Central Tendency
Observing teachers and providing teachers with feedback
19 20 21 22 23 27 GROUP
Mean 2 1.943 2.259 2.204 2.365 2.132 2.150
Median 2 1 2 2 2 2 2
Mode 1 1 1 2 1 1 1
STDev 1.092 1.134 1.152 1.053 1.189 1.127 1.125
N 53 53 54 54 52 53 319
Descriptive Data
Frequency 19 20 21 22 23 27 GROUP %
1 24 27 20 17 18 22 128 40.13%
2 12 10 10 17 9 10 68 21.32%
3 10 8 14 12 13 13 70 21.94%
4 7 8 10 8 12 8 53 16.61%
N 53 53 54 54 52 53 319 100.00%