An assessment of solar-powered organic Rankine cycle systems for combined heating and power in UK domestic applications James Freeman, Klaus Hellgardt, Christos N. Markides ⇑ Department of Chemical Engineering, Imperial College London, South Kensington Campus, London SW7 2AZ, UK highlights A domestic-scale combined solar heat and power (CSHP) system is simulated in the UK climate. The CSHP system comprises a solar collector array, an ORC engine and a hot-water cylinder. An exergy analysis, parametric study and annual performance assessment are performed. An average electrical power of 89 W plus an 86% hot water coverage are demonstrated. A total system cost as low as £2700 and a levelised cost electricity of 44 p/kW h are reported. article info Article history: Received 14 November 2013 Received in revised form 7 October 2014 Accepted 9 October 2014 Available online 12 November 2014 Keywords: Solar technologies Domestic scale Combined heat and power Organic Rankine cycle Positive-displacement expander abstract Performance calculations are presented for a small-scale combined solar heat and power (CSHP) system based on an Organic Rankine Cycle (ORC), in order to investigate the potential of this technology for the combined provision of heating and power for domestic use in the UK. The system consists of a solar collector array of total area equivalent to that available on the roof of a typical UK home, an ORC engine featuring a generalised positive-displacement expander and a water-cooled condenser, and a hot water storage cylinder. Preheated water from the condenser is sent to the domestic hot water cylinder, which can also receive an indirect heating contribution from the solar collector. Annual simulations of the system are performed. The electrical power output from concentrating parabolic-trough (PTC) and non-concentrating evacuated-tube (ETC) collectors of the same total array area are compared. A paramet- ric analysis and a life-cycle cost analysis are also performed, and the annual performance of the system is evaluated according to the total electrical power output and cost per unit generating capacity. A best-case average electrical power output of 89 W (total of 776 kW h/year) plus a hot water provision capacity equivalent to 80% of the total demand are demonstrated, for a whole system capital cost of £2700–£3900. Tracking PTCs are found to be very similar in performance to non-tracking ETCs with an average power output of 89 W (776 kW h/year) vs. 80 W (701 kW h/year). Ó 2014 The Authors. Published by Elsevier Ltd. This is an open access article under the CC BY license (http://creativecommons.org/licenses/by/3.0/). 1. Introduction 1.1. Solar heat and power in the UK Between a quarter and 30% of the total CO 2 emissions in the United Kingdom are associated with domestic energy use [1,2]. Therefore, meeting the UK target for a reduction in CO 2 emissions of 50% by 2050 is strongly dependent on a significant contribution from dwellings, and a meaningful strategy for achieving this target should suitably address this sector. Further, in 2010 the International Energy Agency (IEA) published a roadmap [3] for emissions reduction over the next four decades, detailing the expected contributions from a range of improvements and technological developments. In this roadmap it is predicted that end-use fuel and energy efficiency will provide the largest proportion of the emissions reduction, contributing 38% of the overall target, while renewables are expected to provide a further 17%. Together, these account for more than half of the overall target and are also the areas in which the domestic sector can play a significant role. The UK has a modest solar resource compared to countries of subtropical latitudes. The global horizontal solar irradiation received annually in London is typically between 1000 and 1100 kW h/m 2 [4], equivalent to approximately 120 W/m 2 on http://dx.doi.org/10.1016/j.apenergy.2014.10.035 0306-2619/Ó 2014 The Authors. Published by Elsevier Ltd. This is an open access article under the CC BY license (http://creativecommons.org/licenses/by/3.0/). ⇑ Corresponding author. E-mail address: [email protected](C.N. Markides). URL: http://www.imperial.ac.uk/people/c.markides (C.N. Markides). Applied Energy 138 (2015) 605–620 Contents lists available at ScienceDirect Applied Energy journal homepage: www.elsevier.com/locate/apenergy
An assessment of solar-powered organic Rankine cycle systemsfor combined heating and power in UK domestic applications
http://dx.doi.org/10.1016/j.apenergy.2014.10.0350306-2619/� 2014 The Authors. Published by Elsevier Ltd.This is an open access article under the CC BY license (http://creativecommons.org/licenses/by/3.0/).
James Freeman, Klaus Hellgardt, Christos N. Markides ⇑Department of Chemical Engineering, Imperial College London, South Kensington Campus, London SW7 2AZ, UK
h i g h l i g h t s
� A domestic-scale combined solar heat and power (CSHP) system is simulated in the UK climate.� The CSHP system comprises a solar collector array, an ORC engine and a hot-water cylinder.� An exergy analysis, parametric study and annual performance assessment are performed.� An average electrical power of 89 W plus an 86% hot water coverage are demonstrated.� A total system cost as low as £2700 and a levelised cost electricity of 44 p/kW h are reported.
a r t i c l e i n f o
Article history:Received 14 November 2013Received in revised form 7 October 2014Accepted 9 October 2014Available online 12 November 2014
Keywords:Solar technologiesDomestic scaleCombined heat and powerOrganic Rankine cyclePositive-displacement expander
a b s t r a c t
Performance calculations are presented for a small-scale combined solar heat and power (CSHP) systembased on an Organic Rankine Cycle (ORC), in order to investigate the potential of this technology for thecombined provision of heating and power for domestic use in the UK. The system consists of a solarcollector array of total area equivalent to that available on the roof of a typical UK home, an ORC enginefeaturing a generalised positive-displacement expander and a water-cooled condenser, and a hot waterstorage cylinder. Preheated water from the condenser is sent to the domestic hot water cylinder, whichcan also receive an indirect heating contribution from the solar collector. Annual simulations of thesystem are performed. The electrical power output from concentrating parabolic-trough (PTC) andnon-concentrating evacuated-tube (ETC) collectors of the same total array area are compared. A paramet-ric analysis and a life-cycle cost analysis are also performed, and the annual performance of the system isevaluated according to the total electrical power output and cost per unit generating capacity. A best-caseaverage electrical power output of 89 W (total of 776 kW h/year) plus a hot water provision capacityequivalent to �80% of the total demand are demonstrated, for a whole system capital cost of£2700–£3900. Tracking PTCs are found to be very similar in performance to non-tracking ETCs with anaverage power output of 89 W (776 kW h/year) vs. 80 W (701 kW h/year).
� 2014 The Authors. Published by Elsevier Ltd. This is an open access article under the CC BY license(http://creativecommons.org/licenses/by/3.0/).
1. Introduction
1.1. Solar heat and power in the UK
Between a quarter and 30% of the total CO2 emissions in theUnited Kingdom are associated with domestic energy use [1,2].Therefore, meeting the UK target for a reduction in CO2 emissionsof 50% by 2050 is strongly dependent on a significant contributionfrom dwellings, and a meaningful strategy for achieving thistarget should suitably address this sector. Further, in 2010 the
International Energy Agency (IEA) published a roadmap [3] foremissions reduction over the next four decades, detailing theexpected contributions from a range of improvements andtechnological developments. In this roadmap it is predicted thatend-use fuel and energy efficiency will provide the largestproportion of the emissions reduction, contributing 38% of theoverall target, while renewables are expected to provide a further17%. Together, these account for more than half of the overalltarget and are also the areas in which the domestic sector can playa significant role.
The UK has a modest solar resource compared to countries ofsubtropical latitudes. The global horizontal solar irradiationreceived annually in London is typically between 1000 and1100 kW h/m2 [4], equivalent to approximately 120 W/m2 on
C cost, £ (GBP)c specific heat capacity, J/kgc0; c1; c2 solar collector efficiency curve coefficients, –D diameter, mF flow factor (fraction), –f friction factor, –H height, mh specific enthalpy, J/kgI irradiance, W/m2
k thermal conductivity, W/(m K)L pipe length, mM mass, kg_m mass flow-rate, kg/s
N hot water tank node, –n number of elements, –P pressure, bar_Q heat flow-rate, W
Re Reynolds number, –s specific entropy, J/kgT temperature, Kt time, sU overall conductance (U-value), W/(m2 K)_W mechanical or electrical power done, W
X exergy, J_X exergy flow rate, Wb influence coefficient, %g efficiency, %m degree of thermodynamic perfection, %q density, kg/m3
Subscripts0 dead state1 ORC condenser outlet/pump inlet2 ORC pump outlet/evaporator inlet3 ORC evaporator outlet/expander inlet4 ORC expander outlet/condenser inletb beginning of working fluid boiling/evaporation in the
evaporatorc beginning of working fluid condensation in the con-
denseraux auxiliary heater/heatingava availablecoil hot water tank heating coil
comb combined mechanical and electrical conversioncon conductioncond condensationcw condenser cooling waterdem demanddump rejected to hot water tanke electricalevap evaporationex exergy/exergeticexp expanderext external/ambient environmentfl fluid flowg electricity generationhs heat sourcehw hot water supplyhwc hot water tankin inletint internal/indoor environmentL thermal lossesLM log-meanloss exergy destructionmain cold water mainsmax maximumORC organic Rankine cycleout outletp isobaric processph preheatedpin heat exchanger pinchpump pumps isentropic processsc solar collectorshw solar hot-watersol solarsp set-pointsun sunsupp household supply conditionssurf surfacesys systemth thermaltr electricity transmission/distributionuse usedw waterwf ORC working fluidx position denotation
606 J. Freeman et al. / Applied Energy 138 (2015) 605–620
average. The seasonal variability that leads to these average valuesis actually significant. From about April to September solarirradiance stays (over the course of an average day) well above300 W/m2 from approximately 9:00 a.m. to 5:00 p.m., peaking atabout 500 W/m2 at midday. The annually averaged solar irradia-tion is a little over half of that received in parts of southern Europeand North Africa, yet it is sufficient to reduce meaningfully thehousehold demand for heat and power.
In recent years, the uptake of solar photovoltaic (PV) systemsand solar water heating systems has increased dramatically inthe UK, as noted in reports by the EPIA [5] and the Energy SavingTrust [6]. This can be largely attributed to the fall in price ofthese technologies and also the introduction of financial incentivesby the UK government such as Feed-in Tariffs (FITs) and theRenewable Heat Incentive (RHI). In particular, demand (newlyinstalled capacity) for solar PV panels in the UK reached 800 MW
in the first six months of 2013 with 520 MW in the first quarter[7]. Cumulative PV demand now exceeds 2.5 GW, with 93% of thisdemand having being realised in the past two years and 52% beingattributed to the domestic sector [8].
1.2. Organic Rankine cycle systems
The Organic Rankine Cycle (ORC) engine is one of a number oftechnologies being explored as an alternative to PV for the trans-formation of solar radiation into electrical energy. An ORC enginehas the same operating principle as a conventional Rankine cycleequivalent, but uses an organic compound instead of water asthe working fluid. Historically the cycle has been employed forthe conversion of heat from low-to-medium temperature sources(e.g. geothermal, biomass combustion, process waste heat), with
J. Freeman et al. / Applied Energy 138 (2015) 605–620 607
systems being operational, often with little need for maintenance,over 2–3 decades.
In a solar-powered ORC, solar radiation is used to heat andevaporate the working fluid at high pressure, after which thevapour is expanded to generate mechanical shaft work. This shaftwork can be used directly as mechanical work, for example to drivea pump, or via a generator to produce electricity. The versatility ofthe output and the potential to store solar heat (e.g. as hot water)presents a possible advantage over solar-PV for domestic heat andelectricity load profile matching. Furthermore, the potential todevelop high-efficiency, low-cost components suitable for thedomestic scale could see improved competitiveness with PV inthe short-term [2].
The ORC technology is well established worldwide with anumber of commercial systems in operation. Typical sizes rangefrom the order of a few kW to 10 MW (rated electrical poweroutput) for a wide range of working fluids and operatingtemperatures [9]. The majority of these systems incorporateturbines as the expansion device, which tend to operate at highrotational speeds and are best suited to larger scale systems withhigher shaft output powers (>10 kW). Scaling down turbomachinesfor smaller-scale applications presents non-trivial challenges andcan be expensive and complex. Instead, positive-displacementmachines may be used, which can operate at lower rotationalspeeds. For example, rotary screw expanders are used by somecommercial manufacturers with power outputs as low as 30 kW[9]. Other non-commercial systems have used adapted scroll-compressors run in reverse as the expansion device for poweroutputs less than 10 kW [10,11]. Specific examples of operationalsolar-ORC systems include a 1 MWe concentrating solar power(CSP) plant in Arizona, USA, with a collector field area in excessof 10,000 m2 [12]; a 3 kWe rural electrification project in Lesotho,Africa, with a parabolic-trough collector field of area 75 m2 [10];and an experimental 2:5 kWe solar reverse osmosis desalinationsystem in Athens, Greece with a non-concentrating evacuated-tubecollector array of area 88 m2 [11].
The application of ORC technology to domestic solar power iscurrently without precedent in the UK. The limitations of solaravailability and collector array size imply that power outputs willbe lower than those of the solar-ORC systems found in theliterature and mentioned above. This turns the attention towardspositive-displacement expanders instead of turbomachines asprime movers. In particular, reciprocating expanders, with theirsimple and rugged construction, and more advanced state ofdevelopment, can be produced at low cost and with high reliabil-ity; and are able to operate with high efficiency at low poweroutputs, as shown by Zahoransky et al. [13].
The success of any technology aimed at the domestic market isdependent not only on efficiency, but also on affordability andreliability. The ORC components and the solar thermal collectormust be matched to the system so that the highest yield ofmechanical or electrical energy can be achieved for the lowestpossible cost. The choice of an appropriate working fluid has acrucial role to play in maximising the net flow of heat (in fact,exergy) into the cycle, which is equal to the maximum net flowof work that can be extracted (in a reversible cycle). This net heat(and work) can be represented by the area enclosed by the cycle ina T–s diagram (see Fig. 2).
The shape of the saturation curve is a characteristic of theworking fluid and determines the various processes around thethermodynamic cycle. Wet fluids (such as water) with a negativedry saturation curve, or @T=@s < 0, are typically considered lessfavourable for Rankine cycles with low-to-medium temperatureheat sources. During expansion a wet fluid can undergo condensa-tion if the two-phase region is entered, which, depending on theexpander type and design, may result in significantly increased
thermodynamic (exergy) losses or even damage to the expanderin the case of turbomachines. Entering the two-phase region canbe avoided by superheating, although this can lead to a compro-mise on performance, or by selecting a dry or isentropic fluid witha positive or vertical/near-vertical saturation curve.
Increasing the pressure of the working fluid in the evaporator,thereby raising its boiling point, is one way to increase the areaenclosed by the cycle. However, the temperature of the heat source(which in this work is taken as a hot fluid stream returning from asolar collector) imposes a limit on the maximum pressure in thecycle for a given working fluid, just as the temperature of the coldsink places a limit on the minimum pressure. In addition, highpressure ratios demand more heavily designed and engineered(or multiple stages of) compression and expansion components,that can lead to elevated costs. The temperatures and flow-ratesof the heat source stream, the cold sink stream and the workingfluid must all be considered for the best possible match with theoperating pressures in the cycle.
This paper considers the isentropic fluid R245fa, which has beendocumented previously as being well-suited for ORC applicationsdue to its thermodynamic properties, and also its low flammability,corrosiveness and global warming potential [14]. Only subcriticalcycles are considered. Although supercritical ORCs have beenshown by Chen et al. [14] to offer an improved thermal matchbetween the heat source stream and the cycle during evaporation,with reduced irreversibility due to heat transfer across the finitetemperature difference in the evaporator, the requirement forhigher pressures can cause operational difficulties and safetyconcerns as well as increased cost of components. Furthermore,the present paper examines only a basic four-component ORCsystem, although it is acknowledged that variants such as therecuperative cycle can offer efficiency improvements (albeit at acost), and as such will be investigated in future work.
1.3. Considerations for a UK domestic CHP system
The unique aspect to this particular application of solar-ORCtechnology is that it is targeted for the domestic market in ageographical region that receives a relatively low yield of solarirradiation. Therefore the anticipated power output (<1 kW) in thiscase, which is a strong function of the regional solar and weatherdata, is expected to be lower than those of other solar-ORC systemsdiscussed in the literature above. This leads to a unique combina-tion of requirements for the system, notably: (1) low-cost solarcollectors with high solar absorption efficiency under low-leveland diffuse irradiance conditions, designed to deliver the highestpossible outlet temperatures; (2) a small-scale expander (mostlikely a positive-displacement machine) that is able to operatewith high efficiency under full-load and part-load conditions;(3) a suitable working fluid and cycle design that minimiseefficiency losses due to thermodynamic irreversibilities, particu-larly associated with heat transfer processes into and out ofthe cycle.
When matching the ORC to a solar heat source, the maximisa-tion of work output from the cycle is best achieved by using solarheat at the highest available temperature, thus increasing theCarnot efficiency. However, this leads to a trade-off against thesolar collector efficiency, which decreases at elevated collectortemperatures due to increased thermal losses to the environment.Thus, it is expected that there is a compromise temperature atwhich the efficiency of the entire system will be highest, andbeyond which the efficiency will fall due to the increased thermallosses [15–17].
Concentrating solar technologies such as the parabolic-troughcollector (PTC) are designed to reach high (up to 400–500 �C)temperatures. Concentration ratios are typically up to �10. The
608 J. Freeman et al. / Applied Energy 138 (2015) 605–620
small surface area of the absorber relative to the aperture of thetrough means that there are lower heat losses and higher efficien-cies than for non-concentrating collectors. However, in order tofocus the reflected sunlight onto the absorber surface, the incidentbeam must be parallel to the axis of the mirror to be useable. Thishas two implications: (1) the collector can only use direct sunlightand not the diffuse component that is a result of scattering byatmospheric particulates; (2) a concentrating collector’s perfor-mance is markedly improved if it is able to track the position ofthe sun as it moves across the sky rather than remaining stationaryat a fixed orientation and elevation.
Concentrating collectors are therefore more appropriate inlocations that receive a high proportion of direct sunlight. Due tocloudy skies in the UK, approximately 60% of annual globalirradiation received on a horizontal surface is diffuse [4]. This issignificantly higher than for example Palermo, Sicily, which hasan annual average diffuse to global irradiance ratio of 40% [4].Non-concentrating collectors can potentially offer a higher yieldof solar energy in the UK, making use of the large proportion ofdiffuse sunlight, but this is offset by the lower temperatures thancan be achieved compared to concentrating collectors. Thus thechoice of collector type is a trade-off between total yield and qual-ity of the heat source where the deciding factor is the maximumpower from the ORC and the comparative cost.
In addition, and for similar reasons to those above, the temper-ature of the cold reservoir should be minimised, further maximis-ing the cycle efficiency. Heat rejection to ambient air is cheap andsimple, but dependent on weather conditions. Air temperaturestend to be highest when solar irradiance is most abundant, mean-ing a lower potential to reject heat. The condenser therefore needsto be either very large in surface area or fan-assisted to achievehigh air flow-rates, which carries an associated energy require-ment/penalty.
Mains water in the UK is typically available at around 10 �Cthroughout the year, making water-cooling an attractive optionfor heat rejection in a domestic setting. However, there areassociated issues of cost and wastefulness if the cooling water isdischarged without further use. In a combined power andhot-water system, a proportion of this preheated water could beused to top-up a domestic hot water storage cylinder in place ofcold water from the mains, thereby providing some measure ofheat and water recovery. Yet in an unvented system with nointermediate storage capability, this would be reliant on thedemand for electricity and hot water being simultaneous. Thesolar fluid may also be used to heat the hot water cylinder, as itwould in a conventional solar hot-water system. This leads to aninevitable trade-off with electrical output from the ORC, but maybe preferable at times of high hot water demand and lowelectricity demand.
In this paper we develop a technoeconomic model of acombined solar heat and power system (CSHP) using an ORC withR245fa as the working fluid. Simulations are performed to assessthe potential and suitability of such a system for the specific caseof the UK. The system rejects heat to mains water, with the optionof recovery for domestic use when required. Concentrating andnon-concentrating collectors are compared.
2. Technoeconomic model methodology
2.1. Model description
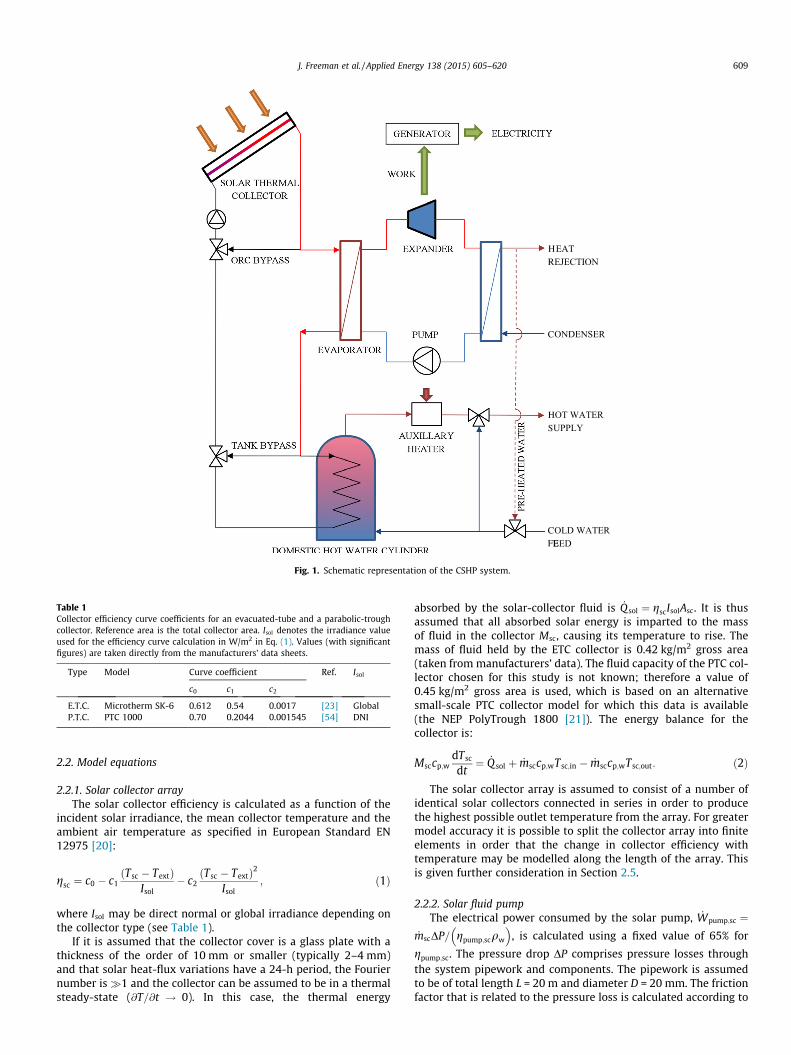
The model developed in order to assess the performance of theUK-based CSHP system (see Fig. 1) was configured to provideresults on a daily basis, which were then used to calculate themonthly and annual outputs of the system. All simulations were
run in MATLAB. The inputs to the model were the solar irradiance,and the hot water and electricity demands for a 24-h period. Theseinputs vary depending on the month of the year, and the electricitydemand also varies depending on whether a particular day is aweekday or a day on the weekend. Hence, to obtain annual resultsthe simulation of the system was performed 24 times (12 months;twice per month: one for a weekday and one for a weekend day),and the values compiled to obtain monthly, and then annual,results.
For an individual 24-h day simulation, finite time elementswere used with a default interval of 1 min such that the 24-hperiod is divided into a set of 1440 inputs and outputs. Thistemporal interval was chosen as it was found to be necessary inproviding a stable numerical scheme during the systemsimulations (see Section 2.5). The ORC cycle analysis wasbased on thermodynamic fluid data for the organic compoundR245fa that was obtained through the NIST Database [18].Lookup tables of the key thermodynamic properties for the fluidwere used.
Three variants were tested for the ORC heat source. These are:(1) a non-concentrating, evacuated-tube collector (ETC) arrayfacing due-south with a fixed inclination angle of 36� from thehorizontal (found to be the optimum angle for the highest annualyield of solar irradiation in the UK [4]); (2) a concentratingparabolic-trough collector (PTC) array, also fixed at the sameorientation and inclination as above; and (3) a concentrating PTCarray assumed to have perfect 2-axis solar tracking such that itsaperture plane is orientated normal to the direction of directsolar irradiance at all times. It should be noted from this pointonwards that the term ‘‘evacuated tube’’ will refer exclusively to thenon-concentrating collector variant (although it is acknowledged thatsome concentrating parabolic-trough collectors also incorporate anevacuated tube as insulation around the absorber pipe).
The solar collector efficiency was calculated from efficiencycurve coefficients, provided as standard by the manufacturers(see Table 1). This is a more simplistic approach than those foundelsewhere (e.g. [10,19]), where optical and thermal efficiencies arecalculated separately, and individual energy balances are solved foreach layer or surface. The only collector geometry informationrequired to perform the model calculations is the total array area.Some evacuated-tube collectors, such as the high efficiencySydney-tube collector modelled in this work, incorporate curvedmirror reflectors (known as compound parabolic concentrators,CPC) behind the tubes to recover some of the irradiance that fallsbetween the individual elements. The mirrors are non-focusingand thus do not require a solar-tracking device and do not affectthe collector’s ability to use diffuse radiation.
Other assumptions applied to the collector array were: (1) forsimplicity the collector fluid was modelled as pressurised liquidwater rather than a water/glycol mixture; (2) solar irradiance thatis not absorbed as heat by the collector fluid is lost to the environ-ment; and (3) the water flow-rate is divided uniformly over theentire collector array (area). The configuration of the solar collectorfluid circuit is an active closed-loop system in which the collectorfluid first enters the ORC evaporator heat exchanger where it iscooled by the working fluid and then flows to the heat exchangerlocated in the hot water cylinder where it is cooled further. Thefluid then returns to the solar collector where it is re-heated tobegin the next cycle. A bypass was included in the circuit to allowthe fluid to recirculate in the collector until its temperature is suf-ficiently high to evaporate the ORC working fluid.
Finally, an auxiliary heater and cold water mixing device areincluded in the CSHP system model to control the final tempera-ture of the hot water delivered for domestic consumption. It isassumed for simplicity in the model that all hot water is requiredat 60 �C.
HR
C
H
S
CFE
Fig. 1. Schematic representation of the CSHP system.
Table 1Collector efficiency curve coefficients for an evacuated-tube and a parabolic-troughcollector. Reference area is the total collector area. Isol denotes the irradiance valueused for the efficiency curve calculation in W/m2 in Eq. (1). Values (with significantfigures) are taken directly from the manufacturers’ data sheets.
J. Freeman et al. / Applied Energy 138 (2015) 605–620 609
2.2. Model equations
2.2.1. Solar collector arrayThe solar collector efficiency is calculated as a function of the
incident solar irradiance, the mean collector temperature and theambient air temperature as specified in European Standard EN12975 [20]:
gsc ¼ c0 � c1Tsc � Textð Þ
Isol� c2
ðTsc � TextÞ2
Isol; ð1Þ
where Isol may be direct normal or global irradiance depending onthe collector type (see Table 1).
If it is assumed that the collector cover is a glass plate with athickness of the order of 10 mm or smaller (typically 2–4 mm)and that solar heat-flux variations have a 24-h period, the Fouriernumber is�1 and the collector can be assumed to be in a thermalsteady-state (@T=@t ! 0). In this case, the thermal energy
absorbed by the solar-collector fluid is _Q sol ¼ gscIsolAsc. It is thusassumed that all absorbed solar energy is imparted to the massof fluid in the collector Msc, causing its temperature to rise. Themass of fluid held by the ETC collector is 0.42 kg/m2 gross area(taken from manufacturers’ data). The fluid capacity of the PTC col-lector chosen for this study is not known; therefore a value of0.45 kg/m2 gross area is used, which is based on an alternativesmall-scale PTC collector model for which this data is available(the NEP PolyTrough 1800 [21]). The energy balance for thecollector is:
Msccp;wdTsc
dt¼ _Q sol þ _msccp;wTsc;in � _msccp;wTsc;out: ð2Þ
The solar collector array is assumed to consist of a number ofidentical solar collectors connected in series in order to producethe highest possible outlet temperature from the array. For greatermodel accuracy it is possible to split the collector array into finiteelements in order that the change in collector efficiency withtemperature may be modelled along the length of the array. Thisis given further consideration in Section 2.5.
2.2.2. Solar fluid pumpThe electrical power consumed by the solar pump, _Wpump;sc ¼
_mscDP= gpump;scqw
� �, is calculated using a fixed value of 65% for
gpump;sc. The pressure drop DP comprises pressure losses throughthe system pipework and components. The pipework is assumedto be of total length L = 20 m and diameter D = 20 mm. The frictionfactor that is related to the pressure loss is calculated according to
610 J. Freeman et al. / Applied Energy 138 (2015) 605–620
correlations based on the Reynolds number given in Incropera et al.[22]:
f ¼ 0:316 Re�1=4; Re < 2� 104; ð3Þ
f ¼ 0:184 Re�1=5; Re P 2� 104; ð4Þ
where DP=L ¼ 8 _m2scf=ðp2 qwD5Þ and Re is based on the pipe
diameter.The pressure loss through the heating coil inside the hot water
cylinder is calculated according to its required length, and alsoassumes a D = 20 mm internal diameter. Finally, it is importantto consider the pressure-drop characteristic of the solar collectorarray – particularly as it is assumed that the collector modulesare connected in series. No pressure drop data is available for thecollector models in Table 1. Therefore, an indicative pressure dropis calculated for the evacuated-tube collector based on empiricaldata for a similar product (the Consolar Tubo 11, also a 6-elementcollector with a U-tube heat exchanger design [23]). The expres-sion used is:
DPsc ¼ Ascð21:77 _m2sc þ 3:54 _mscÞ: ð5Þ
Due to a lack of available information about the geometry andflow characteristics of the parabolic-trough collector, the pressuredrop characteristic in Eq. (5) is used to represent both ETC and PTCcollector arrays.
2.2.3. ORC fluid pumpThe input parameters for the ORC pump calculations are the
working fluid flow-rate, the cycle evaporation and condensationpressures, and the isentropic efficiency of the pump, gpump;ORC ¼h2s � h1ð Þ= h2 � h1ð Þ. Here, h1 and h2 are the specific enthalpies at
the inlet and outlet of the pump respectively (refer to Fig. 2), andh2s is the specific enthalpy following an isentropic pumpingprocess that starts from the same state at the pump inlet (State1) and ends at the same pressure at the pump outlet. State 1 isfixed from the knowledge of the ORC condensation pressure, giventhat the working fluid is a saturated liquid at that point. The rise inenthalpy of the working fluid through the pump is then calculatedfrom the known isentropic efficiency. A fixed value ofgpump;ORC = 65% was chosen, which is within the range of valuesused in similar studies [24–27]. The input power required by thepump is then _Wpump;ORC ¼ _mwf h2 � h1ð Þ=gcomb, with a value of
1 1.2 1.4 1.6 1.8 20
20
40
60
80
100
120
140
160
s [kJ/kg]
T[◦ C
]
21
Ths, x
4
Ths,in
Tcw, outTcw, xTcw, in
Ths,out
Evaporatorpinch
Condenserpinch
3b
c
Fig. 2. Temperature-entropy (T–s) plot of organic Rankine cycle with working fluidR245fa with Pevap = 12 bar, and Pcond = 1.1 bar. Also shown are the heat exchangerpinch points, as well as the heat source fluid stream process (high temperature line)and cold sink fluid stream process (low temperature line) that are external to thecycle. Also, Point ‘b’ marks the beginning of boiling/evaporation and ‘c’ thebeginning of condensation of the working fluid in the two heat exchangers,respectively.
gcomb = 90% taken as the overall (mechanical and electrical)efficiency of the pump and motor [28].
2.2.4. ORC evaporatorThe heat addition process to working fluid in the evaporator is
assumed to be an isobaric process (zero pressure loss), such thatthe pressure at State 3 (working fluid outlet; see Figs. 1 and 2) isequal to that at State 2. A fixed pinch temperature difference ofDTpin = 5 K is assumed between the heat source fluid inlet andthe ORC working fluid outlet (also expander inlet) at State 3, suchthat the working fluid outlet temperature is calculated as:
T3 ¼ Ths;in � DTpin: ð6Þ
Hence, State 3 can be fixed by the knowledge of the (imposed) evap-oration pressure and the temperature at that point, from Eq. (6).
The heating stream flow-rate must be sufficient such that thetemperature difference between solar-collector fluid and ORCworking fluid is not less than the minimum pinch difference atany point along the length of the heat exchanger. It was statedfor Eq. (6) that the minimum pinch occurs at the working fluidoutlet. However, for an isothermal boiling process, a second criticalpinch point can also occur at Point x (in Fig. 2), where the workingfluid begins to boil (State b). At this point, it is ensured that thetemperature difference between the heating stream and the work-ing fluid stream is greater than or equal to the pinch difference,
Ths;x � Tb P DTpin: ð7Þ
From Point x to the working fluid outlet from the evaporator(State 3), the increase in the specific enthalpy of the working fluidstream is:
Dhb�3 ¼ h3 � hb; ð8Þ
so, by using a heat (enthalpy) balance on the two sides of the heatexchanger, the corresponding hot side (source stream) temperatureat Point x is:
Ths;x ¼ Ths;in �_mwfDhb�3
_msccp;w: ð9Þ
A minimum heat source temperature is required for systemoperation, at which the ORC engine may undergo the cycle withoutthe aforementioned pinch limitations in the heat exchangers beingviolated. In the present work the evaporation and condensationpressures, and solar collector and ORC working fluid flow-ratesare set as fixed input parameters to the model. Starting from thetemperature at which the working fluid is a saturated vapour atthe evaporation pressure, Tb, the temperature of the working fluidat the expander inlet T3 (and also the temperature of the solar-collector fluid at the evaporator inlet that is 5 K higher, sinceThs;in ¼ T3 þ 5 K from Eq. (6)) are increased incrementally untilthe condition in Eq. (7) is satisfied. This heat source inlet temper-ature that satisfies the condition is selected as the set-pointtemperature Ths;sp that is then used in Eq. (14) (Section 2.2.7).
2.2.5. ORC expanderThe enthalpy at the exit of the expander (State 4) is calculated
by using a specified isentropic efficiency gexp ¼ h3 � h4ð Þ=h3 � h4sð Þ, and the system electrical power produced by the expan-
der is _We;ORC ¼ gg _mwf h3 � h4ð Þ, where h3 is known (from Section2.2.4) and h4s is the specific enthalpy at the expander exit for anisentropic process, and where a value of 90% is taken for the effi-ciency of the generator gg [29]. For a low power-output system(<1 kW) such as this, positive-displacement expanders may befavoured over turbomachines (as discussed Section 1.2). Thus, forall simulations, an isentropic efficiency of 75% is used which istypical of those reported for small-scale positive-displacement
J. Freeman et al. / Applied Energy 138 (2015) 605–620 611
machines [10,25,30–35]. The pressure at the expander exit is set tobe equal to the saturation pressure at State 1 (see Section 2.2.3).
2.2.6. ORC condenserThe cooling water inlet to the condenser is set to a fixed tem-
perature of 10 �C. It is assumed that the working fluid enters thecondenser as a vapour at State 4 and leaves as a saturated liquidat State 1, which was defined in Section 2.2.3. The flow-rate ofcooling water must be sufficient such that the temperature differ-ence between working fluid and cooling water at all points alongthe heat exchanger does not exceed the pre-defined pinch differ-ence. For the condenser, the critical pinch-point (Point x) is foundto occur at the point at which the working fluid begins to condense,i.e. State c. At this point, the temperature difference between theworking fluid and the water must be greater than or equal to thepinch difference, such that:
Tc � Tcw;x P DTpin: ð10Þ
From Point x to the working fluid outlet of the condenser, thespecific enthalpy drop in the working fluid is as follows:
Dhc�1 ¼ hc � h1; ð11Þ
and the corresponding cold-side temperature at Point x is:
Tcw;x ¼ Tcw;in þ_mwfDhc�1
_mcwcp;w: ð12Þ
The only unknown in Eq. (12) is _mcw.Starting from an initial value, this parameter is adjusted incre-
mentally until the condition in Eq. (10) is satisfied. The minimumvalue that satisfies the condition is then used as the cooling watermass flow-rate to calculate the annual cooling water requirementof the system. The cooling water temperature at the condenseroutlet has been raised above the mains temperature. Some of thisrejected flow may be used as preheated feed water to top-up thehot water cylinder (as indicated by the dashed line in Fig. 1),thereby reducing the energy consumed for domestic hot waterheating. The limit for the amount of preheated water that canresult is determined by the hot water demand, in Eq. (19). It isassumed that any surplus cooling water is discharged to drain.
2.2.7. On/off switching and bypassesThe model uses a series of logic statements to determine
whether certain parts of the system are on or off. In the solarcollector circuit, a (fixed) flow of fluid through the collector _msc
is set (by switching on the pump to its predetermined designpoint) only when there is availability of solar irradiance Isol > 0,such that the pump does not operate at night without benefit:
_msc ¼0 if Isol ¼ 0;
_msc otherwise:
�ð13Þ
In the ORC working fluid circuit, a (fixed) flow through theevaporator _mwf is set (by switching on the pump to its predeter-mined design point), thus allowing the ORC engine to operate, onlywhen the temperature of the solar collector fluid at the collector’soutlet Tsc;out reaches the evaporator heat source temperatureset-point Ths;sp, as calculated from Eq. (9):
_mwf ¼0 if Tsc;out < Ths;sp;
_mwf otherwise:
�ð14Þ
When the working fluid flow-rate is zero, the solar heat trans-ferred to the ORC is also zero. In this case, the solar collector fluidis returned to the collector for further heating. This bypassing con-tinues to occur until Tsc;out P Ths;sp and the ORC engine is triggeredto run.
2.2.8. Domestic hot water storage cylinderThe hot water storage cylinder is assumed to consist of three
fully mixed equal-volume segments which divide the cylinderalong its vertical axis. Each segment is represented by a node N,where N ¼ 1 is the bottom segment and N ¼ 3 is the top one. Aheat exchanger coil, through which solar collector fluid is passed,is located in the bottom segment (N ¼ 1).
The cylinder equations are based on those for the MultiportStore model developed for TRNSYS [36]. A further model input isthe cylinder coil flow-factor, Fcoil, which defines the proportion ofthe solar collector return flow (0–100%, fixed) that is divertedthrough the cylinder’s heat exchanger coil. By default the solarcollector fluid leaving the ORC evaporator is sent back to thecollector to be heated again. If some of this fluid is instead divertedto the heat exchanger in the hot water cylinder there will be areduction in the fuel demand to heat the water conventionally.However this will also decrease the collector return temperature,eventually reducing the heat available as input to the ORC whenthe fluid next passes around the system.
The system is set to prioritise electricity generation over waterheating, therefore when the ORC engine is bypassed the hot watercylinder is also bypassed in order for the collector fluid to come upto temperature as quickly as possible. When Tsc;out P Ths;sp the ORCengine is switched on but collector fluid leaving the ORC evapora-tor will be sent to the hot water cylinder heating coil only if it is ata higher temperature than the hot water cylinder plus a pinchdifference. No heating is delivered to the hot water cylinder if itsmean temperature is above the maximum hot water storagetemperature of 80 �C. This strategy can be summarised as:
_mcoil ¼
Fcoil _msc if _mwf > 0andThs;out P ThwcðN¼1Þ þ DTpin
and ThwcðN¼3Þ < 80 �C;0 otherwise:
8>>>>>><>>>>>>:
ð15Þ
The energy balance for the hot water cylinder is as follows:
The amount of heat transferred in the coil from the solar fluid tothe hot water cylinder is calculated from:
_Q shw;N ¼_mcoilcp;w Tcoil;in � Tcoil;out
� �if N ¼ 1;
0 otherwise;
(ð17Þ
where the collector fluid leaving the coil is at the temperature:
Tcoil;out ¼ ThwcðN¼1Þ þ DTpin: ð18Þ
The hot water demand profile is constructed from hourly UKdata published in a study by the Energy Saving Trust [37], whichhas been converted from a volumetric to a mass flow-rate, _mhw,in kg/s. Hot water extraction for domestic consumption results ina thermal energy exchange between the nodes of the hot water cyl-inder, as cold water is fed in at the bottom to replace the water thatis drawn-off from the top:
_Q fl;N ¼_mhwcp;w Ttop�up � Thwc;N
� �if N ¼ 1;
_mhwcp;w Thwc;N�1 � Thwc;N� �
otherwise:
(ð19Þ
The temperature of the water that re-supplies the cylinder iseither at the water mains temperature (set to Tmain = 10 �C), or ata higher temperature as a result of utilising preheated coolingwater leaving the ORC condenser. In order to ensure that theflow-rate of preheated cooling water from the condenser that is
612 J. Freeman et al. / Applied Energy 138 (2015) 605–620
then used to re-supply the hot water cylinder is maximised withinthe limit imposed by the instantaneous household demand for hotwater, the following strategy is applied at each time-step:
T top�up ¼FphTcw;out þ 1� Fph
� �Tmain if _mwf > 0;
Tmain otherwise;
(ð20Þ
where Fph ¼ _mcw= _mhw is the ratio of the condenser cooling-waterflow-rate to the flow-rate of domestic hot water extracted fromthe hot water cylinder.
The heat flux due to conduction between the layers of the storeis calculated from:
_Q con;N ¼kwpD2
hwc
4Hhwc;NThwc;Nþ1 þ Thwc;N�1 � 2Thwc;N� �
; ð21Þ
while the thermal loss through the wall of the cylinder to theambient internal environment is:
_Q L;N ¼ UhwcAsurf;hwc;N Thwc;N � T int� �
; ð22Þ
where the indoor environmental temperature surrounding thecylinder T int is assumed constant at 20 �C.
An upper temperature limit Twf;max of 500 K (227 �C) is imposedfor the ORC operation, since this is the maximum temperature forwhich thermodynamic properties for the R245fa working fluid areavailable from the online NIST database [18]. Above this tempera-ture, excess solar heat is rejected directly to the hot water cylinder,bypassing the ORC:
_Q dump;N¼_msccp;w Tsc;out�Twf;max�DTpin
� �if Tsc;out>Twf;maxþDTpin
and N¼1;
0 otherwise:
8><>:
ð23Þ
It is noted that the actual ORC working fluid temperatures attainedin the annual simulations are far lower than this limit and that thedegree of superheating is small for the average day conditions, asdemonstrated in Fig. 2. The maximum temperatures reached inthe cycle during the summer months in the annual simulationsare not higher than 150–160 �C.
2.2.9. Electricity generation and demandTo assess the likely proportion of electricity demand covered by
the CSHP system, electricity demand profiles were generated foreach month using a model of domestic electricity use developedby the Centre for Renewable Energy Systems Technology (CREST)[38]. The CREST model generates electricity usage profiles forhouseholds based on active occupancy patterns, human activityprofiles and typical appliance energy consumption data. Theoccupant behaviour is modified based on the month, the numberof occupants, and the selection of a weekend or week day.
The auxiliary electricity consumption was calculated as theproportion of the electricity demand not met by the CSHP system.It is assumed that this proportion of the demand is met by buyingthe electricity from the grid:
_We;aux ¼_We;dem � _We;ORC if _We;dem P _We;ORC;
0 otherwise:
(ð24Þ
When electricity produced by the solar-ORC system exceeds thedemand, the surplus quantity is not necessarily disregarded as thiscan be sold back to the grid to generate income for the CSHP systemowner. However, this revenue is not currently included in theannual savings calculation.
2.2.10. Auxiliary heating and hot water demandFor the sake of simplicity, it is assumed that all auxiliary
hot-water heating takes place downstream of the hot watercylinder. The demand for auxiliary water heating is then the energyrequired to bring the water from the cylinder temperature to therequired supply temperature, which is Tsupp = 60 �C,
_Qhw�aux ¼ _mhwcp;w Tsupp � Thwc� �
: ð25Þ
2.3. Exergy analysis
2.3.1. Whole system exergy analysisThe equations in this section are relevant for the whole system
exergy analysis, results from which are presented in Section 3.5. Inthis analysis, the exergy destroyed in each component of the CSHPsystem is tracked in order to identify the components which havethe greatest capacity to limit the system’s efficiency. Exergy is theupper limit for the convertible work in cooling a stream of fluiddown to a ‘dead state’ while extracting work reversibly:
_Xfl ¼ _mfl hfl � h0ð Þ � T0 sfl � s0ð Þ½ �; ð26Þ
where T0 is the dead state temperature, taken here to be either thatof the cooling medium Tcw or of the ambient air Text, depending onwhich is lowest.
In the present work a number of definitions are used whichfollow the exergy topological method as used by Mago et al. [39]in a study of a non-regenerative ORC system. The rate of exergydestroyed in each component _Xloss is equal to the total exergyflowing into the component _Xin minus the total exergy flowingout _Xout. Available exergy _Xava is the amount of exergy removedfrom the exergy source, which may be a fluid stream (in the caseof a heat exchanger), radiation source (in the case of the solarcollector) or prime-mover (in the case of a pump or compressor).Used exergy _Xuse is the amount of available exergy that is deliveredas a useful output by the component. For an expander this will beshaft work whereas for a heat exchanger this will be the exergyincrease experienced by the cold stream. The exergy efficiency isthen defined as gex ¼ _Xuse= _Xava. Additional indicators of interestare: (1) the degree of thermodynamic perfection m ¼ _Xout= _Xin;and (2) the influence coefficient b ¼ _Xava= _Xava;sys, which representthe proportion of exergy that is not destroyed and the fraction ofthe available exergy of the entire system that is associated with aparticular component, respectively.
For a solar collector, the exergy flow associated with the solarirradiance incident on its surface represents the maximum portionof the radiation energy that can be converted to useful work, and isgiven by [16]:
_Xsol ¼ 1� T0
Tsun
� �Isol; ð27Þ
where Tsun 0:75Tsun is the equivalent temperature of the sun as anexergy source, and Tsun ¼ 5778 K is the sun’s effective black-bodytemperature.
2.3.2. Solar collector maximum power analysisThe equations in this section are relevant for the solar collector
maximum power analysis, results from which are given in Section3.1. Beyond accounting for the useful work lost in the various com-ponents of the whole CSHP system, exergy analysis may also beused to evaluate the theoretical maximum power that could bedelivered by a solar collector operating at its optimum tempera-ture for a given set of climatic conditions. This approach providesa useful basis for the control of collector operation through theadjustment of the mass flow-rate, and is the subject of numerousstudies in the literature including [17,40,41]. It also enables the
J. Freeman et al. / Applied Energy 138 (2015) 605–620 613
comparison of a range of collector designs and will be used here tocompare the maximum power deliverable under UK climate condi-tions from the concentrating and non-concentrating collectorspresented in Table 1. In order to evaluate the maximum exergyflow from each solar collector, an ideal situation is considered inwhich the pressure loss through the collector is neglected andthe fluid (assumed to be pressurised water) is returned to the solarcollector inlet at the temperature of the heat rejection mediumwhich is also the dead state/environment temperature, such thatTsc;in ¼ T0. For this case, Eq. (26) can be expressed as:
_Xsc;out ¼ gscIsolAsc � _msccp;wT0 lnTsc;out
T0; ð28Þ
where gsc is calculated according to Eq. (1) as a function of Isol andTsc ¼ Tsc;avg ¼ ðT0 þ Tsc;outÞ=2. Furthermore, because Tsc;out is variedby adjusting the mass flow rate through the collector _msc, it ispossible to eliminate the latter of these two variables, so thatEq. (28) becomes:
_Xsc;out ¼ gscIsolAsc 1� Tsc;out
T0� 1
� ��1
lnTsc;out
T0
" #: ð29Þ
Table 2Solar system costs.
Item Cost
Parabolic-trough collectora £155/m2
Evacuated-tube collector £78/m2
Hot water cylinder (150 L volume) £1150Ancillary items (pump, expansion vessel, valves and pipework) £600Solar thermal system installation cost £800
a The costs associated with solar-tracking for one of the PTC cases considered,were not included in this study.
2.4. Cost evaluation
The capital cost of the CSHP system was estimated by summingthe component costs described in the sub-sections below. In thiswork the economic evaluation of the system was performed inthe absence of any financial incentives, such as the FIT.
2.4.1. ORC evaporator and condenserThe four main components of the ORC system, i.e. the pump,
expander and two heat exchangers (evaporator and condenser),represent a significant proportion of the cost of the overall system.Approximate estimates of the fraction of the overall installationcosts of ORC systems, when these are used in waste heat recoveryapplications, indicate that these four components account forapproximately 50–70% of the overall installed system cost[42,43]. In the present work, an estimate of the system cost is madeby adding the individual costs of these four main components.
For heat exchangers, the main factors that influence cost are thechoice of fluids and the rate of heat transfer per unit log-mean tem-perature difference, _Q=DTLM. This forms the basis of the C-valuemethod for approximate costing of heat exchangers described inHewitt et al. [44]. Although tables of C-values for heat exchangersare widely available, the range of costs and duties in these chartswere found to be too high to be applicable to the small-scalesystem considered here. Instead, market prices were obtained fora range of small brazed-plate heat exchangers. The heat exchang-ers were selected for the appropriate fluids under considerationand for a range of duties, flow-rates and temperature differences.The data obtained was correlated to find an approximate relation-ship between cost in £ (GBP), and heat transfer per unit log-meantemperature difference _Q=DTLM in W/K. In the model the cost curveis interpolated to return approximate costs for the evaporator andcondenser based on the calculated _Q=DTLM values.
2.4.2. ORC pump and expanderAs highlighted in Section 1.2, the small-scale application may
favour the use of positive-displacement expanders. Recent studieshave noted that such expanders are not widely available at presentas off-the-shelf items specifically for use in power generation[10,45]. Instead, equivalent data for a range of positive-displace-ment compressors (including piston, scroll, screw and rotary vane)was obtained. Compressor cost was tabulated as a function of vol-umetric flow rate and pressure ratio. A three-dimensional interpo-
lation was then used to return an individual cost from this datausing the system parameters in the MATLAB model. A similarapproach was followed for the costing of the working fluid pump.Data was obtained for pumps at a range of flow duties andpressures; in particular vane pumps and diaphragm pumps, whichare capable of delivering high pressures at low flow duties, wereexamined.
2.4.3. ORC ancillary itemsAs stated above, the pump, expander, evaporator and condenser
form the base equipment cost. Further to these, additional ancillaryORC component costs were calculated as a percentage of thepurchased equipment cost based on the cost factors in Lukawski[43]. These were piping (9%), installation (6%), instrumentation/controls (5%) and electrical equipment (4%).
2.4.4. Solar system costsApproximate market prices for the solar system components
were obtained from a brief market survey of packaged solarsystems and are listed in Table 2. These are typically the marketvalue prices for a single item, so in order to estimate the wholesalecost of components for mass-production of the system, the marketprices were reduced by an approximate retail factor of 20%.
The aim of the costing exercise was to consider the electricityand hot water generating functions of the system separately, sothat a total installed cost can be split into costs associated withelectricity generation and costs associated with hot waterprovision. The reason for this will become evident in the costanalysis in Section 3.4 and the further discussion in Section 4 inwhich the installed cost of the system is compared with that of aPV-thermal hybrid (PVT) system (producing electricity and hotwater), and a PV-only system (producing electricity but no hotwater). Therefore the costs in Table 2 were divided between thepower generation and hot water sub-systems. For the powergeneration sub-system, the full cost of the solar collector arraywas assigned as part of the initial investment. The hot watercylinder was not included as it is not an integral part of the powergenerating sub-system and was instead assigned to the hot watersub-system capital cost. The ancillary plumbing item costs andthe solar thermal system installation cost were assigned as an evensplit between the electricity and hot water generating systems.
2.5. Model validation
2.5.1. Numerical model methodologyA numerical time-marching (TM) method was used to solve Eqs.
(1)–(25) in Section 2.2 and to obtain the response of the overallCSHP system. For the purposes of model validation, the solutionfrom this method was compared to a quasi-steady (QS) equivalentsolution, which neglects the thermal inertia of the collector but notof the hot water cylinder that continues to obey the modeldescribed in Section 2.2.8. For simplicity, the ORC engine is omittedfrom the system model for this analysis and all of the fluid leavingthe collector is passed through the hot water cylinder heating coil.
614 J. Freeman et al. / Applied Energy 138 (2015) 605–620
Under the TM method, the solar collector fluid temperature exitingthe hot water cylinder heating coil at time instant i; Tcoil;outðiÞ,becomes the entering temperature into the collector at the nexttime instant iþ 1; Tsc;inðiþ 1Þ. The QS method involves solvingthe heat fluxes and temperatures in all loops and components suchthat the whole system remains in steady-state at each time instant.This method effectively assumes that changes in the external/boundary conditions influencing the system are slow in compari-son to the internal dynamics of the system itself. The steady-statesolution then varies with time as it responds to the time-varyingexternal/boundary conditions imposed on the system. It isexpected that the QS solution should closely approximate the TMsolution, providing that the time-step interval over which the TMcalculations are performed is suitably small and the above QSassumption is valid. The TM and QS model results are comparedin Fig. 3. The two models show excellent agreement for thepredicted temperatures in the system.
As a further test, the following model parameters wereadjusted: (1) the length of the time-step Dt; and (2) the numberof discrete spatial elements nsc into which the collector array issplit (equivalent to splitting the array into a number of individualcollector modules connected in series), while keeping the totalcollector area constant. In fact, the two parameters are closelylinked within the set-up of the model. As the number of elements(i.e. collector modules) nsc that make up the array is increased, themass associated with each element decreases and therefore thetime-step length Dt required to avoid calculation instability alsodecreases. For this reason, the time-step and number of collectorelements are varied proportionally, as can be seen in Fig. 4 wherethe results are shown. Based on a total available area of 15 m2 anda 1.2 m2 area for the Microtherm SK-6 ETC collector, the maximumnumber of in-series collector modules is 12. When the array reso-lution is increased beyond 9 elements, it is found that there is verylittle change in the system temperatures predicted by the model.For the single-element array there is a slight under-prediction ofthe solar collector temperature compared to the higher resolutionarrays. The average difference in collector temperature betweenthe single-element and the 9-element model is 2.7 �C. This is equal
0 2 4 6 8 10 12 14 16 18 20 22 240
20
40
60
80
100
120
Time [hour]
Tem
pera
ture
[◦ C] TM
QSABC
Fig. 3. Collector array inlet temperature Tsc;in (‘‘A’’ in the figure), outlet temperatureTsc;out (‘‘B’’), and hot water cylinder temperature Thwc (‘‘C’’). Compared forsimulations using time-marching (TM) and quasi-steady (QS) approaches. ETCcollector used with ‘‘annual average day’’ climatic conditions (see Section 3.2).Time-step interval Dt = 60 s.
0 2 4 6 8 10 12 14 16 18 20 22 240
20
40
60
80
100
120
Time [hour]
Tem
pera
ture
[◦ C]
n sc = 1; ∆ t = 180 sn sc = 3; ∆ t = 60 sn sc = 9; ∆ t = 20 s
BC
A
Fig. 4. Collector array inlet (‘‘A’’), outlet (‘‘B’’) and hot water cylinder (‘‘C’’)temperatures for model variants with increasing resolution of collector array finiteelements nsc and decreasing size of time-step interval Dt. Collector mass flow-rate_msc = 0.03 kg/s.
to 2.6% of the amplitude of the daily collector temperature varia-tion, which is deemed to be an acceptable error margin. Therefore,due to the significant reduction in calculation time, the single-element model was chosen for the annual CSHP system simula-tions presented in this paper.
Finally, a further detail that must be considered is the effect ofincreasing the solar collector flow-rate on the calculation stability.It is generally observed that the calculation becomes unstablewhen _mscDt P Msc. For the single-element collector array model,a time-step interval of 60 s is found to be effective at providing astable calculation output for _msc 6 0:1 kg/s. However, at higherflow-rates the calculations become unstable and therefore thetime-step interval is decreased as necessary to maintain stability.
3. Results and discussion
This section is divided into five parts. First, a concentrating andnon-concentrating solar collector are compared by way of a maxi-mum power analysis. Next, a daily performance profile of the CSHPsystem is examined, and this is followed by a manual sensitivityanalysis that was performed to optimise the key performanceparameters of the system. An annual simulation is then undertakento determine: (1) the annual electrical power output that can beachieved from the system for a fixed 15 m2 area of collector array;(2) the cost per unit generating capacity; (3) the additional thermaloutput achievable and percentage of water-heating demand thatcan be met; (4) the system running costs, discounted payback timeand levelised cost of electricity. Finally an examination of theexergy destruction in each of the system components is performedusing the results from the annual simulation.
3.1. Choice of solar collector
In this section, maximum power output from the solar collectorcalculated in Eq. (29) is evaluated across a range of collector outlettemperatures. Fig. 5a shows a comparison of the maximum poweravailable per unit area from the PTC and ETC collectors understeady-state direct normal irradiance (DNI) equal to 500 W/m2.In essence this figure, together with Fig. 5b, describes the compro-mise between the two terms on the RHS of Eq. (28). At high massflow-rates the temperature rise of the fluid flow through thecollector is low, leading to low collector temperatures and thushigh collector efficiencies (described by the first term). Neverthe-less, the high mass flow-rate also causes high losses due toirreversible heat transfer (described by the second term). At theother extreme, low flow-rates lead to high temperatures and lowcollector efficiencies, but also reduced losses due to heat transfer,such that an optimum can be identified at some intermediateflow-rate and temperature. The PTC collector has a maximum exer-gy output of 96 W/m2, available at an outlet temperature of 394 �C;whereas the ETC collector has a maximum exergy output of
0 100 200 300 400 5000
50
100
150PTCETC
0 50 100 150 2000
50
100
150
200ETC (f)PTC (t)PTC (f)
Fig. 5. (a) Maximum power per m2 solar collector area as a function of collectortemperature (which is related to the mass flow-rate through the collector) forincident irradiance 500 W/m2 (100% DNI component) and T0 ¼ 10 �C. (b) Maximumpower for a 15 m2 collector array, under annual average irradiance conditions fortracking (t) and fixed (f) collectors.
J. Freeman et al. / Applied Energy 138 (2015) 605–620 615
63 W/m2, available at an outlet temperature of 284 �C. Thisillustrates that when a moderate amount of direct irradiance isavailable, the PTC collector has a higher potential to generatepower. In Fig. 5b the maximum power output is calculated for acollector array of total area 15 m2 (considered a representativeaverage value for UK homes [46]) and for a London ‘‘annual-aver-age’’ irradiance condition; with the PTC and ETC ability to use dif-fuse irradiance taken into account. It is assumed that the ETC arraycan use the entire (global) incident radiation (considered here for afixed plane tilted at 36� to the horizontal) whereas the PTC arraycan use only the direct-normal component (considered here for aperfect 2-axis tracking system). The maximum power output forthe PTC and ETC collector arrays are 127 W and 104 W respec-tively. When compared to Fig. 5a it can be observed that, whenthe differences in useable irradiance are taken into account, thecollectors are more closely matched with respect to their idealmaximum power outputs. The optimum outlet temperatures cor-responding to maximum power for the PTC and ETC collectorsare 159 �C and 104 �C respectively. For comparison, the maximumpower output is also shown for a PTC collector at a fixed orienta-tion and tilt angle (due South and 36� respectively), revealing aconsiderably lower power than both the PTC (tracking) and ETC(fixed) arrays. A further case may be considered in which the avail-able solar irradiance consists entirely of the diffuse component, inwhich case the PTC output will be close to zero, while the ETC col-lector will retain a potential to generate power.
Finally, it is possible to consider a case where the maximumexergy output from each collector is achieved for the annual rangeof climatic conditions, by allowing the collector flow-rate to vary inorder to track the optimum outlet temperature at all times. Byintegrating the maximum power over the entire year, the
Fig. 6. Daily collector outlet temperature and cumulative ORC work output profilesfrom the CSHP system with: (a) PTC solar-tracking array, and (b) fixed ETC array.Simulated for the ‘‘annual average’’ day. System parameters set in order to achievemaximum daily work output from the ORC engine for each collector type:_msc = 0.12 kg/s (PTC) and 0.13 kg/s (ETC); _mwf = 0.015 kg/s (PTC) and 0.010 kg/s
(ETC); Pevap = 16 bar (PTC) and 12 bar (ETC); Tcond = 17 �C; Fcoil = 0. (c) Influence ofthe hot water cylinder on the system temperatures and work output for the CSHPwith ETC collector array, with Fcoil = 1, and all other parameters as above.
maximum annual work output is calculated, and from this atime-averaged maximum power can be found. This is found to bequite different from the maximum power at the ‘‘annual-average’’climatic condition, due to non-linearity in the relationshipbetween solar irradiance and collector efficiency. The maximumwork is found to be 1685 kW h/year (192 W, average) for the ETCcollector and 1707 kW h/year (195 W, average) for the PTC(tracking) collector, revealing a very closely matched ideal perfor-mance between the two collectors when considered over theannual period.
3.2. Performance of CSHP system throughout the day
Fig. 6 shows the electrical power output profiles for the CSHPsystem over the course of a day, for the case in which electricityproduction from the system is prioritised and solar fluid flowthrough the hot water cylinder heating coil is set to zero. Theclimate data used is that for an ‘‘annual average’’ day, which is a24-h profile made up of annually averaged values for each hourof the day.1 In this figure, the CSHP system featuring a PTC solar-tracking array (Fig. 6a) is compared to the system featuring a fixedETC collector array (Fig. 6b). The ORC evaporation pressure and sys-tem flow-rates are chosen to be equal to those that maximise thetotal daily work output for each collector variant (taken from Section3.4), while obeying the full set of relations stated in Section 2.2.
The PTC system operates at a higher temperature than the ETCsystem and with a higher evaporation pressure in the ORC.Although this results in a higher instantaneous power production,the operation of the PTC system is more intermittent because thegreater decrease in the solar collector fluid enthalpy throughthe ORC evaporator (with its associated increased heat input tothe cycle) cannot be sustained by the collector at the temperaturerequired. Thus for short periods the collector fluid must recirculatewithin the solar array, bypassing the ORC, while it recovers to therequired temperature, before being sent back to the ORC evapora-tor. The ETC system also displays intermittent operation for a largepart of the day, but is able to sustain longer periods of continuousoperation during the peak solar hours. With its tracking capabilitythe PTC system is also shown to operate across a slightly longer por-tion of the day due to its ability to collect irradiance when the sun islow on the horizon. However over the course of the day, the totalaccumulated work output for the two systems is almost identical.
In Fig. 6c the effect of providing heating to the hot water cylin-der is considered for the ETC system. In the case being demon-strated here, 100% of the solar fluid flow is passed through thecylinder heating coil, downstream of the ORC evaporator, beforebeing returned to the collector (see Fig. 1). This results in a furtherdecrease in the enthalpy of the solar fluid stream before it isreturned to the collector inlet, which in turn gives rise to the inter-mittency of ORC operation being more exaggerated than in Fig. 6b.The cumulative work output from the ORC is reduced considerablywhile the cylinder is being heated (i.e. until�12:30 p.m.). From thetime instant when the upper temperature limit for hot water stor-age in the cylinder (80 �C) is reached, the work output from theORC engine increases again. Nevertheless, the early penalty inwork generation means that the total cumulative work output overthe course of the day is lower than in Fig. 6b.
3.3. Parametric analysis
A parametric analysis was undertaken to examine the influenceof the following variables on the electrical output from the system:
1 A brief analysis of daily noon-time irradiance values for London over a whole year(Ref. [47]) shows that the mean irradiance is 361 W/m2 with a standard deviation of249 W/m2.
616 J. Freeman et al. / Applied Energy 138 (2015) 605–620
(1) cycle evaporation pressure, Pevap; (2) solar collector fluidflow-rate, _msc; (3) ORC working fluid flow-rate, _mwf ; (4) cyclecondensation temperature, Tcond; and (5) fraction of solar fluid flowpassed through the hot water cylinder heating coil, Fcoil. Simula-tions were performed for the ‘‘annual average’’ day and for thePTC and ETC solar collector array variants of the system model.In each simulation run, a single parameter was adjusted whilethe others were held constant.
The objective is to identify important system parameters and tounderstand their role in affecting the performance of the system,with a view towards maximising the total work output anddetermining the ‘‘maximum power’’ settings for the annualaverage condition. It follows therefore that the diverted fractionof solar collector fluid flow sent to the hot water cylinder Fcoil
was initially set to zero, thus prioritising power generation. Thecycle condensation temperature was initially set to the lowestpractically achievable value of 17 �C (allowing for 10 �C coolingwater temperature, with a 5 K condenser pinch and a 2 K temper-ature glide between cooling water inlet and the pinch-point).Under these conditions, the PTC system (with solar tracking) wasfound to produce a maximum power output of 82:6 We;avg at anoptimum working fluid evaporation pressure of 16 bar; while theETC system was found to produce a maximum power output of80:1 We;avg at an optimum evaporation pressure of 12 bar. Thedifference in maximum power output between the PTC and ETC
0 5 10 15 20 25 300
20
40
60
80
Pevap [bar]
W[W
]
ETC (f)PTC (t)PTC (f)Wpump,ORC
(a) ORC evaporation pressure.
0.01 0.02 0.03 0.04 0.050
20
40
60
80
m wf [kg/s]
W[W
]
ETC (f)PTC (t)PTC (f)Wpump,ORC
(c) ORC working fluid mass flow rate. (t
15 20 25 30 350
20
40
60
80
Tcond [◦C]
W[W
]
ETC (f)PTC (t)PTC (f)
(e) ORC condensation temperature.
e,av
ge,
avg
e,av
g
Fig. 7. Parametric analysis of ORC electrical power output for ‘‘annual-average’’ day climaparameters set to maximum power settings as established in Section 3.3 unless otherw
collector array variants is only 3.1%. Detailed results from thisanalysis are shown in Fig. 7 and discussed below.
The evaporation pressure is strongly linked to the minimumheat source temperature required to operate the ORC engine, asshown in Fig. 7a and d. The optimum collector fluid outlet temper-atures found for the PTC and ETC systems are 121 �C and 106 �C,respectively. The simulation results in Fig. 7d can be comparedwith the collector maximum power curves in Fig. 5b, noting thatthe optimum heat source temperature for the ETC system is veryclose to the optimum temperature identified for maximum powerfrom the ETC collector (104 �C). For the PTC (tracking) system theoptimum heat source temperature is considerably lower than theoptimum collector outlet temperature identified in the maximumpower analysis (160 �C). This may be in part due to the limitationsimposed by the choice of the working fluid R245fa, whose criticaltemperature is 154 �C.
The work output is observed to plateau at solar collector massflow-rates above 0.1 kg/s (see Fig. 7b) and ORC working fluid massflow-rates above 0.01 kg/s (see Fig. 7c). The ratio of mass flow-rates in the two circuits influences the degree of superheatingrequired to operate the ORC without violating the minimumpinch-point temperature difference in the heat exchanger. Theoptimal ratio of solar collector fluid mass flow-rate to ORC workingfluid mass flow-rate is found to be between 8:1 and 13:1, with aminimum superheating requirement of between 8 and 9 K.
0 0.05 0.1 0.15 0.20
20
40
60
80
m sc [kg/s]
W[W
]
ETC (f)PTC (t)PTC (f)Wpump,sc
(b) Solar collector fluid mass flow rate.
40 60 80 100 120 140 1600
20
40
60
80
Ths,sp [◦C]
W[W
]
ETC (f)PTC (t)PTC (f)
d) Heat source ORC switch-on tempera-ure (a function of evaporation pressure).
0 0.2 0.4 0.6 0.8 10
20
40
60
80
Fcoil [-]
We,
avg
[W]
ETC (f)PTC (t)PTC (f)
(f) Hot water cylinder coil flow factor.
e,av
ge,
avg
tic conditions. Individual system operating parameters varied as indicated, all otherise stated.
J. Freeman et al. / Applied Energy 138 (2015) 605–620 617
It is noted that for the ETC chosen, the manufacturer’s maxi-mum recommended flow rate is 0.13 kg/s, while Fig. 7b suggeststhat beyond 0.09 kg/s, the power consumption for the solar pumpwill exceed that produced by the system. It should be recalled thatthe solar-collector array theoretically consists of modules con-nected in series and therefore pressure drop is significant at highflow-rates, leading to a large power consumption by the pump.Therefore, the solar collector flow-rate has a more significant influ-ence on the power consumption of the system than the workingfluid flow-rate and evaporation pressure (which affect the ORCpump power consumption, see Fig. 7a and b) over the simulatedoperational range. The highest net power output (65–70 We;avg
for both the PTC system and the ETC system) is found to occur ata solar collector flow-rate of 0.03 kg/s.
Fig. 7e indicates that allowing the ORC working fluid condensa-tion temperature Tcond to increase from 17 �C to 35 �C results in adecrease in electrical power output of 19% for the ETC systemand 17% for the solar tracking PTC system. However, allowing thecondensation temperature to rise also results in a lower demandfor cooling water. For the ETC system the water demand decreasesdramatically from 2.98 m3/day at Tcond = 17 �C, to 0.27 m3/day atTcond = 35 �C. As a result, the economic benefit associated withthe water savings (approximately £1100 annually at present UKwater rates) far outweighs the penalty in terms of grid electricitysavings. These results indicate that the exergetic benefit of mainswater as the ORC heat rejection medium compared to air at ambi-ent temperatures may be economically realistic only if the waterquantity is available at little or no extra cost (possibly by beingshared with another domestic or industrial process).
Fig. 7f illustrates the reduction in electrical output as a result ofusing a fraction of the solar collector fluid to heat a domestic hotwater cylinder down-stream of the ORC evaporator. For the ETCsystem, if 100% of the fluid flow is passed through the heating coil(Fcoil = 1) the electrical output drops by 60% relative to the Fcoil = 0case. However, the system is then shown to provide water heatingequivalent to 70–90% of the daily demand, depending on thewhether the cylinder is designed for stratified or non-stratifiedcharging (note that the system only provides water heating whenthe ORC is running). Projected over an annual period, this equatesapproximately to a 60 £/year reduced saving on electricity bills(and a corresponding 150 kgCO2(e)2 reduction on emissions saving)but a 120 £/year increased saving on gas bills (and 390 kgCO2(e)3
increase on emissions saving). It is also observed for the ETC systemthat values of Fcoil greater than 0.4 produce very little furtherdecrease in electrical output from the ORC. This is because for valuesof Fcoil higher than this the maximum temperature for hot waterstorage (80 �C) in the cylinder is reached and the cylinder is thenbypassed to avoid over-heating of the hot-water store.
The total daily volume of hot-water drawn from the cylinder fordomestic use is 122 L/day [37]. The total volume of mainswater used for cooling in the ORC condenser (ETC system) is2975 L/day and this water leaves the condenser at a temperatureof 14.1 �C. Some of this preheated water is used to top-up thehot water cylinder, but this is only permitted in the investigatedconfiguration when there is a simultaneous draw-off of water fromthe cylinder. Over the course of the day the total volume of pre-heated water delivered to the cylinder is 23.6 L which is 19% ofthe total demand volume and <1% of the volume rejected fromthe condenser. If it were possible to preheat the entire 122 L of
2 Based on a UK-specific carbon intensity for electricity provision from the grid of0:44548 kgCO2ðeÞ=kWe h given by the Carbon Trust [48].
3 Based on a UK-specific carbon intensity for heating from the combustion ofnatural gas from the mains of 0:18404 kgCO2ðeÞ=kWth h given by the Carbon Trust[48], 122 L/day mean hot water consumption by UK homes given by the EnergySavings Trust [37], and an average UK boiler efficiency of 88% [49].
water delivered daily for domestic consumption to 14.1 �C in thecondenser (and via an intermediate storage capability) the waterheating demand could potentially be reduced by a further 6.6%(0.47 kW h/day).
3.4. Annual simulation
In the annual simulation, the daily model was run 24 times (seeSection 2.1); twice for each month (weekday and weekend day)with the appropriate electricity demand and environmental inputparameters for each run. The operating pressures, solar circuitand ORC flow-rates were set to the maximum power settingsdetermined in Section 3.3, with the solar fluid flow to the watercylinder set to zero. The results from the annual simulation,including a life-cycle cost analysis, are presented in Table 3.
The CSHP system with a solar-tracking PTC collector is shown todeliver 776 kWe h/year or 88:6 We on average which, taking3300 kWe h/year (377 We average) as the annual average house-hold consumption [50], is equivalent to 24% of the total demand.If this figure is divided by the maximum annual work calculatedfor the solar collector in Section 3.1, the resulting exergy efficiencyis 45%. These may be considered reasonable results, taking intoaccount the use of fixed pressures and flow-rates, and the manualapproach to system optimisation, which can be seen as a startingpoint for a CSHP system with improved design and operationalstrategies. The ETC-based system delivers 701 kWe h/year(80.0 We average). The work output from the PTC system in theannual simulation is found to be 10.7% higher than the ETC systemwork output. This difference is higher than the corresponding dif-ference obtained in the ‘‘annual-average day’’ simulations reportedin Section 3.3, which amounts to 3.2%, suggesting that the highersolar collector efficiency of the PTC system in summer monthshas a significant bearing on the system’s annual performance.
The large annual water volume requirement for cooling in thecondenser could favour air cooling as an alternative means of heatrejection. However, there are also a number options that may beexplored in order to exploit a larger proportion of the heat rejectedfrom the ORC for preheating the domestic hot-water supply;thereby decreasing both energy demand and cooling water con-sumption. Thus the hot-water store is a vital component for con-sideration in the design and configuration of the system. Abeneficial approach might be to split the water store into a high-temperature section for ORC heat-supply buffering, a low-temper-ature section for ORC heat-rejection, and an intermediate-temper-ature section for domestic hot-water supply. This could involvephysical compartmentalisation of the store or exploitation of thetemperature stratification gradient within a single compartment.Further use could also be made of the solar collector array in orderto cool some of the stored water during the night, for later use asthe heat rejection medium.
3.5. Exergy analysis
The results from the exergy analysis of the CSHP system areshown in Table 4 for the ETC variant, simulated over the full annualperiod in power generation priority mode (i.e. with the hot watercylinder bypass active). The hot water cylinder is omitted from thisanalysis. The thermodynamic parameters in the table are calcu-lated according to the exergy topological method outlined in Sec-tion 2.3.1 and used, for example, by Mago et al. [39]. Theproportional breakdown of exergy destruction in each componentis shown in Fig. 8a. As expected, the majority of the exergy is lost inthe solar collector array. This is an inevitable consequence of theconversion of solar radiation to enthalpy at a temperature thatmust be, for practical reasons, far lower than the apparent temper-ature of the sun as an exergy source.
Table 3Results from the annual simulation of the CSHP system.
PTC PTC ETC(tracking) (fixed) (fixed)
Average electrical power output We 88.6 53.7 80.0Emissions savingsa kgCO2(e) 346 210 312Installed electrical costb per We £=We 43.6 71.9 33.9Installed TOTAL cost per We £=We 61.8 101.9 54.0Peak electrical output We 527 527 377Total annual electrical output kWe h/year 776 471 701ORC evaporation pressure bar 16 16 12ORC condensation temperature �C 17 17 17Solar collector fluid mass flow rate kg/s 0.12 0.12 0.13ORC working fluid mass flow rate kg/s 0.015 0.015 0.01ORC heat source switch-on temp. �C 120 120 106ORC operation time h/year 1490 910 2150Cooling water consumption m3/year 1150 700 980Average solar collector efficiencyc % 13.0 5.7 19.0Average ORC efficiencyd % 13.8 13.8 12.7Initial installed electrical costb £ 3860 3860 2710Initial installed TOTAL cost £ 5480 5480 4320Annual incurred (O&M) costs £/year 39 39 27Levelised cost of electricitye £/kW h 0.57 0.94 0.44Discounted payback timef years 11.8 12.9 9.5
a Based on a UK-specific carbon intensity for electricity provision from the grid of 0:44548 kgCO2ðeÞ=kWe h given by the Carbon Trust [48].b Costs associated with the electricity-generating related components of the system only (refer to Section 2.5).c Reported value is the mean solar collector efficiency during daylight hours only, and normalised relative to the global (diffuse + direct) solar irradiance on a horizontal
surface.d Reported value is the mean efficiency during ORC operational hours only.e Assumes that all electricity generated displaces local demand. Based on an annual electricity consumption figure of 3300 kWe h/year (377 We average) from Ref. [50].f Discount rate assumed for CSHP-ORC system = 9%.
Table 4Exergy characteristics of the solar-ORC system and its components, based on the annual simulation of the evacuated-tube collector system presented in Table 3. Here, Xloss
(¼ Xin � Xout), Xuse and Xava are as defined in Section 2.3.1.
Total system 416,000 357,700 58,200 13,600 71,900 86.0 – 19.0
Total ORCa 125,800 122,300 3500 7300 10,800 97.3 15.0 67.9
a Not including solar collector and solar fluid pump.
ORC Pump0.1%
Evaporator3.4%Expander
1.4%Condenser
1.1%
Solarcollector91.8%
Solar fluid pump2.2%
(a)
Pump1.0%
Evaporator56.8% Expander
22.9%
Condenser19.4%
(b)
Fig. 8. Percentage of exergy loss per component in: (a) the entire system including solar collector array, and (b) the ORC system only. Note that the hot water storage cylinderis omitted because the analysis is performed for the system under power generation priority mode, with the cylinder bypassed.
618 J. Freeman et al. / Applied Energy 138 (2015) 605–620
Examining the breakdown of exergy destroyed in the ORCcomponents only (Fig. 8b), and comparing the exergy efficienciesin Table 4 with those for the non-regenerative ORC system studiedin Mago et al. [39], it is evident that: (1) the exergy efficiency of theORC components in the present study are on the whole lower; and
(2) the relative percentages of exergy destroyed are also different,with the condenser in particular exhibiting a considerably largershare of the overall exergy destruction in our study. The formerof these observations may be attributable to the lower temperatureoperation of the system studied here, and also the lower isentropic
J. Freeman et al. / Applied Energy 138 (2015) 605–620 619
efficiencies of the pump and expander which is a result oftheir smaller scale and positive displacement nature. The latterobservation is due to the larger temperature differences betweenthe fluids entering and exiting the condenser. The exergy destroyedin the heat exchangers can be improved by considering aregenerative cycle configuration, albeit with a likely increase insystem cost due to the larger heat exchange area required. This willbe considered in future work.
When the exergy analysis of the ETC collector system iscompared to that for the PTC system, it is found that the totalsystem exergy destruction is 28% lower for the PTC. The totalsystem exergy efficiency increases from 19.0% to 25.5%. This is tobe expected as a consequence of the efficient high temperatureoperation of the concentrating collector, which allows the ORC tooperate at a higher evaporation temperature and pressure. Thusthere is an improvement in the exergy efficiency, not only of thesolar collector array (increasing from 6.3% for the ETC to 9.2% forthe PTC), but also the ORC components. The total ORC exergyefficiency increases from 67.9% to 70.4%.
5 2 2
4. Further discussion and conclusions
This paper has presented a technoeconomic model to investi-gate the potential performance and cost of a domestic-scaleCSHP-ORC system featuring a positive-displacement expander,for use in the UK. The results of initial simulations based on simplecomponent efficiency data, load profiles and operational controlregimes have shown that the electrical output from the system issensitive to the flow-rates, temperatures and working pressuresin the ORC sub-system and to the design and operation of the solarcollector array. Annual simulations have shown that for a fixedflow-rate system operation with 15 m2 [46] of rooftop collectorarray, the system can produce an average power in the region of80–90 We (700–780 kW he/year) for an approximate total capitalcost of £4400–5500, of which only £2700–£3900 can be attributedto electrical power generation and the rest to solar hot-water heat-ing. This is equivalent to an installed total cost per unit averagepower generation of £55—61=We, or £34—44=We if one considersthe costs associated with electricity generation alone, and repre-sents �310–350 kgCO2(e) in emissions reductions due to localpower generation. In addition to this, the CSHP-ORC system modelhas demonstrated a potential for producing up to 86% of therequired hot water for household consumption, corresponding toan additional 470 kgCO2(e) in emissions reductions.
By comparison, a similar sized (15 m2) mono-crystalline silicon(mono-Si) PV system (approx. 2:1 kWp) costing around�£7500 canbe expected to have an average electrical output of � 200 We in theUK climate4 giving an installed cost of approximately � £38=We.Interestingly, this normalised cost value is in the middle of the£34—44=We range given above for the CSHP-ORC system. Althoughthis PV system has a higher electrical output compared to theCSHP-ORC system, the option to provide solar hot-water does notexist because the entirety of the roof space is taken-up by the PVarray that does not have a thermal output, while the total systemprice is significantly higher compared to the CSHP system. Animproved like-for-like comparison should be made with variousside-by-side configurations for a PV and solar hot-water systemsharing the same roof-space (where the electrical and thermaloutputs are dependent on how the roof-area is split), or a hybridPV-Thermal (PVT) system in which the PV and solar-thermal
4 Based on an approximate cost of £3500=kWp and unit size/rating of 7 m2=kWp formono-Si PV from Ref. [51]. The annual average electrical output is based on anelectrical output of 825 kWe h=kWp/year for PV, which is an approximate UKperformance estimate for a south-facing array with a tilt-angle between 30 and 50�[51].
collector components are combined in a single module. In the formercase, the electrical output is compromised (due to reduced PV array-size to accommodate the solar thermal collectors) and in the latterthe potential for hot-water provision is compromised (due to thecollector thermal efficiency as a result of combining with the PVmodule), while the electrical output will be similar to a PV-onlyarray of equivalent area. The purchase and installation cost of theside-by-side system would be in the range £9500–10,000, giving acost per unit generating capacity of � £73=We. 5 This figure shouldbe directly compared to the £55—62=We range that was given abovefor the CSHP-ORC system. For the PVT system the purchase andinstallation cost is in the region £8000–8500, with a cost per unitcapacity of � £38=We based on an output of � 215We. 6 This valuemay appear lower than the total capital cost per unit deliveredpower by the CSHP-ORC system (£55—61=We), however, it shouldbe noted that the PVT alternative has a significantly reduced capacityfor hot water provision, which amounts to 35% of consumption atbest [53]. In both cases, the upfront cost of the purchase andinstallation may prove a prohibitive amount for many households.The total cost of the CSHP-ORC system, however, has the potentialto be far lower because the only additional costs (relative to the solarhot-water system) are the ORC components and the additionalsolar-thermal collectors required to fill the remaining roof-space.Thus, there is an incentive to design the CSHP system to be availableat low cost and for simple integration into an existing solarhot-water system.
Furthermore, the maximum power analysis presented in thispaper has shown that there is the potential to achieve a signifi-cantly higher electrical power output from the CSHP-ORC systemthan has been predicted in the model simulations. Two importantareas have been identified for performance improvements, whichare: (1) maximising the solar collector efficiency by maintainingthe optimum operating temperature; (2) allowing the system toachieve a smooth, continuous power output for better load-profilematching. The employment of variable flow-rate control has thepotential to see improvements in both areas; with developmentof a suitable control algorithm a key requirement for implementa-tion into the system model. In addition, the identification of a moresuitable working fluid is required, particularly for the concentrat-ing collector system, whose operational temperature has beenshown to be limited by the use of the working fluid R245fa.
Acknowledgement
This work was supported by the Engineering and Physical Sci-ences Research Council (EPSRC), UK [grant number EP/J006041/1].
References
[1] Owen P. Powering the nation. Household electricity-using habits revealed.London: Energy Saving Trust/DECC/DEFRA; 2012.
[2] Markides CN. The role of pumped and waste heat technologies in a high-efficiency sustainable energy future for the UK. Appl Therm Eng 2013;53(2):197–209.
[3] OECD Publishing and International Energy Agency. Energy technologyperspectives 2010: scenarios and strategies to 2050; 2010.
[4] Šúri M, Huld TA, Dunlop ED, Ossenbrink HA. Potential of solar electricitygeneration in the European Union member states and candidate countries. SolEnergy 2007;81(10):1295–305.
[5] Masson G, Latour M, Biancardi D. Global market outlook for photovoltaics until2016. European Photovoltaic Industry Association; 2012.
Based on a reduced array size of 10 m to accommodate a 5 m solar thermalarray. Solar hot-water purchase and installation cost based on typical figures fordomestic systems (including the hot-water cylinder) from the Energy Saving Trust[52].
6 Based on a 15 m2; 2:3 kWp PVT system with a total purchase and installation costof �£8000–8500 [53], delivering a UK-specific annual yield of 825 kWe h=kWp/year[51].
620 J. Freeman et al. / Applied Energy 138 (2015) 605–620
[6] Energy Saving Trust. Here comes the sun: a field trial of solar water heatingsystems; 2011.
[7] Colville F. 802 MW 1H’13 solar PV demand in UK thrusts industry to global top-6ranking: Part 1 of a 2 part feature. NPD Solarbuzz; 2013. <http://www.solarbuzz.com/resources/articles-and-presentations> [accessed 08.11.13].
[8] Colville F. UK solar PV demand reached 520 MW in Q1’13. NPD Solarbuzz; 2013.<http://www.solarbuzz.com/resources/articles-and-presentations> [accessed08.11.13].
[9] Vélez F, Segovia JJ, Martín MC, Antolín G, Chejne F, Quijano A. A technical,economical and market review of organic Rankine cycles for the conversion oflow-grade heat for power generation. Renew Sustain Energy Rev 2012;16(6):4175–89.
[10] Quoilin S, Orosz M, Hemond H, Lemort V. Performance and designoptimization of a low-cost solar organic Rankine cycle for remote powergeneration. Sol Energy 2011;85(5):955–66.
[11] Manolakos D, Kosmadakis G, Kyritsis S, Papadakis G. On site experimentalevaluation of a low-temperature solar organic Rankine cycle system for ROdesalination. Sol Energy 2009;83(5):646–56.
[12] Canada S, Cohen G, Cable R, Brosseau D, Price H. Parabolic trough organicRankine cycle solar power plant. In: DOE solar energy technologies programreview meeting. USA: Denver; 2004.
[13] Zahoransky R, Knöringer P, Schelling U, Wittig S. Anmerkungen zum einsatzund wirkungsgrad kleiner kraftmaschinen: Turbinen, dampfmotor undschraubenexpander. Wärme 1983;91(4):44–53.
[14] Chen H, Goswami DY, Stefanakos EK. A review of thermodynamic cycles andworking fluids for the conversion of low-grade heat. Renew Sustain Energy Rev2010;14(9):3059–67.
[15] Barber R, Prigamore D. Solar energy handbook. New York: McGraw-Hill; 1981[chapter Solar-Powered Heat Engines].
[16] Bejan A. Entropy generation through heat and fluid flow. New York (USA): JohnWiley and Sons Inc.; 1982 [chapter 11: Solar Energy].
[17] Manfrida G. The choice of an optimal working point for solar collectors. SolEnergy 1985;34(6):513–5.
[19] Qu M, Archer D, Masson S. A linear parabolic trough solar collectorperformance model. Sixth international conference for enhanced buildingoperations, vol. 6 of 3. Shenzhen (China): Energy Systems Laboratory; 2006.
[20] BS EN 12975-2: 2006. Thermal solar systems and components. Solar collectors.Test methods.
[25] Clemente S, Micheli D, Reini M, Taccani R. Performance analysis and modelingof different volumetric expanders for small-scale organic Rankine cycles. In:ASME 2011 5th international conference on energy sustainability, WashingtonDC, USA; 2011. p. 7–10.
[26] Wang M, Wang J, Zhao Y, Zhao P, Dai Y. Thermodynamic analysis andoptimization of a solar-driven regenerative organic Rankine cycle (ORC) basedon flat-plate solar collectors. Appl Therm Eng 2013;50(1):816–25.
[27] Lecompte S, Huisseune H, Van den Broek M, De Schampheleire S, De Paepe M.Part load based thermo-economic optimization of the organic Rankine cycle(ORC) applied to a combined heat and power (CHP) system. Appl Energy2013;111:871–81.
[28] Akers A, Gassman M, Smith R. Hydraulic power system analysis. CRC press;2010 [chapter 8 Pumps and Motors].
[29] Quoilin S, Van den Broek M, Declaye S, Dewallef P, Lemort V. Techno-economicsurvey of organic Rankine cycle (ORC) systems. Renew Sustain Energy Rev2013;22:168–86.
[30] Badr O, O’Callaghan P, Hussein M, Probert S. Multi-vane expanders as primemovers for low-grade energy organic Rankine-cycle engines. Appl Energy1984;16(2):129–46.
[31] Quoilin S, Lemort V, Lebrun J. Experimental study and modeling of an organicRankine cycle using scroll expander. Appl Energy 2010;87(4):1260–8.
[32] Badr O, Naik S, O’Callaghan P, Probert S. Expansion machine for a low power-output steam Rankine-cycle engine. Appl Energy 1991;39(2):93–116.
[33] Saitoh T, Yamada N, Wakashima S-I. Solar Rankine cycle system using scrollexpander. J Environ Eng 2007;2(4):708–19.
[34] Wang W, Wu Y-t, Ma C-f, Liu L-d, Yu J. Preliminary experimental study ofsingle screw expander prototype. Appl Therm Eng 2011;31(17):3684–8.
[35] Bracco R, Clemente S, Micheli D, Reini M. Experimental tests and modelizationof a domestic-scale organic Rankine cycle. In: 25th International conference onefficiency, cost, simulation and environmental impact of energy systems,Perugia, Italy; 2012.
[36] Drück H, Pauschinger T. Multiport store – model for TRNSYS. Type 340; 2006.[37] Energy Saving Trust. Measurement of domestic hot water consumption in
dwellings; 2008.[38] Richardson I, Thomson M, Infield D, Clifford C. Domestic electricity use: a high-
resolution energy demand model. Energy Build 2010;42(10):1878–87.[39] Mago P, Srinivasan K, Chamra L, Somayaji C. An examination of exergy
destruction in organic Rankine cycles. Int J Energy Res 2008;32(10):926–38.[40] Kar AK. Exergy efficiency and optimum operation of solar collectors. Appl
Energy 1985;21(4):301–14.[41] Badescu V. Optimal control of flow in solar collectors for maximum exergy
extraction. Int J Heat Mass Transf 2007;50(21):4311–22.[42] Köhler S. Geothermisch angetriebene dampfkraftprozesse analyse und
[43] Lukawski M. Design and optimization of standardized organic Rankine cyclepower plant for European conditions. Master’s thesis. School for RenewableEnergy Science, in affiliation with the University of Iceland and the Universityof Akureyri; 2009.
[44] Hewitt GF, Shires GL, Bott TR. Process heat transfer. London: CRC Press; 1994.[45] Declaye S, Quoilin S, Guillaume L, Lemort V. Experimental study on an open-
drive scroll expander integrated into an ORC (organic Rankine cycle) systemwith R245fa as working fluid. Energy 2013;55:173–83.
[46] Edwards R. Department of energy and climate change. Personal Commun2012.
[47] ASHRAE. International weather for energy calculations (IWEC) weather files.Users Manual and CD-ROM; 2001.
[49] UK Government Standard Assessment Procedure (SAP). Seasonal efficiency ofdomestic boilers in the UK (SEDBUK) – Boiler efficiency database; 2013.<http://www.boilers.org.uk/> [accessed 11.11.13].
[50] Office of Gas and Electricity Markets. Typical domestic energy consumptionfigures factsheet; 2011. <htp://www.ofgem.gov.uk> [accessed 21.05.13].
[51] Energy Saving Trust. A buyer’s guide to solar electricity panels; 2011.[52] Energy Saving Trust. Solar water heating – costs savings and earnings; 2013.
<http://energysavingtrust.org.uk> [accessed 10.11.13].[53] Herrando-Zapater M. Assessment of hybrid solar-thermal and PV systems for
domestic heating and power. A UK-based study. Master’s thesis. ImperialCollege London, Energy Futures Lab; 2012.
[54] Weiss W, Rommel M. Process heat collectors. State of the art within Task 33/IV. IEA Solar Heating and Cooling Programme; 2008.