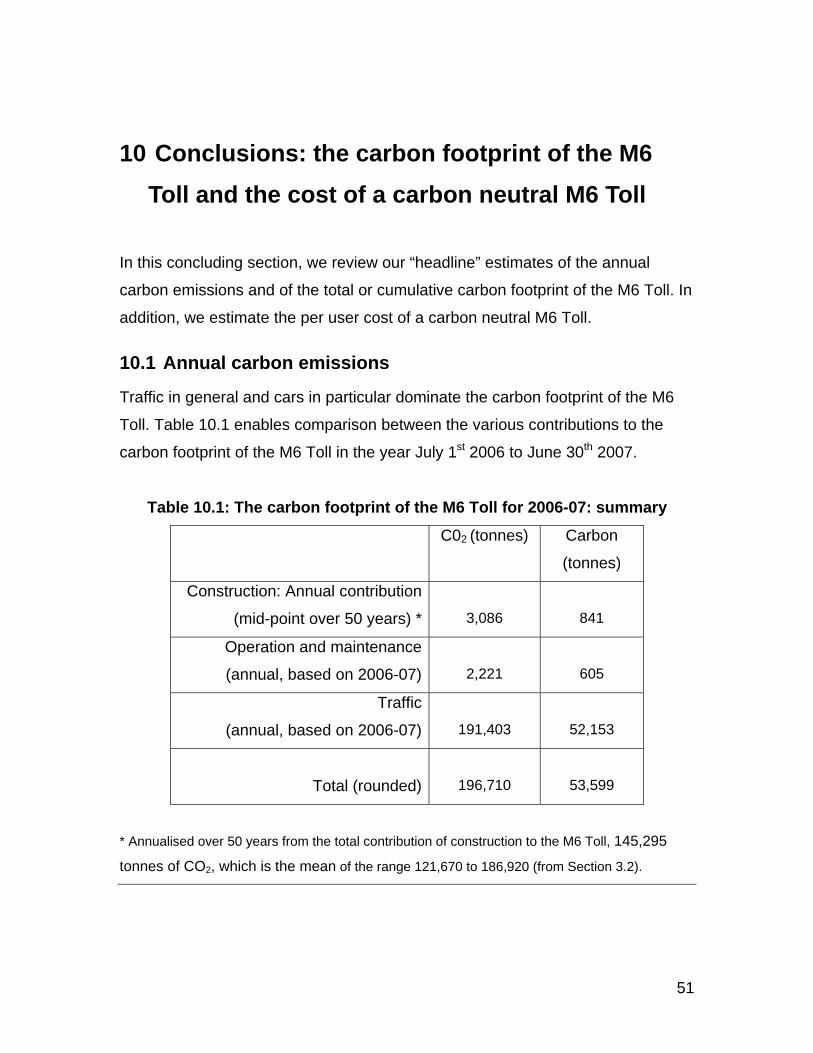
An assessment of the carbon footprint of the M6 Toll Motorway in the UK Jon Fairburn and Prof Geoff Pugh Institute for Environment, Sustainability and Regeneration Staffordshire University www.staffs.ac.uk/iesr Contact details Jon Fairburn 01782 294038 e: [email protected]Geoff Pugh 01782 294092 e: [email protected]
Transcript
An assessment of the carbon footprint of the M6 Toll Motorway in the UK
Jon Fairburn and Prof Geoff Pugh
Institute for Environment, Sustainability and Regeneration
Please note that all bookmarks are enabled in the pdf version of this document for ease of use.
4
Tables Table 2.1: Stages in the "life" of the M6 Toll ________________________________________ 10 Table 3.1: Tonnes of CO2 per km of road under different scenarios _____________________ 14 Table 3.2: Environmental loading of roads (FINNRA 2000) ____________________________ 15 Table 3.3: Summary of three LCA studies of roads __________________________________ 16 Table 4.1: Toll station carbon footprint for electricity use (2006-2007) ____________________ 21 Table 4.2: Unmetered electricity supplies for lighting, signs and communications (2006-07) ___ 22 Table 4.3 Fleet vehicle emissions on the M6 Toll * ___________________________________ 23 Table 4.4 Carbon footprint of operations___________________________________________ 25 Table 5.1 Carbon footprint of different classes of vehicle on the M6 Toll 2006 to 2007 _______ 27 Table 5.2 Best estimate for carbon footprint of M6 Toll 2006 to 2007_____________________ 28 Table 5.3 Classification of vehicle emissions _______________________________________ 29 Table 6.1: Overall carbon footprint for the M6 Toll (tonnes of CO2) ______________________ 31 (2006 to 2007)_______________________________________________________________ 31 Table 7.1: Assumed decline in average emissions per car 2005 to 2012 (grams CO2 per
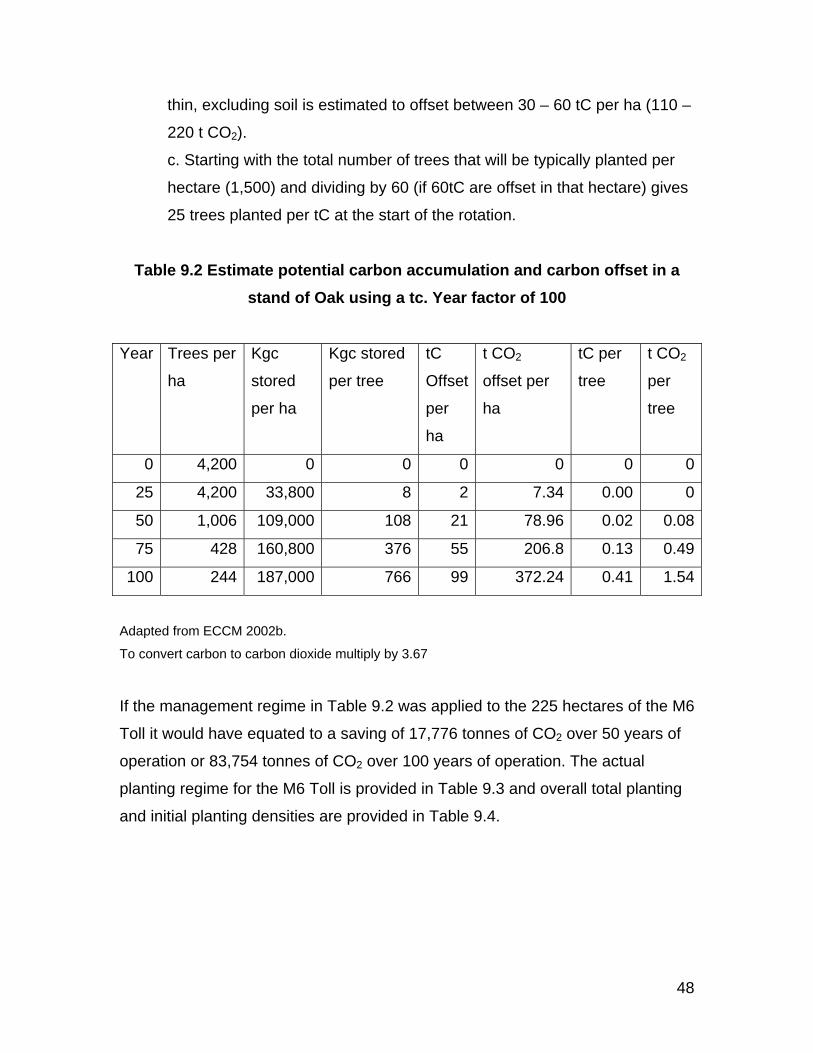
kilometre)___________________________________________________________________ 35 Table 8.1: Carbon footprint for traffic levels on M6 ___________________________________ 43 Table 9.1 Unmetered supplies for lighting, signs and communications____________________ 45 Table 9.2 Estimate potential carbon accumulation and carbon offset in a stand of Oak using a tc.
Year factor of 100 ____________________________________________________________ 48 Table 9.3 Tree and shrub planting for the M6 Toll____________________________________ 49 Table 9.4 Tree and shrub planting for the M6 Toll Road_______________________________ 49 Table 10.1: The carbon footprint of the M6 Toll for 2006-07: summary ___________________ 51 Table 10.2 Estimated cost per users to offset all carbon dioxide in 2006-7 ________________ 53
Figures Figure 7.1 M6 Toll: time-path of CO2 emissions for cars only (tonnes per year; daily traffic flow
rising to 153,077 in 2054) ______________________________________________________ 37 Figure 7.2 M6 Toll: time-path of CO2 emissions for cars only (tonnes per year; daily traffic flow
rising to capacity of 80,000 vehicles per day from 2022 onwards) _______________________ 38 Figure 10.1: The user cost of carbon (euro cents per journey on the M6 Toll) ______________ 55 Acknowledgments Thanks to Tom Fanning, Maxine Estevez, Steve Warren, Simon Greaves, Colin Mabey, Richard Gargett at Midland Express Limited and Paul Gregory at Macquarie Bank.
5
The carbon footprint of the M6 Toll: Executive Summary
The aims of this project are to estimate the carbon footprint of the M6 Toll for a
range of scenarios, to compare the carbon footprint of the M6 Toll with the
carbon footprint of an equivalent section of the M6, and to identify and cost a
range of policy options for a carbon-neutral M6 Toll.
The carbon footprint of the M6 Toll arises from its construction, operation and
use. These may be described as two stages of a life-cycle, comprising: a fixed
component arising from construction (the carriageway and associated
infrastructure); and a mainly variable component arising from operation and
maintenance, and traffic flow. “End of life” decommissioning is a theoretically
possible third stage, but at present may be disregarded.
Our estimates of carbon emissions arising from construction of the M6 Toll apply
findings from three relevant Scandinavian studies of the environmental impact of
road construction. We adjust estimates of the carbon footprint of road
construction from these studies to take account of M6 Toll characteristics.
Accordingly, we estimate that the construction stage of the M6 Toll has a total
carbon footprint of between 121,670 and 186,920 tonnes of CO2.1 This
component of the carbon footprint of the M6 Toll is fixed; i.e., it is once and for
all. By applying plausible assumptions about the offset effects of planting, we
estimate that over 50 years, existing on-site planting may offset between ten and
fifteen percent of the carbon footprint of M6 Toll construction.
The carbon footprint of the M6 Toll is dominated by vehicle emissions. The
quality of primary data and the use of standard “greenhouse gas conversion
factors” (Defra 2007) enable relatively precise estimates of this component of the
1 In carbon footprinting, estimates are typically presented for both carbon and emissions of CO2.
To convert carbon to carbon dioxide, multiply by 3.67.
6
carbon footprint. Our best estimate of vehicle emissions for the year 2006-07 is
191,403 tonnes of CO2.2 In comparison, operation and maintenance account for
around 2,221 tonnes of CO2 in each year: operation of the pumping station for
183 tonnes; MEL’s vehicle fleet involved in maintenance for an additional 178
tonnes; lighting for 1,148 tonnes; and toll stations for 712 tonnes.
Total carbon dioxide emissions arising from the operation of the M6 Toll over its
whole life will vary from year to year according to two main influences pulling in
opposite directions: namely, traffic flow and emissions regulations. Accordingly,
we have calculated a range of scenarios for the time path of CO2 emissions,
hence for the total carbon footprint of the M6 Toll. According to the differing
assumptions investigated, in round terms the total carbon footprint of the M6 Toll
is likely to fall within a range of between 4½ and 12½ million tonnes of CO2.
Policy options for MEL include: firstly reducing energy use at the site; secondly
supporting the EU-wide “eco-drive campaign” (fuel savings of five to 10 percent
from “smooth and safe” driving techniques translate into proportionately similar
reductions in the carbon footprint of the M6 Toll). To become fully carbon neutral,
MEL/Macquarie will have to engage in carbon offsetting, in which case there may
be advantages in becoming an official offsetting company.
Predicting the cost of carbon offsetting for the M6 Toll is difficult as markets for
carbon trading are still developing. An indicative upper limit may be calculated for
the operating year 2006-2007: with carbon emissions of over 50,000 tonnes, and
using an authoritative estimate of the cost of carbon of 35 euros per tonne, we
estimate the cost of carbon offset for each M6 Toll user to be about ten euro
cents (or about eight pence sterling). However, future estimates under different
assumptions typically range between five and 17 euro cents. 2 A conservative estimate suggests that vehicle emissions on a similar stretch of the M6 are
around five times larger, reflecting both greater traffic flow and a much higher proportion of HGVs
in that flow.
7
1 Introduction
Construction work for the M6 Toll began in November 2000 and the road was
first opened to public traffic on 9th December 2003. The road will be operated by
Midland Express Limited until 9th December 2054 when it reverts to the Secretary
of State for Transport. Accordingly, in this Report we estimate the carbon
footprint of the M6 Toll for a 50-year operating horizon.3 The total length of the
motorway is 43.45km (27 miles), although some of the motorway was built on
existing roads.
1.1 Project Aims
1. To produce a carbon footprint for the M6 Toll (including a range of values
under different scenarios).
2. To produce a carbon footprint for an equivalent section of the M6 as a
means of comparison.
3. To produce a range of policy options (including where possible costs) to
offset carbon generated by the M6 Toll.
1.2 Structure of the Report
Section 2 explains how we define the carbon footprint of the M6 Toll together
with our approach to estimating it. Sections 3, 4 and 5 present our findings on the
3 In carbon footprinting, estimates are typically presented for both carbon and carbon dioxide (CO2) emissions. To convert carbon to carbon dioxide, multiply by 3.67. Carbon dioxide and carbon emissions are, of course, measured by weight. Nonetheless, carbon footprint is now established terminology.
8
carbon emissions arising from the life-cycle of the M6 Toll: to this end, we
estimate the contributions to the carbon footprint of the M6 Toll of its
construction; its operation and maintenance; and traffic use. Section 6 brings
these findings together to estimate the total carbon footprint for one year of
operation (July 1st 2006 to June 30th 2007). Section 7 establishes that the total or
cumulative carbon footprint of the M6 Toll cannot be properly calculated as the
single year’s contribution multiplied by 50. Instead, we show how different
assumptions on future traffic flow and vehicle emissions result in different time
paths for carbon emissions and, hence, different estimates of the total cumulative
carbon footprint of the M6 Toll. Section 8 compares the carbon footprint of the
M6 Toll with a comparable stretch of the (non-toll) M6 motorway. Section 9
discusses policy options for a carbon-neutral M6 Toll. Finally, Section 10
concludes with estimates of the per user cost of achieving a carbon-neutral M6
Toll.
9
2 M6 Toll carbon footprint methodology Our approach to estimating the carbon footprint of the M6 Toll is informed by the
definition of Weidman and Minx (2007):
The carbon footprint is a measure of the exclusive total amount of carbon
dioxide emissions that is directly and indirectly caused by an activity or is
accumulated over the life stages of a product.
Accordingly, we implement a modified “lifecycle approach” to estimating the
carbon footprint of the M6 Toll, which is an approach emphasised by Wiedmann
and Minx (2007). To this end, we estimate the total carbon emissions associated
with the two main stages of the life of the M6 Toll: namely, construction; and
operation and maintenance. For analysis and estimation, these stages are
decomposed into more detailed activities, which are presented in Table 2.1
below.
Table 2.1: Stages in the "life" of the M6 Toll
1. Construction • Main carriageway
• Slip roads
• Bridges
- 57 new bridges
constructed
- Some existing bridges
modified
• 6 Toll stations
• Lighting
• Headquarters and
associated buildings
2. Operation and maintenance • Toll stations
• Lighting and signs
• Fleet vehicle use
operation
• Pumping station
• Long-term maintenance
- Related to traffic volume
• Landscape maintenance
• HQ
10
Theoretically, we could also identify an "end of life" stage, which would involve
recycling or actual disposal of road material. In the case of the M6 Toll this is
unlikely to happen within the 50-year operating horizon of Midland Expressway,
and so is excluded from our calculations.
The two stages and their associated activities detailed in Table 2.1 are not our
only units of analysis. We depart from the conventional approach to carbon
footprint measurement propounded by the Carbon Trust (2007) by including
traffic emissions arising from the use of the M6 Toll. This contradicts the explicit
exclusion of “emissions in the use of the product” by the Carbon Trust’s
methodology (2007, p.6) on the grounds that these are not under the direct
control of producers but, rather, depend on consumers’ “use of the product”. In
our view, such exclusion in the case of transport infrastructure, in particular of
roads, would not carry conviction or withstand critical scrutiny. Indeed, the
Carbon Trust (2007, p.7) expresses doubts concerning emissions in use,
admitting this as a “limitation” of its methodology generally and in relation to fuels
in particular, for which “the emissions in use are very important”. For the same
reason, we propose adding road services to the list of products to which this
exclusion is inappropriate. Accordingly, we estimate carbon emissions not only
for the two stages detailed above, but also for actual and projected traffic flows
on the M6 Toll.
In other respects, our methodology is consistent with guidelines proposed by the
Carbon Trust (2007, pp.14-15), which favour the use both of secondary data for
minor influences and of primary data for major influences. In particular, we refer
to (high quality) secondary data to estimate emissions arising from construction
of the M6 Toll. Because, on any plausible assumptions, construction related
emissions are very small compared to the total carbon footprint of the M6 Toll, to
have derived these estimates from primary sources would have been a huge
undertaking with costs out of all proportion to any potential benefit. However,
11
although operation and maintenance account for a similarly small proportion of
total emissions, high-quality primary data was available at reasonable cost and
so informs accurate estimation of this component of the overall carbon footprint.
Most important is that we had access to high quality data on the inputs to our
calculation of vehicle emissions, which include: data on traffic flow and projected
traffic flow; conversion factors (i.e., carbon equivalents of vehicle kilometres for
the main classes of vehicle); and information on policy-related changes in future
emissions.
In addition, we have adopted a conservative rather than a permissive approach
to our estimates. In other words, at each point in our analysis where shortcomings of the data force us to make assumptions, these are made so that resulting bias is more likely to result in an overestimate than in an underestimate of the carbon footprint of the M6 Toll. Finally, we undertake
robustness checks, by calculating different scenarios, which show the effect of
alternative assumptions on our estimates.
Conversely, we do not extend our estimates beyond carbon dioxide (CO2) to
account for other greenhouse gas emissions arising from the construction,
operation and use of the M6 Toll. In spite of debate on this issue, we follow
Weidman and Minx (2007) who advance two reasons for restricting our attention
to CO2: first, there are intractable data problems for emissions of other
greenhouse gases; and, secondly, conversion into carbon equivalents is not
reliable.
12
13
3 Construction phase In sections 3, 4 and 5 we presents our findings on the carbon emissions
associated with the main stages and activities associated with the M6 Toll:
namely, construction; operation and maintenance; and traffic. We begin with the
construction stage.
We have derived our values for the carbon footprint of the construction phase
from a review of three major studies of road construction and its environmental
impacts. We applied findings from these studies to the M6 Toll. Each of these
studies is relevant, overlapping with the planning and construction of the M6 Toll,
and referred to by public authorities responsible for road construction (for
example, Stripple, 2001, was translated into English by Surrey County Council).
Hakkinen and Makela (1996) used a Life Cycle Analysis approach to model five
different scenarios with regards to the construction (including material used and
construction technologies) and to the maintenance and operation of a 1 kilometre
motorway over 50 years (assuming a transport load of 20,000 vehicles a day to
assess the maintenance implications). The reference road is the Tampere Ring
Road in Finland completed in 1994. One particular issue with these roads is the
level of abrasion due to tyre studs on vehicles to grip the road due to ice. As such
it can be assumed that abrasion may well be higher than would occur in other
countries where vehicles don't use studs. They modelled five different scenarios
(see Table 3.1) and produced values ranging between 590 and 940 tonnes of
CO2 per km of road. The following processes are common to all five scenarios:
traffic disturbance due to maintenance; lighting; dust burdens from pavement
abrasion; and dust from salting.
Asphalt:
Maintenance A
Asphalt:
Maintenance B
Concrete:
Maintenance A
Concrete:
Maintenance B
Concrete
Maintenance A,
including carbonation
590 670 940 940 880Processes include:
Production process
of asphalt
Paving
Maintenance A
(Finnish)
Processes include:
Production process
of asphalt
Paving
Maintenance B
(Swedish)
Processes include:
Production process of concrete
Paving
Maintenance A ( including two
grindings of pavement surface in
50 years)
Processes include:
Production process of
concrete
Paving
Maintenance B (including
three grindings of pavement
surface in 50 years)
Processes include:
Production process of concrete
Paving
Maintenance A ( including two
grindings of pavement surface in
50 years)
Carbonation of concrete surface
(3 x 15mm)
14
Table 3.1: Tonnes of CO2 per km of road under different scenarios
Source: Hakkinen T and Makela K (1996) p.44
Finnish National Road Administration (2000) analysed the environmental impact
of road construction impacts in Finland (with no account of traffic other than
construction traffic). Using a wide range of sources for environmental loading
dating between 1995 and 1999, it produced a set of figures assuming a 50 year
time period for road construction and subsequent maintenance (see Table 3.2).
Table 3.2: Environmental loading of roads (FINNRA 2000)
Loadings Maintenance Construction
CO2 (tonnes/km) 33.9 263 to 562
Energy consumption
(kwh/km)
183,300 790,000 to 1,470,000
The total amount of CO2 from construction and maintenance over a 50 year
period was estimated to be between 299.9 to 595.9 tonnes for every kilometre of
road.
Stripple (2001) provides a slightly revised analysis from his earlier study (1995)
into the Life Cycle Analysis of roads in Sweden. In this study the road is assumed
to be 1 kilometre long, 13 metres wide, with a sub base thickness of 1 metre and
a base course of 0.5 metre. The road is assumed to be lit and in operation for 40
years. There is a traffic assumption of 5,000 cars per 24 hours for assessing the
maintenance implications.
Under six different scenarios Stripple calculated the total CO2 emissions from
construction, maintenance and operation to be between 2,000 and 2,750 tonnes
per kilometre over 40 years. In all cases, well over 80 percent of the CO2
emissions originated from the construction phase. It is important to note that the
calculations for traffic were only used to estimate the impact as a result of
operational requirements. The figures DO NOT include CO2 due to the traffic
itself. Emissions of CO2 were dominated by emissions from the construction of
15
the road. Energy consumption due to traffic was roughly estimated at ten times
construction and maintenance.
It is worth noting that these three studies occurred around the same time that the
M6 Toll was being built (see Table 3.3 for comparison).
Table 3.3: Summary of three LCA studies of roads
Study Tonnes CO2 per km
Years Scenario Road characteristics
Hakkinen
and Makela
1996
590 to
940
50 Construction,
operation and
maintenance but not
traffic
20,000 vehicles a day but
only for purpose of
calculating maintenance
and operation.
FINNRA
2000
270 to
596
50 Construction only 12m wide
Stripple
2001
2,000 to
2,750
40 Construction,
operation and
maintenance, but
not traffic
13 m wide, 1 metre sub
base, 0.5 metre base
course. Assumed to be lit.
Adhering to our preference for conservative bias, we take the upper estimate as
the basis for calculating the contribution of construction to the carbon footprint of
the M6 Toll. When applied to the entire length of the M6 Toll, the per kilometre
range indicates a minimum of 174,000 and a maximum of 240,000 tonnes of C02
arising from the construction of the M6 Toll for both carriageways. However,
before applying Stripple’s (2001) estimates to the M6 Toll, some adjustment is
necessary.
16
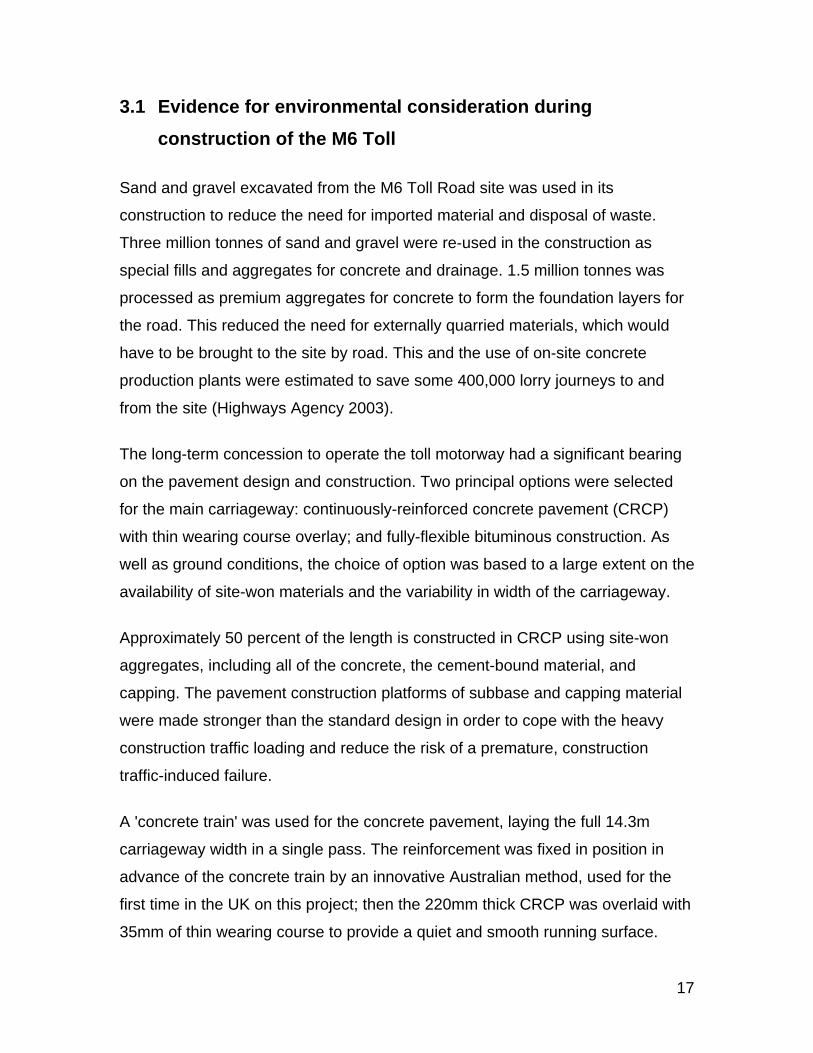
3.1 Evidence for environmental consideration during construction of the M6 Toll
Sand and gravel excavated from the M6 Toll Road site was used in its
construction to reduce the need for imported material and disposal of waste.
Three million tonnes of sand and gravel were re-used in the construction as
special fills and aggregates for concrete and drainage. 1.5 million tonnes was
processed as premium aggregates for concrete to form the foundation layers for
the road. This reduced the need for externally quarried materials, which would
have to be brought to the site by road. This and the use of on-site concrete
production plants were estimated to save some 400,000 lorry journeys to and
from the site (Highways Agency 2003).
The long-term concession to operate the toll motorway had a significant bearing
on the pavement design and construction. Two principal options were selected
for the main carriageway: continuously-reinforced concrete pavement (CRCP)
with thin wearing course overlay; and fully-flexible bituminous construction. As
well as ground conditions, the choice of option was based to a large extent on the
availability of site-won materials and the variability in width of the carriageway.
Approximately 50 percent of the length is constructed in CRCP using site-won
aggregates, including all of the concrete, the cement-bound material, and
capping. The pavement construction platforms of subbase and capping material
were made stronger than the standard design in order to cope with the heavy
construction traffic loading and reduce the risk of a premature, construction
traffic-induced failure.
A 'concrete train' was used for the concrete pavement, laying the full 14.3m
carriageway width in a single pass. The reinforcement was fixed in position in
advance of the concrete train by an innovative Australian method, used for the
first time in the UK on this project; then the 220mm thick CRCP was overlaid with
35mm of thin wearing course to provide a quiet and smooth running surface.
17
The fully flexible pavement option was adopted for the M42 southern end, where
modifications to existing carriageway of varying widths and depths were required,
and at the northern end of the project where ground conditions were variable and
generally much poorer. Conventional paving plant was used for laying the various
pavement layers in single-lane widths.
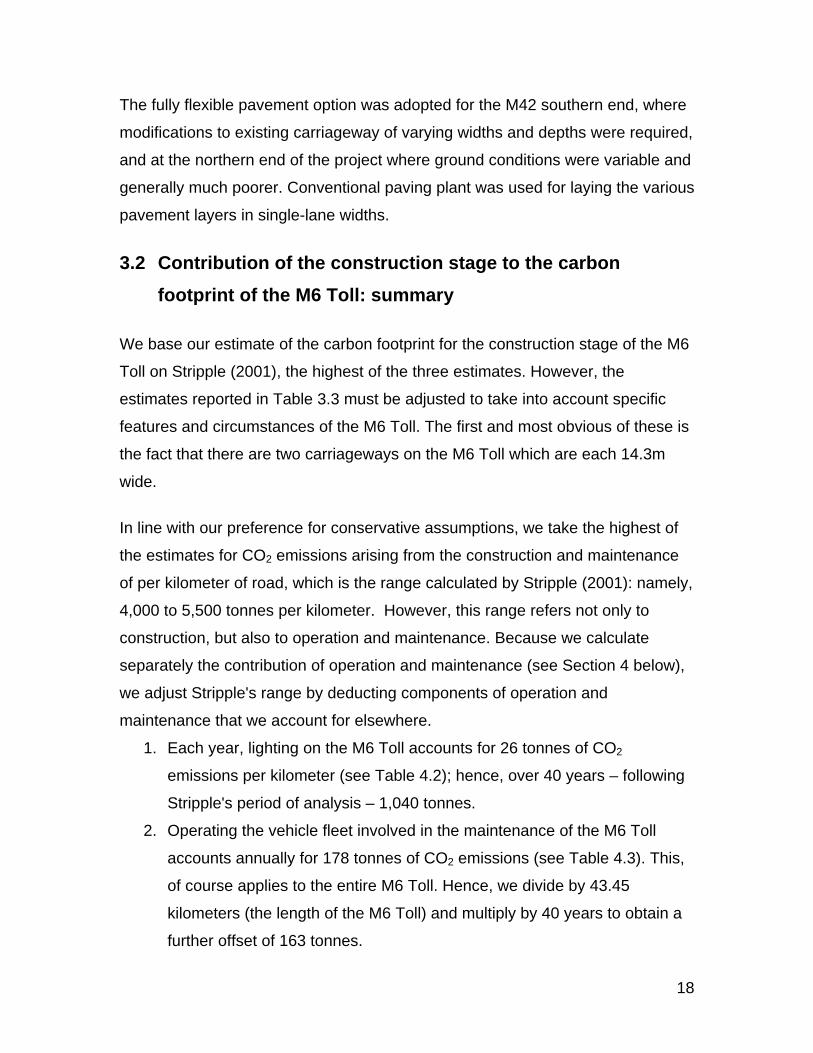
3.2 Contribution of the construction stage to the carbon footprint of the M6 Toll: summary
We base our estimate of the carbon footprint for the construction stage of the M6
Toll on Stripple (2001), the highest of the three estimates. However, the
estimates reported in Table 3.3 must be adjusted to take into account specific
features and circumstances of the M6 Toll. The first and most obvious of these is
the fact that there are two carriageways on the M6 Toll which are each 14.3m
wide.
In line with our preference for conservative assumptions, we take the highest of
the estimates for CO2 emissions arising from the construction and maintenance
of per kilometer of road, which is the range calculated by Stripple (2001): namely,
4,000 to 5,500 tonnes per kilometer. However, this range refers not only to
construction, but also to operation and maintenance. Because we calculate
separately the contribution of operation and maintenance (see Section 4 below),
we adjust Stripple's range by deducting components of operation and
maintenance that we account for elsewhere.
1. Each year, lighting on the M6 Toll accounts for 26 tonnes of CO2
emissions per kilometer (see Table 4.2); hence, over 40 years – following
Stripple's period of analysis – 1,040 tonnes.
2. Operating the vehicle fleet involved in the maintenance of the M6 Toll
accounts annually for 178 tonnes of CO2 emissions (see Table 4.3). This,
of course applies to the entire M6 Toll. Hence, we divide by 43.45
kilometers (the length of the M6 Toll) and multiply by 40 years to obtain a
further offset of 163 tonnes.
18
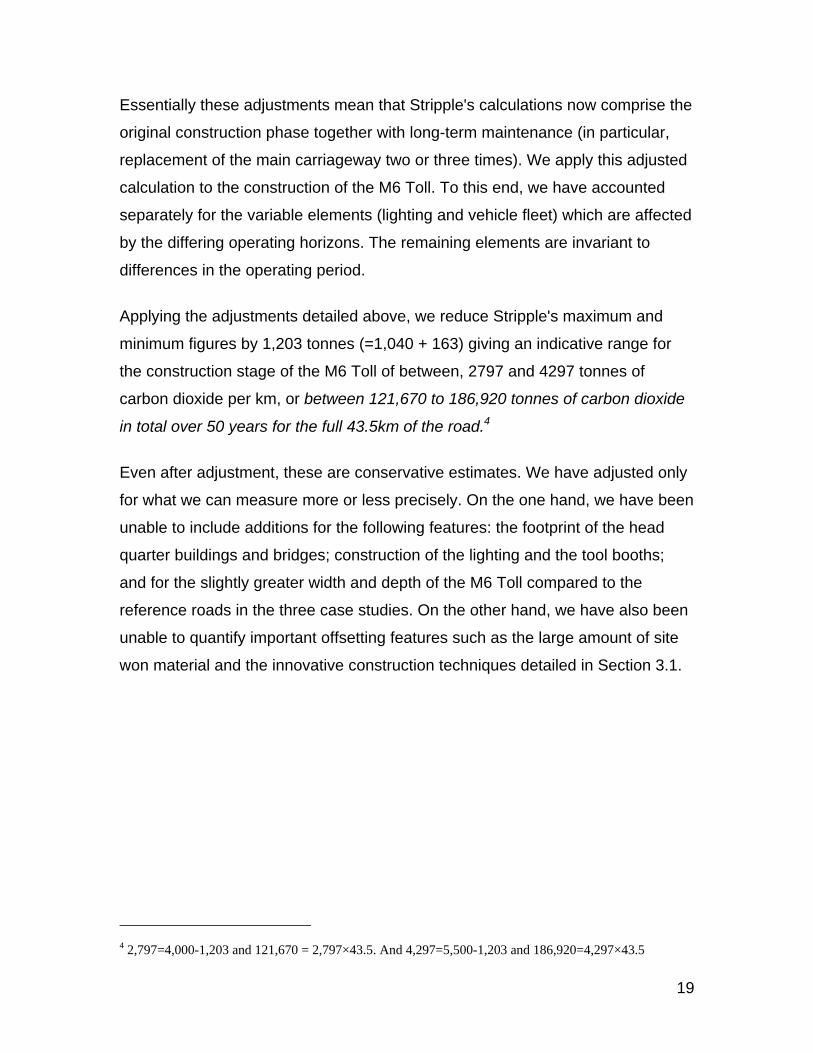
Essentially these adjustments mean that Stripple's calculations now comprise the
original construction phase together with long-term maintenance (in particular,
replacement of the main carriageway two or three times). We apply this adjusted
calculation to the construction of the M6 Toll. To this end, we have accounted
separately for the variable elements (lighting and vehicle fleet) which are affected
by the differing operating horizons. The remaining elements are invariant to
differences in the operating period.
Applying the adjustments detailed above, we reduce Stripple's maximum and
minimum figures by 1,203 tonnes (=1,040 + 163) giving an indicative range for
the construction stage of the M6 Toll of between, 2797 and 4297 tonnes of
carbon dioxide per km, or between 121,670 to 186,920 tonnes of carbon dioxide
in total over 50 years for the full 43.5km of the road.4
Even after adjustment, these are conservative estimates. We have adjusted only
for what we can measure more or less precisely. On the one hand, we have been
unable to include additions for the following features: the footprint of the head
quarter buildings and bridges; construction of the lighting and the tool booths;
and for the slightly greater width and depth of the M6 Toll compared to the
reference roads in the three case studies. On the other hand, we have also been
unable to quantify important offsetting features such as the large amount of site
won material and the innovative construction techniques detailed in Section 3.1.
4 2,797=4,000-1,203 and 121,670 = 2,797×43.5. And 4,297=5,500-1,203 and 186,920=4,297×43.5
19
4 Operation and Maintenance In this section, we present detailed calculations from primary sources, provided
by Midland Expressway Limited, on the contributions to the overall carbon
footprint of the M6 Toll from its toll stations, lighting, vehicle fleet, pumping
station, and long-term maintenance related to traffic volume. We have been
unable to make separate calculations for either Midland Expressway's HQ or for
landscape maintenance. However, these omissions need to be placed in the
context of the relatively minor contribution of operation and maintenance
activities to the overall carbon footprint of the M6 Toll. The data in this section
refer to the year July 1st 2006 to June 30th 2007.
20
4.1 Toll stations
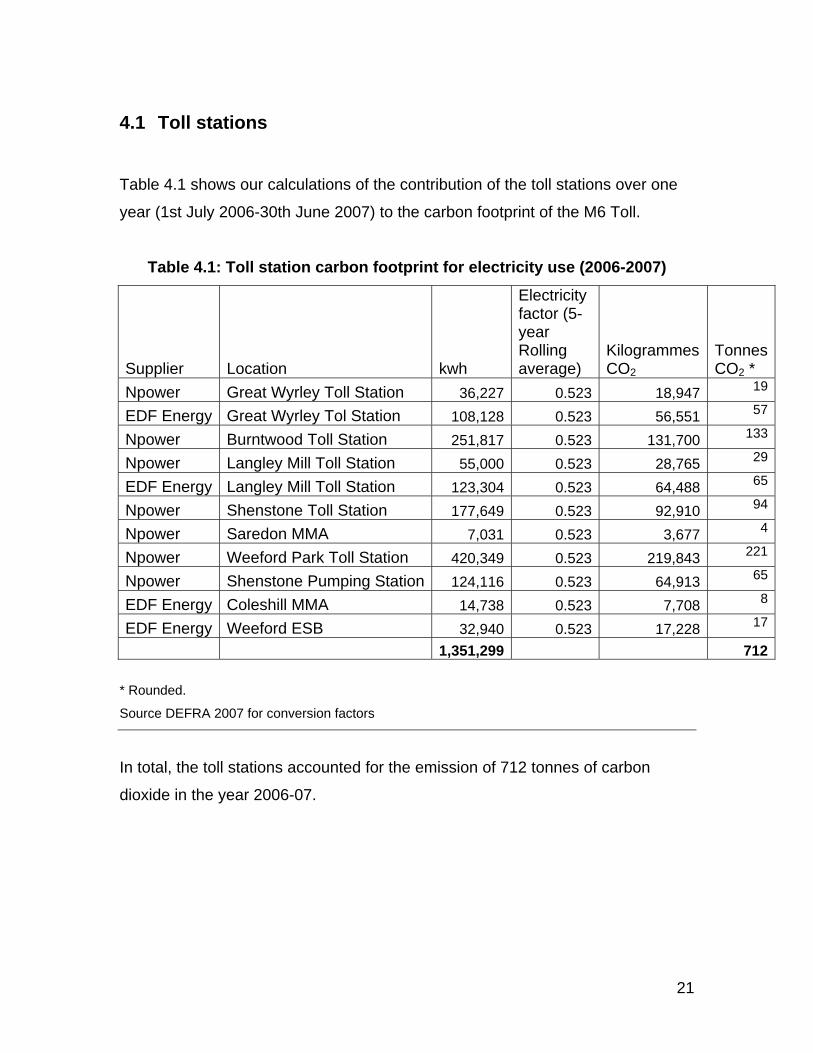
Table 4.1 shows our calculations of the contribution of the toll stations over one
year (1st July 2006-30th June 2007) to the carbon footprint of the M6 Toll.
Table 4.1: Toll station carbon footprint for electricity use (2006-2007)
Supplier Location kwh
Electricity factor (5- year Rolling average)
Kilogrammes CO2
Tonnes CO2 *
Npower Great Wyrley Toll Station 36,227 0.523 18,947 19
EDF Energy Great Wyrley Tol Station 108,128 0.523 56,551 57
Npower Burntwood Toll Station 251,817 0.523 131,700 133
Npower Langley Mill Toll Station 55,000 0.523 28,765 29
EDF Energy Langley Mill Toll Station 123,304 0.523 64,488 65
Npower Shenstone Toll Station 177,649 0.523 92,910 94
Npower Saredon MMA 7,031 0.523 3,677 4
Npower Weeford Park Toll Station 420,349 0.523 219,843 221
Npower Shenstone Pumping Station 124,116 0.523 64,913 65
EDF Energy Coleshill MMA 14,738 0.523 7,708 8
EDF Energy Weeford ESB 32,940 0.523 17,228 17
1,351,299 712
* Rounded.
Source DEFRA 2007 for conversion factors
In total, the toll stations accounted for the emission of 712 tonnes of carbon
dioxide in the year 2006-07.
21
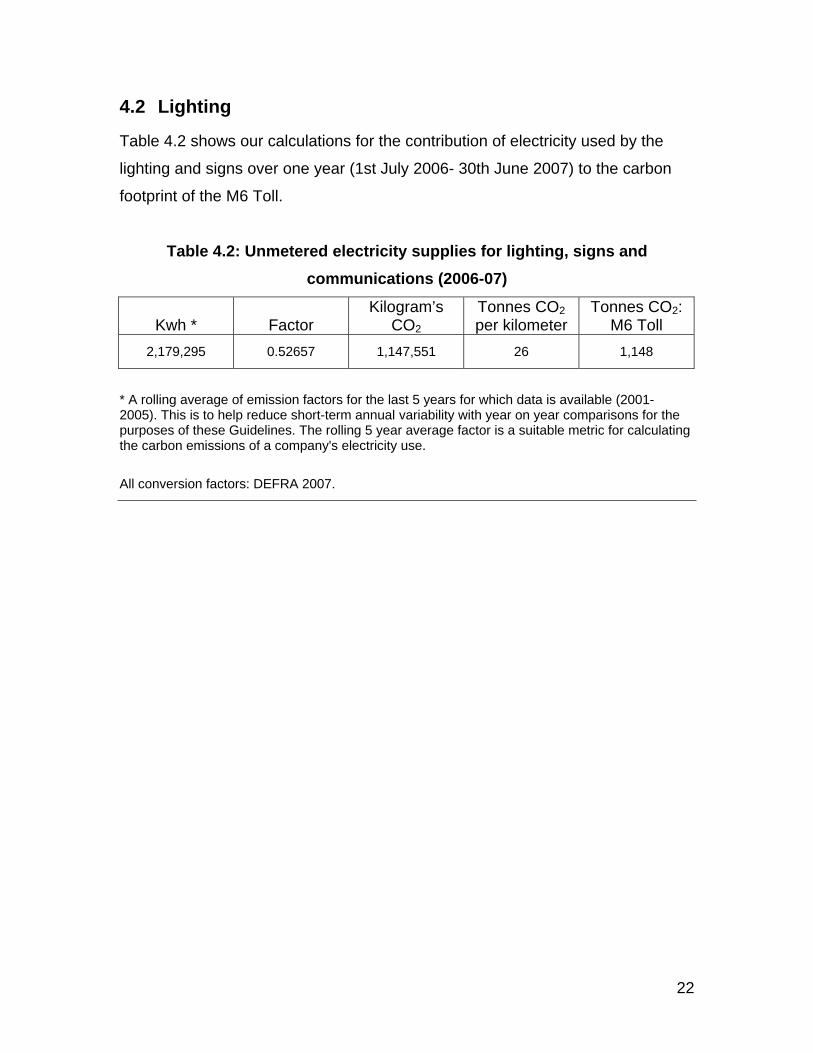
4.2 Lighting
Table 4.2 shows our calculations for the contribution of electricity used by the
lighting and signs over one year (1st July 2006- 30th June 2007) to the carbon
footprint of the M6 Toll.
Table 4.2: Unmetered electricity supplies for lighting, signs and communications (2006-07)
Kwh * Factor Kilogram’s
CO2
Tonnes CO2per kilometer
Tonnes CO2: M6 Toll
2,179,295 0.52657 1,147,551 26 1,148
* A rolling average of emission factors for the last 5 years for which data is available (2001- 2005). This is to help reduce short-term annual variability with year on year comparisons for the purposes of these Guidelines. The rolling 5 year average factor is a suitable metric for calculating the carbon emissions of a company's electricity use.
All conversion factors: DEFRA 2007.
22
4.3 Fleet vehicle activities
These include gritting of the road, litter picks, dealing with motorists who have
broken down or had accidents and lighting repair. As before, the data refer to the
year 1st July 2006-30th June 2007.
Table 4.3 Fleet vehicle emissions on the M6 Toll *
Vehicle type Number
of vehicles
Km/yr Km/l Co2g/km Total Co2 kg
Gritters 5 11,000 3.55 732 40,260
Sweeper 1 3,500 0.75 3,467 12,134.5
Barrier Rig 1 7,000 1.75 1,486 10,402
IPV 1 15,000 3.75 693 10,395
Tipper/crane 1 4,000 3.2 813 3,252
Incident
support vehicle
2 70,000 4.25 612 85,680
Merc Sprinter 1 34,000 9 289 9,826
Merc Vito 1 27,000 11 236 6,372
Peugeot Boxer 2 30,000 10 260 15,600
Peugeot
Partner
1 30,000 14 186 5,580
Vauxhall Astra 1 19,000 17 153 2,907
Toyota Aventis 3 21,500 173 11,158.5
Jeep Cherokee 1 15,000 330 4,950
* Note that mileage is per vehicle: i.e. gritters do 11,000km each per year.
In total, 178.3 tonnes of carbon dioxide emitted in one year.
23
4.4 Pumping station
Storm pumps are used to manage the water table and prevent flooding at some
parts of the site. Here, the calculation proceeds as follows.
Total period of operation over 4 years (July 2003 to Aug 2007)
= 1,400 hours
Average per year = 350 hours
Pumps are powered at 250kw
Number of pumps = 4
Average energy used in a year = 350,000 kwh
(= 4 pumps × 250kw × 350 hours)
Defra conversion factor (5 year rolling average 2001 to 2005 – the latest
available) = 0.523 kg CO2 per kwh (= 350,000 kwh × 0.523 ÷ 1,000)
Annual CO2 = 183.05 tonnes
In total, 183 tonnes of carbon dioxide emitted in a year.
4.5 Maintenance activities
These can be divided into long-term maintenance (e.g. replacement of the main
running surface maybe once every 20 to 25 years) and more routine
maintenance. The associated carbon emissions have been accounted for in
previous sections.
• Emissions associated the long-term maintenance have been accounted
for under Construction (Section 3).
• Routine maintenance activities include:
1. Attending to accidents
2. Repairs to road following accidents
3. Carriageway sweeping
4. Gully emptying
5. Grass cutting
24
The carbon footprint for most of these activities results from the vehicle fleet,
which is accounted for in Section 4.3.
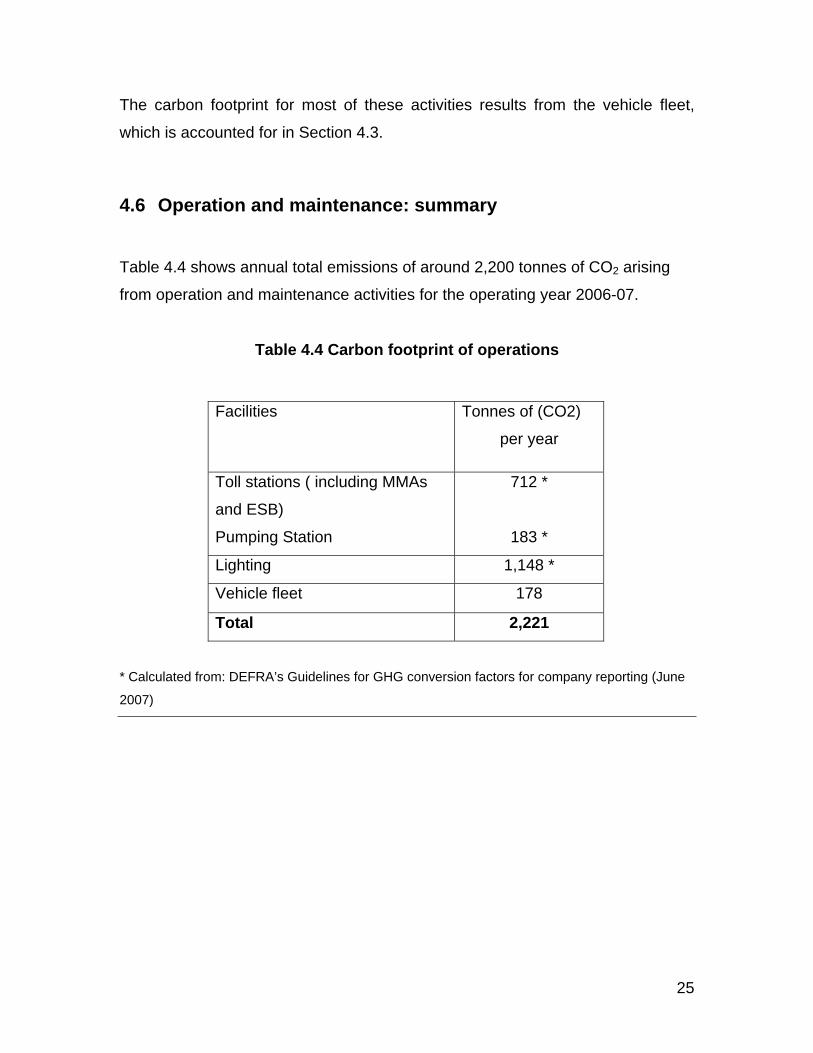
4.6 Operation and maintenance: summary
Table 4.4 shows annual total emissions of around 2,200 tonnes of CO2 arising
from operation and maintenance activities for the operating year 2006-07.
Table 4.4 Carbon footprint of operations
Facilities
Tonnes of (CO2)
per year
Toll stations ( including MMAs
and ESB)
Pumping Station
712 *
183 *
Lighting 1,148 *
Vehicle fleet 178
Total 2,221
* Calculated from: DEFRA’s Guidelines for GHG conversion factors for company reporting (June
2007)
25
5 Traffic The carbon footprint of the M6 Toll is dominated by the contribution of traffic
using the road. The M6 Toll has excellent data on the number and type of
vehicles using the road. Furthermore, 87 percent of the traffic travels the entire
length of the road (see Appendix 2).
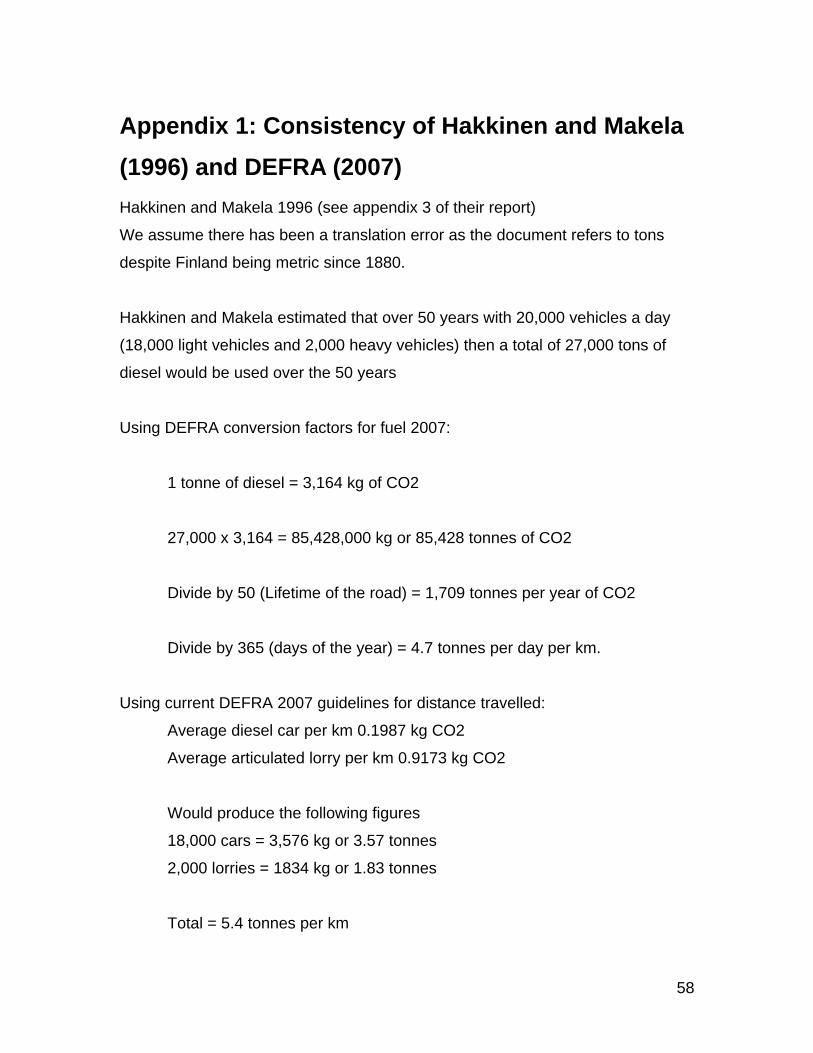
Hakkinen and Makela 1996, estimated 4.7 tonnes of CO2 per km due to traffic
under their scenario (see Appendix 1). Applying the current DEFRA conversion
factors to the M6 Toll with the same scenario as Hakkinen and Makela produces
a value of 5.4 tonnes per km CO2. This suggests that the two studies are aligned
reasonably well. Given that data accuracy and methods have improved in the
past decade, and the inherent modelling assumptions and generalisation
involved, these figures are fairly close. For example, Hakkinen and Makela
(1996, p.55) make the related point:
…any difference in fuel consumption of traffic due to pavement materials
would significantly affect the result. For example, a roughly 0.1 to 0.5 per
cent decrease in fuel consumption … would bring savings of the same
order of magnitude than those from all the other parts of the life cycle of
concrete roads.
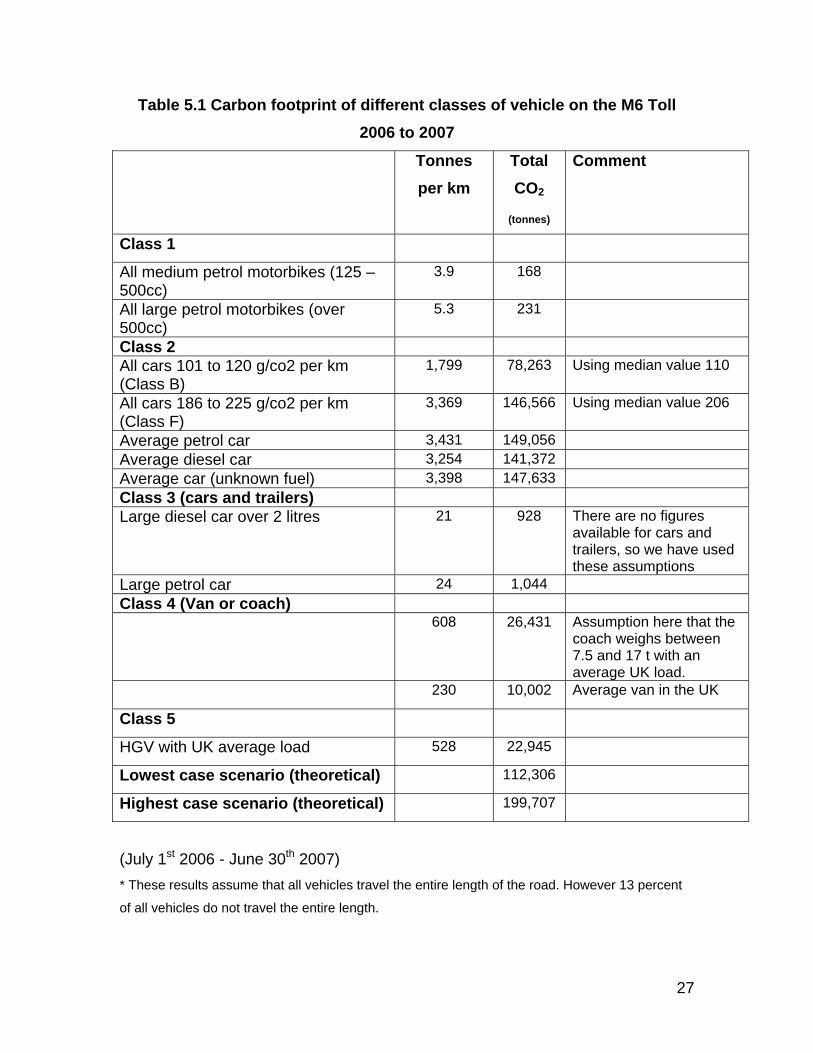
Table 5.1 reports calculations of total carbon dioxide emissions for 2006 to 2007
for each class of vehicle using the M6 Toll. These are calculated by multiplying
the total vehicles in each class by the relevant conversion factors provided by
DEFRA (2007) under the GHG reporting protocol. A range of scenarios are
presented for each class, representing theoretical minimum and maximum totals
(see also Appendix 2 for more detail). Minimum scenarios are calculated using
the minimum factor for each class of vehicle, which is to assume that all vehicles
in a given class belong to the lowest emissions category; and vice versa for the
maximum scenarios.
26
Table 5.1 Carbon footprint of different classes of vehicle on the M6 Toll 2006 to 2007
Tonnes per km
Total CO2
(tonnes)
Comment
Class 1
All medium petrol motorbikes (125 – 500cc)
3.9 168
All large petrol motorbikes (over 500cc)
5.3 231
Class 2 All cars 101 to 120 g/co2 per km (Class B)
1,799 78,263 Using median value 110
All cars 186 to 225 g/co2 per km (Class F)
3,369 146,566 Using median value 206
Average petrol car 3,431 149,056 Average diesel car 3,254 141,372 Average car (unknown fuel) 3,398 147,633 Class 3 (cars and trailers) Large diesel car over 2 litres 21 928 There are no figures
available for cars and trailers, so we have used these assumptions
Large petrol car 24 1,044 Class 4 (Van or coach) 608 26,431 Assumption here that the
coach weighs between 7.5 and 17 t with an average UK load.
230 10,002 Average van in the UK
Class 5
HGV with UK average load 528 22,945
Lowest case scenario (theoretical) 112,306
Highest case scenario (theoretical) 199,707
(July 1st 2006 - June 30th 2007) * These results assume that all vehicles travel the entire length of the road. However 13 percent
of all vehicles do not travel the entire length.
27
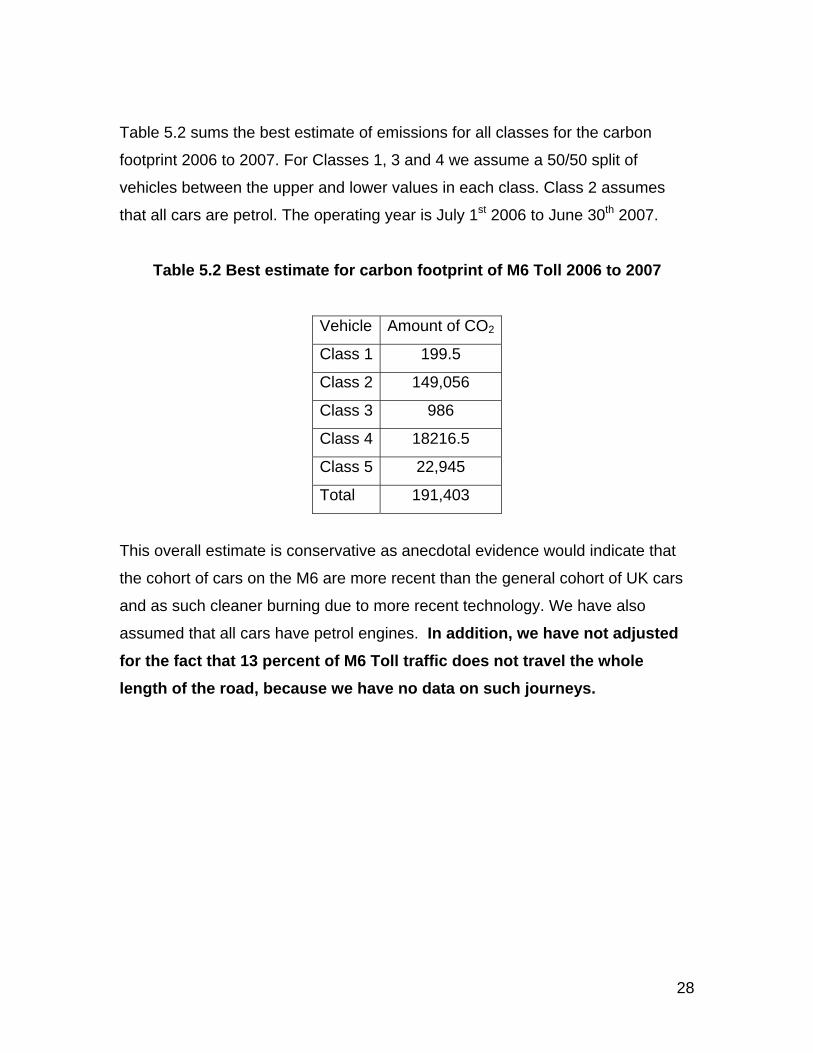
Table 5.2 sums the best estimate of emissions for all classes for the carbon
footprint 2006 to 2007. For Classes 1, 3 and 4 we assume a 50/50 split of
vehicles between the upper and lower values in each class. Class 2 assumes
that all cars are petrol. The operating year is July 1st 2006 to June 30th 2007.
Table 5.2 Best estimate for carbon footprint of M6 Toll 2006 to 2007
Vehicle Amount of CO2
Class 1 199.5
Class 2 149,056
Class 3 986
Class 4 18216.5
Class 5 22,945
Total 191,403
This overall estimate is conservative as anecdotal evidence would indicate that
the cohort of cars on the M6 are more recent than the general cohort of UK cars
and as such cleaner burning due to more recent technology. We have also
assumed that all cars have petrol engines. In addition, we have not adjusted for the fact that 13 percent of M6 Toll traffic does not travel the whole length of the road, because we have no data on such journeys.
28
5.1 A note on DEFRA conversion factors 2007
All conversion factors are from the Defra 2007 GHG report. The exception is
some of the class 2 figures in which we have also used actual manufacturers'
data and Department of Transport values, which are used for vehicle licensing
(see Table 5.3).
These factors are the estimated average values of the UK car fleet in 2005
travelling on average trips in the UK. They are calculated based on data from
Society of Motor Manufacturers & Traders Ltd (SMMT) on new car CO2
emissions from 1997 to 2005 combined with factors from the Transport Research
Laboratory as functions of the average speed of vehicles derived from test data
under real world testing cycles (see Appendix 3) and an uplift of 15 percent
agreed with Department of Transport to take into account further real world-
driving effects on emissions relative to test-cycle based data.
Table 5.3 Classification of vehicle emissions
Grams carbon dioxide per km
Median value
Number of models
Percentage of all cars
A 0 to 100 99 2 0.04 B 101 to 120 110 168 3.61 C 121 to 150 135 733 15.77 D 151 to 165 158 747 16.07 E 166 to 185 175 829 17.83 F 186 to 225 206 1289 27.73 G 225 + 881 18.95
Source: Vehicle licensing authority and Carpages 2007
DEFRA’s 2007 official GHG conversion factors in Annex 6 (210 grams per km for
an average petrol car, 199 grams per km for average diesel car) equate to
assuming that all the cars in the UK are in class F, which is the second highest
29
class. It is worth noting that while class F does have the highest number of
models that does not equate to the highest number of actual sales.
30
6 Carbon footprint of the M6 Toll (2006-07): summary
Sections 3, 4 and 5 have quantified the respective contributions of construction,
operation and maintenance and traffic use to the carbon footprint of the M6 Toll.
These are summarised in Table 6.1 for the operating year July 1st 2006 to June
30th 2007.
Table 6.1: Overall carbon footprint for the M6 Toll (tonnes of CO2) (2006 to 2007)
Lower
limit
Upper
limit
Comment
Construction and some
general maintenance
2,433 *
3,738 *
Adjustments from secondary
sources
Operation and
maintenance:
M6 Toll vehicle fleet 178 Actual figure
Lighting 1,148 Actual figure
Toll stations 712 Actual figure
Pumping station 183 Actual figure
General traffic 191,403 Best estimate from primary
data (assuming all cars petrol)
Indicative total
196,057
197,362
* For the construction stage of the M6 Toll, we reported above (p.19) an indicative range of
between 121,670 to 186,920 tonnes of carbon dioxide in total over 50 years for the full 43.5km of
the road. Annualised, 121,670÷50=2,433; and 186,920÷50=3,738.
31
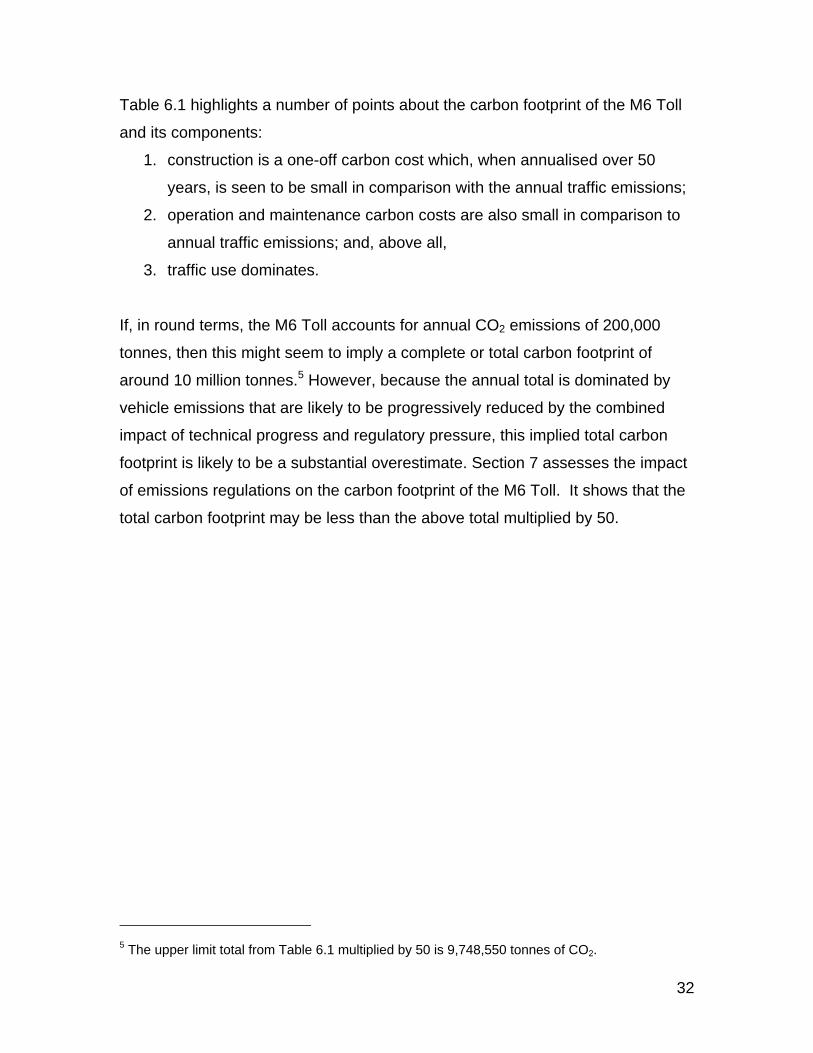
Table 6.1 highlights a number of points about the carbon footprint of the M6 Toll
and its components:
1. construction is a one-off carbon cost which, when annualised over 50
years, is seen to be small in comparison with the annual traffic emissions;
2. operation and maintenance carbon costs are also small in comparison to
annual traffic emissions; and, above all,
3. traffic use dominates.
If, in round terms, the M6 Toll accounts for annual CO2 emissions of 200,000
tonnes, then this might seem to imply a complete or total carbon footprint of
around 10 million tonnes.5 However, because the annual total is dominated by
vehicle emissions that are likely to be progressively reduced by the combined
impact of technical progress and regulatory pressure, this implied total carbon
footprint is likely to be a substantial overestimate. Section 7 assesses the impact
of emissions regulations on the carbon footprint of the M6 Toll. It shows that the
total carbon footprint may be less than the above total multiplied by 50.
5 The upper limit total from Table 6.1 multiplied by 50 is 9,748,550 tonnes of CO2.
32
7 The time path for emissions and the total cumulative carbon footprint
In this section we provide a range of scenarios indicating how the annual
contribution to the cumulative carbon footprint of the M6 Toll may change due to
EU and/or domestic policy.
Total carbon dioxide emissions arising from the operation of the M6 Toll cannot
be obtained accurately by calculating the carbon footprint for one year and
multiplying by the anticipated years of operation. Instead, we take into account
that emissions will vary from year to year according to two main influences:
namely, traffic flow and emissions regulations. On the one hand, the number of
vehicles using the M6 Toll will rise over time, which - other factors held constant -
will increase emissions and, hence, the carbon footprint of the M6 Toll by
increasing amounts in each successive year. On the other hand, UK and EU
regulations, targets and best practice guidelines will reduce emissions per
vehicle, which - other factors held constant - will reduce the carbon footprint of
the M6 Toll in each successive year. Accordingly, the time path of CO2
emissions, hence the total carbon footprint of the M6 Toll, will be determined by
two forces pulling in opposite directions.
This section outlines a simple method, implemented by spreadsheet calculations,
to take both forces into account and so calculate the time path of carbon dioxide
emissions for the M6 Toll over the 50 year period 2005-2054. The carbon
footprint of the M6 Toll can then be calculated as the carbon dioxide emissions in
2004, the first incomplete year of operation, plus the estimated total emissions to
be accumulated over the following 50 years. We assume that each tonne of
carbon dioxide emissions is equally damaging to the environment irrespective of
its period of emission; hence, future emissions are not discounted.
33
To calculate the time path of carbon dioxide emissions for the M6 Toll, we first
consider two limiting cases for traffic flow:
1. the traffic forecasts by Faber Maunsell, which project a steady rise of
vehicles per day from 44,200 in 2004 to 47,975 in 2008 and 153,077 in
2054; and
2. the traffic forecasts by Faber Maunsell truncated at a capacity limit of
80,000 vehicles per day from 2022 onwards, which can be enforced by
appropriate pricing.
Secondly, we consider three successively more demanding limits to vehicle
emissions:
1. a reduction, according to an EU Commission Directive, from an average
emission from cars of 210 grams of CO2 per kilometre in 2005 to 120
grams of CO2 per kilometre for all cars produced in 2012 and later
(Council of the European Union 2008);
2. a further and recently mooted reduction to 100 grams of CO2 per
kilometre for all cars produced in 2020 and beyond proposed by the British
Government in submission to the EU Commission’s proposals (Council of
the European Union 2008) ; and
3. a zero emissions target recently propounded by David Milliband (2007) for
all cars produced by 2030 and beyond
These apply to the “average” car only; further refinement of these calculations
have the potential to take into account the whole profile of vehicles using the M6
Toll.6
To model the implications of these successively more demanding policy regimes,
we distinguish between the flows of new cars that will be subject to these limits
6 New calculations can be made as and when policy is enacted with respect to other vehicle classes.
34
and the impact of these flows on the total stock of cars. We assume that the life
of an average car is 10 years and that one-tenth of all cars is replaced every
year. Accordingly, our method of calculation takes into account overlapping
generations of cars in the total stock. We assume that linear declines in
emissions will take place from the initial level of emissions to the first target
(2005-2012), from the first target to the second target (2013-2020) and from the
second target to the third and final zero emissions target (2021-2030)7. For
example, from 2005 to 2012, emissions from new cars are assumed to decline as
follows in Table 7.1:
Table 7.1: Assumed decline in average emissions per car 2005 to 2012 (grams CO2 per kilometre)
2005 2006 2007 2008 2009 2010 2011 2012
210 197 184 171 159 146 133 120
Next, we calculate the impact of the regulatory limit on emissions from the stock
of cars. For example, in 2006, cars manufactured in 2006 comprise 10 percent of
the stock while cars manufactured in 2005 or earlier comprise 90 percent of the
stock. Hence, emissions per car per kilometre decline from 210 in 2005 to a
weighted average of 208.71 (= 0.9×210 + 0.1×197) in 2006. In the following year,
emissions per car per kilometre decline to 206.14 (= 0.8×210 + 0.1×197 +
0.1×184) … and so on. At first, the reduction is slow, because only new vehicles
are reducing total emissions. It takes until 2021, when all cars are produced
during or after 2012, for the whole stock of cars to meet the 2012 target of 120
grams per kilometre. We apply the same principles to the 2020 and 2030 targets:
by the same method, we calculate that the former will be achieved for all cars in
2029 and the latter in 2039. Once we have calculated the average emissions - in 7 Of course, a linear decline (i.e., equal annual reductions in absolute terms) entails an increasing rate of reduction (i.e., rising percentage reductions). This may be realistic if we allow for continuous technical improvements rather than assuming diminishing returns from the application of current technologies.
35
grams per kilometre - for the stock of cars in each year, we multiply by the
average daily number of cars using the M6 Toll and adjust for the number of
kilometres and days of the year to estimate the tonnes of CO2 arising from the
operation of the M6 Toll in each year 2005-2054.8
The two limiting cases for traffic flow together with the three regulatory regimes
yield six scenarios. These are depicted in Figures 7.1 and 7.2. These scenarios apply only to cars, which made up 91.5 percent of total traffic using the M6 Toll
in 2006-07.
• Figure 7.1 shows the time path of total C02 emissions associated with the
M6 Toll from 2005 to 2054 in tonnes per year on the assumption of daily
traffic flow rising steadily to 153,077 in 2054 (this figure is then adjusted
for cars only).
• Figure 7.2 shows the time path of C02 emissions associated with the M6
Toll from 2005 to 2054 in tonnes per year on the assumption that daily
traffic flow rises steadily to a capacity of 80,000 vehicles per day in 2022
and remain at this level thereafter (this figure is then adjusted for cars
only).
8 The following calculations are for cars only; as data becomes available, the results will be
further adjusted for the types of traffic (mainly HGVs) in the 8.5 percent of total traffic not
accounted for in these calculations. In addition, we do not adjust for the likelihood that cars using
the M6 Toll are likely to be company cars and thus of a younger vintage than in the averages
used to calculate Figures 7.1 and 7.2; or that not all cars travel the whole length of the M6 Toll.
We have also ignored leap years.
36
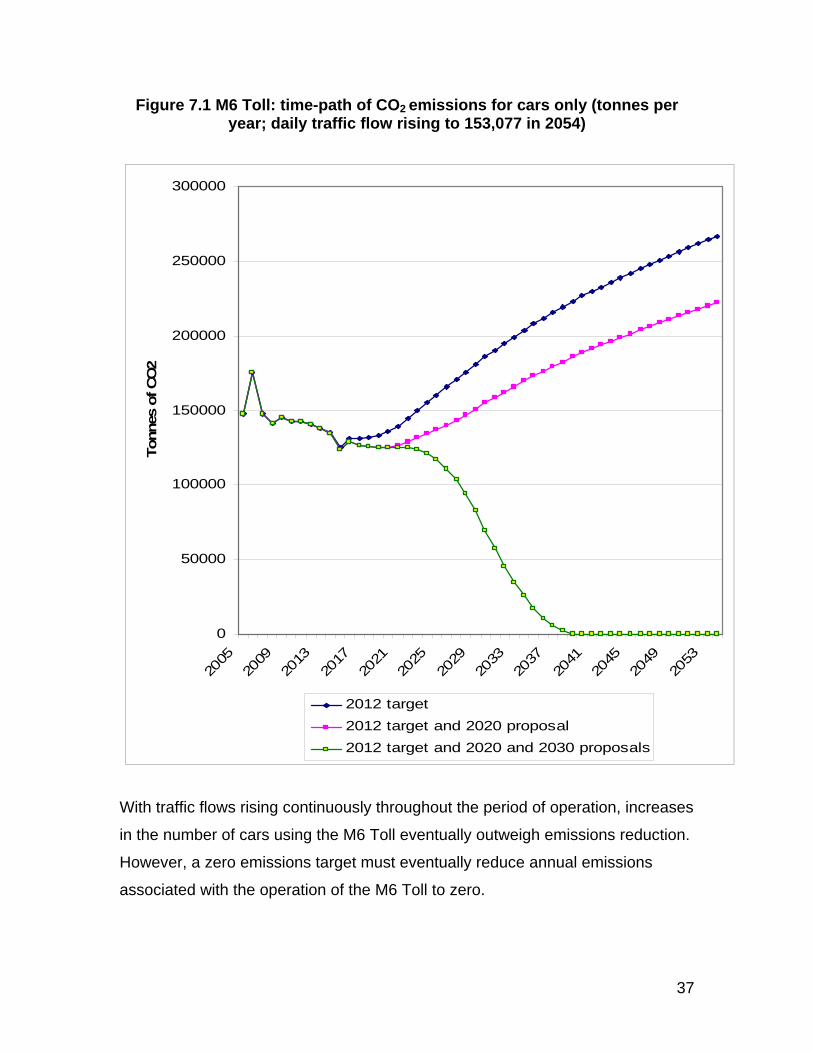
Figure 7.1 M6 Toll: time-path of CO2 emissions for cars only (tonnes per year; daily traffic flow rising to 153,077 in 2054)
0
50000
100000
150000
200000
250000
300000
2005
2009
2013
2017
2021
2025
2029
2033
2037
2041
2045
2049
2053
Tonn
es o
f CO
2
2012 target2012 target and 2020 proposal2012 target and 2020 and 2030 proposals
With traffic flows rising continuously throughout the period of operation, increases
in the number of cars using the M6 Toll eventually outweigh emissions reduction.
However, a zero emissions target must eventually reduce annual emissions
associated with the operation of the M6 Toll to zero.
37
Figure 7.2 M6 Toll: time-path of CO2 emissions for cars only (tonnes per year; daily traffic flow rising to capacity of 80,000 vehicles per day from
2022 onwards)
0
20000
40000
60000
80000
100000
120000
140000
160000
180000
200000
2005
2007
2009
2011
2013
2015
2017
2019
2021
2023
2025
2027
2029
2031
2033
2035
2037
2039
2041
2043
2045
2047
2049
2051
2053
Tonn
es o
f CO
2
2012 target2012 target and 2020 proposal2012 target and 2020 and 2030 proposals
When traffic flows on the M6 Toll are capped at 80,000 vehicles per day, reduced
emissions contain and outweigh the effect of additional journeys. In the case of
the 2012 target, emissions first fall and then rise again to plateau at around
140,000 tonnes per year. In the case of the 2020 target also being implemented,
total emissions fall more or less continuously until about half way through the
period of operation and then plateau at a little under 120,000 tonnes per year.
38
Again, a zero emissions target has particularly benign implications for the carbon
footprint of the M6 Toll.
7.1 The total cumulative carbon footprint of the M6 Toll
We conclude this section by calculating the total or cumulative carbon footprint of
the M6 Toll under the different assumptions investigated in this section. From
Section 5, we have a first approximation of the total carbon footprint over the 50-
year operating horizon of the M6 Toll: 9,748,550 or around 10 million tonnes of
CO2. We now compare the total carbon footprint under each combination of the
two assumptions about traffic flow and the three policy regimes explored above.
The method of calculation takes into account that the annual sums displayed
graphically in Figures 7.1 and 7.2 are for cars only. Accordingly, we make the
following adjustments to calculate the time path of total emissions of carbon
dioxide associated with the M6 Toll.
1. First, we adjust for the multiple of our best estimate of the carbon
emissions accounted for by all vehicle classes using the M6 Toll over that
accounted for by the average car. From Table 5.2, we see that for the
operating year 2006-07 191,403 tonnes of carbon dioxide were emitted by
all vehicles using the M6 toll. This is approximately 1.3 times the
emissions from cars; namely, 147,633 tonnes (see Table 5.1).
Accordingly, we multiply each year’s emissions from cars by 1.3. This
assumes a constant ratio of emissions from vehicles other than cars to
emissions from cars. We do this, because (at the time of writing)
regulatory requirements for greenhouse gas emissions from vehicles other
than cars have not yet been formulated and enacted.9 Of course, this
imparts a very conservative bias to our calculations. 9 At the time of writing (April 2008), regulations on emissions for vehicles other than cars had not
yet been enacted. However, moves in this direction, especially for heavy goods vehicles, were
39
2. Second, to each of these adjusted annual sums for traffic emissions is
added a fixed amount for construction and operation and maintenance.10
The result is the annual total carbon footprint for the M6 Toll in each year from
2005 to 2054. The total or cumulative carbon footprint under different
assumptions is calculated by summing these annual totals. The results are
displayed in Table 7.2.
Table 7.2: The total carbon footprint of the M6 Toll under different
assumptions (tonnes) (2005-2054) *
Assumptions on policy regimes
Limiting assumptions on traffic flow
2012 target 2012 target
& 2020 proposal
2012 target
& 2020 proposal
& 2030 proposal
Minimum (rising to
80,000/day from 2022 9,319,329 8,299,555 4,532,551
Maximum (rising to
153,000/day in 2054 12,507,653 10,959,436 4,780,086
* Including construction, operation and maintenance, and total traffic flow (i.e., all vehicle classes)
underway (Commission of the European Communities, 2007): “In order to monitor the contribution
of this sector to the global emissions of greenhouse gases (GHG) the Commission should
introduce measuring of fuel consumption and carbon dioxide emissions of heavy duty vehicles …
The Commission shall, in accordance with the procedure referred to in Article 39(9) of Directive
2007/46/EC, adopt measures for the implementation of this Article. These measures shall
concern the following … carbon dioxide emissions and fuel consumption.” Once available,
regulations on emissions reductions will enable refinement of the calculations reported in
Sections 7 and 10. 10 This fixed annual amount is 5,307 tonnes of CO2, comprising 3,086 for construction
(annualised from the average of the lower and upper estimates in Table 6.1) and 2,221 for
operation and maintenance (the sum of this category in Table 6.1).
40
The strictest emissions regulations together with the lowest projected traffic flow
yield the smallest carbon footprint; and vice versa. According to the differing
assumptions investigated in this section, in round terms the total carbon footprint
of the M6 Toll is likely to fall within a range of between 4½ and 12½ million tones
of CO2.
If traffic flows rise above the intended capacity of the M6 Toll, emissions effects
are likely to be accelerated (hence, to rise in a non-linear manner): for example,
maintenance requirements will increase; rush hour effects and lower overall
speeds are likely to cause engines to burn fuel inefficiently; and there are likely to
be proportionally higher levels of accidents. In brief, at traffic volumes in excess
of planned capacity, the M6 Toll would increasingly acquire the characteristics of
the road it is intended to relieve, the M6. The next section compares in more
detail the carbon footprint of the M6 Toll with a similar stretch of the M6.
41
8 Carbon footprint of the M6 comparison It has not been possible to get such good data for the comparator M6 stretch as
for the M6 Toll. However, the most important part of the carbon footprint is the
traffic flow, for which reasonable data is available. Moreover, we can provide a
qualitative summary and comparison for other aspects of the carbon footprint of
the M6.
Construction Qualitatively the construction footprint for the M6 was almost certainly higher than
that of the M6 Toll, as a section of the M6 motorway is on viaduct and was built
much earlier when energy efficiency standards in the economy as a whole were
lower.
Operation and Maintenance The M6 was built to carry 80,000 vehicles per day. It is currently estimated to be
carrying twice that level. The effects of carrying that much traffic are as follows.
1. Higher traffic leads to higher general maintenance.
2. Longer rush hours and lower overall speeds, which cause engines to
burn fuel inefficiently.
3. Proportionally higher levels of accidents (see Atkins 2005 for more
details).
4. More maintenance, because part of the road is on viaduct.
Traffic estimation Both Atkins (2005) estimates and MEL data suggest that about 8 percent of the
vehicles on the M6 Toll are HGVs. In contrast, on the M6 HGVs account for
between 27 and 35 percent of all traffic. Atkins (2005) provides useful data on
vehicle flows for the M6 compared with the M6 Toll.
42
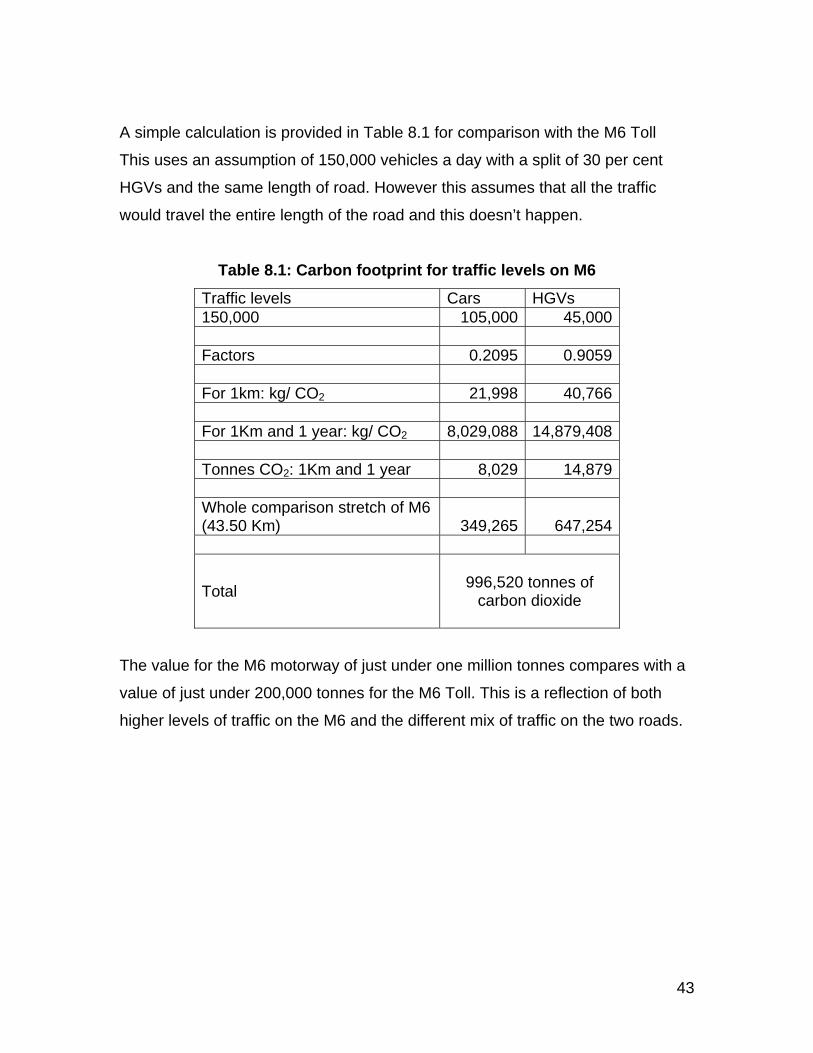
A simple calculation is provided in Table 8.1 for comparison with the M6 Toll
This uses an assumption of 150,000 vehicles a day with a split of 30 per cent
HGVs and the same length of road. However this assumes that all the traffic
would travel the entire length of the road and this doesn’t happen.
Table 8.1: Carbon footprint for traffic levels on M6
Traffic levels Cars HGVs 150,000 105,000 45,000 Factors 0.2095 0.9059 For 1km: kg/ CO2 21,998 40,766 For 1Km and 1 year: kg/ CO2 8,029,088 14,879,408 Tonnes CO2: 1Km and 1 year 8,029 14,879 Whole comparison stretch of M6 (43.50 Km) 349,265 647,254
Total
996,520 tonnes of
carbon dioxide
The value for the M6 motorway of just under one million tonnes compares with a
value of just under 200,000 tonnes for the M6 Toll. This is a reflection of both
higher levels of traffic on the M6 and the different mix of traffic on the two roads.
43
9 Policy options
In this section we discuss the options for MEL to reduce emissions (both directly
and indirectly), examine the issue of offsetting and provide a guide to the offset
already achieved through their management of the landscape surrounding the
M6 Toll.
9.1 Reducing emissions
Before companies start to offset they should first reduce emissions as much as
they can. For MEL this means considering the following options:
1. Reducing energy use on site.
2. Sourcing energy with a smaller carbon footprint; Section 9.2 provides a
good example of the savings that can be made in this way.
3. Changing the behaviour of M6 Toll users.
DEFRA has had behaviour change as a major policy driver across a wide range
of environmental topics over the last 12 months. One such campaign is the pan
European Eco-drive initiative,
Ecodriving is about driving in a style suited to modern engine technology:
smart, smooth and safe driving techniques that lead to average fuel
savings of 5-10%.
MEL could promote the eco-drive campaign http://www.ecodrive.org/ possibly on
the back of tickets, on their website, on gantry signs or other types of promotion.
This campaign covers nine members of the EU, and in the UK the lead
To illustrate this principle, Figure 10.1 extends the calculations reported in
Section 7 to chart the time paths of the per user cost of carbon for the M6 Toll.
The underlying calculations proceed as follows.
1. We adjust the time paths calculated for the carbon footprint of cars using
the M6 Toll to give time paths for all vehicles. We use the scaling factor of
1.3, which as we explain in Sections 7.1 and 10.2 is a conservative
approach.
2. We further adjust the time paths to include both fixed construction and
recurring operation and maintenance costs.
3. We assume that traffic flow rises to 80,000 vehicles per day from 2022
onwards.11
4. Finally, we calculate time paths for the user cost of carbon under all
combinations of two sets of assumptions:
a. the three, successively more strict policy regimes described in
Section 7; and
b. two prices of carbon – 35 euros per tonne (assumed in Table 10.1)
and the100 euros per tonne as suggested at the recent Living in a
Low Carbon World Conference 2008 as the price necessary to
enforce serious behavioural change
(http://conference.lowcarbonworld.net/ ).
Figure 10.1 plots the time path for each set of assumptions. The upper cluster of
three lines represents the impact on the user cost of carbon priced at 100 euros
per tonne under the successively more strict emissions regulations; the lower
cluster shows the impact of carbon priced at 35 euros per tonne under the same
three standards.
11 Of the two assumptions regarding traffic flow used in Section 7, this is the more plausible: drivers would have little reason to pay to use a congested toll road; and the toll operator can always limit use by raising the price.
All medium petrol motorbikes (125 - 500cc) 0.0939 3.9 168.4 All large petrol motorbikes (over 500cc) 0.1286 5.3 230.6 Source DEFRA 2007
Class 2 Scenarios
Factor kg Co2 per km Tonnes per km
Multiplied by length of road 43.5 km
Average petrol car 0.2095 3,431 149,056 Average diesel car 0.1987 3,254 141,372
Average car (unknown fuel) 0.2075 3,398 147,633
Factor g per km Total All 101 to 120 (B class)
110 g per km78,263
186 to 225 (F class) 206 g per km 146,566
Class 3 scenarios
Factor kg Co2 per km Tonnes per km
Length of road 43.5km
Assume large diesel car over 2 litre 0.2635 21 928
Assume large petrol car 0.2964 24 1,044
60
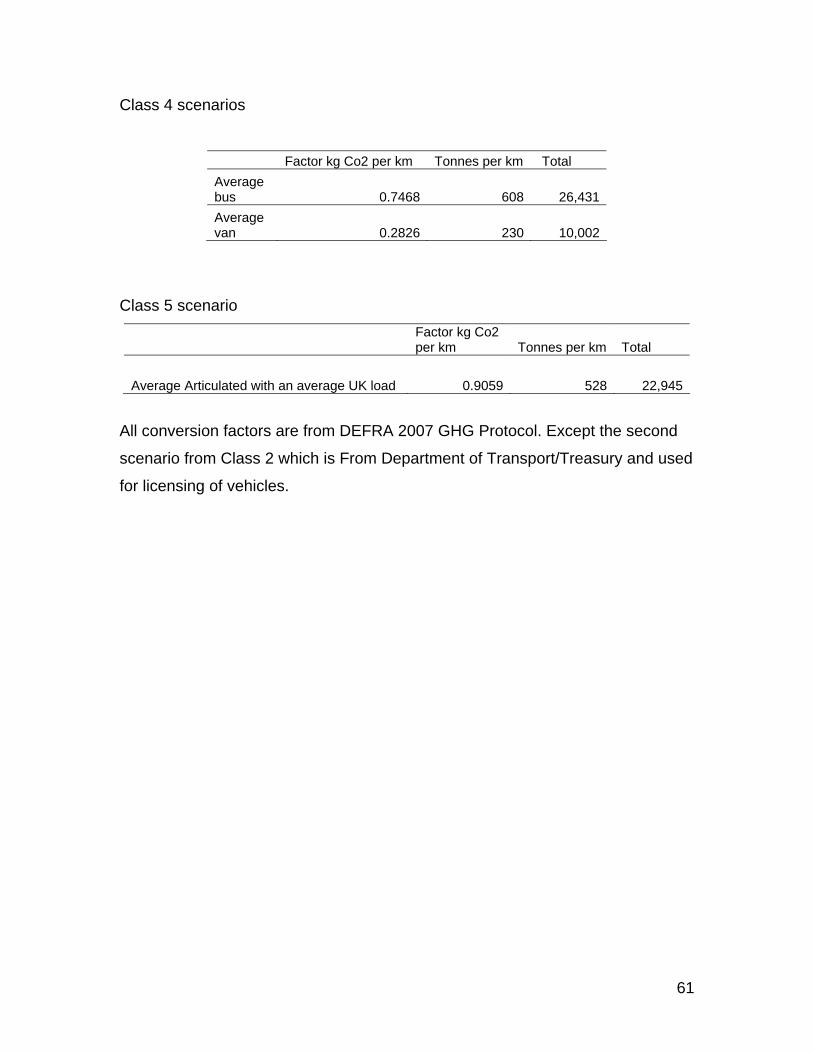
Class 4 scenarios
Factor kg Co2 per km Tonnes per km Total Average bus 0.7468 608 26,431 Average van 0.2826 230 10,002
Class 5 scenario
Factor kg Co2 per km Tonnes per km Total
Average Articulated with an average UK load 0.9059 528 22,945
All conversion factors are from DEFRA 2007 GHG Protocol. Except the second
scenario from Class 2 which is From Department of Transport/Treasury and used
for licensing of vehicles.
61
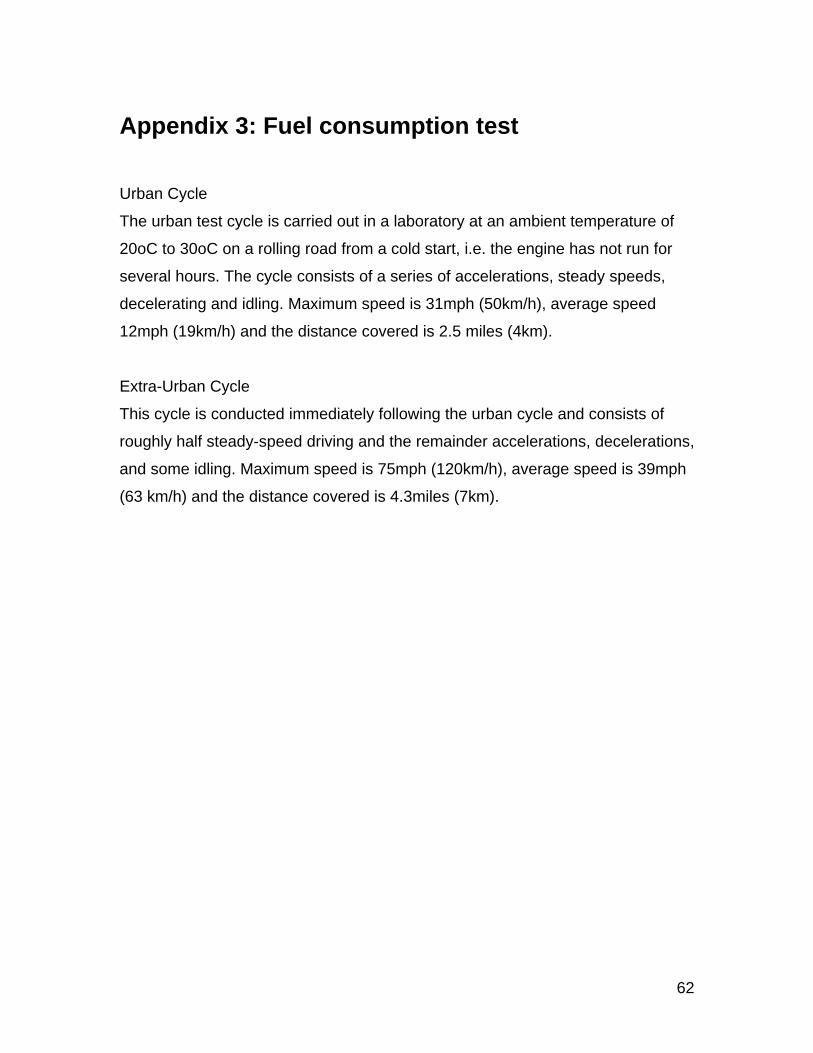
Appendix 3: Fuel consumption test
Urban Cycle
The urban test cycle is carried out in a laboratory at an ambient temperature of
20oC to 30oC on a rolling road from a cold start, i.e. the engine has not run for
several hours. The cycle consists of a series of accelerations, steady speeds,
decelerating and idling. Maximum speed is 31mph (50km/h), average speed
12mph (19km/h) and the distance covered is 2.5 miles (4km).
Extra-Urban Cycle
This cycle is conducted immediately following the urban cycle and consists of
roughly half steady-speed driving and the remainder accelerations, decelerations,
and some idling. Maximum speed is 75mph (120km/h), average speed is 39mph
(63 km/h) and the distance covered is 4.3miles (7km).
62
Appendix 4: Electricity carbon factors
Notes from DEFRA 2007 A rolling average of emission factors for the last 5 years for which data is available (2001- 2005). This is to help reduce short-term annual variability with year on year comparisons for the purposes of these Guidelines. The rolling 5 year average factor is a suitable metric for calculating the carbon emissions of a company's electricity use. Emissions reductions from activities that bring about short term electricity savings (such as switching off lights and computers a night, reducing air conditioning and heating use, etc.) can be calculated using this factor. The long-term marginal factor assumes that, over a long time period (a decade or more) avoided electricity use will displace generation at a new Combined Cycle Gas Turbine (CCGT) plant. Policies and measures that produce long-term reductions in electricity use should therefore use this factor to assess what carbon saving will result. When calculating emissions reductions based on long term investment decisions (for example, building zero carbon housing or business premises, investing in on-site renewables etc.) companies should use this factor. Carbon savings used for the purposes of Climate Change Agreements (CCAs) have historically been calculated using this factor, and it should continue to be used for this purpose. The conversion factor for electricity from CHP may be used only for the percentage of the electricity sourced from your supplier that has been produced from CHP meeting the 'Good Quality CHP' criterion of the CHPQA programme. If you use all the output of a Combined Heat and Power plant to meet the energy needs of your business, you need not attribute the emissions from the plant between the energy and heat output - please refer to Annex 2 for this calculation. Otherwise the regular electricity emission factor should be applied. A zero conversion factor can only be applied if your company has entered into a renewables source contract with an energy supplier that has acquired Climate Change Levy Exemption Certificates (LECs) for the electricity supplied to you as a non-domestic electricity consumer.