__________________________________________________________ AN ASSESSMENT OF THE CAUSES OF LOW PRIMARY SCHOOL ENROLMENT IN THE URBAN PERIPHERIES OF ADDIS ABABA CITY ADMINISTRATION By: Berhan Hailu Amina Menur Arega Mamaru Shewangizaw Abebe Submitted To: Addis Ababa City Administration Education Bureau December, 2009, Addis Ababa, Ethiopia
Submitted To: Addis Ababa City Administration Education Bureau
December, 2009, Addis Ababa,
Ethiopia
ACKNOWLEDGEMENTS
First and foremost, we are indebted to Addis Ababa City Administration
Education Bureau for the necessary support provided from the inception up to
the completion of this study. Next, we would like to thank the sub city and
Kebele education offices for their unassuming collaboration in the provision of
the necessary information that was instrumental for the sampling process.
Our deep gratitude should also go to the heads of households, Parent-
Student-Teacher Associations (PSTA), and principals of the sample schools
who devoted a substantial part of their time in providing us with the
necessary data/information. Without their generous participation, this study
would not have been realized.
Thanks are also due to the data collectors who travelled long distances on
foot under tight conditions to reach sampled households and who managed
to collect the necessary data/information on due time.
We are particularly indebted to Ato Bishaw Mekonen from kebele 01 (Lebu
Kebele) administration office of Nifas- Silk-Lafto Sub-City, for his selfless
assistance and commitment to travel and guide us to households that
demanded about 15 kilometres walk.
i
TABLE OF CONTENTS PAGE
ACKNOWLEDGEMENTS ...............................................................................i LIST OF TABLES........................................................................................ iv LIST OF FIGURES....................................................................................... v LIST OF ACRONYMS AND ABBREVIATIONS ...............................................vi ABSTRACT ...............................................................................................vii
CHAPTER ONE INTRODUCTION
1.1. Background ................................................................................................3 1.2. Statement of the Problem............................................................................4 1.3. Research Questions ....................................................................................5 1.4. Objectives of the Study................................................................................6 1.4.1. General Objective .....................................................................................6 1.4.2. Specific Objectives ...................................................................................6 1.5. Significance of the Study.............................................................................7 1.6. Delimitation/Scope of the Study .................................................................7 1.7. Limitations of the Study..............................................................................8 1.8. Authoritative and Operational Definitions of Basic Terms............................9
CHAPTER TWO REVIEW OF RELATED LITERATURE
2.1. Education and Development. ....................................................................12 2.2. Primary Education and Development ........................................................16 2.3. Primary Education Enrolment in Some Developing Countries....................19 2.4. Primary Education Enrolment in Ethiopia .................................................21 2.5. The State of Primary Education Enrolment in Addis Ababa City
3.1. Design of the Study...................................................................................35 3.2. Sampling Method and Sample Size............................................................36 3.3. Data Gathering Instruments .....................................................................41 3.4. Procedure of Data Collection .....................................................................43 3.5. Methods of Analysis ..................................................................................44
CHAPTER FOUR DATA PRESENTATION AND DISCUSSION
4.1. Characteristics of Respondents and Response Rate ...................................45 4.2. Demographic Factors ................................................................................50 4.3. Socio-Cultural Factors ..............................................................................54 4.4. Economic Factors .....................................................................................55 4.5. Institutional/School Related Factors.........................................................60
ii
CHAPTER FIVESUMMARY, CONCLUSION AND RECOMMENDATION
5.1. Summary..................................................................................................66 5.2. Conclusions ..............................................................................................71 5.3. Recommendations.....................................................................................73 References ...............................................................................................76 ANNEXES ...................................................................................................1 Annex 1. Data Collection Instruments................................................................2 Annex 1.1. Structured Questionnaire (English Version) ......................................3 Annex 1.2. Focus Group Discussion Interview Guide (English Version) ..............6 Annex 1.3. Structured Questionnaire (Amharic Version).....................................7 Annex 1.4. Focus Group Interview Guide (Amharic Version) .............................10 Annex 2. Frequency Distribution/SPSS Cross Tabulation Outputs...................11 Annex 2.1. Sex of the head of household versus prevalence of children who
have never been enrolled .................................................................12 Annex 2.2. Sex of the head of household versus prevalence of 7-14 years old
children who have never been enrolled ..........................................13 Annex 2.3. Sex of the head of household versus prevalence of 7-14 years old
non-biological children who have never been enrolled....................14 Annex 2.4. Literacy Status of the head of household versus prevalence of 7-14
years old children who have never been enrolled ...........................15
iii
LIST OF TABLES
Table 1. Rate of Return to Investment in Education by Level, Country, Type, and Region............................................................................................................17
Table 2. Distribution of Kebeles and Number of Households (by sub city) Selected for the study ...................................................................................................38
Table 3. Distributed Number of Questionnaires and Response rates (by sub city and Kebele)...........................................................................................................47
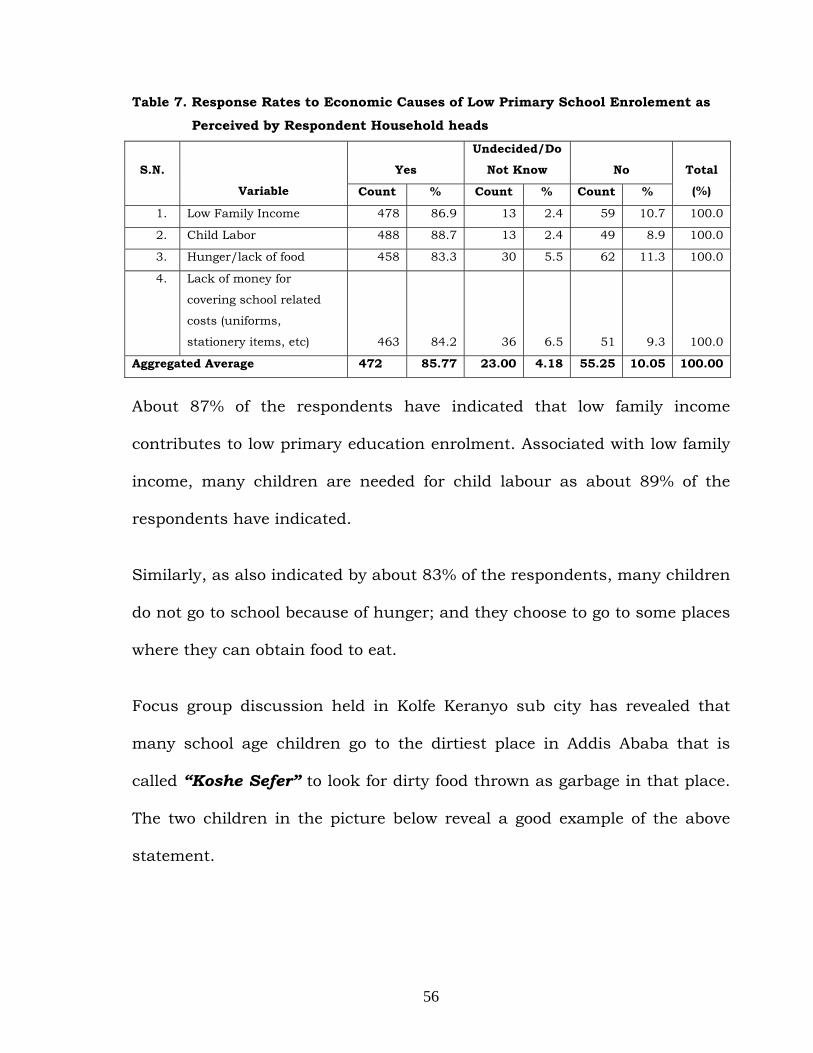
Table 4. Characteristics of households covered by the study ........................................49 Table 5. Response Rates for Demographic Factors ......................................................52 Table 6. Response Rates on Assumed Socio-Cultural Factors......................................55 Table 7. Response Rates to Economic Causes of Low Primary School Enrolement
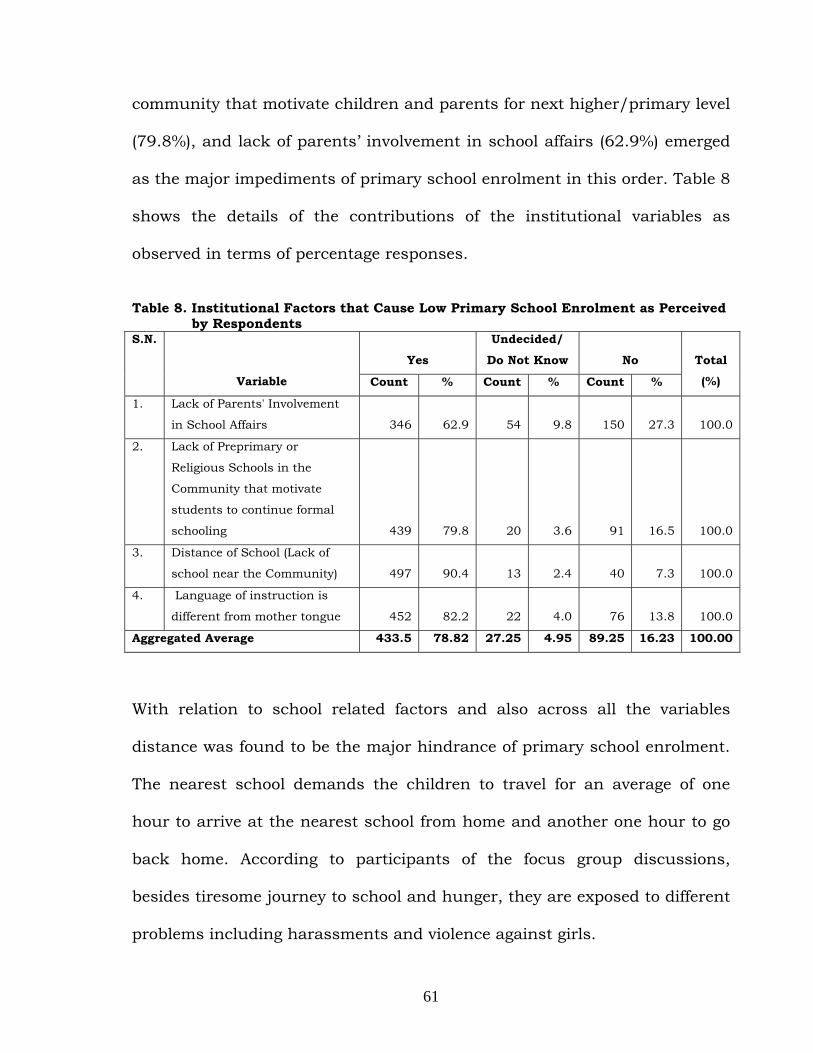
as Perceived by Respondent Household heads ............................................56 Table 8. Institutional Factors that Cause Low Primary School Enrolment as
Perceived by Respondents ............................................................................61
iv
LIST OF FIGURES Figure 1: Conceptual Framework (source: modified from Berhan, 2001) .........34 Figure 2. Percentage of respondents by Sub-City and Sex ..............................46 Figure 3. Occupations of Respondents by Sex ................................................48 Figure 4. Response Rates of Economic Factors as Contributors to Low Primary
Education Enrolment.......................................................................60 Figure 5. Summary of Aggregate Average Response Rates of Demographic,
Socio-Cultural, Economic and Institutional Variables.......................64
v
LIST OF ACRONYMS AND ABBREVIATIONS AACA: Addis Ababa City Administration AAEB: Addis Ababa Education Bureau ABE: Alternative Basic Education CSA: Central Statistical Agency EFA: Education for All EMIS: Education Management Information System ERGESE: Evaluative Research of the General Education System in EthiopiaESDP: Education Sector Development Programme ESR: Education Sector Review ETP: Education and Training Policy FAO: Food and Agricultural Organization FGD: Focus Group Discussion GEQIP: General Education Quality Improvement Package GER: Gross Enrolment Rate HDI: Human development Index IIEP: International Institute for |Educational Planning MDGs: Millennium Development Goals MoE: Ministry of Education MoFED: Ministry of Finance and Economic Development NGO: Non-Governmental Organization NER: Net Enrolment Rate OEB: Oromia Education Bureau PSTA: Parent-Student-Teacher Association SNNPR-EB: Southern Nations, Nationalities, and Peoples Region Education Bureau TOR: Terms of Reference UN: United Nations UNESCO: United Nations Educational, Scientific and Cultural Organization UNICEF: United Nations Children’s Fund UPE: Universal Primary Education
vi
ABSTRACT
This study was intended to examine the main causes of the low primary school
enrolment in the urban peripheries of Addis Ababa City Administration and to put
forward possible recommendations in line with the major findings. The study
used the Pragmatic Knowledge Claim Position to research design; which
recommends the mixed methods research approach; where both quantitative and
qualitative data are used to address the problem. The sampling technique used in
the study was a non-random sampling technique called purposive sampling, in
order to approach target groups and to identify the causes of low primary school
enrolment in the urban peripheries of Addis Ababa City Administration.
Accordingly, quantitative data were collected from a sample of 550 household
heads residing in the target areas; and five focus group discussions were
organized in five sub-cities for collecting qualitative data and for triangulation.
The quantitative data were analysed to obtain percentages and the qualitative
data were coded and organized in a narrative approach. According to this study,
distance from home to school, language of instruction other than the main
language spoken in the household/mother tongue, low family income, child
labour, lack of government pre-primary schools or religious educational
institutions in the communities, lack of parents’ awareness towards the value of
education compared to other immediate income generating activities, extreme
hunger, lack of parents’ involvement in school affairs, and cultural practices of
early marriage and abduction were found to be the major impediments of primary
school enrolment (among others). The study has also forwarded
recommendations that require stakeholders’ (mainly Addis Ababa Education
Bureau’s) attention to alleviate the problem. Other details are given in the
remaining part of this document.
vii
CHAPTER ONE
INTRODUCTION
The Right to Education is a fundamental human right. It occupies a central
place in Human Rights and is indispensable for the exercise of all other
human rights as well as for development. As an empowerment right,
education is the primary vehicle by which economically and socially
marginalized adults and children can lift themselves out of poverty, and
obtain the means to participate fully in their communities. None of the civil,
political, economic and social privileges can be exercised by individuals
unless they have received a certain minimum education. But in spite of all
the commitments made by Governments and international communities for
providing education for all, especially free and compulsory quality basic
education, millions of children still remain deprived of educational
opportunities, many of them on account of poverty. Achieving the right to
quality basic education for all is therefore one of the biggest moral
challenges of our times (UNESCO, 2006).
The Government of Ethiopia developed and adopted the 1994 Education
and Training Policy (ETP) with a major long term goal of achieving universal
primary education by the year 2015. In addition, the Government has
launched different programmes and projects with the objective of realizing
the policy’s objectives and for ensuring quality education in the country.
The Education Sector Development Programmes (ESDP I–III), and the
1
General Education Quality Improvement Programme (GEQIP) are two of the
many initiatives in this regard. Notwithstanding all attempts being made at
achieving universal primary education in Ethiopia, there are a lot of school
age children who have not yet obtained educational opportunities. This
problem is prevalent even in Addis Ababa City Administration (mainly in the
peripheries), which is the most relatively urbanized city of the country. This
situation calls for a strong effort to bring all school age children to school.
Addis Ababa City Administration Education Bureau is cognizant of the
situation and is determined to know the causes of low primary education
enrolment; so that it can devise mechanisms to address the problem.
This study was intended to examine the main causes of the low primary
school enrolment in the urban peripheries of Addis Ababa City
Administration and to put forward possible recommendations in line with
the major findings.
This study document is organized in five chapters. The first chapter deals
with the introduction which comprises of the background of the study,
statement of the problem, research questions, objectives of the study,
significance of the study, delimitation and limitation of the study, and
definition of terms.
Chapter two is the review of related literature. It consists of the basic
concepts, explanations, and research findings on primary school enrolment
contributed by various authors and researchers.
2
Chapter three presents highlights of the type of research design and
methodology used, source and type of data, sampling method and sample
size, instruments and method of data collection as well as methods of data
analysis.
Chapter four presents the results and discussion. Chapter five provides the
summary, conclusions and recommendations of the study. Finally, a list of
references used in this study and relevant appendices are attached.
1.1. Background
Located at the geographical coordinates 9° 2' 0" North, 38° 42' 0" East,
Addis Ababa has been serving as the capital of Ethiopia since its
foundation in 1886 during the reign of Emperor Menelik II and as a
capital of Africa since the foundation of the Organization of African Unity.
Currently Addis Ababa has a population of about 2.7 million (Federal
Republic of Ethiopia Population Census Commission, 2008) and is
subdivided into ten sub cities (namely Addis Ketema, Arada, Akaki Kaliti,
Bole, Gullelie, Kirkos, Kolfe Keranio, Lideta, Nifas Silk Lafto, and Yeka); six
of which (Akaki-Kaliti, Bole, Gullelie, Kolfe-Keranio, Nifas-Silk-Lafto, and
Yeka) are bordered with Oromiya National Regional State. Specifically, 23
kebeles which are found in these six sub cities are taken as the urban
peripheries of the city administration.
3
As of academic year 2000 E.C., there were 655 primary and 145
secondary governmental and nongovernmental schools in the city. 111 of
the primary schools and 42 of the secondary schools are governmental
schools (Addis Ababa City Administration Education Bureau, 2008).
1.2. Statement of the Problem
Education indicators are tools for planning, monitoring and evaluating the
development of the education system and they help to understand how well
the sector performs (Berhan, 2009). Access is one such major indicator of
an education system which is measured in terms of Net Intake Rate (NIR),
Apparent Intake Rate (AIR), Net Enrolment Rate (NER), and Gross
Enrolment Rate (GER) among others.
Although Addis Ababa is the most urbanized city compared to other cities
and towns of Ethiopia, the Net Enrolment Rate at primary level as of 2000
E.C. was 77.5% (80% males and 75.6% females). The Net Enrolment Rate at
1st Cycle primary level (Grade1-4) in 2000 E.C. was so low at 72% with
68.6% for males, and 75.7% for females; which means about 28% (both
sexes) of the school age children who should attend classes 1-4 did not yet
get educational opportunity (Addis Ababa City Administration Education
Bureau, 2008). Furthermore, pre-assessment visits of our technical team to
the sub cities and to their respective kebeles have revealed that the problem
is more prevalent in the outskirts/urban peripheries of the city. This shows
that there are a lot of school age children who did not obtain educational
4
opportunities. This situation has its own socioeconomic implications for the
society of Addis Ababa City Administration and for the country at large.
Thus, notwithstanding the Education Bureau’s commitments and efforts to
improve the access, quality, equity and efficiency of education in the city
administration, much has to be done to bring all children (school age
population) to schools. In general, although the Ethiopian Education and
Training Policy has put forward important opportunities, strategies, and
programmes much more remains to put the policy statements, strategies
and programs into action.
The above situation calls for a research that can identify the causes of low
primary enrolment in the urban peripheries of the city and that can propose
possible solutions to address the problem. We also believe that this may be
one of the reasons that instigated the City Administration Education Bureau
to call for researchers in the area.
1.3. Research Questions
The following research questions have been examined in the course of the
study in order to address the problem vis-à-vis the TOR prepared for the
assignment:
1. What is the extent of primary education enrolment in the urban
peripheries of Addis Ababa City Administration?
5
2. What are the major factors/variables that affect primary education
enrolment in the urban peripheries of Addis Ababa City
Administration?
• demographic,
• socio-cultural,
• economic, and
• institutional.
3. What roles should be played by the different stakeholders (at Federal,
City Administration, Sub city, Kebele, and School levels), in providing
primary education opportunities to school age children in the urban
peripheries of Addis Ababa City Administration?
1.4. Objectives of the Study
1.4.1. General Objective
The general objective of the proposed study was, to examine the different
factors that lead to low enrolment rate in the urban peripheries of the city
administration as well as to propose possible remedies to increase the
enrolment rate in the study areas in particular and in the city
administration in general.
1.4.2. Specific Objectives
i. To assess the extent of primary enrolment in the selected Kebeles of
urban peripheries of Addis Ababa City Administration vis-à-vis the school
age children.
6
ii. To identify the factors/variables that cause low enrolment rate in the
urban peripheries of Addis Ababa City Administration.
iii. To propose/develop a strategy for collaborative action with stakeholders
(mainly with Oromiya Regional State and Addis Ababa City
Administration Education Bureaus) for increasing the enrolment rate as
one way of achieving the goals of Education for All and the Millennium
Development Goals.
1.5. Significance of the Study
The current study is expected to be significant in identifying the major
impediments for low primary education enrolment in the urban peripheries
of Addis Ababa City Administration and in proposing strategies/remedies
for improving access to primary education in the study area. It is also
believed to serve as a foundation for further similar studies in all regions
and hence to throw light on the issue and draw the attention of the different
stakeholders.
1.6. Delimitation/Scope of the Study
Taking the associated time and financial implications into account, the
study was carried out at 12 purposively selected Kebeles (out of 23) that
are urban peripheries of Addis Ababa City administration.
7
1.7. Limitations of the Study
As the study was conducted within less than a month, under tight
conditions, with limited time and financial resources, it had some minor
limitations. One of the limitations was lack of sample frame for selecting
households, which dictated the researchers to use non-random (purposive)
sampling technique. Secondly, lack of adequate and recent research works
in similar areas and in the same topic. Thirdly, although it was finally
possible to collect 100% of the distributed questionnaires, the data
collection process was a challenge due to the scattered nature of the
households and the type of occupation of the respondents who urged the
data collectors to leave them free so that they would perform their
respective activities as bread winners. Fourthly, the researchers found
inconsistencies in the data/information generated by EMIS of the Ministry
of Education and that of Addis Ababa City Administration Education
Bureau. This inconsistency deterred the researchers from using the data
exhaustively.
However, regardless of the minor limitations indicated above, the
researchers believe that the study has achieved its objectives and will draw
the attention of the different stakeholders to alleviate the problem; and will
serve as a ground work for similar studies.
8
1.8. Authoritative and Operational Definitions of Basic Terms
The following are definitions of some key terms used in the current
study. The definitions of basic terms given along with their respective
references are authoritative and those with out reference are operational
definitions used by the authors.
Biological or Nuclear Family: consists of the husband, wife and their
unmarried children (Lucas, D. et al. 1980). None-biological child
therefore refers to a child not born to the husband and wife living in the
household.
Family: is defined as those members of a household who are related, to
a specific degree, through blood, adoption, or marriage (UN, 1958).
Head of Household: is a person who economically supports or manages
the household or for reasons of age or respect, is considered as head by
the household or declares himself as such or by members of the
household. The head of household can be a male or a female (UN, 1958).
Household: refers to a group of individuals who share living quarters
and their principal meals (UN, 1958). Household size is defined as the
number of members of a household.
Kebele Education Office: This refers to the level of education
management hierarchically below the Sub City Education Office. In the
9
context of Addis Ababa City Administration, kebeles are responsible for
managing pre-primary, primary and secondary (grades 9-12) education.
Knowledge: Knowledge is defined by the Oxford English Dictionary (cited in
Picture 4. FGD organized in Bole Sub-City (Venue: Meri Primary School)
3.3. Data Gathering Instruments
In order to get adequate and complementary information for the study,
diverse set of data gathering instruments were employed. Hence,
questionnaire, focus group discussion (FGD), interview, direct observation
and document analysis were used as major data gathering instruments.
Questionnaire
The questionnaire was adapted and developed from review of literatures.
This instrument was used to collect data from heads of households since it
is the most appropriate means to gather the necessary information from
larger sample size within a short time frame. The questionnaire comprised
41
three parts. The first part consisted of 20 data items related to the
households’ and their families personal data/information. The second part
contained 29 structured items under the four major groups of variables. The
last part was open ended items to give opportunity for the heads of
households to express their feelings, experiences, perceptions, and problems
about the pertinent causes of low enrolment. This enabled the researchers
to get detailed information about the issues raised in the study.
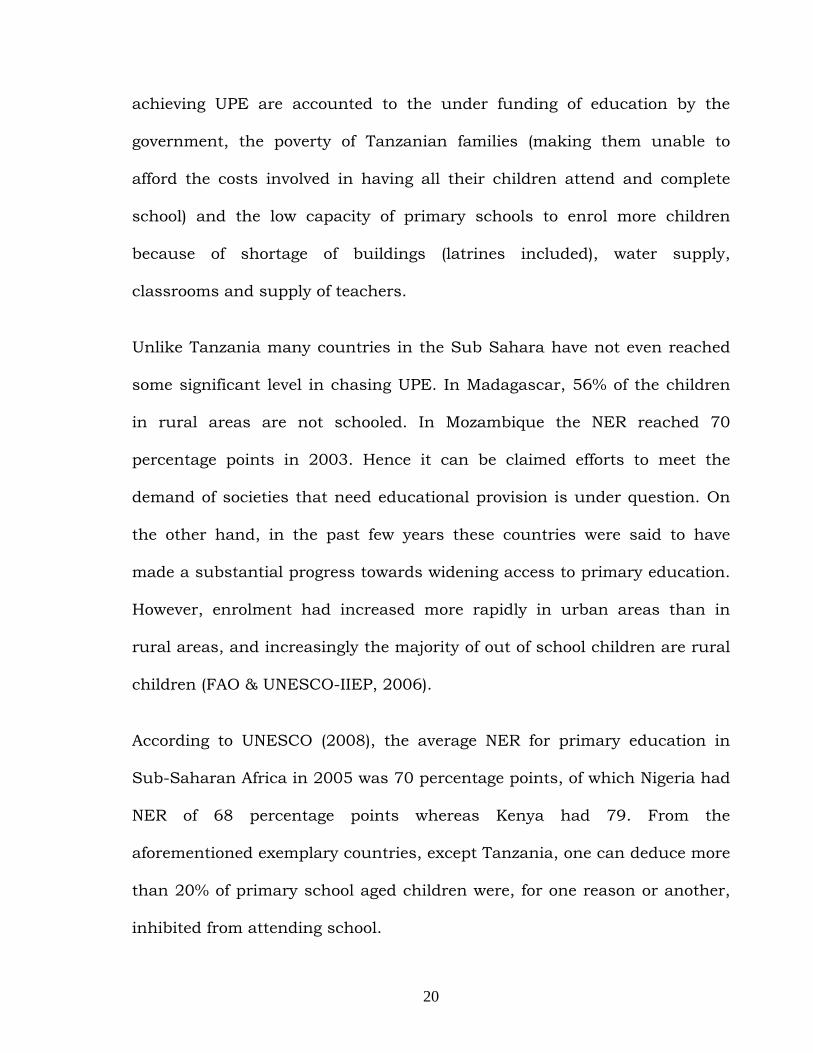
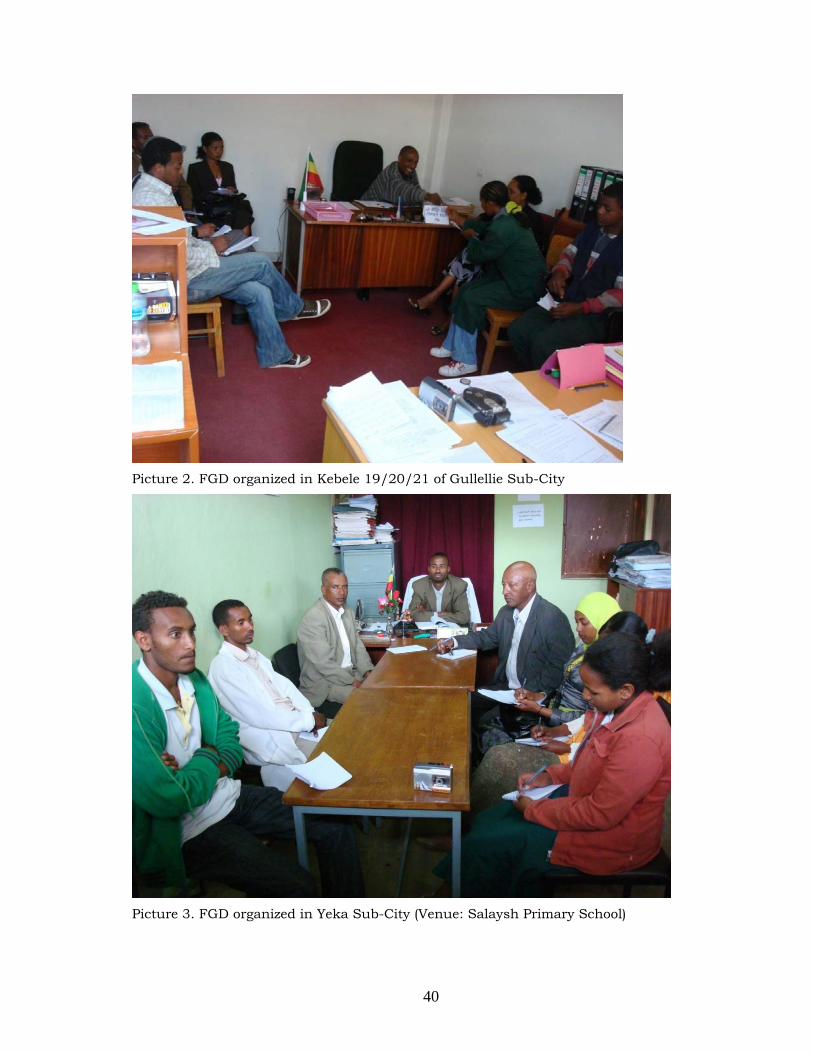
Focus Group Discussion (FGD)
Following households’ questionnaire administration, five different FGD
interviews were held with one from each sampled sub-cities. This
instrument was chosen, since it gives insight for the study about the group
feelings, reasons, and explanations for attitude (Sarantakos, 2005). Having
in mind this, the interview guidelines of the FGD consisted of key
stakeholders’ perception and experience about the existing conditions,
major causes and possible actions for low enrolment. All FGDs were taped
and photographed with participants’ approval and then transcribed. The
participants’ names were coded from P1 to P50.
Document Analysis: To examine the major trends of AAEB and MoE in
terms of NER, GER, and other related access indicators, document analysis
was used as data collection instrument. For this reason, an attempt was
made to examine and compare in summaries factual information and official
42
reports, especially EMIS publications of the Federal MoE and the AAEB were
thoroughly consulted and used as a point of reference for the study.
3.4. Procedure of Data Collection
The instruments were carefully reviewed and translated into Amharic
language by the four researchers undertaking the current study. Then the
questionnaire was pilot-tested for its reliability on a small group of
respondents selected from one of the kebeles considered as urban
peripheries. The sample kebele was taken from Nefas Silk Lafto, where there
is only one kebele bordered with Oromiya National Regional State in that
sub-city, as explained earlier. After conducting a pilot-test, the instrument
was revised on the basis of reliability analysis results and keen observations
of the pitfalls encountered during administering the pilot test.
Prior to testing the instruments, thirteen qualified data collectors were
recruited and trained on how to approach respondent household heads and
collect data using the structured questionnaires. The data collectors were
also trained on how to record direct observations (observer’s comments) of
related issues on a separate notebook. The data collection process was also
carefully supervised by the core members of the team undertaking the
study. The English and Amharic versions of the data collection instruments
are attached as annex to this document.
43
Pilot Study: After the questionnaire had been developed and tested for its
relevance, clarity simplicity for compliance with basic rules of questionnaire
construction (Sarantakos, 2005), the first draft was given to the experts of
Addis Ababa City Administration Education Bureau, for comments and
suggestions. After approval, the instrument was tried out for its suitability,
reliability, and validity in Lebu (01 Kebele of Nefas-Silk-Lafto Sub City)
before the actual data collection commenced. Twenty household heads were
selected purposively for the pilot study. After collection the questionnaire,
refinements were made on five items based on the hints obtained from the
pilot study. The item analysis was computed by Crombach alpha. The
reliability coefficients of demographic, socio-cultural, economic and
institutional (school-related) items were 0.84; 0.86; 0.92; and 0.82
respectively. Thus, the instrument was found reliable to use for the main
data collection. Then, it was administered as scheduled.
3.5. Methods of Analysis
A computer system (hardware and software) was applied for coding, design,
entry and analysis of data/information as well as for report writing.
Qualitative data collected through focus group discussions were also
transcribed and presented through narrative approach supported by
pictures in the findings. Descriptive statistical methods such as percentages
have also been used.
44
CHAPTER FOUR
DATA PRESENTATION AND DISCUSSION
In this chapter, characteristics of respondents, analysis of the data, results
and discussion are presented in terms of the factors categorized under the
conceptual framework (as demographic, socio-cultural, economic, and
institutional/school related).
4.1. Characteristics of Respondents and Response Rate
As it was explained earlier, the respondents were selected purposively in
such a way that households in the extremes of the city administration and
both female and male household heads who did not send their children to
school are addressed as much as possible.
Among the 550 respondents who took part in the study, 342 (62.2%) and
208 (37.8%) were males and females respectively. Akaki Kality and Kolfe
Keranyo, each, accounted for 27.2% of the total selected 550 respondents.
Gullelie and Yeka were represented by 18.2% each; while Bole was
represented by 9.1%. As it was indicated earlier in Table 2, the percentages
given here were dependent on the number of kebeles defined as urban
peripheries in each sub-city. The larger the number of kebeles defined as
urban peripheries in a sub city, the greater was the number of kebeles
included in the sample.
45
The next figure (Figure 2) represents the percentage of participant
household heads selected from each sub city by sex.
5.6
21.6
27.2
0.9
8.2 9.1 9.3 8.9
18.215.5
11.8
27.2
6.511.6
18.2
37.8
62.2
100
0.0
10.0
20.0
30.0
40.0
50.0
60.0
70.0
80.0
90.0
100.0
Perc
enta
ge
Akaki-Kaliti Bole Gullelie Kolfe-Keranyo Yeka Grand TotalSub-City
FemaleMaleTotal
Figure 2. Percentage of respondents by Sub-City and Sex
All questionnaires were completed by respondents (with the assistance of
the data collectors) and were returned; making the response rate 100% (see
Table 3).
46
Table 3. Distributed Number of Questionnaires and Response rates (by sub city and Kebele)
The major language spoken in 53.3% of the households was Oromifa
followed by 40% Amharic and the remaining small portion (6.7%) languages
of other nationalities that include, Tigrigna, Guragigna, Gamogna, Siltigna,
Agewgna, Hadiyagna, Wolaytigna, and Dorzigna. Participants of the focus
group discussions explained that the Oromifa speaking households consist
of natives of the places; while the others consist of people who moved for
different economic reasons, including cheaper house rents and daily labour.
Number of
Collected
Questionnaires and
Sex of the
Respondent Head of
Household
Sub City
Kebele
Number of
Distributed
Questionnaires
Female Male Total Response
Rate
1. Kilinto 50 10 40 50 100%
2. Gellan Gura 50 8 42 50 100%
3. 02/04 50 13 37 50 100%
1. Akaki-Kaliti Total 150 31 119 150 100%
1. 16/18/20/21 50 5 45 50 100%
2. Bole Total 50 5 45 50 100%
1. 19/20/21 50 29 21 50 100%
2. 09/15 50 22 28 50 100%
3. Gulelie Total 100 51 49 100 100%
1. 01/05 50 43 7 50 100%
2. 02/03 50 17 33 50 100%
3. 15/16 50 25 25 50 100% 4. Kolfe-
Keranyo Total 150 85 65 150 100%
1. 16/17/18/Ankorcha 50 9 41 50 100%
2. 20/21/Yeka Tafo 50 27 23 50 100%
5. Yeka Total 100 36 64 100 100%
Grand Total 550 208 342 550 100%
47
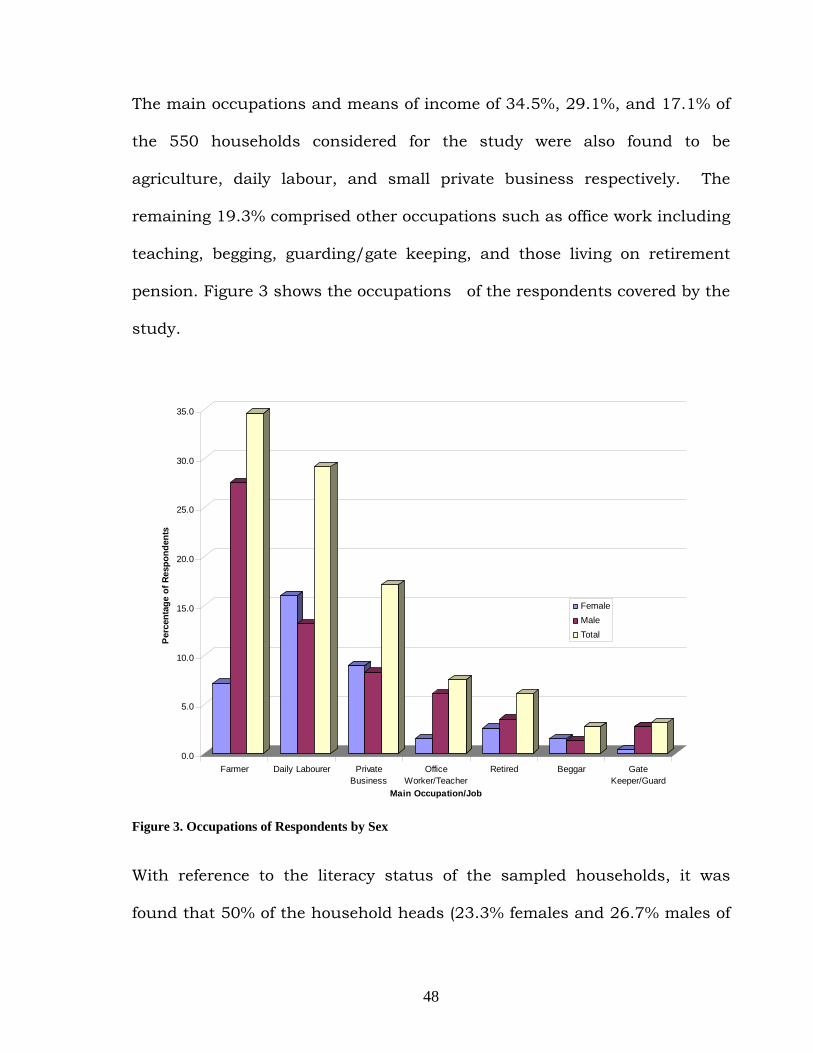
The main occupations and means of income of 34.5%, 29.1%, and 17.1% of
the 550 households considered for the study were also found to be
agriculture, daily labour, and small private business respectively. The
remaining 19.3% comprised other occupations such as office work including
teaching, begging, guarding/gate keeping, and those living on retirement
pension. Figure 3 shows the occupations of the respondents covered by the
study.
0.0
5.0
10.0
15.0
20.0
25.0
30.0
35.0
Perc
enta
ge o
f Res
pond
ents
Farmer Daily Labourer PrivateBusiness
OfficeWorker/Teacher
Retired Beggar GateKeeper/Guard
Main Occupation/Job
FemaleMaleTotal
Figure 3. Occupations of Respondents by Sex
With reference to the literacy status of the sampled households, it was
found that 50% of the household heads (23.3% females and 26.7% males of
48
the total) were illiterate and 50% of the remaining (14.5% female and 35.5%
males of the total) literate. Similarly, it was found that literate household
heads are more likely to send their children to school compared to illiterate
household heads (see Annex 2.4).
It was also observed that 38.7% of the heads of households pointed out that
it takes 30 minutes or less to travel from their respective households to the
nearest school; while the remaining 61.3% explained that it takes more than
30 minutes.
A summary of the major household characteristics is given in the next table
(Table 4).
Table 4. Characteristics of households covered by the study
Household Characteristics Count % Female 208 37.8 Male 342 62.2 Household head’s sex Total 550 100.0 30 Minutes or less 213 38.7 More than 30 Minutes 337 61.3
Time needed to travel to the nearest School Total 550 100.0
Literate 275 50 Illiterate 275 50
Household head’s literacy status
Total 550 100.0 Farming 190 34.5 Daily Labour 160 29.1 Private Business 94 17.1 Other 106 19.3
Household head’s occupation Total 550 100.0
Oromifa 293 53.3 Amharic 220 40.0 Other 13 6.7
Main language spoken in the household Total 550 100
49
4.2. Demographic Factors
In order to investigate whether demographic factors contribute to the low
primary enrolment in the urban peripheries of the City Administration, the
demographic variables, sex of the head of the household, early marriage of
children, divorce of parents, death of parents, fear of abduction, fear of rape,
and large family size were considered.
As it was explained earlier, about 38% of the 550 heads of the households
covered by the study were found to be females and the remaining 62%, were
males. Among these 550 household heads included in this study, 226
(41.1%) of them have never sent their children to school. Furthermore, 169
of them (close to 31%) indicated that they have children aged 7-14 who have
never been enrolled in schools. Out of these 169 households, 68% of them
are headed by males compared to 32% of those headed by females (see
Annex 2.1).
Concerning the other demographic factors 77.6% of the respondents believe
large family size as a cause of low primary school enrolment. Similarly, 71%
of the respondents reported death of either or both parents as a cause of low
primary education enrolment. Fear of rape (64.2%), fear of abduction (60%),
and divorce of parents (52.9%) were also believed by the respondents as
causes of the problem.
50
Results of the focus group discussions also revealed that many of the
families have many children and it is usual that they do not send all of their
children to school. P7 can be a good case in point. He has seven children
and none of them could get the chance to go to school. As he stated bitterly,
eating twice in a day could be considered as an achievement for his family.
The problem of not going to school is also more prevalent in female children
compared to males, as per explanations given by participants of the FGDs.
For instance, an observation in one household in Tafo kebele of Yeka sub
city revealed that a girl was keeping a house while her younger brother went
to school.
Focus group discussions held in the four of the sub cities also pointed out
that rape and abduction are serious problems that have to be addressed.
One FGD participant from Gullelie sub city (P11) explained that recently a
girl was raped by four men in the wooded area of Entoto; and another girl
was arrested by some men for several days in the same area. Similarly, FGD
participants from Bole Sub city (P23) explained that two small girl students
were abducted recently. This shows that, the problems of rape and
abduction might have contributed to student dropout and low primary
school enrolment in the urban peripheries. In this regard, the researchers
experienced unexpected event during one of the FGDs. The event happened
like this. A teenager female student, whose age was nearly fourteen, was one
of the FGD participants (P3) since she is student parliament representative
in one of the remotest urban periphery school.
51
Due to the hot discussion, the FGD session took two hours and half (12:30-
3:00 P.M). All her family especially her mother, came to the school with
tears, sweat and great anger from a distance of about four kilometres to find
her and to know why she was late to go home. After the Kebele’s Vice
Chairman and the director cooled her down, the mother told us that many
teenager female students suffered from being raped. From this single
incident, one can deduce and learn that fear of abduction and being raped
(sexual harassment) is one of the major causes for low enrolment and high
dropout rate for female students in the urban peripheries of Addis Ababa.
Table 5 shows a summary of the responses for the selected demographic
variables/factors to see if they are perceived by respondents as causes of
low primary school enrolment in the target areas.
Table 5. Response Rates for Demographic Factors (N=550)
Yes
Undecided/
Do Not Know No
S.N.
Variable Count % Count % Count % Total (%)
1. Large Family Size 427 77.6 33 6.0 90 16.4 100.0
2. Death of Parents 391 71.1 51 9.3 108 19.6 100.0
3. Early Marriage 375 68.2 30 5.5 145 26.4 100.0
4. Fear of Rape 353 64.2 43 7.8 154 28.0 100.0
5. Fear of Abduction 330 60.0 58 10.5 162 29.5 100.0
Questionnaire Prepared for Collecting Relevant Data/Information on the causes for low primary
school Enrolment in the Urban Peripheries of Addis Ababa City Administration
Household Questionnaire Questionnaire’s Serial No. _________
General Introduction
The Ethiopian government has been working strongly to increase access to primary education and to
enhance its quality. In this connection, although many remarkable achievements have been recorded in
the last 18 years, much more remains to be done to bring all school age children to school and to further
ensure the enhancement of the quality of education in general and that of primary level in particular.
This questionnaire is designed to collect relevant data/information for the study on the causes of low
primary school Enrolment in the Urban Peripheries of Addis Ababa City Administration. The study is
being conducted to help the City Administration Education Bureau to devise mechanisms of providing
educational opportunities to all citizens in the city and to improve the quality of education at the primary
level, which is the foundation of all other higher levels. Thus, your genuine, frank and timely responses
are vital to determine the success of this study and you are kindly requested to contribute in filling the
questionnaire honestly and responsibly.
Note:
Dear respondents,
• There is no need of writing your name.
• All information you provide will be strictly kept confidential.
• All data will be aggregated and will not personalize individual responses.
Thank you very much for your cooperation
3
Name of Data Collector: ___________________________ Date of Visit:___________________ Time: _____
PART I. Basic Household Information 1.1.Sub City ___________________,
1.2.Kebele ____________________,
1.3.Household ID __________________
1.4.Major language spoken in the household: ____________
1.5.Sex of the head of the household: (1) □ Female (2) □ Male
1.6.Age of the head of household in completed years _________
1.7.Literacy status of the household head
(1) □ literate (can read and write) (2) □ Illiterate (GO to 1.9)
1.8. Educational level of the household head _______
1.9. Household head’s Occupation: _______________
1.10. Household’s main means of income: _______________
1.11. Approximate yearly household income in Eth. Birr _________
1.12. Household size (number of persons living in the household):
1.12.1. Male: _____ 1.12.2. Female ____
1.13. Number of children aged 5-6: 1.13.1. Male: _____ 1.13.2. Female ____
1.14. Number of children aged 7-14 years: 1.14.1. Male: _____ 1.14.2. Female ____
1.15. Is there any child in your household who has never been enrolled? (1) □ Yes (2) □ No
1.16. If your answer to Q1.15 above is ‘Yes’, please list the age and sex of the children who have never been to school in the table below. How many children aged 7-14 years have never been enrolled in school?
1.17. Is there any child in your household who is not your biological child but adopted or working as a
servant in your household and who has never been enrolled in school? (1) □ Yes (2) □ No
1.18. If your answer to Q1.17 above is ‘Yes’, please list the age and sex of the children in the table
below.
1.19. How many children/sons & daughters) have started schooling and dropped out before completing grade 4? 1.19.1. Male: _____ 1.19.2. Female ____
1.20. What is the time needed to travel from your household to the nearest school __________
S.N. Age Sex 1. 2. 3. 4. 5.
S.N. Age Sex 6. 7. 8. 9. 10.
S.N. Age Sex
1.
2.
S.N. Age Sex
3.
4.
4
PART II. Causes/factors for Low Primary Enrolment in the urban peripheries of Addis Ababa City
Administration
Addis Ababa City Administration Education Bureau as well as the Sub-city and Kebele education offices
believe that there is a low primary school enrolment in the urban peripheries of Addis Ababa City
Administration. On the basis of your knowledge and personal experience including your household’s reality,
please respond to the next factors/causes by putting an “X” mark below the number against each
item to indicate your agreement or disagreement of the existence of the problem as a cause for low primary
education enrolment; where 3= Yes, 2= Do Not Know/Undecided, 1= No.
S.N. Indicators Rating Scale 2.1. Demographic and related factors 3 2 1 2.1.1 Early marriage 2.1.2 Migration/movement to another places 2.1.3 Divorce of parents 2.1.4 Death of parents 2.1.5 Fear of abduction 2.1.6 Fear of rape 2.1.7 Large family size
2.2. Socio-Cultural factors 2.2.1 Parents’ lack of awareness of the importance of education for future
development/parents see less value in education
2.2.2 Health problem/Children live with HIV/AIDS 2.2.3 Caring parents living with HIV /AIDS 2.2.4 Child’s fear of insult for being leper 2.2.5 Belief that own children will get infected with diseases from other students 2.2.6 Traditional belief that own children may be exposed to evil eyes 2.2.7 Disability of the child (visual, hearing, etc impairments, )
2.3. Economic factors 2.3.1 Low household income 2.3.2 Child labour 2.3.3 Hunger/poverty (lack of subsistence food) 2.3.4 Lack of money for covering school related costs (text books, stationery items,
etc)
2.3.5 Preference of immediate income generating activity (eg. begging, selling chewing gums, kolo, etc) rather than sending the child and wasting time at school
2.4. Institutional (School related) factors 2.4.1 Long distance of school/Lack/shortage of schools near the community 2.4.2 Lack of preschool or religious schools in the community that motivate children
to enrol for formal education
2.4.3 Lack of involvement of parents in school affairs 2.4.4 Poor quality of education
2.4.5 Language of instruction is different from mother tongue 2.4.6 Curriculum does not reflect local culture, value and language 2.4.7 Lack of safety in schools 2.4.8. Lack of potable water in schools 2.4.9. Lack of sanitation facilities in schools
• Please indicate if there are other reasons that were not mentioned here. ___________________________________________________________________________ Taking the above mentioned causes of low primary school enrolment into account, please indicate your suggested solutions including the responsible body for taking an action. ___________________________________________________________________________ ___________________________________________________________________________
5
Annex 1.2. Focus Group Discussion Interview Guide (English Version)
Interview Guides Prepared for Collecting Relevant Data/Information on
the causes of low primary enrolment in the urban peripheries of Addis
Ababa City Administration
Interview guide (School Directors, PSTAs and household heads).
1. What is the existing condition of student enrolment in your Kebele?
2. What do you think are the major reasons for the existing low primary enrolment
in your Kebele?
3. What does the community participation look like in alleviating the problem?
4. What possible actions do you suggest to be undertaken at the different levels of
the education system management?
• Federal,
• City Administration,
• Sub city,
• Kebele, and
• School levels.
5. What possible actions do you suggest to be undertaken by the community
including your self?
6. Are there any other related issues or concerns you may wish to mention?
Annex 2. Frequency Distribution/SPSS Cross Tabulation Outputs
11
Annex 2.1. Sex of the head of household versus prevalence of children who
have never been enrolled
Q1_5_SEX Sex of the Head of Household * Q1_15 Is there any child who has never been enrolledCrosstabulation
80 128 208
38.5% 61.5% 100.0%
35.4% 39.5% 37.8%
14.5% 23.3% 37.8%146 196 342
42.7% 57.3% 100.0%
64.6% 60.5% 62.2%
26.5% 35.6% 62.2%226 324 550
41.1% 58.9% 100.0%
100.0% 100.0% 100.0%
41.1% 58.9% 100.0%
Count% within Q1_5_SEX Sexof the Head of Household% within Q1_15 Is thereany child who has neverbeen enrolled% of TotalCount% within Q1_5_SEX Sexof the Head of Household% within Q1_15 Is thereany child who has neverbeen enrolled% of TotalCount% within Q1_5_SEX Sexof the Head of Household% within Q1_15 Is thereany child who has neverbeen enrolled% of Total
1 Female
2 Male
Q1_5_SEX Sex of theHead of Household
Total
1 Yes 2 No
Q1_15 Is there anychild who has never
been enrolledTotal
12
Annex 2.2. Sex of the head of household versus prevalence of 7-14 years
old children who have never been enrolled
Q1_5_SEX Sex of the Head of Household * N7_14 Is there any 7-14 years old child who has neverbeen enrolled Crosstabulation
54 154 208
26.0% 74.0% 100.0%
32.0% 40.4% 37.8%
9.8% 28.0% 37.8%115 227 342
33.6% 66.4% 100.0%
68.0% 59.6% 62.2%
20.9% 41.3% 62.2%169 381 550
30.7% 69.3% 100.0%
100.0% 100.0% 100.0%
30.7% 69.3% 100.0%
Count% within Q1_5_SEX Sexof the Head of Household% within N7_14 Is thereany 7-14 years old childwho has never beenenrolled% of TotalCount% within Q1_5_SEX Sexof the Head of Household% within N7_14 Is thereany 7-14 years old childwho has never beenenrolled% of TotalCount% within Q1_5_SEX Sexof the Head of Household% within N7_14 Is thereany 7-14 years old childwho has never beenenrolled% of Total
1 Female
2 Male
Q1_5_SEX Sex of theHead of Household
Total
1 Yes 2 No
N7_14 Is there any7-14 years old childwho has never been
enrolledTotal
13
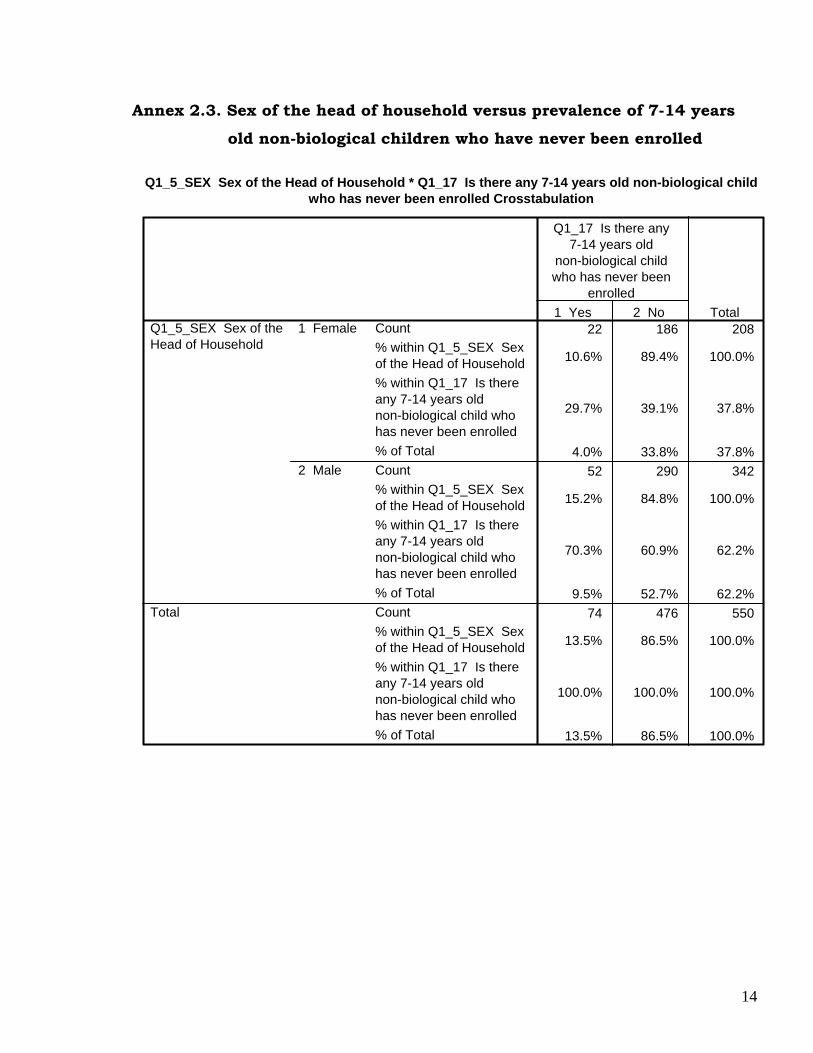
Annex 2.3. Sex of the head of household versus prevalence of 7-14 years
old non-biological children who have never been enrolled
Q1_5_SEX Sex of the Head of Household * Q1_17 Is there any 7-14 years old non-biological childwho has never been enrolled Crosstabulation
22 186 208
10.6% 89.4% 100.0%
29.7% 39.1% 37.8%
4.0% 33.8% 37.8%52 290 342
15.2% 84.8% 100.0%
70.3% 60.9% 62.2%
9.5% 52.7% 62.2%74 476 550
13.5% 86.5% 100.0%
100.0% 100.0% 100.0%
13.5% 86.5% 100.0%
Count% within Q1_5_SEX Sexof the Head of Household% within Q1_17 Is thereany 7-14 years oldnon-biological child whohas never been enrolled% of TotalCount% within Q1_5_SEX Sexof the Head of Household% within Q1_17 Is thereany 7-14 years oldnon-biological child whohas never been enrolled% of TotalCount% within Q1_5_SEX Sexof the Head of Household% within Q1_17 Is thereany 7-14 years oldnon-biological child whohas never been enrolled% of Total
1 Female
2 Male
Q1_5_SEX Sex of theHead of Household
Total
1 Yes 2 No
Q1_17 Is there any7-14 years old
non-biological childwho has never been
enrolledTotal
14
Annex 2.4. Literacy Status of the head of household versus prevalence of
7-14 years old children who have never been enrolled
Q1_8_REC Literacy Status of head of Household * N7_14 Is there any 7-14 years old childwho has never been enrolled Crosstabulation
93 182 275
33.8% 66.2% 100.0%
55.0% 47.8% 50.0%
16.9% 33.1% 50.0%76 199 275
27.6% 72.4% 100.0%
45.0% 52.2% 50.0%
13.8% 36.2% 50.0%169 381 550
30.7% 69.3% 100.0%
100.0% 100.0% 100.0%
30.7% 69.3% 100.0%
Count% within Q1_8_RECLiteracy Status ofhead of Household% within N7_14 Isthere any 7-14 yearsold child who hasnever been enrolled% of TotalCount% within Q1_8_RECLiteracy Status ofhead of Household% within N7_14 Isthere any 7-14 yearsold child who hasnever been enrolled% of TotalCount% within Q1_8_RECLiteracy Status ofhead of Household% within N7_14 Isthere any 7-14 yearsold child who hasnever been enrolled% of Total
1 Illiterate
2 Literate
Q1_8_REC Literacy Status ofhead of Household
Total
1 Yes 2 No
N7_14 Is there any7-14 years old childwho has never been