Munich Personal RePEc Archive Assessing the Value Relevance of Accounting Data After the Introduction of IFRS in Europe Devalle, Alain and Magarini, Riccardo and Onali, Enrico 8 October 2009 Online at https://mpra.ub.uni-muenchen.de/56174/ MPRA Paper No. 56174, posted 26 May 2014 19:18 UTC
Transcript
Munich Personal RePEc Archive
Assessing the Value Relevance of
Accounting Data After the Introduction
of IFRS in Europe
Devalle, Alain and Magarini, Riccardo and Onali, Enrico
8 October 2009
Online at https://mpra.ub.uni-muenchen.de/56174/
MPRA Paper No. 56174, posted 26 May 2014 19:18 UTC
Electronic copy available at: http://ssrn.com/abstract=2420765
1
Assessing the value relevance of accounting data after
Electronic copy available at: http://ssrn.com/abstract=2420765
2
1. Introduction
The recent financial has shown that a lack of transparency in the financial
markets may result in a widespread fall in investors’ confidence. Eventually, this
phenomenon may lead to liquidity shortages and stock market crashes (OECD
Observer, 2009). Opaque stock markets exacerbate the problem of informational
asymmetries between insiders (primary shareholders and directors) and outsiders
(common shareholders and creditors).
Transparency in the financial markets is a crucial issue for society as a whole.
Over the last decades, an increasingly large number of individuals have poured money
into domestic and foreign stock markets through pension and mutual funds (Pilbeam,
2005). Thus, transparent company accounts are beneficial to individual investors as
well as institutional investors, and their comparability should be ensured at both
national and international level. For this reason, the definition and enforcement of
internationally-recognised financial reporting standards is considered of paramount
importance by standard setters. Moreover, a lively debate is under way among
academics as to whether it is possible to achieve international harmonisation of
financial reporting standards. Harmonisation should facilitate cross-border
investments, leading to better market liquidity and lower cost of capital.
In an effort to achieve transparency and harmonisation of financial reporting
standards, and to reinforce the integration of European capital markets, the European
Union (EU) requires listed companies to prepare their consolidated financial
statement in compliance with the International Financial Reporting Standards (IFRS)
for fiscal years starting after 1 January 2005 (1606/2002 European Commission
Regulation).
If the premise that IFRS have led to greater transparency and cross-border
comparability of company accounts is true, we expect: first, that informational
asymmetries have decreased after the adoption of IFRS, and therefore there is a closer
relation between accounting measures and market data; second, that the foregoing
relation should not present significant discrepancies across European countries.
The present paper aims to investigate whether the relationship between
accounting measures and market data, or value relevance, has strengthened as a
consequence of the adoption of IFRS. We examine companies listed on five European
stock exchanges (Frankfurt, Madrid, Paris, Milan, and London). An investigation of
the effects of IFRS on accounting systems throughout the world is important for two
reasons: first, to understand whether the harmonisation process, strongly encouraged
by standard setters throughout the world, is effective in improving cross-border
3
comparability of accounting information; second, to provide useful information
regarding the potential consequences of a voluntary adoption of IFRS in the US and
above all for the possibility of a compulsory adoption in 2014 (Securities and
Exchange Commission, 2008)1. However, most of the extant literature examines the
effects of IFRS either on a single country, or on many countries as a whole,
neglecting the potential impact of different cultural and legal backgrounds on the
effectiveness of the new regulatory framework. In this study, we examine the effects
of IFRS on five countries that are believed to differ in terms of legal system and size
of capital markets. While the UK has a shareholder-driven type of accounting
framework, accounting systems in Continental European countries are believed to put
less emphasis on the protection of outsiders against expropriation from insiders (La
Porta et al., 1997).
Using panel-data regression analysis and a Chow test for structural breaks we
find that the reaction to IFRS in terms of value relevance differs according to the
stock exchange considered. To our knowledge, this is the first paper that uses panel-
data modelling for testing value relevance. The use of a Chow test is also an
innovation: studies that compare value relevance in different countries or periods rely
on the comparison of the explanatory power of the models without testing for a
structural break in the coefficients. The lack of a structural break due to the
implementation of IFRS suggests that changes in value relevance might have been
due to factors other than the implementation of IFRS. To increase the robustness of
the results, we use two models that are commonly employed for testing value
relevance, as well as models that test for earnings smoothing and timely loss
recognition. Value relevance, earnings smoothing, and timely loss recognition are part
of the more general concept of accounting quality (Barth et al., 2008).
Our main findings show that there has been an overall improvement in value
relevance when the whole sample is examined. This finding is consistent with Barth et
al. (2008). However, structural breaks in the coefficients of a price regression model
occur for Germany, Spain, and France but not for Italy and the UK. Moreover, if the
overall explanatory power of the regression is considered as a proxy for value
relevance, value relevance has decreased in Germany and Spain. Therefore, value
relevance has increased due to IFRS adoption for companies listed on the French
stock market only. However, when changes in the magnitude of coefficients for the
book value of equity and earnings per share are examined, increased value relevance
is found for earnings in Germany and France, while value relevance of book value of 1 In the document ‘Roadmap for the Potential Use of Financial Statements Prepared in Accordance
with International Financial Reporting Standards by U.S. Issuers’, the SEC states (p. 10): “The Commission in 2011 would determine whether to proceed with rulemaking to require that U.S. issuers use IFRS beginning in 2014 if it is in the public interest and for the protection of investors to do
so.”
4
equity decreased in Germany, Spain and France. When returns rather than prices are
used as dependent variable, no structural breaks are found as a result of the
implementation of IFRS. The results for other measures of accounting quality,
earnings variability and timely loss recognition, do not suggest that accounting quality
has improved after the implementation of IFRS.
The remainder of this paper is organised as follows. Section 2 reviews the
literature. Section 3 describes the methodology and data. Section 4 reports the results.
Section 5 reports robustness tests based on measures of accounting quality other than
value relevance. Section 6 concludes.
2. Literature review
2.1 Comparison of international accounting standards
Differences among local accounting standards have been widely studied in the
past, and the possible source of these differences has been investigated. A branch of
the literature groups accounting systems on the basis of their legal system: an Anglo-
Saxon (or Anglo-American) cluster and a Continental European cluster (Joos and
Lang, 1994; Ali and Hwang, 2000; Delvaille et al., 2005). D’Arcy (2001) argues this
taxonomy might be too simple to encompass the variety of national accounting
systems around the world.
A more sophisticated categorisation is developed by La Porta et al. (1997), who
posit a link between the legal system of a country and the quality of protection for
outsiders (both common shareholders and creditors). Differences in the level of
protection for outsiders are ascribed to the type of legal system: a common law system
is associated with better legal protection for outsiders, while a civil law system (also
code law system) is associated with worse legal protection for outsiders. In turn, the
quality of investors’ protection impinges on the characteristics of capital markets. Countries where potential financiers are protected against expropriation from insiders
have larger capital markets and better quality of enforcement. Four groups can be
identified on the basis of the degree of protection for outsiders from expropriation
from insiders: English, French, German and Scandinavian. Countries belonging to the
French-origin group are found to have the poorest legal protection for outsiders and
the least developed capital markets. On the contrary, countries assigned to the
English-origin cluster present the best legal protection for outsiders and more
advanced capital markets. Countries belonging to the German or Scandinavian cluster
are believed to sit in the middle in terms of both quality of legal protection for
outsiders and size of capital markets.
In the accounting literature, many studies refer to the Anglo-Saxon model when
they examine countries that belong to the English-origin group. Countries in the
5
German-origin and French-origin group, such as Spain and Italy, are considered part
of the Continental European cluster (Nobes and Parker, 2008). However, significant
differences are believed to exist for countries belonging to the Continental European
cluster. These variations, consistent with the methodology followed by La Porta et al.
(1997), are believed to be due to differences in the national legal system (Nobes and
Parker, 2000). In particular, the French and Italian accounting systems are influenced
by tax law, while the German accounting system is influenced by commercial law.
However, Delvaille et al. (2005) argue that a different level of internationalisation of
the companies listed on the domestic stock exchange may also be part of the cause
(Delvaille et al. 2005). For instance, a higher number of multinational enterprises are
based in France and Germany than in Italy and Spain.
Financial statements prepared under the Continental European model are likely
to display more conservative profits than those prepared under the Anglo-Saxon
model (Demaria and Dufour 2008). The main valuation principle is that of historical
cost. Prudence suggests that only gains that are certain be recorded, while appropriate
provisions should be set aside for possible losses. As a result, the historical cost can
be reduced if the value of the asset is believed to have decreased significantly, but it
cannot be increased unless a specific event occur, or if indicated by a specific law. In
Anglo-Saxon accounting systems, historical cost is frequently modified on the basis
of revaluations to reflect the ‘fair value’ of the assets on the balance sheet. Fair value
is defined as “[…] the amount for which an asset could be exchanged, or a liability
settled, between knowledgeable, willing parties in an arm’s length transaction” (IAS
39).
IFRS have been heavily influenced by the shareholder-based orientation typical
of the Anglo-Saxon system (Flower and Ebbers, 2002; and Hung and Subramanyam,
2007), for which the principle of ‘fair value’ is very important, although not exclusive (Cairns, 2006). The use of fair value impinges mostly on the book value of equity,
which could become more volatile (Devalle, 2008). IFRS have been introduced to
increase the cross-border comparability of financial statements, which should lead to
greater cross-border investment and higher allocational efficiency (Beneish et al.
2009). Evidence has been found of better market liquidity for adopters of IFRS
around the world. No evidence has been reported of better Tobin’s q (ratio of market
to book value of equity) and cost of capital of adopters (Daske et al., 2008). Some
literature has investigated the effects of the adoption of IAS/IFRS on value relevance
(see section 2.2).
Table 1 summarises the main differences in the accounting systems of the five
countries considered in the sample (France, Germany, United Kingdom, Spain, Italy).
Table 1 a) shows the main general features of each accounting system, and presents a
comparison with IFRS. The comparison is carried out across the following categories:
6
type of legal system, primary readers of financial reports, prevalent accounting
principle and valuation criteria, and the documents that comprise the set of financial
statements. Table 1 b) examines differences in asset valuation criteria. We report the
criteria allowed by Local GAAP as well as IFRS. Further, based on information
reported in Jaafar and McLeay (2007), we show for each criterion the percentage of
companies that used it in the years 1991, 1995, and 1999. The categories of assets
considered are: inventories, goodwill on consolidation, and fixed assets.
[insert table 1 here]
2.2 International Financial Reporting Standards and value relevance
The introduction of IFRS represents a profound change in many European
accounting models and it is expected to have an impact on the relation between
accounting data and stock prices. European managers and investors, in particular
those accustomed to a Continental European accounting system, need to assess the
implications of IFRS adoption (Hung and Subramanyam, 2007). These implications
encompass a number of issues. We focus on the implications on accounting quality,
and in particular on value relevance. Value relevance can be simply described as “[…] the ability of financial statement information to capture or summarise information that
affects share values” (Hellström, 2006, p325). Research in this area commenced as a
result of the feeling amongst professionals and academicians that historical cost
accounting was no longer a reliable indicator of the value of a firm. The movement
from an industry-oriented to a service-oriented economy is believed to be at the root
of this problem (Collins et al, 1997). Of late, doubts regarding the validity of value
relevance studies (Holthausen and Watts, 2001) have been rebutted by Hellström
(2006).
Initially, empirical studies report an increase in value relevance over time
(Collins, 1997; Francis and Schipper, 1999; Ely and Waymire, 1999; and Lev and
Zarowin, 1999). However, scale effects might have caused a spurious increase in the
metrics used for value relevance (Brown et al, 1999), as explained more in detail in
section 3. An anomalous negative relation between price and negative earnings
(Collins et al., 1999; and Papadaki and Siougle; 2007) has been ascribed to the
transitory nature of losses, which impairs their informativeness (Hayn, 1995).
Several studies assess the degree of value relevance in developed and emerging
economies. Value relevance of the German GAAP has been compared to that of the
US GAAP or IFRS (Harris et al, 1994; Bartov et al, 2005; Schiebel, 2006; Hung and
Subramanyam, 2007), with mixed findings. Controversy also exists as to whether the
US GAAP are more value relevant than IFRS (Harris and Muller, 1999; Van der
Meulen et al, 2007). In a multi-country study, Ali and Hwang (2000) find that value
relevance is lower in countries pertaining to the Continental European cluster than in
7
those included in the Anglo-Saxon cluster. IFRS do not appear to be more value
relevant than the national GAAP in Finland (Niskanen et al, 2000) and Switzerland
(Babalyan, 2001). With respect to emerging economies, Jermakowicz and Gornik-
Tomaszewski (2001) establish that value relevance in Poland is similar to that of more
developed economies, whereas Lin and Chen (2005) find that the Chinese GAAP are
more relevant than IFRS.
The impact of regulation on value relevance has also been investigated. Joos and
Lang (1994) establish that value relevance has improved in France, Germany and the
United Kingdom as a result of the EU fourth and seventh directives. Changes in
national accounting regulation are found to have improved value relevance in the
and Klimczak, 2007), and Norway (Gjerde et al, 2008). The impact of IFRS on value
relevance has been investigated for the United Kingdom (Horton and Serafeim, 2008),
Spain (Callao et al, 2007), and Germany (Jermakowicz et al., 2007), providing
conflicting results.
Table 2 reports the main features of the studies that have assessed value
relevance of different accounting standards. The first column reports the name of the
author(s) and year of publication, the second column reports the sample period, the
third column reports the objective of the study2, and finally the fourth column reports
the main findings.
[insert table 2 here]
3. Methodology and data
In order to assess the value relevance of a certain set of accounting measures one
can choose between two perspectives (Hellström, 2006): the ‘measurement
perspective’ evaluates the degree of association between accounting and market data;
the ‘signalling perspective’ investigates changes in market value due to announcement
of accounting information. This study uses the former approach to investigate whether
the introduction of IFRS has enhanced value relevance in Europe.
Most of the studies using the ‘measurement perspective’ rely on Ohlson’s (1995) Linear Information Model (LIM). According to Ohlson (1995), firm value is a
function of book value of equity and expected future residual (or abnormal) earnings3.
This relation is based on the assumption of clean surplus accounting: changes in
2 Some of the studies have multiple objectives aside from that regarding value relevance. For simplicity
and consistency with the aim of this paper, we limit the analysis to the investigation of value relevance. 3 Residual earnings are defined as current earnings minus expected earnings, where the expected
earnings are the product of the previous book value of equity and the cost of capital.
8
shareholders’ net equity that do not consist of transactions with shareholders
(dividends, share repurchases or offerings) should appear in the income statement. In
other words, current book value of equity should be equal to book value of equity of
the previous year, minus current dividends or share repurchases (plus in the case of
share offerings), plus earnings.
3.1 The price regression model
Following Barth et al. (2008), our first metric for value relevance is the
explanatory power of a regression of share price of company i (i = 1,...,N) in year t (t
= 1,...,T), denoted Pit, on book value of equity per share, denoted Bit, and earnings per
share, denoted Eit. This model is commonly referred to as price regression model, or
PRM, and derives from Ohlson’s (1995) LIM. In order to allow for changes in price
that are due to mean differences across industries or to cross-listing, Pit is pre-
regressed on industry and cross-listing fixed effects. The residuals of this
regression, *
itP , are regressed on Bit and Eit4.
Because of multiple observations, t, for each company, i, individual effects might
arise that cause values of *
itP for the same i to cluster together. This type of intra-
group correlation can be tackled using panel-data models. These models split the error
term of the regression of *
itP on Bit and Eit into two components: an individual (or
fixed) effect, allowing for unobservable characteristics of i that do not vary over time,
ηi; and a time-varying random term, εit.
Random Effects Model (REM) assumes that ηi is distributed randomly across
companies, and that there is no correlation between the covariates (Bit and Eit) and ηi
(orthogonality assumption). REM uses Generalised Least Square estimation to obtain
efficient estimates of the coefficients for Bit and Eit. However, if the orthogonality
assumption does not hold, the estimates are inconsistent. In such cases, Fixed Effect
Model (FEM) can be used in place of REM. FEM does not assume that ηi is
distributed randomly across units. FEM disposes of the individual effects by
subtracting the within-group average of the dependent variable ( *
iP ) and of the
covariates ( iB and iE ) from each observation. For this reason, FEM is also called
4 Barth et al. (2008) pre-regress Pit on industry and country effects (p. 486, op. cit.). We examine
country effects using equation (2) for each country as well as for the whole sample. Industry effects are
examined using the Industry Classification Benchmark index. Cross-listing effects are examined using
the number of stock exchanges on which a company is listed.
9
within-group estimator. Because ηi is constant for each i, differencing eliminates the
individual effects:
iitiit2iit1
*
i
*
it uuEEBBPP (1)
where iititu , and ),0(N~uu 2
iitiit
We have decided to use the within-group estimator to analyse the relationship
between share price and accounting data because it enable us to tackle the problem of
intra-group correlation as well as possible scale effects that might impair the
comparison of the explanatory power of the model (that is the coefficient of
determination, R2) in the period before and after the implementation of IFRS. Scale
effects refer to the influence of size on both accounting measures and share price:
companies with higher (lower) share price are likely to have larger (smaller) book
value of equity and larger (smaller) earnings per share. Scale effects may produce
spurious correlation between the dependent variable and the regressors of equation
(1), and hinder the comparability of the explanatory power between two or more sub-
samples (Brown et al., 1999; Gu, 2001; Ota, 2001). Subtracting the within-group
mean from each observation for the dependent and independent variables eliminates
any potential scale effects from the analysis. This technique is preferred to adjusting
for scale effects via deflation of all variables by some factor. A debate is still ongoing
as to what variable should be used as a deflator (Dedman et al., 2009) 5. Some studies
use the previous share price (Lang et al., 2006)6. In our opinion, deflating all variables
of the PRM by the previous share price does not solve the problem of scale effects,
because the term ηi will not be eliminated from the error term7.
5 Hellström (2006) attempts to mitigate scale effects by deflating all variables by the book value of
equity of the previous year, or by using a logarithmic transformation of all variables. 6 Other studies that use market value (rather than share price) as dependent variable employ a range of
deflators: market value at the beginning of the year, book value of equity, number of shares, sales
(Dedman et al., 2009). However, an optimal deflator has yet to be found (Akbar and Stark, 2003). 7 In an OLS regression of Pit on Bit and Eit, that is the PRM, dividing all variables by Pit-1 = Bit-1 + Eit-1 +
uit-1, where uit-1 = ηi+εit-1 will produce
1it
it
1it
it
1it
it
1it
it
P
u
P
E
P
B
P
P
. The deflation of the error term uit by
Pit-1 will transform uit as follows:
1iti1it1it
iti
1it
it
EBP
u
. Although both the numerator and
denominator contain the individual effects ηi, the impact of ηi on the numerator is larger than on the
denominator. This will produce an upward bias for the error term
1it
it
P
u
in the case ηi is positive and a
downward bias if ηi is negative.
10
Following Barth et al. (2005) we allow for the influence of variables other than
accounting information on share price by including an additional independent variable
in (1), *
1it
*
1itit P̂Pv , where *
1itP̂ is the fitted value of *
1itP according to (1):
iitiitiit2iit1
*
i
*
it uuvvEEBBPP (2)
In order to establish if the switch to IFRS has caused a structural break in the
relationship between share price and accounting data, we run a Chow test:
)k2nn()RSSRSS(
k)RSSRSS(RSSCHOW
2121
21
(3)
where:
RSS is the residual sum of squares of equation (2) for the whole
sample period;
RSS1 is the residual sum of squares of equation (2) for the pre-IFRS
period;
RSS2 is the residual sum of squares equation (2) for the IFRS period;
n1 is the number of observations of equation (2) for the pre-IFRS
period;
n2 is the number of observations of equation (2) for the IFRS period;
k is the number of estimated parameters (including the constant) of
equation (2).
CHOW follows an F-distribution with degrees of freedom k and (N-2k), where N
= n1+n2. The null hypothesis of the Chow test asserts that the coefficients on Eit and
Bit do not vary in the two periods:
H0: β1,1 = β1,2 and β2,1 = β2,2
H1: β1,1 ≠ β1,2 or β2,1 ≠ β2,2
11
where β1,1 is β1 for equation (2) for the pre-IFRS period, β1,2 is β1 for equation (2)
for the IFRS period, β2,1 is β2 for equation (2) for the pre-IFRS period, and β2,2 is β2
for equation (2) for the IFRS period.
If H0 is rejected, equation (2) does not adequately account for the relationship
between the dependent and the independent variables when the whole sample period
is examined. As a result of a structural break, the coefficients β1 and β2 have changed,
and the model for the whole sample period is misspecified. The explanatory power of
two regressions run separately for the pre-IFRS and IFRS period is higher than that of
a regression run for the whole sample period.
3.2 The return regression model
Commonly, a second derivation from Ohlson’s (1995) is used in the literature to test the robustness of the results obtained using the PRM. Taking first differences of
share price, book value of equity per share, and earnings per share yields:
1itit1itit1itit EEBBPP (4)
Using the clean surplus relation:
itit1itit DEBB (5)
where Dit denotes dividends or share repurchases (in the case of share offerings,
Dit is negative in equation (5)), the following relationship holds:
1itit1ititit1it1itit EEB)DEB(PP (6)
After simple algebraic transformations, equation (6) becomes:
ititit EER (7)
where it1ititit DPPR (cum-dividend return) and 1ititit EEE .
While the PRM explains the relation between share price and accounting data, a
regression based on equation (7) explains the relation between changes in share price
(adjusted for dividends) and accounting data. Commonly, both members of equation
(7) are deflated by Pit-1 to adjust for scale effects. The resulting model is referred to as
return regression model (RRM). However, for analogy with equation (2), we prefer
12
using the following within-group (FEM) specification for panel-data:
iitiit2iit1
*
i
*
it uuEEEERR (8)
where *
itR are the residuals of a regression of Rit on industry and cross-listing
fixed effects and, similar to equation (1), iititu . In order to mitigate the
problem of transitory earnings (Ota, 2001), we use Earnings Before Interest, Taxes,
Depreciation and Amortisation (EBITDA) per share instead of earnings per share, and
consider only observations for which the earnings per share are positive8. A Chow test
similar to that of equation (3) is employed to verify whether the relationship between
market data and accounting measures has undergone a radical change after the
implementation of the IFRS. In order to avoid introducing noise, we exclude
observations for which the current period, t, refers to the year 2005. Failing to exclude
these observations would cause the calculation of *
itR and ΔEit to be based on data
pertaining to both the pre-IFRS period (t-1 = 2004) and the IFRS period (t = 2005).
3.3 Data
The two regression models described in sections 3.1 and 3.2 above are applied to
consolidated accounts data and share prices collected from the database Thomson
Analytics, for the period 2002-2007. Share prices are collected three months after the
closing year date (as in Hellström, 2006; King and Langli, 1998; Van der Meulen et
al. 2007; and Kimberly, 2002).
Table 3 reports the sample selection process, showing for each step the number of
observations eliminated from the sample as well as those remaining. Only companies
reporting under Local GAAP before the mandatory switch to IFRS in 2005 are
included in the sample9. Companies reporting under US GAAP or any other
8 Transitory earnings refer to expenses or revenues that are unlikely to recur frequently, such as extra-
ordinary items. Using profitability measures that are not affected by extraordinary items (such as
EBITDA) helps reduce the problem. Losses are also considered to be transitory, because of a
liquidation option for shareholders (Hayn, 1995). Studies based on the RRM may also suffer from
accounting recognition lag: prices may reflect information quicker than accounting measures.
Generally, accounting recognition lag can be tackled using larger ‘windows’ for the calculation of
returns. However, due to the limited number of years available for our analysis and the lack of
quarterly data for earnings, we cannot employ this approach. 9 Voluntary adoption of IFRS has been found to lead to better accounting quality. This might be
because voluntary adopters have incentives to comply with IFRS rules. If there were no incentives,
13
accounting principles are excluded. Observations for which the book value of equity
is zero or negative are excluded, because of possible interference with local
regulations regarding financial distress. The foregoing selection criteria leave us with
a total number of observations of 13,904. Other observations are excluded for the
following reasons: book value of equity exceeds the assets; the number of shares
outstanding is missing; the price-to-earnings ratio is either smaller than the 0.01
percentile or greater than the 0.99 percentile. With respect to the latter criterion, used
in order to reduce the impact of price volatility on our results, the 0.01 and 0.99
percentile of the price-to-earnings ratio are calculated using observations for the
country under investigation when the analysis is carried out on a per-country basis.
When the overall sample is examined, the selection criteria applied to the original
sample leave us with 13,849 observations for 3,721 companies.
[insert table 3 here]
4. Results
4.1 Preliminary analysis
Table 4 reports descriptive statistics for share price, P, book value of equity per
share, BVPS, earnings per share, EPS, cum-dividend return, R, EBITDA per share,
ER, and changes in EBITDA per share, CR, separately for each country. We examine
statistically significant differences for the sample averages of each variable between
the pre-IFRS and IFRS periods using t-tests with unequal variances. We find that the
average P for the pre-IFRS period is significantly lower than for the IFRS period for
all countries except Germany. The average BVPS is significantly larger for the IFRS
period for France and the UK. The average EPS is significantly larger for the IFRS
period for all countries except Germany. For the UK the average EPS for the pre-
IFRS period is negative. The average R and CR do not differ significantly between
the pre-IFRS and IFRS period. The average ER is significantly larger for the IFRS
period for France and the UK. These preliminary results suggest that in the IFRS
period there has been a significant change in the average value of some of the
variables used in the PRM and RRM. However, these results say nothing about
changes in the explanatory power of the PRM and RRM; nor do they provide
information as to whether the relationship between P or R (measures of market
performance) and BVPS, EPS, ER, and CR (measures of accounting performance) has
changed as a result of IFRS adoption.
there would have been no reason to adopt IFRS voluntarily. When the adoption of IFRS becomes
compulsory, there might not be incentives to comply with IFRS rules. Compulsory adoption of IFRS
has not improved accounting quality (Christensen et al., 2008). We thank an anonymous referee for this
remark.
14
We examine statistically significant differences for the sample averages of each
variable across countries, for either the pre-IFRS or the IFRS period, using a One-
Way Analysis Of Variance tests. Statistically significant differences for the sample
medians are examined using Kruskal-Wallis tests. With the exception of CR, we find
that the average sample means of all variables differ across countries for both the pre-
IFRS and IFRS period. The average sample medians of all variables differ across
countries for both the pre-IFRS and IFRS period. These preliminary results suggest
that the analysis be carried out on a per-country basis rather than for the whole
sample, as it has been done in some of the extant literature (for instance, Barth et al.,
2008).
[insert table 4 here]
4.2 Results for the price regression model
Table 5 reports the results for equation (2), or the within-group estimation of the
PRM, for all five countries taken as a whole, and separately for each country.
For the whole sample the Chow test is significant at the 1% level, suggesting that
a structural break in the relationship between market data and accounting data took
place after the switch to IFRS. The restricted (pooled) model for equation (2) does not
adequately describe the relationship between accounting measures and stock price,
and should be discarded. The explanatory power (represented by the R2 of the within-
group estimation) increases from 51.04% for the pre-IFRS period to 57.70% for the
IFRS period. The coefficient on Bit decreases after the switch, while the coefficient on
Eit increases. Therefore, there is a higher (lower) value relevance of earnings (book
value of equity) after the implementation of IFRS. A negative coefficient on Eit is
found for the pooled model, which according to the Chow test is inherently
misspecified. A negative coefficient on vit is found for the IFRS period. Because vit
proxies for residual effects of non-accounting variables, this result is not inconsistent
with theory. The results for the overall explanatory power of the model and changes in
the coefficients of the regressors suggest that value relevance increased after IFRS
were implemented due to a higher value relevance of earnings.
For Germany the Chow test is significant at the 1% level. The explanatory power
decreases from 95.15% for the pre-IFRS period to 51.55% for the IFRS period.
Similar to what found for the whole sample, the coefficient on Eit increases after the
switch, while the coefficient on Bit decreases. Therefore, there is a higher (lower)
value relevance of earnings (book value of equity) after the implementation of IFRS.
The coefficient on vit is not significant for the pre-IFRS period. However, this does
not impair our analysis, as we are interested in the explanatory power of the
accounting measures only.
15
For Spain the Chow test is significant at the 1% level. The explanatory power
decreases from 40.52% for the pre-IFRS period to 7.33% for the IFRS period. The
coefficient on Eit is negative in the pre-IFRS period. Negative correlation between
price and earnings is counterintuitive, although already verified for firms that report
losses, as reported in section 2. For the pre-IFRS period 8% of the observations is
related to negative earnings, and the largest loss is -4,451,000€. For the IFRS period
the percentage drops to 5%, and the largest loss is -215,000€. Therefore, a negative
correlation between Eit and *
itP for the pre-IFRS period might be due to many large
losses. The coefficient on Bit decreases after the switch to IFRS. Both the coefficient
on Bit and that on Eit are positive but not significant at the 5% level for the IFRS
period. If the significance of the coefficient is considered as an indicator of value
relevance, independent of the magnitude of the coefficients (Hellström, 2006),
earnings are less value relevant after the introduction of IFRS. The coefficient on vit is
not significant for the IFRS period.
For France the Chow test is significant at the 5% level. The explanatory power
increases from 14.99% for the pre-IFRS period to 80.55% for the IFRS period.
Consistent with what found for the whole sample and Germany, the coefficient on Eit
increases after the switch, while the coefficient on Bit decreases. Therefore, there is a
higher (lower) value relevance of earnings (book value of equity) after the
implementation of IFRS. The coefficient on vit is not significant for the IFRS period.
For Italy, contrary to what found so far, the Chow test is not significant. The
restricted (pooled) model for equation (2) is preferred to the unrestricted model to
describe the relationship between share price and accounting measures. The
coefficients on Eit and Bit are lower for the IFRS period than for the pre-IFRS period.
For the UK, similar to what found for Italy, the Chow test is not significant.
However, the explanatory power increases from 69.88% for the pre-IFRS period to
84.87% for the IFRS period. The coefficients on Eit and Bit are considerably higher for
the IFRS period than for the pre-IFRS period. The coefficient on Eit is negative for the
pre-IFRS period. However, the results of the Chow test already suggested that the
unrestricted model is misspecified.
To summarise, IFRS appear to have produced a structural break in the
relationship between market data and accounting measures only for Germany, Spain,
and France. Moreover, the impact of IFRS on the explanatory power of a regression
of price on book value of equity per share and earnings per share differs according to
the country. While for Germany and Spain the explanatory power decreases after the
switch to IFRS, suggesting value relevance has worsened, for France there has been
an increase, suggesting value relevance has improved. Changes in the explanatory
power of for Italy and the UK might not be due to the adoption of IFRS according to
16
the results for the Chow test. The results for the coefficients on the explanatory
variables show that value relevance of earnings has increased after the implementation
of IFRS in all three countries for which the Chow test is significant. Conversely, value
relevance of book value of equity has decreased in all three countries for which the
Chow test is significant. In our opinion, the lower coefficient on book value of equity
might be due to the adoption of fair value accounting. If book value of equity is closer
to the actual market capitalisation of the firm, the book to market ratio, equal to the
slope coefficient on book value, is lower10.
[insert table 5 here]
4.3 Results for the return regression model
Table 6 reports the results for equation (8), or the within-group estimation of the
RRM, for all five countries taken as a whole, and separately for each country.
For the whole sample the Chow test is negative and not significant, suggesting
IFRS did not bring about any structural break in the relationship between market data
and accounting measures. However, the explanatory power increases from 21.38% for
the pre-IFRS period to 58.54% for the IFRS period. The coefficient on Eit (which in
this case represents EBITDA per share, not earnings per share) is negative for the pre-
IFRS period and positive for the IFRS period. For the pooled (restricted) model the
coefficient on Eit is negative. The coefficient on ΔEit is positive for all three
regressions. For the IFRS period, the coefficient on Eit is (in absolute value terms)
larger for the IFRS period than for the pre-IFRS period. On the contrary, the
coefficient on ΔEit for the IFRS period is smaller than for the pre-IFRS period.
For Germany the Chow test is significantly (1%) negative, suggesting the pooled
(restricted) model is preferred to the unrestricted model. As before, it does not seem
that the IFRS have brought about a significant change in the relationship between
market data and accounting measures. However, the explanatory power decreases
from 90.99% for the pre-IFRS period to 26.26% for the IFRS period. The coefficient
on Eit is negative for both the pooled model and the IFRS period. Consistent with
what reported for the whole sample, the coefficient on ΔEit for the IFRS period is
smaller than for the pre-IFRS period.
10 For instance, let BHC be book value of equity under historical cost accounting, BFV book value of
equity under fair value accounting, and MV market value of equity (the same regardless of the type of
accounting used). Assume a positive difference between fair value and historical cost of assets recorded
in the financial statements, that is BHC < BFV. In a regression of the type: MV = βB, where B is either
BHC or on BFV, β = MV/B. BHC < BFV implies MV/ BHC > MV/ BFV, and therefore, a change in BHC will
result in a larger slope coefficient, β, for MV than if BFV is used.
17
For Spain the Chow test (negative and significant at the 5%) suggests that the
pooled model is preferred to the unrestricted model, refuting the hypothesis that IFRS
have produced a significant change in the relationship between market data and
accounting measures. However, the explanatory power soars from 2.23% for the pre-
IFRS period to 65.81% for the IFRS period. It is worth mentioning that for the IFRS
period fixed effects are calculated for 110 companies, while the number of
observations is 142. Therefore, the number of residual degrees of freedom is 32 (while
that for the pre-IFRS period is 99). The surge in the explanatory power for the IFRS
period may be due to scarcity of residual degrees of freedom for the IFRS period. The
coefficient on ΔEit is not significant for the pooled model, nor is it significant for
either the pre-IFRS or the IFRS period. The coefficient on Eit is significantly positive
for the pooled model, not significant for the pre-IFRS period and significantly
negative for the IFRS period.
For France the Chow test is not significant, suggesting the pooled model
describes adequately the relationship between market data and accounting measures,
and therefore IFRS have not had a significant impact on this relationship. However,
the explanatory power soars from 7.03% for the pre-IFRS period to 67.45% for the
IFRS period. Unlike for Spain, this surge does not appear to be due to scarcity of
residual degrees of freedom for the IFRS period (there are 447 company fixed effects
and 638 observations). The coefficient on Eit is significantly negative for the pooled
model and not significant for either period of the unrestricted model. The coefficient
on ΔEit is positive and significant for the pooled model and either period of the
unrestricted model, but increases after the switch to IFRS.
For Italy the Chow test is not significant, suggesting that the pooled model
describes adequately the relationship between market data and accounting measures
and therefore IFRS have not had a significant impact on this relationship. However,
the explanatory power increases from 14.89% for the pre-IFRS period to 30.79% for
the IFRS period. Similar to what found for Spain, the increase in the explanatory
power for the IFRS period may be due to a much smaller number of residual degrees
of freedom than for the pre-IFRS period: for the former 71 residual degrees of
freedom are available, while for the latter 105. The coefficient on Eit for the pooled
model is negative and significant, while that on ΔEit is positive and significant.
Similar to what found for the pooled model, for the IFRS period the coefficient on E it
is negative and significant, while that on ΔEit is positive and significant. On the
contrary, for the pre-IFRS period the coefficient on Eit is positive and significant,
while that on ΔEit is negative and significant.
For the UK the Chow test is negative and significant at the 10% level. The
pooled model is preferred to the unrestricted model, and IFRS do not appear to have
had a significant impact on the relationship between market data and accounting
18
measures. However, the explanatory power increases from 27.71% for the pre-IFRS
period to 92.23% for the IFRS period. The coefficient on Eit is positive and significant
for the pooled model. For the unrestricted model, the coefficient on Eit is positive and
significant for the IFRS period, but negative and significant for the pre-IFRS period.
The coefficient on ΔEit is positive and significant at the 10% level for the pooled
model. For the unrestricted model the coefficient on ΔEit is negative, and it is
significant at the 1% level for the IFRS period, but not significant for the pre-IFRS
period.
To summarise, when a RRM is used rather than a PRM, IFRS appear not to have
produced a structural break in the relationship between market data and accounting
measures in any of the countries examined. Therefore, changes in value relevance, as
expressed by the explanatory power of the RRM before and after the implementation
of IFRS, might have occurred for reasons other than the introduction of IFRS.
However, the explanatory power of the RRM when all five countries are examined is
larger for the IFRS period than for the pre-IFRS period. This result is consistent with
what found using the PRM. Consistent with the results for the PRM are also the
results for the explanatory power of the RRM for Germany and the UK: value
relevance appears to be lower for the IFRS period than for the IFRS period. The
results for Spain, France, and Italy indicate that value relevance has increased during
the IFRS period, contrary to what found for the PRM.
The possible causes of the inconsistency between the results for the PRM and
those for the RRM are manifold. The RRM does not consider the effect of book value
of equity per share on stock returns but only the effect of earnings per share.
Observations for which earnings are negative are excluded when the RRM is used,
and EBITDA per share replaces earnings per share. The exclusion of negative
earnings and the use of EBITDA per share rather than earnings per share is to allow
for the problems of transitory earnings, of which the RRM appears to be affected. For
the RRM many observations are excluded that refer to 2005, and equation (8) does
not include the effects of variables other than accounting information. Adjustments
could be made to make the RRM more consistent with the PRM. However, some of
these adjustments are not possible. Including a proxy for variables other than
accounting information would cause a serious drop in the number of observations,
preventing us from running the RRM for the unrestricted model. Using even
observations for 2005 would introduce noise in the analysis. Finally, even if
adjustments were made to make the analysis more consistent with the PRM, the
problem of accounting recognition lag could not be addressed, due to the lack of a
sample period of sufficient length.
[insert table 6 here]
19
5. Other measures of accounting quality
Other measures of accounting quality that may be used to assess the effects of
IFRS are earnings smoothing and timely loss recognition (Barth et al., 2008). The
former variable can be proxied by earnings variability: the lower the variance of
earnings, the more likely is that earnings smoothing practices are used (Lang, Raedy
and Wilson, 2006). IFRS should discourage the application of earnings smoothing
practices, because they limit management’s discretion (Barth et al., 2008) and thus
earnings smoothing should have decreased after the implementation of IFRS. The
latter can be proxied by the frequency of large losses. If earnings management occurs,
large losses should be less frequent than in the case of no earnings management. IFRS
prohibits the creation of hidden reserves that can be used to conceal large losses.
5.1 Earnings smoothing and International Financial Reporting Standards
Our metric for earnings smoothing is the variability of annual change in net
income scaled by total assets (Lang, Raedy and Wilson, 2006), ΔIit. In order to allow
for variables other than management discretion that could affect earnings variability, a
two-stage process is followed: ΔIit is first regressed on variables that are believed to
affect earnings variability; the standard deviation of the residuals of the first
regression, *
itI , is used to understand whether IFRS have reduce earnings smoothing.
Following Barth et al. (2008), the first regression is:
iti12
i11it10i9i8it7it6
it5it43it2it10it
SEC
XLISTCLOSENUMEXAUDCFTURN
DISSUELEVEISSUEGROWSIZEI
(9)
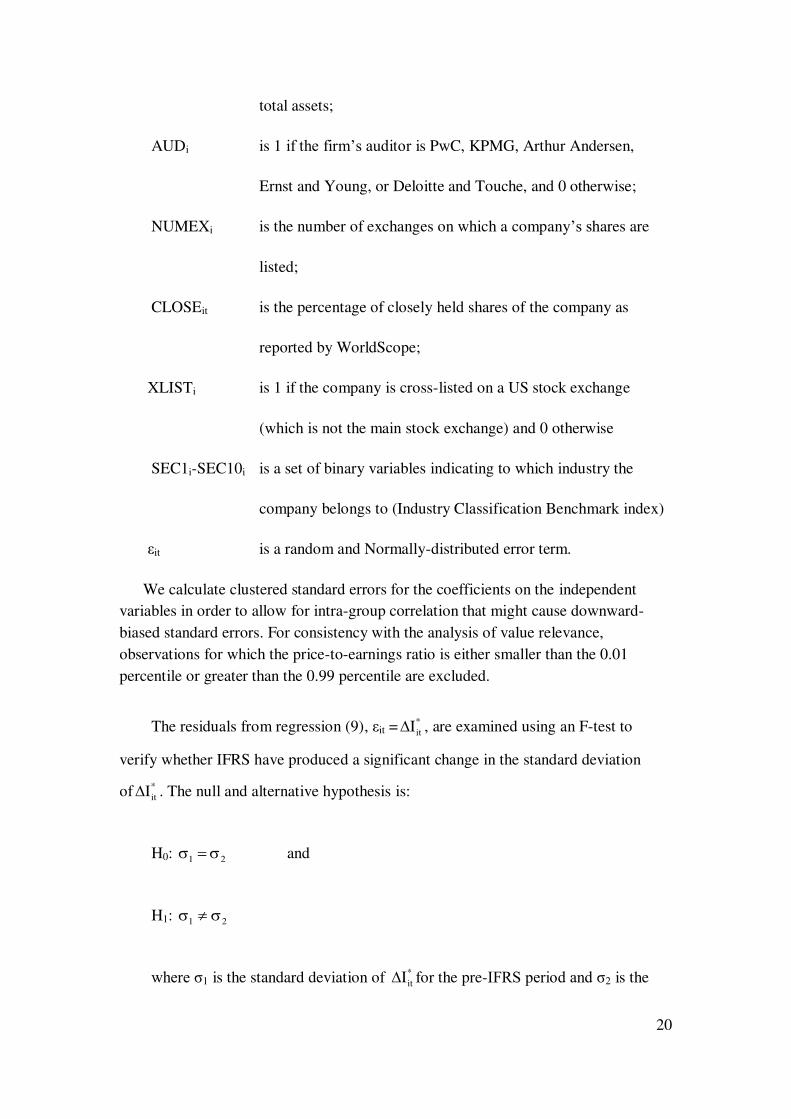
where:
SIZEit is the natural logarithm of market value of equity;
GROWit is annual change in sales;
EISSUEit is annual change in common stock;
LEVit is total liabilities divided by book value of equity;
DISSUEit is change in total liabilities;
TURNit is sales divided total assets;
CFit is annual net cash flow from operating activities divided by
20
total assets;
AUDi is 1 if the firm’s auditor is PwC, KPMG, Arthur Andersen,
Ernst and Young, or Deloitte and Touche, and 0 otherwise;
NUMEXi is the number of exchanges on which a company’s shares are
listed;
CLOSEit is the percentage of closely held shares of the company as
reported by WorldScope;
XLISTi is 1 if the company is cross-listed on a US stock exchange
(which is not the main stock exchange) and 0 otherwise
SEC1i-SEC10i is a set of binary variables indicating to which industry the
company belongs to (Industry Classification Benchmark index)
εit is a random and Normally-distributed error term.
We calculate clustered standard errors for the coefficients on the independent
variables in order to allow for intra-group correlation that might cause downward-
biased standard errors. For consistency with the analysis of value relevance,
observations for which the price-to-earnings ratio is either smaller than the 0.01
percentile or greater than the 0.99 percentile are excluded.
The residuals from regression (9), εit =*
itI , are examined using an F-test to
verify whether IFRS have produced a significant change in the standard deviation
of *
itI . The null and alternative hypothesis is:
H0: 21 and
H1: 21
where σ1 is the standard deviation of *
itI for the pre-IFRS period and σ2 is the
21
standard deviation of *
itI for the IFRS period.
5.2 Timely loss recognition and International Financial Reporting Standards
The second measure of accounting quality we examine is timely loss recognition.
The metric we use is the frequency of large negative net income, LNEGit, which we
use as an independent variable in the probit regression (Barth et al., 2008):
itit12i12i11
it10i9i8it7it6
it5it43it2it10it
LNEGSECXLIST
CLOSENUMEXAUDCFTURN
DISSUELEVEISSUEGROWSIZEIFRS
(10)
where:
IFRSit is 1 for observations pertaining to the IFRS period and 0
otherwise;
LNEGit is 1 if Iit < -0.20 and 0 otherwise;
and the other variables are defined as for equation (9). Similar to what we did for
the estimation of equation (9), we calculate clustered standard errors for the
coefficients on the independent variables in order to allow for intra-group correlation
that might cause downward-biased standard errors. Further, for consistency with the
analysis of value relevance and earnings smoothing, observations for which the price-
to-earnings ratio is either smaller than the 0.01 percentile or greater than the 0.99
percentile are excluded.
A positive (and significant) coefficient on LNEGit indicates a more frequent
recognition of losses for the IFRS period than for the pre-IFRS period. Accordingly, a
positive coefficient on LNEGit suggests accounting quality has improved after the
switch to IFRS.
5.3 Results for earnings smoothing and timely loss recognition
Table 7 reports the results for equations (9) and (10). With respect to earnings
smoothing, we do not find evidence that the switch to IFRS has increased the
variability of earnings, for any of the five countries examined. Therefore, earnings
smoothing does not appear to be less frequent after the introduction of IFRS. The
same conclusion can be drawn with respect to timely loss recognition. The coefficient
on LNEGit is negative and significant for France, Italy, and the UK. For Germany it is
negative but not significant. For Spain, no coefficient was calculated by Stata, due to a
22
problem of perfect collinearity between the dependent variable and LNEGit. However,
all observations for which LNEGit is 1 occurred in the pre-IFRS period. This result is
supportive of less timely loss recognition for the IFRS period.
[insert table 7 here]
6. Conclusions
This paper presents an analysis of the effects of the compulsory adoption of
IFRS for European listed companies, occurred in 2005. We examine the extent to
which accounting measures are reflected in share price and cum-dividend returns, or
value relevance, before and after this event. To this end, we apply panel-data
modelling to data for 3,721 companies listed on five European stock markets, for the
period 2002-2007. A Chow test is employed to identify potential structural breaks in
the regression coefficients in correspondence of 2005.
Our main findings are as follows. In a regression of share price on book value of
equity per share and earnings per share, for all companies in the sample, IFRS are
found to have increased value relevance of earnings, while value relevance of book
value of equity has decreased. The explanatory power of the regression has increased.
For individual countries, the effects (if any) of IFRS are mixed. For Germany, similar
to what found for the whole sample, value relevance of earnings has increased has
increased after the introduction of IFRS, while that of book value of equity has
decreased. However, the explanatory power of the regression has decreased. For
Spain, value relevance of book value of equity and earnings is lower for the IFRS
period than for the pre-IFRS period. For France, consistent to what found for the
whole sample, the explanatory power of the regression has increased. Value relevance
of earnings has also increased. For Italy and the United Kingdom, IFRS have not
brought about any structural break in the relationship between share price and
accounting measures.
In a regression of cum-dividend return on EBITDA per share and changes in
EBITDA per share, no structural breaks are found as a result of the implementation of
IFRS. Tests on earnings smoothing and timely loss recognition, which are commonly
used along with value relevance to assess accounting quality, have not found evidence
of an improvement in accounting quality after the switch to IFRS.
Overall, our results suggest that the main aim of IFRS, that is to achieve better
cross-border comparability of financial statements via harmonisation of accounting
standards, may still not have been achieved. Differences across accounting systems in
Europe are still significant. IFRS introduction has had a heterogeneous impact on
European accounting systems. Further research should investigate whether IFRS have
been implemented in a consistent manner throughout Europe, and if its enforcement
23
has somehow been hindered by national factors associated with either culture or legal
system, or both. Therefore, we expect future studies to investigate to what extent
accounting harmonisation is taking place, and the factors that are inhibiting its
progress.
24
References
Akbar S., Stark A. W. (2003), Discussion of scale and the scale effect in market-based accounting
research, Journal of Business Finance and Accounting, 30 (1), 57-72
Ali M. J., Ahmed K., Henry D. (2006), Harmonization of accounting measurement practices in
South Asia, Advances in International Accounting, 19, 25-58
Ali A., Hwang L. S. (2000), Country-Specific factors related to financial reporting and the value
relevance of accounting data, Journal of Accounting Research, 38:1, 1-21
d’Arcy A. (2001), Accounting classification and the international harmonisation debate – an
empirical investigation, Accounting, Organizations and Society, 26, 327-349
Babalyan L. (2001), Association between accounting earnings and stock returns as a measure of
value relevance of accounting standards: empirical evidence from the Swiss market, paper
available at SSRN: http://www.ssrn.com/abstract=301923
Barth M. E., Beaver W. H., Landsman W. R. (2001), The relevance of the value relevance
literature for financial accounting standard setting: another view; Journal of Accounting and
Economics, 31, 77-104;
Barth M. E., Landsman W. R., Lang M. H. (2008), International Accounting Standards and
accounting quality, Journal of Accounting Research, 46 (3), 467-498;
Bartov E., Goldberg S., Kim M. (2005), Comparative value relevance among German, U.S. and
International Accounting Standards: a German stock market perspective, Journal of Accounting,
Auditing and Finance, 20, 95-119
Beneish M. D., Miller B. P., Yohn T. L. (2009), The effect of IFRS adoption on cross-border
investment in equity and debt markets, paper available at SSRN:
Brown S., Lo K., Lys T. (1999), Use of R2 in accounting research: measuring changes in value
relevance over the last four decades, Journal of Accounting and Economics, 28, 83-115
Busso D., Devalle A. (2008), The application of the fair value measurement: the cases of the
CAC40, DAX30, IBEX35 and S&PMIB40 indexes, paper presented at the “Annual International Conference on Accounting and Business 2008” held in Shanghai, June 6-8
Cairns D. (2006), The use of fair value in IFRS, Accounting in Europe, 3:1, 5-22
Callao S., Jarne J., Laìnez J. (2007), Adoption of IFRS in Spain: effect on the comparability and
relevance of financial reporting, Journal of Accounting, Auditing and Taxation, 16, 148-178
Collins D. W., Maydew E. L., Weiss I. S. (1997), Changes in the value-relevance of earnings and
book values over the past forty years, Journal of Accounting and Economics, 24, 39-67
Christensen H. B., Lee E., Walker M. (2007), Incentives or standards: what determines accounting
quality changes around IFRS adoption?, Working Paper Manchester Business School, paper
25
available at SSRN: http://papers.ssrn.com/sol3/papers.cfm?abstract_id=1013054
Daske H., Hail L., Leuz C., Verdi R. (2008), Mandatory IFRS Reporting around the World: Early
Evidence on the Economic Consequences, Journal of Accounting Research, 46, 1085-1142
Demaria S., Dufour D. (2007), First time adoption of IFRS, Fair value option, Conservatism:
evidences from French listed companies, Paper published presented at “30 éme colloque de
l’EAA, Lisbon 2007”
Dedman E., Mouselli S., Shen Y., Stark A. W. (2009), Accounting, intangible assets, stock market
activity, and measurement and disclosure policy – views from the UK, Abacus, 45 (3), 312-341
Devalle A. (2008), The impact of the gains and losses recognised directly in equity on the
company profitability - An empirical evidence from European Stock Exchanges, Economia
Allowed by IFRS Intangibles: cost or revaluation model
Properties, Plant and Equipment: cost or revaluation model
Investment properties: cost or fair value
Depreciation: SL, DB and UP
31
Notes to table 1 b):
^ The percentages do not add to 100% because criteria that are not relevant for comparison with IFRS have not been reported. Some companies have been found to use
valuation criteria that are not allowed by Local GAAP. The reason for the departure from Local GAAP is the reporting under other GAAP (for instance, US GAAP), as
explained in the notes to the financial statements.
LIFO = last in first out; FIFO = first in first out; AC = average cost; IWO = immediate write off; A= amortization; PC= permanent capitalization; SL = straight line; DB =
declining balance; UP = unit of production; HC = historical cost; MHC = modified historical cost.
Sources:
Jaafar A., McLeay S. (2007), Country Effects and Sector Effects on the Harmonization of Accounting Policy Choice, Abacus, 43, 156-189.
Nobes C., Parker R., Comparative International Accounting, 10th edition, Prentiche Hall, 2008; Radebaugh L.H., Gray S.J., International Accounting and Multinational
Enterprises, 3rd edition, Wiley, 1993; Choi F.D.S., International Finance and Accounting Handbook, 3rd edition, Wiley, 2003.
32
Table 2: Literature review on the use of value relevance models.
Paper Sample period Topic Results
Harris et al. (1994) 1982-1991 Comparison of value relevance German GAAP and US GAAP.
Significant association between accounting data provided under German GAAP and stock prices and returns. Explanatory power of earnings for returns in Germany comparable to that in the US. Explanatory power of book value of equity for price significantly lower in Germany than in the US. Little evidence of improved value relevance after Accounting Directives Law (1985).
Joos and Lang (1994)
1982-1990 Investigation of effects of EU directives on value relevance in the UK, Germany and France.
Improved value relevance in all countries after the EU directives.
Harris and Muller (1999)
1992-1996 Comparison of value relevance US GAAP and IAS. Better value relevance for IAS when stock price is considered. Better value relevance for US GAAP when stock return is considered.
Ali and Hwang (2000)
1986-1995 Comparison of value relevance Continental model and Anglo-Saxon model
Lower value relevance for Continental model.
Niskanen et al. (2000)
1984-1992 Evaluation of incremental value relevance of reconciliation from Finnish Local Accounting Standards (LAS) to IAS.
No evidence of value relevance for reconciliation of Finnish LAS to IAS at an aggregate level. Significant value relevance for reconciling adjustments of untaxed reserves and consolidation differences.
Babalyan (2001) 1997-1999 Comparison of value relevance according Swiss GAAP, US GAAP and IAS.
US GAAP are more value relevant than IAS and Swiss GAAP. Firm size effect discovered and ascribed to greater demand for information for larger firms.
Bartov et al. (2005) 1998-2000 Comparison of value relevance German GAAP, US GAAP and IAS.
US GAAP are more value relevant than IAS, which are in turn more value relevant than German GAAP.
Lin and Chen (2005) 1995-2000 Evaluation of incremental value relevance of reconciliation from Chinese Accounting Standards (CAS) to IAS.
Evidence of little value relevance for reconciliation of CAS to IAS, mainly for stock prices of B-type shares11.
11 In the Chinese stock market, A-type shares are those available only to domestic investors whereas B-type shares are available to both foreign and domestic investors
(since 2001).
33
Table 2 (continued)
Paper Sample period Topic Results
Schiebel (2006) 2000-2004 Comparison of value relevance German GAAP and IFRS. German GAAP are more value relevant than IFRS.
Hellström (2006) 1994-2001 Investigation of changes in value relevance in Czech Republic (transitional economy).
Improved value relevance over time.
Callao et al. (2007) 2004-2005 Investigation of effects of IFRS adoption on value relevance in Spain.
Worse value relevance when IFRS are applied.
Dobija (2007) 1997-2006 Investigation of changes in value relevance in Poland (transitional economy).
Better value relevance of accounting earnings.
Hung and Subramanyam (2007)
1998-2002 Investigation of effects of IAS adoption on value relevance in Germany.
No evidence of better value relevance of IAS over German GAAP.
Naceur and Nachi (2007)
1992-2001 Investigation of effects of changes in Tunisian GAAP (in particular, 1997 accounting reform) on value relevance.
Better value relevance after the 1997 accounting reform. No evidence of firm size effect.
Van der Meulen et al. (2007)
2000-2002 Comparison of value relevance US GAAP and IFRS earnings.
No evidence of different value relevance between US GAAP and IFRS earnings.
Jermakowicz et al. (2007)
1995-2004 Comparison of the value relevance of accounting income reported under German HGB, IFRS and US GAAP
Better value relevance adopting IFRS or US GAAP
Gjerde et al.(2008) 1965-2004 Investigation of changes in value relevance in Norwegian GAAP over time (transition from Continental to Anglo-Saxon model).
Better value relevance over time.
Horton and Serafeim (2008)
2005 Evaluation of incremental value relevance of reconciliation from UK GAAP to IFRS.
Reconciliation of UK GAAP to IFRS is value relevant.
Dedman et al. (2009)
1991-2006 Evaluation of value relevance of R&D expenditure in the UK
R&D expenditure is value relevant.
34
Table 3 Construction of the sample.
Selection process: steps Number of observations excluded Number of observations left
Worldscope 2002-2003-2004-2005-2006-2007 32,076
Observations excluded because of accounting
standards^ -14,716 17,360
Observations excluded because of missing values
for share price, book value of equity and earnings -2,858 14,502
Observations excluded because of a zero or
negative book value of equity -598 13,904
Observations excluded because of a book value of
equity larger than the total assets -36 13,868
Observations excluded because of missing data on
the total number of outstanding shares -11 13,857
Observations excluded because of a price to
earnings ratio above (below) the 0.99 (0.01)
percentile
-8 13,849
Notes to table 3:
^ These companies were either voluntary adopters of IFRS before IFRS became compulsory or they published their financial statements according to a standards different
Notes to table 4: P is share price, BVPS is book value of equity per share, EPS is earnings per share, R is the cum-dividend annual return per share, ER is the EBITDA per
share, and CR are annual changes of ER. The numbers 1 and 2 indicate whether the statistics refer to the pre-IFRS period (before 2005) or the IFRS period (2005-2007): 1
refers to the statistics for the pre-IFRS period; and 2 refers to the statistics for the IFRS period. N denotes the number of observations. Mean denotes the average. Median
denotes the 50th percentile. FQ denotes the 25th percentile. TQ denotes the 75th percentile. All the values represent thousands of Euros for Germany, Spain, France and Italy,
and thousands of Pound Sterling for the UK.
For each country, ^ indicates that the mean for the pre-IFRS period is different from the mean for the IFRS at the 5% level of significance (or higher). Across countries, +
indicates that the means are significantly different at the 5% level of significance (or higher), according to One-Way Analysis Of Variance, while # indicates that the medians
are significantly different at the 5% level of significance (or higher), according to a Kruskal-Wallis test.
Notes to table 5: The dependent variable is Pit* as defined for equation (2). Bit is the book value of equity per share. Eit is the earnings per share. Standard errors of the
coefficients are shown in brackets. The second column reports the results for the whole sample period. The third and fourth column reports the results for the pre-IFRS
period and IFRS period, respectively. N denotes the number of observations. R2 (within) denotes the coefficient of determination of the within-group estimator. CHOW
denotes the estimated F-test statistic for the Chow test calculated according to equation (3), where fixed effects are allowed to vary in the two periods. Observations for
which the ratio equity on total assets is either negative or zero are discarded. Moreover, in order to limit the influence of price volatility, observations for which the price-to-
earnings ratio is either smaller than the 0.01 percentile or greater than the 0.99 percentile are excluded. Variation in share price due to mean differences across industries or to
cross-listing has been eliminated by regressing share price on binary variables representing the industry and the number of stock exchanges on which a company is listed
prior to using equation (2).
*** Denotes rejection of the null hypothesis at the 1% level.
** Denotes rejection of the null hypothesis at the 5% level.
* Denotes rejection of the null hypothesis at the 10% level.
Notes to table 6: The dependent variable is Rit* as defined for equation (8). Eit is the EBITDA per share. ΔEit is the annual change in EBITDA per share. Standard errors of
the coefficients are shown in brackets. The second column reports the results for the whole sample period. The third and fourth column reports the results for the pre-IFRS
period and IFRS period, respectively. N denotes the number of observations. R2 (within) denotes the coefficient of determination of the within-group estimator. CHOW
denotes the estimated F-test statistic for the Chow test calculated according to equation (3), where fixed effects are allowed to vary in the two periods. Observations for
which the ratio equity on total assets is either negative or zero are discarded. To reduce the problem of transitory earnings, observations for which the earnings per share are
negative have been excluded. Moreover, in order to limit the influence of price volatility, observations for which the price-to-earnings ratio is either smaller than the 0.01
percentile or greater than the 0.99 percentile are excluded. Variation in share price due to mean differences across industries or to cross-listing has been eliminated by
regressing share price on binary variables representing the industry and the number of stock exchanges on which a company is listed prior to using equation (8).
*** Denotes rejection of the null hypothesis at the 1% level.
** Denotes rejection of the null hypothesis at the 5% level.
* Denotes rejection of the null hypothesis at the 10% level.
44
Table 7 Results for earnings smoothing and timely loss recognition.
Notes to table 7: SD1 is the standard deviation of*
itI for the pre-IFRS period, while SD2 is the standard deviation of *
itI for the IFRS period. SD1/SD2 is the ratio of the
standard deviation of*
itI for the pre-IFRS period to the standard deviation of *
itI for the IFRS period. N is the number of observations. LNEGit is the coefficient on the
variable LNEGit defined in equation (10).
*** Denotes rejection of the null hypothesis at the 1% level.
** Denotes rejection of the null hypothesis at the 5% level.
* Denotes rejection of the null hypothesis at the 10% level. ^ Indicates that for Spain the coefficient on LNEGit was not reported by Stata, because of perfect collinearity between LNEGit and the dependent variable, IFRSit. In
particular, all cases for which LNEGit = 1 occur during the pre-IFRS period. Therefore, these results are not supportive of more timely loss recognition.