ATPS Working Paper Series No. 44 An Assessment of the Effects of Technology Transfer on Gender Roles within a Community: The Development of Tea and Coffee Production among Smallholder Farmers in Kiambu District, Central Province Kenya Winifred N. Karugu
Transcript
ATPS Working Paper Series No. 44
An Assessment of the Effects of
Technology Transfer on Gender Roles
within a Community: The Development
of Tea and Coffee Production among
Smallholder Farmers in Kiambu District,
Central Province Kenya
Winifred N. Karugu
Published by the African Technology Policy Studies Network, P.O. Box 10081, 00100 General Post
ABOUT THE AFRICAN TECHNOLOGY POLICY STUDIES NETWORK
The African Technology Policy Studies Network (ATPS) is a multi-disciplinary network of researchers,
policymakers, actors in the private sector and other end users interested in generating, promoting
and strengthening innovative science and technology policies in Africa. With a regional secretariate
in Nairobi, the network operates through national chapters in 23 countries, with an expansion plan to
cover the entire sub-Saharan Africa.
One of the objectives of the network is to disseminate research results to policy makers, legislators,
the organized private sector, civil society, mass media and farmers’ groups through publications,
dialogue and advocacy. Among its range of publications are the Working Paper Series (WPS),
Research Paper Series (RPS), Special Paper Series (SPS) and the Technopolicy Briefs.
Papers published under the Working Paper Series (WPS) are those produced from the
ATPS small grants process or from regional projects. The WPS are not subjected to the
strict requirements of the RPS but this does not suggest that they do not have significant
policy or methodological contribution to make to the work of ATPS. The Board supports all
efforts aimed at improving the WPS, such as building skills that will make most of the ATPS
research outputs to be published under the RPS. Researchers are encouraged to produce
their final drafts in a publishable manuscript form that is shorter and easier to read.
ATPS is supported by a growing number of donors including the International Development Research
Centre (IDRC), the Carnegie Corporation of New York, the Rockefeller Foundation, the World Bank,
the OPEC Fund, Ford Foundation, Coca-Cola Eastern Africa, the African Development Bank, InfoDev
and the Royal Dutch Government.
Table of Contents
Abbreviations
List of Tables and Figures
Abstract
Chapter One: Background 1
1.1 Research Site 1
1.2 Statement of the Problem 4
1.3 Research Objectives 5
1.4 Justification 5
1.5 Assumptions 5
1.6 Limitations of the Study 6
1.7 Definition of Terms 6
Chapter Two: Literature Review 8
2.1 Theoretical Orientation 8
2.2 Women and Development 8
2.3 Gender and Development 9
2.4 Agricultural Technology and Gender 11
2.5 Gender Analysis 13
2.6 The Kikuyu People 14
2.7 General Statistics 15
2.8 General Information 17
Chapter Three: Research Methodology 18
3.1 Unit of Study 18
3.2 Data Collection Tools 18
3.3 Population and Sampling Techniques 19
3.4 Research Design 19
3.5 Data Analysis 20
3.6 Complementary Activities 21
Chapter Four: Analysis and Results 22
4.0 Introduction 22
4.1 General Characteristics of the Respondents 22
4.2 Economic Status 27
4.3 Gender Analysis 30
4.4 Socio-Economic Status by Type of Household 30
4.5 Division of Labour 32
4.6 Agricultural Extension vs Types of Households 34
4.7 Social Affiliation vs Sex 38
Chapter Five: Summary, Conclusions and Recommendations 40
5.1 Summary 40
5.2 Conclusions 40
5.3 Recommendations 42
Selected Bibiliography 43
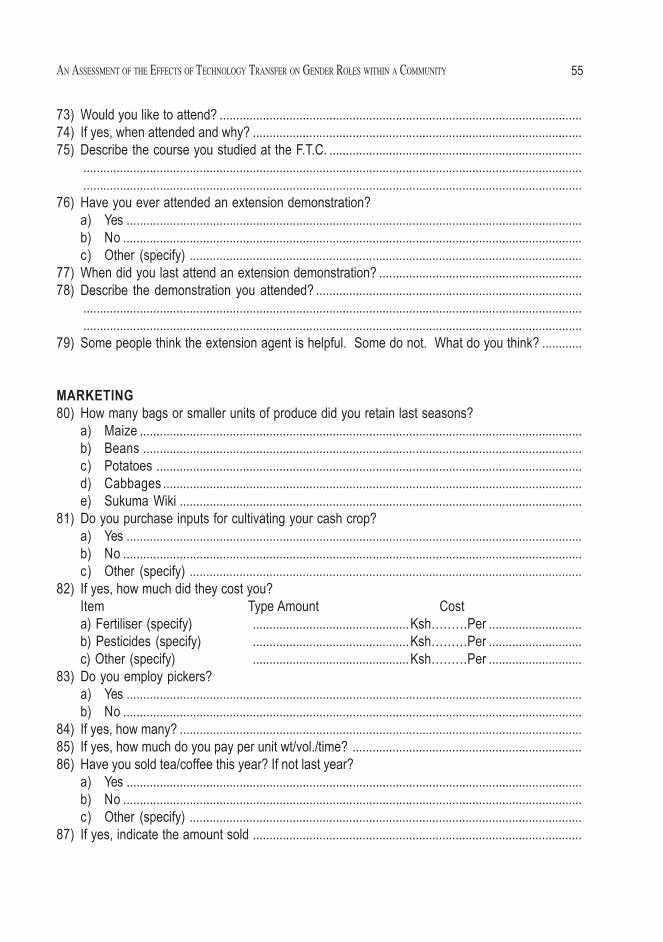
Appendix I: Questionnaire 47
Appendix II: Tables and Charts 59
Abbreviations
AFC Agricultural Finance Corporation
CBK Coffee Board of Kenya
FHH Female-Headed Household
FOH Female-Operated Household
KPCU Kenya Planters Co-operative Union
KTDA Kenya Tea Development Authority
MHH Male-Headed Household
i
List of Tables
Table 1: Foreign trade in goods 1998 (K million pounds)
Table 2: Hectarage under coffee
Table 3: Hectarage under tea
Table 4: Distribution by crop
Table 5: Distribution by division
Table 6: Sex distribution
Table 7: Divisions - tea
Table 8: Divisions - coffee
Table 9: Sex distribution (both groups)
Table 10: Level of education
Table 11: Other economic activities
Table 12: Strongest responses for indicators of economic status (%)
Table 13: Type of household
Table 14: Kind of house * type of household cross tabulation (%)
Table 15: Task allocation between the sexes (percent)
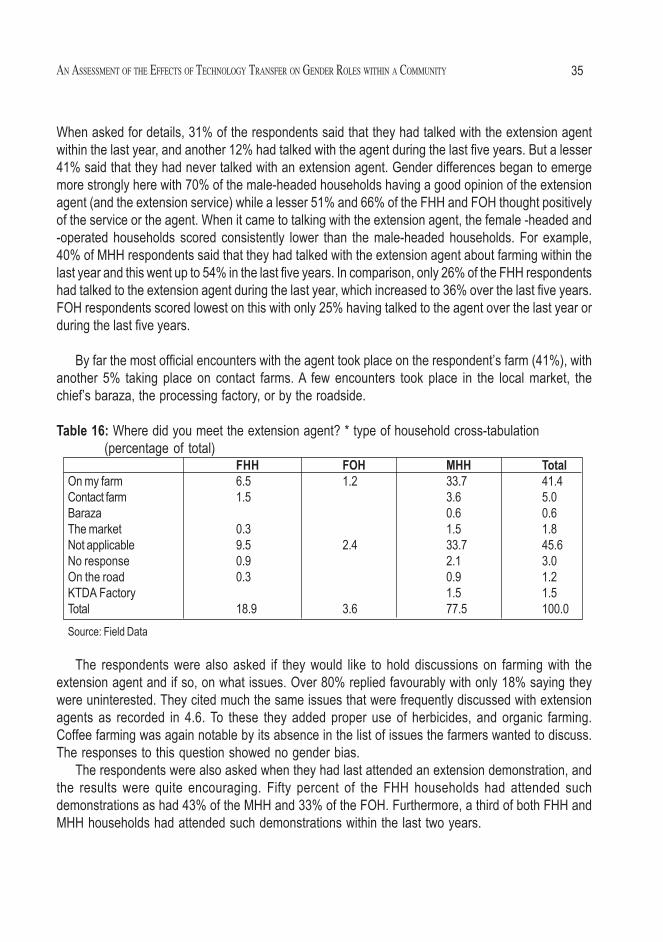
Table 16: Where did you meet the extension agent? * type of household cross tabulation
Table 17: Type of household vs have you ever attended an extension demonstration?
Table 18: Opinion on the usefulness of the extension agent
Table 19: Do you keep farm records and accounts?
Table 20: Do you employ pickers?
Table 21: Sex vs. group membership (percentage of total)
Table 22: Sex vs Indicate how often you attend barazas (percentage)
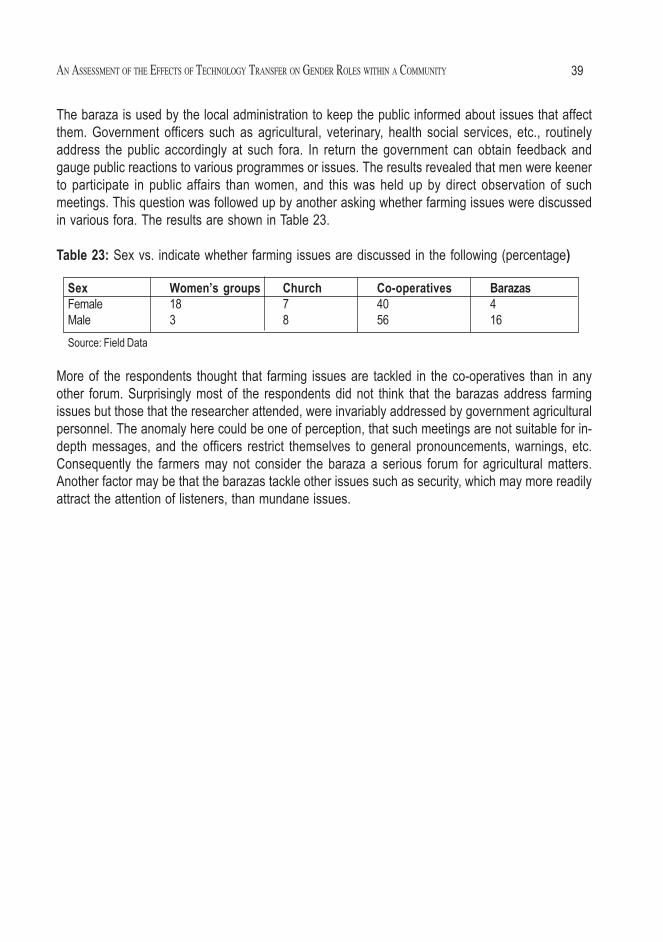
Table 23: Sex vs Indicate whether farming issues are discussed in the following (percentage)
Table 24: Distribution by sex - tea
Table 25: Distribution by sex - coffee
Table 26: Sex * are you married? cross tabluation (%)
Table 27: Marital status - both crops
Table 28: Sex of respondent vs. marital status - tea
Table 29: Marital status - coffee
Table 30: Spouse location (both crops)
Table 31: Spouse location (tea)
Table 32: Spouse location (coffee)
Table 33: Age of respondents
List of Tables and Figures
ii
Table 34: Level of education
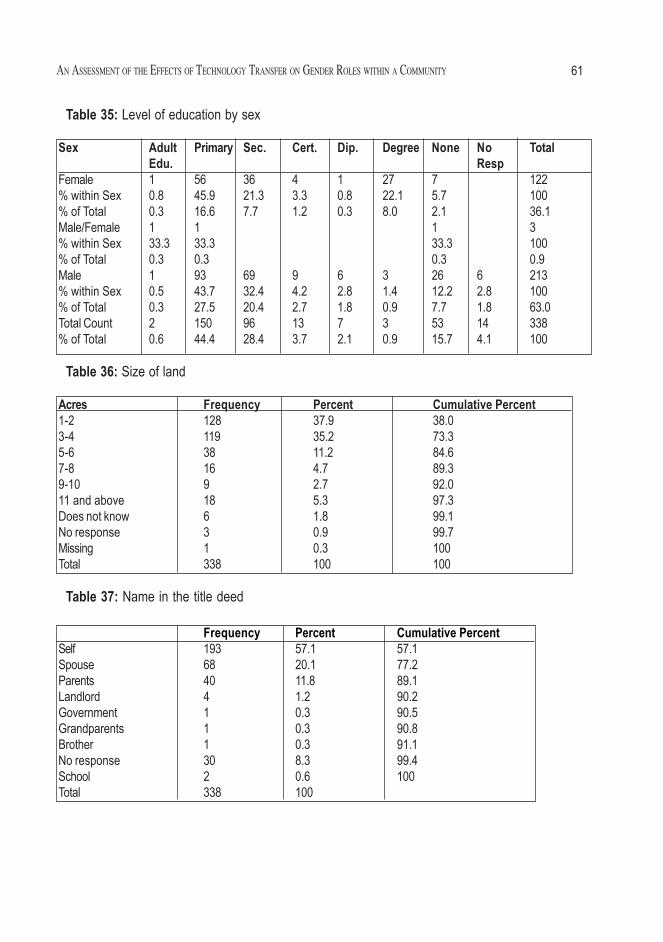
Table 35: Level of education by sex
Table 36: Size of land
Table 37: Name in the title deed
Table 38: Age*Type of household cross tabulation
Table 39: Do you have children? * type of household cross tabulation
Table 40: Level of education * type of household cross tabulation
Table 41: other economic activity? * type of household cross tabulation
Table 42: Title deed name * type of household cross tabulation
Table 43: Do you own any of the following? * type of household cross tabulation (%)
Table 44: form of transport * type of household cross tabulation
Table 45: form of information? * type of household cross tabulation
Table 46: Source of water * type of household cross tabulation
Table 47: Other enterprises - who do them? * type of household cross tabulation
Table 48: Irrigation * type of household cross tabulation
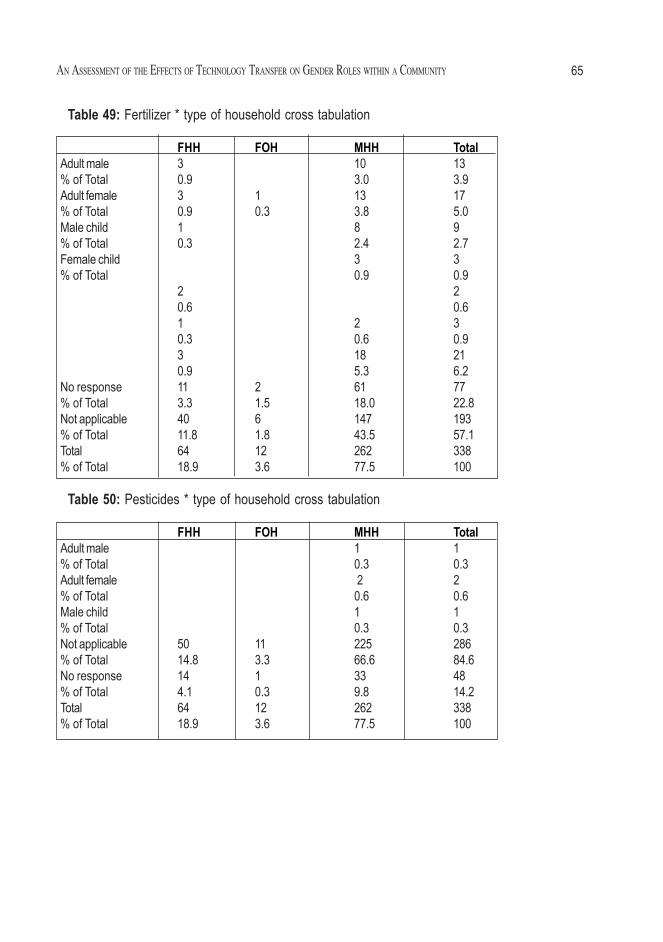
Table 49: Fertilizer * type of household cross tabulation
Table 50: Pesticides * type of household cross tabulation
Table 51: Picking * type of household cross tabulation
Table 52: Post harvest activities * type of household cross tabulation
Table 53: Who does the land preparation? * type of household cross tabulation
Table 54: who does the planting? * type of household cross tabulation
Table 55: Pruning - who does it? * type of household cross tabulation
Table 56: Farmyard manure - who applies it? * type of household cross tabulation
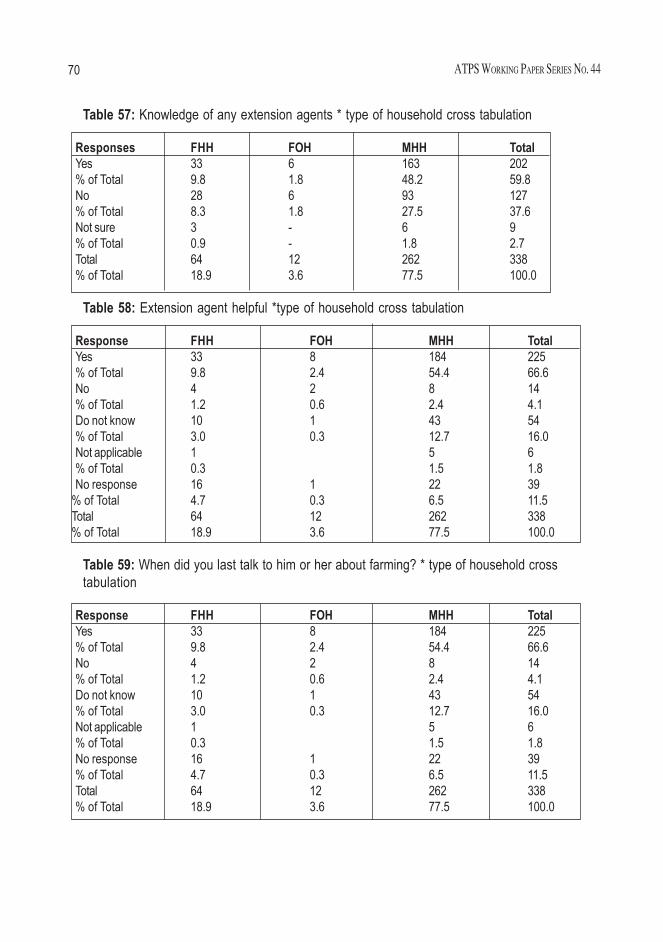
Table 57: Knowledge of any extension agents * type of household cross tabulation
Table 58: Extension agent helpful *type of household crosstabulation
Table 59: When did you last talk to him or her about farming? * type of household cross
tabulation
Table 60: Do you keep farm records and accounts? * type of household cross tabulation
List of Figures
Figure 4.1: Age of respondents
Figure 4.2: Number of children
Figure 4.3: Do you keep farm records and accounts?
Figure 4.4: Number of children
Figure 4.5: Dependants’ location
Figure 4.6: Land size
Figure 4.7: Leisure activities
Figure 4.8: Crop cultivation
Figure 4.9: Child rearing
Figure 4.10: Other enterprises
Figure 4.11: Fertilisers application
iii
Figure 4.12: Fetching firewood
Figure 4.13: Postharvest activities
Figure 4.14: Housework
Figure 4.15: Irrigation
Figure 4.16: Layout
Figure 4.17: Farm yard manure
Figure 4.18: Pesticides
Figure 4.19: Postharvest activities
Figure 4.20: Picking
Figure 4.21: Pruning
Figure 4.22: Land preparation
Figure 4.23: Crop cultivation
Figure 4.24: Purchase of Inputs for cultivating tea or coffee
Figure 4.25: Costs of the purchases
iv
Judged by the usual economic measures tea and coffee production have in the past been Kenya’s
most successful examples of transfer of technology among small scale farmers, but while ample
technical, financial and legal information exists, there has been inadequate information about the
effect that the adoption of this technology has had on gender roles within the communities concerned.
Kiambu District in the Central Province of Kenya was selected as the study site because it was
among the first to pioneer tea and coffee production by African farmers, and also because it has
typically heavy participation by female farmers in tea and coffee production. This study proposed to
assess the effects of the adoption of an entire package of technology on gender roles in Kiambu
District with the intention of positively influencing policy.
Specific objectives were to assess:
§ The effect the adoption of agriculture technology has had on the socio-economic status of
males, females and different age groups
§ The impact that the adoption of this technology has had on division of labour
§ The extent to which support services for this package of technology are gender sensitive
§ The impact that this technology has had on gender roles with respect to post harvest activities.
This study used a survey instrument, literature search, and direct observation, to collect data from
small scale farmers, regarding the effects of tea and coffee production on gender roles in the
Kiambu district of the Central province of Kenya. Focussed group discussions and key informants
were used to validate the data collected. During the survey 338 respondents were interviewed using
purposive random sampling of the six divisions that make up Kiambu district. Of these 36% were
women and 64% were men. The respondents were further broken down into three types of households,
male-headed (77%), female-headed (18%) and female-operated households (4%), based on the
de jure and de facto heads of the household. They were also broken down according to the two
crops. Analysis was done for socio-economic status, division of labour, access to support services,
social affiliation and marketing.
The results showed gender disparities among the sexes, age groups and types of household. Tea
earnings are higher and more reliable than those of coffee, yet coffee farmers enjoy a higher standard
of living than tea farmers. Participation in production by those under 30 years of age was negligible.
Female-headed households have less access to resources, education, support services, and
postharvest services. Such disparities need to be addressed if the performance of small-scale cash
crop farmers is to improve.
Abstract
v
1
Chapter One
Introduction
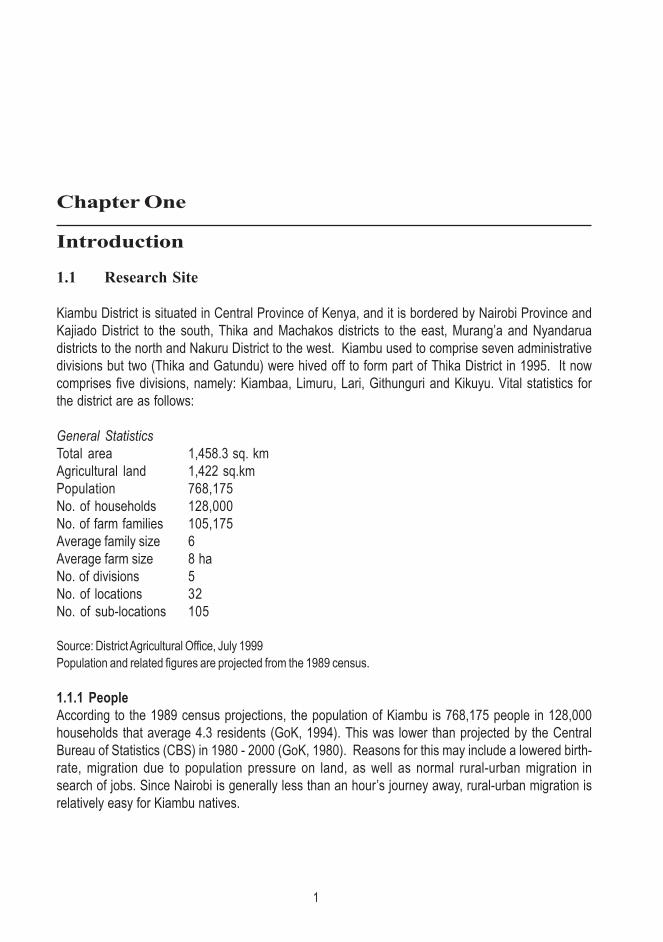
1.1 Research Site
Kiambu District is situated in Central Province of Kenya, and it is bordered by Nairobi Province andKajiado District to the south, Thika and Machakos districts to the east, Murang’a and Nyandaruadistricts to the north and Nakuru District to the west. Kiambu used to comprise seven administrativedivisions but two (Thika and Gatundu) were hived off to form part of Thika District in 1995. It nowcomprises five divisions, namely: Kiambaa, Limuru, Lari, Githunguri and Kikuyu. Vital statistics forthe district are as follows:
General Statistics
Total area 1,458.3 sq. kmAgricultural land 1,422 sq.kmPopulation 768,175No. of households 128,000No. of farm families 105,175Average family size 6Average farm size 8 haNo. of divisions 5No. of locations 32No. of sub-locations 105
Source: District Agricultural Office, July 1999
Population and related figures are projected from the 1989 census.
1.1.1 People
According to the 1989 census projections, the population of Kiambu is 768,175 people in 128,000households that average 4.3 residents (GoK, 1994). This was lower than projected by the CentralBureau of Statistics (CBS) in 1980 - 2000 (GoK, 1980). Reasons for this may include a lowered birth-rate, migration due to population pressure on land, as well as normal rural-urban migration insearch of jobs. Since Nairobi is generally less than an hour’s journey away, rural-urban migration isrelatively easy for Kiambu natives.
ATPS WORKING PAPER SERIES NO. 442
Roughly half the population in Kiambu is female, and roughly half again is under 15 years of age.The majority of people are members of the Kikuyu ethnic group, who as a result of agriculturalactivities in prime farmlands, and proximity to Nairobi (jobs, and access to domestic and internationalmarkets), have achieved a relatively high standard of living (Kershaw, 1976).
1.1.2 Climate
Rainfall in Kiambu ranges from an average of 1,466 mm in Kamae to 753 mm in Ruiru (Jaetzol andSchmidt, 1984). It is reliable in 6 out of 10 years with low years experiencing about 60% of the abovefigures.
However, casual observation suggests that the environment is changing for the worse as evidencedby the denuding of vegetation, particularly trees, as well as other climatic manifestations. Theseinclude: upward changes in temperatures; more frequent dry spells; and according to extensionservice personnel (Ngugi et al., 1982; Gichuki, 1999) over the last two decades, the air has changedfrom misty (thick fog in some seasons) to dry air. It is predicted that in the next decade, farmers insome of the previously most productive parts of Kiambu, such as Githunguri, will have to resort toirrigation. It appears that formerly prime farmland that was formally classed as zone 1 and 11 may bein the process of changing to zone 11 and 111 and perhaps worse.
1.1.3 Soils
Soils in Kiambu range from moderately fertile to highly fertile dark red clay, volcanic, weathered anddark brown loams (Jaetzol and Schmidt, 1984). In general, the uplands to the west are very fertilewhile fertility declines towards the east. But as mentioned in 1.1.2, as the environment degrades, itis likely that the soils are similarly being degraded.
1.1.4 Agriculture
The combination of good soils, suitable climate, well developed (if decaying) infrastructure and theproximity to the most important capital city in the region has all served to make Kiambu the mostlucrative farming district in the country (Jaetzol and Schmidt, 1984). Farms range from less than 0.3ha to large plantations of well over 1,000 ha. Over 90% of the total rural land mass is suitable forfarming, which heightens the competitive edge Kiambu farmers enjoy over those in less well-endoweddistricts. However, this situation is probably in a state of change as: rapidly declining soils increasinglyrequire special treatment in the form of organic manure, chemical fertilizers and pH balancing andconservation measures; rainfall is less predictable with more frequent crop failures; and theenvironment is changing as the area is built up, the natural vegetation denuded and the naturalbalance is upset. Agricultural activity has a major new competitor in the form of real estate ashousing, trading centres and shopping malls offer more reliable dividends to investment than farming.
Horticulture, the growth industry of the last two decades appears capable of out-earning tea andcoffee – the traditional cash crops of this region – but it is unlikely that tea and coffee will seriouslydecline in importance in the foreseeable future, despite serious problems such as global pricefluctuations, unstable institutions, rising production costs, labour problems, and so on Otheragricultural activities include dairy farming, and growing of pyrethrum and subsistence crops suchas maize, beans and locally consumed vegetables.
AN ASSESSMENT OF THE EFFECTS OF TECHNOLOGY TRANSFER ON GENDER ROLES WITHIN A COMMUNITY 3
1.1.5 Agricultural Development and Growth
In the first decade after independence, agriculture experienced an average annual growth rate of4.7% (FAO, 1992) mostly caused by expansion in cultivated areas as well as yield increases. Croppedland expanded by about 20% during this decade, alongside advances in agricultural technologysuch as high-yielding crop varieties that increased small-holder yields by between 47% and 300%(World Bank, 1986). At the same time, official prices were remunerative, while policies focusedattention on extension, credit and input delivery systems that met smallholder needs. Agriculture alsobenefited from the maintenance of a consistent set of policies, stable institutions, marketing systemsas well as a conducive macro-economic system.
However, agricultural growth slowed after 1972 to an average annual rate of 3.7% during the 70sand 3% during the 80s, led by a decline in food crops. Reasons for this decline include bothexogenous and policy-related factors such as: shortage of arable land; lack of technical innovations;decline in world commodity prices (especially coffee); un-remunerative official prices; erratic priceadjustments; decline in private and public investment; and the decline of essential agriculturalservices including extension, credit research, inputs, etc. Increasingly, the public sector was unableto manage its marketing and pricing role.
This trend worsened during the 1990s compounded by the fact that Kenya’s population hasalmost quadrupled since independence, while the 20% of her land mass that is fertile has becomeoverpopulated and overstretched agriculturally.
Kiambu, which forms part of that limited fertile landmass, has suffered from the same problemsof population pressure, environmental degradation, and slow down in agricultural growth. At the endof the 1990s, Kenya’s food security and economic well being were clearly threatened, necessitatingurgent and multi-lateral action.
Within that context, this study attempts to look into ways of correcting any imbalances that mayhinder improvement in production, by addressing the issue of the effects of transfer of agriculturaltechnology on gender roles within rural communities.
1.1.6 Tea and Coffee Production
In Kenya, smallholders produce 70% of the tea (FAO, 1992). Tea, coffee and horticultural crops arethe country’s most important export commodities forming a significant part of her foreign exchangeearnings.
In Kiambu, smallholders have 5,598 ha under coffee compared to plantations which have 9,794ha. Similarly, smallholders have 7,147 ha under tea (GoK, 1998), compared to plantations whichhave 3,100 ha ((Jaetzol and Schmidt, 1985). Tea and coffee earned smallholders in the district Ksh.76,111,230/- and Ksh. 1,705,463,354/91 respectively in 1997 (GoK, 1998). For the purposes of thisstudy, acreage under both crops range from fractions of a hectare to medium sized cropping (up to20 ha) among the smallholders.
However, official statistics and casual observation suggest that in the case of coffee, productionis declining among smallholders despite improved prices over the last decade, raising questions asto why. Available literature and casual observation also suggest that glaring inequalities between thesexes and among other social strata have developed alongside the success of these two crops.
ATPS WORKING PAPER SERIES NO. 444
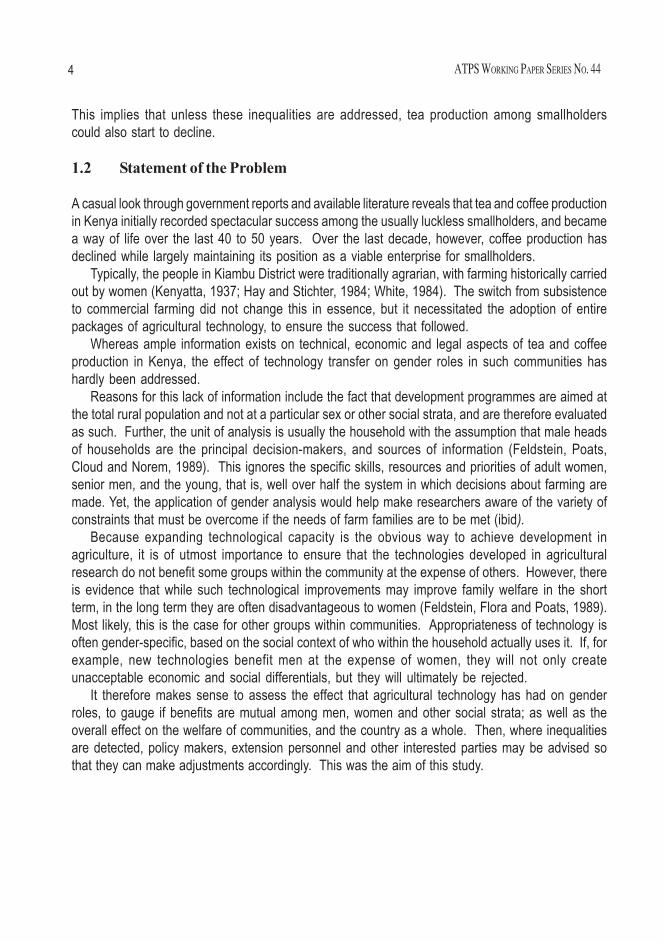
This implies that unless these inequalities are addressed, tea production among smallholderscould also start to decline.
1.2 Statement of the Problem
A casual look through government reports and available literature reveals that tea and coffee productionin Kenya initially recorded spectacular success among the usually luckless smallholders, and becamea way of life over the last 40 to 50 years. Over the last decade, however, coffee production hasdeclined while largely maintaining its position as a viable enterprise for smallholders.
Typically, the people in Kiambu District were traditionally agrarian, with farming historically carriedout by women (Kenyatta, 1937; Hay and Stichter, 1984; White, 1984). The switch from subsistenceto commercial farming did not change this in essence, but it necessitated the adoption of entirepackages of agricultural technology, to ensure the success that followed.
Whereas ample information exists on technical, economic and legal aspects of tea and coffeeproduction in Kenya, the effect of technology transfer on gender roles in such communities hashardly been addressed.
Reasons for this lack of information include the fact that development programmes are aimed atthe total rural population and not at a particular sex or other social strata, and are therefore evaluatedas such. Further, the unit of analysis is usually the household with the assumption that male headsof households are the principal decision-makers, and sources of information (Feldstein, Poats,Cloud and Norem, 1989). This ignores the specific skills, resources and priorities of adult women,senior men, and the young, that is, well over half the system in which decisions about farming aremade. Yet, the application of gender analysis would help make researchers aware of the variety ofconstraints that must be overcome if the needs of farm families are to be met (ibid).
Because expanding technological capacity is the obvious way to achieve development inagriculture, it is of utmost importance to ensure that the technologies developed in agriculturalresearch do not benefit some groups within the community at the expense of others. However, thereis evidence that while such technological improvements may improve family welfare in the shortterm, in the long term they are often disadvantageous to women (Feldstein, Flora and Poats, 1989).Most likely, this is the case for other groups within communities. Appropriateness of technology isoften gender-specific, based on the social context of who within the household actually uses it. If, forexample, new technologies benefit men at the expense of women, they will not only createunacceptable economic and social differentials, but they will ultimately be rejected.
It therefore makes sense to assess the effect that agricultural technology has had on genderroles, to gauge if benefits are mutual among men, women and other social strata; as well as theoverall effect on the welfare of communities, and the country as a whole. Then, where inequalitiesare detected, policy makers, extension personnel and other interested parties may be advised sothat they can make adjustments accordingly. This was the aim of this study.
AN ASSESSMENT OF THE EFFECTS OF TECHNOLOGY TRANSFER ON GENDER ROLES WITHIN A COMMUNITY 5
1.3 Research Objectives
The main objective of this study was to assess the impact of the adoption of an entire package oftechnology on gender roles within the farming communities, with the intent of determining anyimbalances that need to be addressed. In this case, the package of technology under study is thatembodied in the production of two cash crops – tea and coffee, and the community under study issmallholder farmers in Kiambu District, Kenya.
1.3.1 Specific Objectives
The specific objectives were as follows:1) To determine whether the adoption of technology embodied in tea and coffee production
has affected the socio-economic status of males and females in the area of study.2) To determine the extent that the adoption of the technology embodied in tea and coffee
production has affected division of labour along gender lines in the area of study.3) To examine the extent to which extension and other support services for this package of
technology are gender sensitive within the area of study.
1.4 Justification
The results of this study should be useful to researchers by assisting in the development of technologiesthat benefit entire households and communities rather than giving advantage to some subsectionswithin these units while at the same time being disadvantageous to others. This necessitates greaterfocus on the needs of technology users to ensure they all benefit; which was a main aim of this study.Such information may help planners to formulate gender-sensitive policies in the future with a viewto incorporating all members of households in any benefits that may accrue from agriculturaldevelopment. Such policies may succeed not only in increasing and streamlining production butalso in improving the gender status, which could positively affect over six million Kenyans whoselivelihoods depend directly or indirectly on tea and coffee (GoK, 1997), as well as other Kenyans whodepend on various other cash crops.
This study is also of interest to agricultural personnel who diffuse innovations and overseeproduction of these crops, as well as lawmakers in their ongoing task of reviewing and updating thelegal framework in Kenya governing production in all sectors, including agriculture.
1.5 Assumptions
1) This study assumed that the agricultural technology in question (see description in 1.7) hasbeen largely adopted as prescribed.
2) Although every precaution was taken during the survey to ensure veracity, it has beenassumed that the responses given by interviewees are a true representation of the facts andof their opinions.
ATPS WORKING PAPER SERIES NO. 446
1.6 Limitations of the Study
As anticipated, finances were less than adequate, and at the same time a concerted attempt wasmade to complete this body of work in three years. Financial and time considerations necessitatedfewer field staff than desired as well as limiting travel and other activities. However, despite theselimitations, the researcher endeavoured to obtain data that is satisfactory both in quantity and quality.
1.7 Definition of Terms
Agricultural Technology
Agricultural technology may be defined as the ‘specialised knowledge, skills and techniques’(Kaindeh, 1995) required in the production of agro goods and services. The technology embodiedin worthwhile tea and coffee production is necessarily a package that embodies the timely andproper (recommended) use of improved farming practices such as soil conservation; land preparation;weeding, pruning, quality inputs such as properly constituted fertilisers and pesticides; modern farmequipment, harvesting and post harvest techniques. Both crops require more intensive labour thanmost other crops.
Gender
Gender issues refer to differentials among the sexes and age groups within communities. In mostparts of the world, technological innovation has tended to disadvantage women relative to men(Feldstein, Flora and Poats, 1989), and the benefits also tend to have an age bias. For example,farm mechanisation is too often advantageous to males through easier tasks while at the same timedisadvantageous to females through increased workloads. Further, benefits such as improvedearnings will usually go to males directly but only indirectly seep to females. This is particularlypronounced in but not restricted to developing countries. However, women differ from one anotherin socio-economic behaviour depending on the presence of husbands, class and stage in life cycle.
Tea
Thea: Camellia sinensis, Family: Teacae. Tea, like coffee is a beverage prized for the stimulanteffects of the caffeine it contains. The exact origin of the tea plant is unknown but tea has beencultivated in China for over 4,000 years. It became popular in Europe in the 17th century. Tea is madefrom young leaves of the tea plant, a tropical broad-leafed evergreen that could reach 15 m if notpruned. It requires moist environments where annual rainfall is at least 1,500 cm and temperaturesare between 21°C and 32°C. The best tea-growing locations are Assam (NE India) and Ceylon (SriLanka) which together account for over half the world’s production. Other important producersinclude China, Japan, Indonesia and Kenya (Janick 1974; EIU, 1999; GoK, 1999).
Coffee
Coffea arabica, Family: Rubiacae. Coffee is indigenous to Africa but has been introduced throughoutthe world wherever climate permits. It is grown from sea level to about 3,500 m. It thrives in meantemperatures of 20°C or higher and requires 1,000 to 1,700 cm of rain annually and well-drained
AN ASSESSMENT OF THE EFFECTS OF TECHNOLOGY TRANSFER ON GENDER ROLES WITHIN A COMMUNITY 7
soils. Coffee became popular as a beverage during the 18th century, although there is evidence thatthe berry served as a stimulant and was ‘medicinal’ much earlier in the tribal culture of the Near East.Today, it is one of the leading international agricultural commodities. The beverage is processedfrom the hard seed of the fruit. About a quarter of the world’s production comes from Brazil. Columbiais the next most important producer followed by several African countries including Kenya, IvoryCoast, Uganda and Ethiopia (Janick 1974; EIU, 1999; GoK, 1999).
Matatu
Public service vehicles of the semi-formal transport sector, usually 18 person capacity vans or largercapacity mini buses.
Debe
A bucket measure about an eighth (1/8) of a 90 kg bag.
Baraza
Routine public meetings regularly held by the local administration in an area. They are usuallyconvened by the chief or sometimes a District Officer (DO). Chiefs and DOs head administrativelocations and divisions respectively.
8
Chapter Two
Research Literature
2.1 Theoretical Orientation
This study draws from four main theoretical fields of study, women in development, gender anddevelopment, and gender and technology. It also draws from development theory which is widelysubscribed to, and underlies most of the dealings of the developed world with the developing world,assuming that less developed countries can gradually but steadily be helped to achieve political andeconomic systems similar to those in the industrialised world (Escobar, 1997). This process can begauged from:
“conditions that were supposed to characterise the more economically advantageous nationsof the world – industrialisation, high degrees of urbanisation and education, technification ofagriculture, and widespread adoption of the values and principles of modernity, includingparticular forms of order, rationality and individual-orientation” (Escobar, 1997: 497)
The “problem of development” was considered as one of bringing “backward” colonial people intothe modern developed world. It was largely tackled by insights drawn from the neo-classicaleconomists stressing econocentric and technocentric biases (Cernea, 1995). Models were dulydeveloped (Rostow, 1960) explaining the “how” of development. As development experts searchedfor technology and capital -intensive ways by which to bring Third World countries to the “take-off”stage, they originally favoured the top-down, economically-oriented approach but by the mid-70s theemphasis shifted to the problem of “poverty” and how to solve it. Consequently, the major developmentagencies such as the World Bank, announced a shift in policy towards the “poverty-oriented”programming. Attention thus turned to the Third World “poor people” particularly “the rural poor”. Theovert ideology became one of “putting people first” (Cernea, ed. 1985). The idea was that henceforthdevelopment projects would be socially relevant and culturally appropriate, and would involve thedirect beneficiaries in a significant way. In this climate, the women and development school ofthought evolved.
2.2 Women and Development
Studies on women originated in feminism but by the 1970s, feminism and development studiesbegan to intersect. Prior to this, women were either “invisible” or they were considered an impedimentto development, that is, tradition-bound and unwilling or unable to enter the modern period (De
AN ASSESSMENT OF THE EFFECTS OF TECHNOLOGY TRANSFER ON GENDER ROLES WITHIN A COMMUNITY 9
Groot, 1991). Early development theory and practice accepted these assumptions uncritically, whichmeant that in the 1950s and 1960s, women were ignored in favour of men who were thought to bemore progressively oriented. It was assumed that once the modernisation process had been set inmotion, the women would be forced to adopt a more progressive stance.
By the late 60s, when early hopes for economic take-off were fading, women economists beganto reconsider the issue of women. In her landmark study, “Women’s Role in Economic Development”,Ester Boserup (1970) showed that many development projects, rather than improving the lives ofThird World women, had often deprived them of economic opportunities and status. Modernisationhad displaced them from their traditional functions, particularly in agriculture, where they had playeda crucial role in food production. Boserup’s (1970) work inspired a new sub-field of development,Women in Development (WID). Pioneers in this field called for integrating women who were oftenmarginalized, into the centre of male power structures, so that they could obtain a more equal shareof the benefits of development. They advocated incorporating women into the decision-making andplanning circles of the development machinery, so as to improve access for women to the benefitsof development such as education, employment, land and credit.
The general shift towards poverty-oriented programmes enhanced the WID perspective, becausewomen were regarded the “poorest of the poor” so that it gradually became adopted by developmentagencies. Thus women became a central concern of policy makers and development planners,and this culminated in the United Nations Declaration of 1976-1985 as the “Decade for theAdvancement of Women”. It was inaugurated by a world meeting in Mexico and concluded by ameeting in Nairobi, Kenya.
Meanwhile the 1970s saw the growing criticisms by Third World economists such as AndreGunder Frank (1978), and Samir Amin (1974) who advocated Third World disengagement and self-reliance, blaming the development machinery of the developed world itself for the under-developmentof the Third World. The call for “self-reliant development free from the self-interest ‘assistance’ ofcapitalist elites and their indigenous henchmen” (Parpat, 1995), found listeners among feministsconcerned with development and at the same time influenced by the radical feminist critique ofpatriarchy (Gilligan, 1982). This trend inspired a new approach called Women and Development(WAD), which suggested that since the attempt to bring women from the margins to the centre hadnot been effective enough, it would be better to focus on women as a separate group. This approachcalled for small-scale women-only projects that were designed to avoid male domination, bothmetropolitan and indigenous. Therefore while Women in Development called for the equalincorporation of women into the development process, Women and Development called for settinga separate development process for women. The latter found considerable support in non-governmental organisations (NGOs) and influenced many NGO activities. This set the stage for thedevelopment of Gender and Development (GAD).
2.3 Gender and Development
The concept of gender advanced the insight that womanhood is not simply a matter of sex in thenaturalistic, biological sense but rather the cultural and social meanings which are attached to thefemale sex, and which can and do change from culture to culture, and from period to period.
ATPS WORKING PAPER SERIES NO. 4410
“Gender” as a concept advances the notion that neither men nor women can be approachedseparately, yet the differences between them cannot be ignored. The GAD school maintains thatboth men and women must be approached, but in full knowledge of, and sensitivity to, the differencebetween them. This school also recognises that differences exist between age groups which mustlikewise be taken into account if development programmes are to succeed. Thus GAD differs fromWAD in that it does not advocate addressing women because they have been neglected. Rather,GAD is for addressing both men and women, and paying attention to gender differences becausesociety is gendered, and such differences are critical for understanding most, if not all aspects ofsociety.
Thus, tracing its roots to Boserup’s (1970) work, research turned to the culturally-constituteddivision of labour between the genders in the targeted “undeveloped” areas: what men and womenrespectively do; what access to technology they respectively have; what technology they respectivelyused in agricultural production; what part they respectively have in decision-making, and so on. Forexample, Feldstein et al. (1989), Rao et al. (1991), and Overholt et al. (1985), advanced a gender-analysis framework for gathering gender sensitive data on agricultural production. The need for itwas amplified by studies, following on from Boserup’s work, such as those of Staudt (1977), Pala(1980) and Ventura-Dias (1985), who argued for a strict gender division of labour in Africa. GAD hadconsiderable influence in the developing world, and gender sensitivity became a requirement forgeneral projects and programmes, as development institutions added gender analysis training toestablished WID programmes.
Meanwhile feminism was also developing as well as making new inroads into developmentstudies. From the beginning the feminist critique had argued that the notion of women as a sex hadalways been defined by men as “other” to themselves within the concept of a male/female dyad. Butover time criticism arose within the feminist camp among minority groups such as black and nativewomen in North America, that this concern with women otherwise ignored the differences amongwomen themselves (Gilligan, 1982; Spelman, 1990). The feminist body of work was grounded ingeneralisations drawn from the experiences of middle-class women in the North, and it consequentlyignored race, and class differences within the female sex. The impact of these arguments ondevelopment studies was the criticism of sweeping generalisations about Third World women, andit encouraged study of the differences within this category. Many studies consequently becameconcerned with “class within gender” differences paying attention to women, but distinguishingwomen of different classes (Ahmed, 1985, Whitehead, 1985). Some writers concentrated on “socialposition within gender” differences regarding gender, distinguishing women in different types ofhouseholds, especially female-headed, female-operated and male-headed households (Ventura-Dias, 1985, Paterson, 1980).
This research is anchored in the latter tradition, with its roots in the GAD tradition. It also entertainssensitivities and awareness stemming from the work of feminists from the South who have rejectedthe projection of Third World women as uniformly poor, powerless and vulnerable, while reinforcingthe image of Western women as modern, educated and liberated (Mohanty, 1988). They doubtedthe ability of women from the North (who assumed global feminist solidarity, and consideredthemselves as experts on gender and development matters) to analyse and solve the problems ofwomen in the Third World. Subsequent discussions culminated in the emphasis of the importance
AN ASSESSMENT OF THE EFFECTS OF TECHNOLOGY TRANSFER ON GENDER ROLES WITHIN A COMMUNITY 11
of listening to and learning from women’s diverse experiences and knowledge, and of maintainingcommitment to long-range strategies dedicated to breaking down the structures of inequality amonggenders, classes and nations.
2.4 Agricultural Technology and Gender
This research sought to assess whether the “successful” transfer of agricultural technology benefitsboth sexes and different age-groups equitably. First a technology index was developed for both cropsand used to gauge how successful the transfer had been. Then the researcher attempted to assesswhether any benefits accruing from this technology trickled to women and the younger age groups,particularly those who were adult but not yet in possession of the family farm unit.
Kaindeh (1995) defines technology as the specialised knowledge, skills and techniques requiredin the production of goods and services. Using the Technology Atlas Project Team’s (1987) analysis,agricultural technology can be embodied in people, tools, practices and equipment.
According to the Technology Atlas Team (ibid), technology can be desegregated into four totallyinterlocking embodiment forms:
1. Object embodiment form or “technoware” – tools, capital goods, intermediary goods,products, physical equipment, machinery, physical processes, etc. The impact of theadoption of cash crop technology on choice and source of technology was assessed.
2. People embodied form or “humanware” – understanding, capacity for systematic applicationof knowledge, know-how, human capability, human labour, specialised ideas, skills, problemsolving capacity, etc. The impact of the development of cash crops farming on thetechnological capabilities of this community was studied.
3. Document embodied form or “infoware” – knowledge about physical relationships, scientificand/or other organised knowledge, principles of physical and social phenomena, technicalinformation, specifications, standards, computer software, etc. The focus here will be onthe development of accessibility to technological information.
4. Institution embodied form or “orgaware” – organisational work assignment, day-to-dayoperation of production, social arrangements, means of using and controlling factors ofproduction, organisation of products, processes, tools and devices for use by people. Thefocus here will be these farmers’ ability to organise the technological capability at theirdisposal.
Kaindeh (1995) says that a farmer is considered to have adopted technology if they use it to anyextent. He goes on to define technological capability as “the ability to harness reason and scientificknowledge to solve particular problems”. This usually involves the ability to:
• identify the problem• identify the most relevant technology• acquire the technology on the best possible terms• assimilate the technology• modify and adopt the technology to suit the local situation (i.e. develop an indigenous
technology).
ATPS WORKING PAPER SERIES NO. 4412
Technology is essentially for the development of technological capability. Those who acquiretechnological capability can engage in technical change or innovation. In the case of small-scalefarmers this would include minor and major modifications of the technology to suit their environments.As farmers become more familiar with a new technology they will alter inputs or other componentsto exploit its advantages. They learn the various outcomes associated with various decisions linkedto technology. Such changes (multiple simultaneous innovations) can be complex and variable overtime and space. Once farmers have internalised the technology, they can modify it to suit their ownneeds, that is, they can effect technological change proving that they have acquired technologicalcapability.
Collingbridge contended in 1981 that technical competence vastly exceeds understanding ofthe social effects of technology and went on to agree with Marstrand’s (1979) comments on theshortcomings of the green revolution to the effect that “unless governments deliberately counteractthe tendency of new technology to increase inequalities among groups in society, such introductionsmay increase food production but will not prevent malnutrition or even famine”.
Stamp (1995) develops on this theme, and starts by quoting Chinua Achebe who in 1983 notedthat “technology is a state of mind not an assemblage of artefacts”. She goes on to say that the last 25years have proved the wisdom of that sentiment, as the massive transfer of technology both asartefact and information has often been accompanied by misuse, misallocation or misunderstandingin recipient countries. In particular, it has generated negative consequences for women, childrenand communities – nowhere more so than in Africa (ibid).
Stamp (1995) believes that the reason for these problems probably lies in the fact that unlike whathappened in the West, technology has been “forced” on Africa. In the Developed World, new technologyhas usually arisen from the political and economic needs of a particular era of development in aparticular society. It is now widely recognised that since women constitute half of humanity, it followsthat gender relations are as fundamental a shaping force in society as economic relations or politicalstructure.
Stamp (1985) poses a key question: “Is the outcome envisaged (in technology transfer) reallydevelopment? Unless the women and children are unequivocally served, society itself has not beenserved”. In Africa, agriculture, health and nutrition are primarily the responsibility of women. Therefore,successful technology transfers in these fields are those that empower women, strengthening ratherthan weakening their community involvement and their decision-making authority in the family andthe community. However, too often the reverse has been true with profoundly negative consequences.Rather than the desired effect, new technology often has the following effects on African women: (i)increased workloads; (ii) a more subordinate position within the family; (iii) attenuated communallife with other women; and (iv) lost rights to resources. These circumstance necessarily compromisewomen’s abilities to fulfil their traditional production, health and nutrition responsibilities, as well astheir new development-linked responsibilities.
This may well be the reason that planning efforts supported by development agencies have sooften failed. Attempts to sensitise planners to increase women’s participation has not yielded significantresults whereas training women for local-level decision making and planning has had surprisinglyquick and strong impact (ibid).
AN ASSESSMENT OF THE EFFECTS OF TECHNOLOGY TRANSFER ON GENDER ROLES WITHIN A COMMUNITY 13
Raeburn (1984) pointed out that the quality of decision making depends on how well equippedan individual is. Economic and technical decisions which have to be made concerning farminginclude choice of enterprise, quantum, factor proportions, level of investment, use of credit vs. savings,level and source of factor purchase, and timing. Some of these decisions are long term and noteasily reversible, and quite often, major decisions cannot be made by women because of cultural,religious, legal and educational reasons, among others.
Norton and Alwang (1993) acknowledge technological progress to be one of the sources ofeconomic growth, alongside labour availability, natural resources, capital accumulation, scale andspecialisation, and efficiency improvements. They take note of the fact that women play the greatestrole in farming in Africa due to culture and male outmigration, yet this female employment is largely“invisible” and has led to policies that at best ignore women, and at worst affects them adversely.Determinants of the role of women in agriculture (social, cultural off-farm job activities, colonialhistory, etc.) change over time and thus change the role of women. However, even if new technologyis gender neutral, females usually experience inadequate access to credit due to lack of collateralor even mere prejudice, which tends to make many new technologies gender-biased.
2.5 Gender Analysis
Mullings (1976) used Engel’s perspective to analyse gender relations thus: “equality derives from allmembers of society having the same relationship to the resources of society, particularly the meansof production. Inequality occurs when such resources are appropriated by particular strata of societyas “private property’’.
Mullings (1976) describes the inequality as different access and rights to the means of productionor resources of society. This is in contrast to asymmetry where access to means of production maybe equal but where men and women may not have access to the same roles and status, and sexroles may be differentially evaluated, that is, distribution of resources may be egalitarian but malesmay have formal control over distribution, which means female roles are often underestimated.
Mullings (1976) notes that division of labour occurred earliest along gender lines when in huntingand gathering societies, men hunted while women practised hoe agriculture. However, even whenagriculture comprised most of a society’s welfare, female roles were underplayed.Feldstein, Flora and Poats (1989) state five basic facts about gender and agriculture namely:
1. Many households in developing countries have different income streams – his and herswith different sources and different destinations within the household.
2. Even when there are wholly separate income streams, there are socially assigned differencesin men’s and women’s roles and resources.
3. Increasing household income does not benefit all members equally.4. In most parts of the world, technological innovation has tended to disadvantage women
relative to men.5. Women farmers are as productive as male farmers when given access to similar resources.
Feldstein et al. (1989) go on to formulate the goal of agricultural research as “development oftechnologies that farmers will use to improve their welfare and that of their country”. They contend
ATPS WORKING PAPER SERIES NO. 4414
that technologies must improve farm family welfare in the long run, rather than just in the short run asis often the case. For example, technologies should not ease tasks for males while they disadvantagefemales through greater workloads as often happens in farm mechanisation. They also point out that“the appropriateness of a technology is frequently gender-specific based on the social context ofwho within the household uses it”.
Feldstein et al. (1989) further analyse patterns of gender responsibility to range from separateenterprises, to separate fields, to separate tasks, to shared tasks, to women managed farms. Regardingthe women-managed farms, they cite Cloud’s observation that many Kenyan women manage farmsduring the week (defacto system) while their husbands work in the cities. On the other hand, dejure
(legal) female-headed households are rapidly increasing, but they tend to be among the poorestfarming households with few resources and severe labour constraints.
Implications for research abound such as: research on both male and female crops; on-farmtrials under both his and her conditions; analysis of the effects of technologies on level and timing ofmale and female tasks; as well as evaluating any increase in task against benefits, effects of technologyon separate tasks and evaluating the availability of resources necessary for technology adoption onthese types of farms.
Feldstein et al. (1989) further point out that women differ from one another in socio-economicbehaviour depending on the presence of husbands, class and stage in life-cycle, among otherthings.
2.6 The Kikuyu People
According to Jomo Kenyatta (1937), historically among the Kikuyu, both women and men traditionallyperformed agricultural activities, although labour was divided along gender lines. For example, mencleared virgin land while women did the actual cultivation. Crops were also divided between thesexes, with men growing sugar cane, bananas, yams and sweet potatoes while women grew maize,millet, beans and potatoes. However, several factors including polygamy and warfare ensured thatwomen did the lion’s share of agricultural production, on top of their household and communityduties. Kenyatta (1937) asserts that each woman had complete control over her agriculturalproduction (as long as she provided for her family), and could dispose of her surplus as she pleased,that is, she could give it away, or sell it to pay hut taxes, or buy other goods, or even turn it over to herhusband for the purchase of livestock. This implies that women were not allowed to own livestock –which represented a much-valued stock of wealth.
White (1984) adds that Kikuyu women traditionally worked on their own gardens as well as thoseallocated to men. Both White (1984) and Kenyatta (1937) agree that men made all major decisionsconcerning social, political and legal affairs, which necessarily includes all major decisionsconcerning agricultural production.
Kershaw (1975) contends that Kikuyu women tend to perform the role of “farm manager” for theirspouses, often having influence but no authority. Kershaw (1975) contends that “they have beenreduced to a position of second- in- command’’.
White (1984) argues that while labour migration and rural poverty have increased women’sworkloads, they have also increased the options under female control. White contends that among
AN ASSESSMENT OF THE EFFECTS OF TECHNOLOGY TRANSFER ON GENDER ROLES WITHIN A COMMUNITY 15
the poor and landless Kikuyu in Kiambu, women routinely seek wage labour on top of cultivatingsubsistence crops on hired, borrowed or illegally occupied land.
These women not only supplement their husbands’ incomes – even though the men generallyresent it despite being unable to manage without wifely incomes – but they are also often the mainsource of financial support within the household. On the other hand, the more affluent land-owningKikuyu grow cash crops which men control. Cash crops have perpetuated the wealth of this landedclass over the decades, enabling hired labour and high standards of living. However, the womenhave paid a high price for this affluence by losing much of their economic independence. In realterms, women in the landless class have greater economic independence.
2.7 General Statistics
The importance of tea and coffee to Kenya’s economy can be illustrated by the fact that together withhorticulture they constitute over half of Kenya’s total export earnings from trade (Republic of Kenya,1999; EIU, 1999). They also exceed the earnings from tourism which is the other major foreignexchange earner in Kenya.
Table 1: Foreign trade in goods – 1998 (K million pounds)
Tourism earned Kenya 875 million pounds in 1998, a figure which has declined by 30% since 1995.Farming (together with forestry and fishing) accounts for 26% of the GDP, 18% of employment in
the formal sector, while it remains the main source of employment in the informal sector (EIU, 1999).Almost half of all agricultural output is for subsistence and is not marketed. Tea, coffee and horticulturalproduce provided 53% merchandise export revenue in 1998.
In 1999, Kenya produced 248,820 metric tonnes of tea which earned 1.49 billion K pounds, whilecoffee production came in at 64,293 metric tonnes which in turn earned 514 million K pounds.
According to the Ministry of Agriculture’s annual report in 1998, Kiambu produced 3,245.2 metrictonnes of clean coffee as well as 544.8 metric tonnes of clean mbuni which earned Ksh 105.4million. Tea production stood at 76,185.4 metric tonnes which earned a total of Ksh 1.7 billion.Hectarage under tea and coffee are as follows:
Source: Republic of Kenya, Ministry of Agriculture, 1998
Tea production has grown tremendously to the extent that Kenya is now the World’s leadingsupplier of black teas. Despite relatively low prices in the world markets, revenue from tea hasexpanded rapidly over the 90s, culminating in a record production during the El Nino rains of 1997/1998 of 264,000 tonnes (EIU, 2000).
In contrast, coffee production has declined dramatically over the last decade, registering a 50%drop since 1990. High domestic taxes, low world prices and better returns on other crops have allcontributed to the collapse. The El Nino rains had a disastrous effect on coffee production bringingit down to a record low of 52,000 tonnes (EIU, 2000).
2.7.1 Development of Tea and Coffee Production in Kenya
The British Government began active intervention in East Africa in the 1870s to protect trade routesto Uganda and took over direct responsibility for administering the territory in 1893 – a move whichled to a frantic search for ways of generating sufficient tax revenues, and stimulating trade so that theterritory could become self-financing (Smith, 1976; Brett, 1973). This situation was made urgent bythe decision to build a railway from the Coast to Kisumu on Lake Victoria. Many tribes in Kenyaalready practised crop agriculture although abundant land encouraged shifting agriculture with newland being settled as populations expanded. Pastoralist tribes moved their herds around recognisedclan or tribal lands. All tribes engaged in the trading of crops and livestock with each other, as well aswith traders coming up from the coast. Unfortunately, during the crucial time in the 1890s whendecisions were being made which were to affect the long-term future of indigenous agriculture, theKikuyu, Kamba and Maasai were all badly disorganised as a result of a series of famines, epidemicsand cattle diseases. Thus, the British imposed direct rule on Kenya territory (as opposed to indirectrule in Uganda where a centralised and stable government already existed, raising hopes of increased
AN ASSESSMENT OF THE EFFECTS OF TECHNOLOGY TRANSFER ON GENDER ROLES WITHIN A COMMUNITY 17
trade through expansion), and plantation and settler agriculture began to be viewed as a seriousproposition.
From the turn of the 19th century to the early 1930s, agricultural development policy was settleroriented and African agriculture was largely ignored (Smith, 1976). From the early 30s to the mid-50s, settler interests still dominated the formation of agricultural policy although increasing attentionwas paid to African agriculture. The Second World War increased the demand for food whichbrought prosperity to the agricultural sector after the depression years and signalled the start of acontinuous expansion of the sector which was to last until the 1960 Lancaster House announcementof self-government.
Before the war, most of the emphasis for African agriculture was on the development of goodhusbandry in a narrow technical sense. During the war African agriculture was called upon toincrease production, but it was not until the mid-50s that sufficient economic incentives were providedto initiate a major and sustained increase in African agricultural output. The most important of theseincentives were probably the removal of restrictions on the production and marketing of cash cropsincluding tea and coffee, and dairy products; as well as increased access to certain resources,which had been until then, the exclusive preserve of European settlers.
Independence itself brought little change in overall strategy other than a partial redistribution ofland in the former scheduled areas. By the late 60s to early 70s, agricultural development policyhesitantly started a broadly based development strategy involving a much larger proportion of thefarmers in all parts of the country as compared to previous phases. (However, in all the phases, policyinitiatives have reflected the interests of pressure groups dominating policy making. Interestingly,some of these views became elevated to conventional wisdom, and thus not only survived butcontinue to affect policy).
2.8 General Information
The importance of tea and coffee to Kenya’s economy can be further illustrated by the fact thattogether they constitute over half of Kenya’s total export earnings and over 70% of Kenya’s totalagricultural export earnings (Economic Survey, 1994). They also exceed the earnings from tourismwhich is the other major foreign exchange earning industry in Kenya. According to the Ministry ofAgriculture’s annual report (1992) Kiambu produced 34,500 tonnes of coffee which earned 85.163million K Pounds (US$ 51.8 m). A total of 51,087 tonnes of tea were produced which earned a totalof 121,125 million K Pounds (US$ 73.4m). About 5,000 ha of tea is farmed by small-scale holders(Farm Management Handbook, 1983) while 3,100 ha is farmed on large plantations.
Tea is grown in Gatundu, Lari, Githunguri and Limuru divisions. Coffee on the other hand isgrown in Kiambu, Kikuyu and Thika divisions (Annual Report, Kiambu, 1993). Small holders control3,100 ha while the plantations account for 16,000 ha under coffee.
18
Chapter Three
Research Methodology
3.1 Unit of Study
The unit of study was the farm household which refers to a group of people living together, contributingin a drawing from a common source (Chambers, 1967). The farm household is a suitable unit ofanalysis because it is the centre of agricultural activity and the main respondents – men and women–are found within it.
3.2 Data Collection Tools
The data collection methods employed in this study were as follows:a) A survey instrument administered in the form of interviews. The survey was structured, that
is, each respondent went through the same experience, to facilitate comparable data.There was an emphasis on gender analysis tools such as those developed by Feldstein etal. including calendars, activity analysis, tables and gender-specific questions. This madepurposive sampling necessary. The questionnaires elicited information regardingbackground information, production activities, and division of labour, extension and postharvest activities. They were administered by research assistants and the principalresearcher.
b) The Key Informant technique was utilised in each division sampled to elicit information thatwas not possible to obtain with the questionnaire. More detailed information regarding timedimension, actual vs. perceived gender realities, the workings of local collection points andrelevant organisations, etc. was elicited by the principal researcher and a research assistant.Key informants included Ministry of Agriculture personnel, local administration personnel,co-operative union officials and selected male and female farmers. This data was collectedby the principal researcher.
c) Direct observation was used to record actual rather than idealised gender behaviour. Thisserved to validate the survey. Activities observed this way included farm operations, harvestingand factory operations.
d) Focussed group discussions were held in each community sampled to obtain in-depthinformation and validate the survey. These centred on gender dynamics, economic andsocial benefits vs. problems, perceived solutions and the way forward. They were conductedby the principal researcher and a research assistant.
AN ASSESSMENT OF THE EFFECTS OF TECHNOLOGY TRANSFER ON GENDER ROLES WITHIN A COMMUNITY 19
3.3 Population and Sampling Techniques
The population under study consists of tea and coffee farmers in Kiambu District, Central Provinceof Kenya.
Kiambu District consists of six administrative divisions, three of which produce coffee while the otherfour divisions produce tea. These divisions are subdivided as follows:
Division Main Cash Crop
Kiambaa CoffeeKikuyu CoffeeGithunguri Tea and CoffeeLimuru TeaGatundu TeaLari Tea
The locations in Kiambu are further subdivided into a total of 142 sub-locations.
It was originally intended that for each division that grows coffee, three locations should be selectedthrough stratified randomisation according to geographical positions, agro-ecological zones andfarming activities. Likewise for each division that grows tea, three locations were to be selected inLimuru and Gatundu and two each in Lari and Githunguri using the same criteria.
3.4 Research Design
During the proposal writing stage it was intended that 306 farmers would be surveyed, and thatroughly half the number of respondents would be coffee farmers while the other half would be teafarmers. But the reality on the ground negated this intention when the research team found that therewere far more coffee farmers in the district than tea farmers so the researcher opted to reflect this inthe sampling. The intended focus on locations also changed as it became evident that agro-ecologicalzones were greater determinants of which crop is grown where than geographical limitations.
In retrospect this was not surprising since tea requires higher agro-ecological zones than coffee,and more of the coffee-friendly zones are to be found in the district. Interestingly, several agriculturalofficers in the district expressed the opinion that the agro-ecological zones have been down gradingslowly but surely over the last three decades, as population pressure puts strain on the naturalenvironment, especially vegetative cover. Those who grew up in the district can remember colder,wetter, foggier weather that supported various crops, which can no longer grow in most parts of thedistrict.
In the end this study surveyed 338 respondents in the district, 40% of whom were tea farmerswhile 60% were coffee farmers.
ATPS WORKING PAPER SERIES NO. 4420
Table 4: Distribution by crop
Crop No Percentage
Tea 136 40.24Coffee 202 59.76Total 338 100
Source: Field Data
The intention had been to sample purposively along the number of locations in each division but thiscould not work in practice because some divisions registered heavy agricultural activity while othershad very little especially with regard to these two crops.
For example, in Kikuyu Division which is a coffee growing area, there was very little coffee to befound because farmers have turned to other enterprises that bring about better returns.
On the other hand some divisions registered a heavy presence of smallholders while others hadrelatively few. An example is Limuru, which is a tea growing area but most of the tea is under largeplantations or estates such as those belonging to the Brook Bond Company. Smallholder tea farmersdid exist but they were in the minority as most small-scale farmers seemed to prefer annual fieldcrops, horticulture and livestock farming to tea. In these two divisions, the samples were necessarilysmall. Githunguri Division had the largest sample because both crops are grown there so there wasa sample for both coffee and tea.
3.5 Data Analysis
Both inferential and descriptive statistical methods have been used to analyse the data collected.Statistics were broken down by gender to avoid distorting the knowledge base. In a few cases,correlation and regression were used for interpretation.
AN ASSESSMENT OF THE EFFECTS OF TECHNOLOGY TRANSFER ON GENDER ROLES WITHIN A COMMUNITY 21
3.6 Complementary Activities
Complimentary activities for this study included:1. The research assistants gained by undergoing training and experience in fieldwork. At
least two went on to do further field work for other researchers.2. The principal researcher gained by enhancing her data collection and analysis skills and
by the fact that this body of work will form the basis for her PhD studies.3. On completion of this project, workshops and seminars will be held for researchers, extension
staff, and planners to disseminate information and formulate strategies for the future.Intended outcomes include a report, a PhD dissertation, several papers and a book. The results
will be disseminated to research institutions, the Ministry of Agriculture, university librariesand policy makers.
22
Chapter Four
Results and Analysis
4.0 Introduction
This chapter describes the data obtained through the field work. Some of the tables and diagramsare in the text while additional statistics can be found in Appendix II.
4.1 General Characteristics of the Respondents
Contrary to expectations almost twice as many males were found working in the farms (and thereforeinterviewed) as females. Literature, casual observation and conventional wisdom had led theresearcher to expect farming in Central Province to be done mainly by women. Since this wassomething of a surprise, the researcher not only noted it but also made an effort to explore andexplain it as will be seen later in this chapter.
In three instances two respondents answered the questions together i.e. husbands and wivesanswering as a team. The researcher decided to treat this category separately because although itwas not statistically significant, it was interesting to see whether joint answers differed substantiallyfrom those of single respondents.
AN ASSESSMENT OF THE EFFECTS OF TECHNOLOGY TRANSFER ON GENDER ROLES WITHIN A COMMUNITY 23
The research team found the strongest concentration of small scale farmers in Lari Division, thereforethe largest sample came from Lari, and as shown in Table 7, the smallest concentration of smallscale tea farmers was found in Limuru, and therefore the smallest sample came from that division.A total of 136 tea farmers were sampled who comprised twice as many men as women. Of these,there were two instances of husbands and wives answering the questions together.
In the case of coffee, Kiambaa Division had the highest concentration of coffee followed by Githunguri.Kikuyu Division had the lowest concentration of coffee farmers. The samples reflected this.
The research team found significantly more men working on the farms than women, that is, 63%of the respondents were men as opposed to 36% women. The male-female ratio was slightly lowerin the case of coffee with 62% of the respondents being male. When broken down by crops, theresults showed almost twice as many men as women at home in the tea farms, while in the case ofcoffee this difference was not so wide, yet still striking. Thus the sample had significantly more menthen women.
This does not imply that the women were not at home, but rather that when the men were at homethey were more likely to answer the questions than the women. And while the research team went outof its way to avoid gender bias during data collection, it cannot be denied that when both the man andwoman of the house were at home it was more likely to be the man who answered the questions. Inonly three homesteads did a man and a woman answer questions jointly. Tea had two instances,while coffee had one. The researcher acknowledges that this could have inadvertently skewed theresults in that a male respondent might view reality differently from a female respondent and viceversa, while a female respondent might not be entirely open to an outsider in the presence of herhusband. However, every effort was made to avoid this, and to validate results through observation,the use of key informants as well as during group discussions.
4.1.1 Marital Status
When asked about marital status the overwhelming majority described themselves as married with95% of the female respondents and 93% of the males making this assertion. Of the three joint maleand female respondents, two were husband and wife, while one consisted of mother and son. Theson was unmarried. When broken down for the two crops, the results for tea showed that 91% of thefemales were married as opposed to 92% of the males. When analysed by gender and crop, a higherpercentage of both male and female respondents in the coffee sector was married than was thecase in the tea sector.
However, this result is tempered by the fact that some of those who described themselves asmarried were actually widowed or living apart either amicably (urban employment) or due to maritaldiscord.
In this regard, only 46% of the females actually lived with their husbands. A large percentage, thatis, 37% was widowed while 6.6% had spouses who were urban migrants and 5% were single. Thesituation for the men was completely different with 86% living with their wives, 3% widowed, 6%single and an interesting 2% had wives who were urban migrants. The reasons for such drasticdifferences in marital status between male and female respondents were unclear, although it couldbe that it is easier for men to remarry after being widowed than it is for women.
When marital status was compared for the two crops, there was not much difference, although agreater percentage of female tea farmers lived with their spouses than was the case for coffee, andfewer of the female tea farmers were widowed. Conversely, a greater percentage of the male coffeefarmers were married and the urban migrant wives existed only among the coffee farmers.
4.1.2 Age
The respondents were all full adults with less than 1% being under 20 years of age. Five percentwere in their 20s with another 13% being in their 30s, but an overwhelming 81.4% were above 40years of age. Over 51% were above 50 years of age. A minute 1.5% did not know when they wereborn, and from casual observation these tended to be over elderly.
The age trend held true for both crops in that the overwhelming majority of farmers were over 30with the heavy skewing above 40 years of age. Figure 4.1 illustrates these findings.
AN ASSESSMENT OF THE EFFECTS OF TECHNOLOGY TRANSFER ON GENDER ROLES WITHIN A COMMUNITY 25
Figure 4.1: Age of respondents
4.1.3 Number of Children
Almost all the respondents (95%) had children, the mode being 3 and the mean 3.47%. Figure 4.2illustrates the distribution of number of children among the respondents. About 60% had 5 childrenor less. About 5% had no children. Most of the children, about 60%, were in the school system withanother 25% in the job market. Of those who had children, the mean number was 3.47 with themode being 3 and the standard deviation 2.03. Most of the children were in the school system, thatis, 52% while another 25% was working. Otherwise, some were away from home for various reasonssuch as post secondary school training, marriage and even illness.
4.1.4 Level of Education
Almost all the respondents (over 97%) described themselves as belonging to a Christian religion,with less than 1% claiming atheism. Virtually all of the respondents were members of the Kikuyutribe, although a negligible two respondents refused to specify their tribe. The level of education wasjust as the researcher expected, with over 80% having had some level of formal education. Almost16% admitted to not having had any education whatsoever, and a further 4% refused to answer thisquestion. The researcher assumed that this latter group had had no education, so that 20% wereilliterate. As expected, the greater majority (44%) had had primary school education with a further28% having had secondary level schooling. Almost 7% had post secondary school education.
There were surprises, however, when level of education was analysed by sex and age. Twice thepercentage of women was illiterate when compared to men, while 33% of the men went to highschool as compared to 21% of the women. And while only 4% of the women had post-secondaryeducation, over 8% of the men had post- secondary school qualifications. Also, while only onewoman had higher than certificate level education and a diploma at that, nine of the men similarlyhad a higher level, including three who had attained university degrees.
Also surprising was the fact that with the exception of those aged 70 and above, the older agegroups were as well educated as that of 20 – 29 years. The researcher had expected a directrelationship between age and the level of education, that is, the younger the age, the higher the level
Bar Chart
How many children do you have?
no response
not applicable
11 and above
9-10
7-8
5-6
3-4
1-2
Frequency
100
80
60
40
20
0
AN ASSESSMENT OF THE EFFECTS OF TECHNOLOGY TRANSFER ON GENDER ROLES WITHIN A COMMUNITY 27
of education. But the correlation between them was not strong, at 0.239 (Pearson). For example,more than half the respondents between 40 and 49, and 20 and 29 had secondary school education.The three people with university degrees were in their 30s, 40s and 50s respectively, while diplomaand certificate holders were represented in the 20s, 30s, 40s and 50s age group. However, asexpected, those in their 70s were less well educated than those in younger age groups, and the levelof illiteracy rose with age especially among those who were 50 and above, peaking among thoseabove 70.
4.2 Economic Status
Just over 50% of the respondents said that they did not engage in any economic activity other thanfarming, which is an indication that farming must be taken very seriously indeed if it is to meet theneeds of farm families. Twenty percent of the respondents were in formal employment while another20% were self-employed as shown in Table 11. Seven percent chose not to reply to this question.
When broken down for the two crops, the main difference is that 57% of the tea farmers had no othereconomic activity as opposed to 49% of the coffee farmers. This makes sense when it is consideredthat tea is a more reliable crop earnings-wise than coffee, so coffee farmers probably have more ofan incentive to look for other sources of income than tea farmers. Otherwise the levels of self-employment and formal employment for the two crops were not significantly different.
4.2.1 Land Size
Overall the average size of the land was 2.28 acres or just above a hectare. The mode was 1 acre(0.48 ha), and the standard deviation was 1.65 acres. A total of 73% of the respondents had between1 and 4 acres. Another 20% had between 5 and 10 acres while only about 5% had 11 acres or above.All of the respondents in this category had less than 20 acres.
When broken down for the two crops, 77% of the tea farmers had between 1 and 4 acres, while3% had above 10 acres. When it came to coffee, 70% had between 1 and 4 acres while 7% hadabove 10 acres. This makes sense in that it is still profitable to farm tea intensively, while this nolonger appears possible in the case of coffee. It would also account for the fact that more than twice
ATPS WORKING PAPER SERIES NO. 4428
the number of coffee producers had land above 10 acres when compared to the tea producers inthis sample.
On average the farmers set aside 1 acre or so for the homestead and other buildings, and forrecreational or other family use. Such space was commonly used for entertaining, children play orsimply to define the homestead. In most cases the homestead was fenced off from the farming areaby simply constructed or planted fences.
4.2.2 Title Deeds
Overall the greater majority of the farmers (93%) had title deeds to their land, and of those who did notthe title was in the process of being registered by dint of inheritance or in a few cases, sale of land.This was as expected since land demarcation in this district was completed several decades ago,and a few of the holders of title deeds are third generation from the one that originally received thetitles in the late 50s and early 60s. Of more interest was the issue of who actually owned the land, thatis, whose name was on the title deed.
Table 42 (Appendix II) illustrates the response to the question of whose name appeared on thetitle deed. A total of 57% said self while a variety of other answers were also given – mostly parents orgrandparents. In two cases the land belonged to a local school and the head teachers were therespondents. When cross-tabulated for sex of the respondent, a surprising 27% of the femalerespondents said that the title was theirs, as opposed to 75% of the male respondents. More surprisingstill is the fact that, not only were 20% of the single respondents title-holders but that more than halfof these were female. Follow-up questions elicited the fact that traditionally, single women are oftenbequeathed land by their fathers (unlike their married sisters who rarely are). Again, single womenare more likely to buy land of their own, than married women are, probably because the singlewomen feel like stakeholders to whatever their husbands own.
4.2.3 Standard of Living
The researcher attempted to establish the contribution of the two crops to standard of living using anindex whose key components were cooking and lighting appliances, source of fuel, source of water,mode of transport, source of information, and housing.
About 30% of the respondents admitted to having access to other land apart from the one theresearch team found them working on. Of these, most owned them outright with only 5% leasingfrom the real owners, and another 2% being allowed access free of charge, mostly by relatives. Thisadditional land was mostly used for farming although 30% was idle and a negligible amount wasleased out or used for rental housing.
An impressive 48% of the respondents lived in permanent housing, while 38% lived in semi-permanent housing, and 14% in temporary housing. Forty percent of the respondents said they hadbuilt their houses with money from farming, 31% from formal employment and 12% from self-employment off the farm. A residual 17% had obtained the money through casual labour, financialassistance from parents or even bank loans.
Over 90% of the respondents described the radio as their most reliable form of information, with4% relying on other people, a tiny 1% on newspapers and a negligible 0.3% on television. When itcame to lighting, almost 90% used hurricane lamps powered by kerosene, with 6.5% using electricity,
AN ASSESSMENT OF THE EFFECTS OF TECHNOLOGY TRANSFER ON GENDER ROLES WITHIN A COMMUNITY 29
2.4% using solar power and 1.5% using gas. The cooking method of choice was the earthen three-stone fireplace (60%), followed by the jiko (21%) and the stove (10%). The majority of the people hadbore holes or wells as their source of water (68%), followed by the river (11%) and piped water (10%).Rainwater came a distant third at 6%. On how they paid for the water, the respondents were almostevenly divided along formal employment, self-employment and farming, all at about 20%. Elevenpercent said that no expense was involved and 4% said they obtained their source of water throughcasual labour.
When asked which of four furniture or appliance items they had in their houses, 64% owned asofa set, 20% owned a sewing machine and 7% owned a water tank. Only one of the respondentspossessed a fridge. For transport, 83% used public means while 8% had their own vehicles. Ninepercent depended on bicycles or motor cycles to get around. The above information is summarisedin Table 12 according to the strongest tabulated category of responses.
Table 12: Strongest responses for indicators of economic status (%)
Item Overall Coffee Tea
Title 93 93 91Land size (1-4 acres) 77 71 77Additional land 30 29 30Other economic activity 48 40 42Permanent house 48 58 30Main source of information - radio 90 92 86Main source of light - hurricane lamp 90 91 82Main source of water - boreholes/wells 68 91 32Main source of transport - public 83 82 84Main cooking method - three stone earthen 60 34 81Sofa set 64 65 62Bicycle/Motor cycle 0.6 0.5 1Personal vehicle 8 8 7Water tank 7 1.5 7Refrigerator 0.003 0 0.01
Source: Field Data
For most of the indicators there was not much difference between the two crops. But when it cameto permanent housing, bore-holes or wells and cooking methods, the coffee farmers scoredsignificantly higher than the tea farmers, despite the fact that tea has earned consistently betterprices than coffee for more than a decade. When asked how they obtained money to build theirhouses or install water, more coffee farmers cited formal employment and self-employment thanfarming. But tea farmers were evenly divided between employment (formal and self) and farming.The reasons for this disparity could lie in the fact that coffee was a good earner for several decadesbefore it began to decline and in those days it could have made farm families more economicallystable than those who depended on tea. Also, the fact that more coffee farmers engage in othereconomic activities besides farming than is the case with tea farmers is probably a contributing
ATPS WORKING PAPER SERIES NO. 4430
factor. This reliance on alternative sources of income is probably because coffee farmers cannotrely on their crop to make ends meet.
However, tea farmers scored higher than coffee farmers when it came to possession of watertanks. But it must be acknowledged that most coffee farmers had a sure source of water in boreholesor wells, and therefore probably do not see a need for enhanced water storage capacity.
It can be concluded that the adoption of modern agricultural technology (embodied in tea andcoffee production) positively affected the socio-economic status of farm households. Furthermore,these gains were spread among men and women as exemplified by the fact that increasing numbersof women actually own title deeds to land. The economic indicators tested also show that thefamilies are much better off than they would have been if they had not adopted this technology.
4.3 Gender Analysis
The households surveyed in this study were broken down into three categories: male headedhouseholds (MHH), female-headed households (FHH) and female-operated households (FOH). Anoverwhelming 75% of the households were male-headed meaning that a man was heading thehousehold. Nineteen percent of the households were headed by a woman, in most cases becauseshe was a widow, but there were also a few cases of divorce and some where the woman had neverbeen married. Less than 4% of the households were female operated, meaning that the husbandlived away from home usually for reasons of employment. In four cases it was the wives who wereurban migrants while the husbands did the farming. This situation is very different from that found inother parts of the country, for example in Machakos (Bird, Karugu et al., 2000) and Kitui (Oduol andKarugu, 1993) where up to 40% of the adult male population is absentee as urban migrants. Perhapsthe proximity of Kiambu to the city of Nairobi pre-empts the need for rural-urban migration in thatpeople can commute to their places of work in the city if need be. The households fell into the abovecategories as follows:
The FOH category was the most striking in that 75% of the respondents were less than 40 years ofage, while on the other hand the FHH category had the highest mean age. This was largely asexpected because the FHH group is skewed towards widows, who were heads of householdsbecause their spouses had died. The MHH group was more evenly distributed among the age
AN ASSESSMENT OF THE EFFECTS OF TECHNOLOGY TRANSFER ON GENDER ROLES WITHIN A COMMUNITY 31
groups 30s to 70s with 40s to 60s being best represented. There were very few farmers below 30 inany of the categories. Table 26 (Appendix II) depicts the age spread. The really glaring genderdisparity here though is the poor representation of the younger generation (under 30s) in farming inthis district.
4.4.1 Number of Children
There was no significant difference between the three categories in whether or not they had children.All the FOH respondents had children while 4% of the MHH and 6% of the FHH households werechildless. This had less meaning in the MHH category, however, as these were men who were as yetunmarried, while childless FHH respondents were at an age when they could not reasonably expectto have children.
4.4.2 Level of Education
The level of education brought out sharper differences between the different types of households.The FHH households had a significantly lower level of education than the other two categories, with31% actually being illiterate. The FOH group had 50% with a high school education but the MHHcategory did not fare badly with almost 50% having primary level education and 29% attaining highschool education.
4.4.3 Other Economic Activities
The FHH households likewise scored lower than the other two when considering additional economicactivities to supplement earnings from farming in that 54% had none at all. Again the FOH householdsscored highest on this in that almost 60% had alternative sources of income. This agrees withresults found in a similar type of study in Machakos District (Bird-David, Karugu et al., 1998) wherethe FOH category of farm households is better off economically than the other two categories. Theearlier study validates these findings in that the FOH category was much larger in Machakos thanwas the case here yet the outcome appears to be similar. FOH households have more access tofinancial resources than the other two types of households by their very nature – an absentee incomeearner supplementing that which comes from farming.
4.4.4 Land Ownership
The picture changes when land ownership is considered in that the MHH households fare betterthan the other two. Seventy seven percent of the male household heads had the title deeds in theirown names, which gave them peace of mind as well as access to credit if needed. This whencompared to FHH 39% and FOH 25% shows that women have much lower access to landedproperty than do men. An unexpected result was the 15% of MHH respondents who said that the titledeeds were in their wives’ names. Further investigation revealed that some of the wives had inheritedland from their fathers, while others had bought land through various schemes including women’sgroup activities.
ATPS WORKING PAPER SERIES NO. 4432
4.4.5 Standard of Living
For once the FHH category fared best when it came to type of housing, with a greater percentage ofthem being decently housed than either FOH or MHH. Still, as expected the FOH category had thehighest percentage with permanent housing. The following table shows this information.
Table 14: Kind of House * type of household cross-tabulation (%)
When it came to household possessions, FOH again scored highest followed by MHH households.The FHH households scored well if not as well as the other two. However, more of the latter householdshad water tanks – a pricey but very useful appliance in a rural household.
By far the majority of the respondents in any category utilised public means of transport for theirroutine activities, but 25% of the FOH, 9% of the MHH and 7% of the FHH households had a privatevehicle.
An overwhelming majority of all respondents owned a radio and relied on it for credible information.Very few relied on any other source of information – in fact it was interesting to note that some of thefarmers who owned television sets did not rely on them for news. However, 7% of the FHH farmersrelied on relatives, friends and neighbours to keep them up-to-date, as did 3% of the MHH farmers.In both types of households, it was the elderly farmers who did so.
As in most other socio-economic issues, the FOH households scored higher than the other twotypes of households when it came to source of water. In these types of households, 92% either hada bore-hole, or water piped into their homes, while a respectable 78% of the MHH, and 67% of theFHH had such access to water.
All in all, the FOH category fared better than the rest when the above socio-economic indicatorswere considered.
4.5 Division of Labour
Drawing on “Women in Development” literature the researcher assumed a strict division of labourbetween men and women, and extended this further to assume a strict division of labour betweendifferent age groups. The results from the study were mixed. For example, it was clear that childrenof both sexes played very little part in farming, which was perhaps to be expected since children
AN ASSESSMENT OF THE EFFECTS OF TECHNOLOGY TRANSFER ON GENDER ROLES WITHIN A COMMUNITY 33
spend most of the time in school and doing schoolwork. But probing questions further elicitedreluctance on the part of the farmers to point their children towards farming. Education is still seenas a way for children to better themselves as compared to their parents. This attitude appears to haveentrenched itself in the younger adults so that as mentioned earlier, the younger adults are notattracted to farming (this is attested to by the fact that over 80% of the farmers are above 40 years ofage).
But from the focussed group discussions, the researcher also detected another dimension to thislack of interest in farming by the younger adults. They felt somewhat alienated from it by the fact thattheir parents were firmly in control; that there was no role for them to play at present, and that theirideas or other input were not appreciated by a conservative older generation. Admittedly the youngerpeople were also drawn to industries that offer quicker returns, glamour of sorts and more money,such as public transport vans and buses, brokerage services for various contractors and suppliers,and of course white collar jobs when available.
Two educators (one male and one female) complained that young men often fail to finish highschool in favour of joining the matatu industry. The educators voiced the opinion that young mendrop out of school more or less voluntarily, while young women experience problems of another sort,in that their parents will not exempt them from household and farm chores in favour of their academicwork. Their opinions directly contradicted the findings of the survey where the respondents claimedthat very little work (both house and farm) was done by children, and what little was done was skewedtowards the male children.
But direct observation and casual conversation disagreed with this result, as children did undertakequite a lot of work ranging from ordinary household chores, to milk delivery, to picking tea and coffeeduring weekends and school holidays, to actual farm labour. The researcher was at a loss to explainthis anomaly and thinks that perhaps the explanation lies in perception. For example, a parent whohas spent the whole day in hard physical labour is likely to discount that which is done after schoolor perhaps considers what the children do to be light tasks. At any rate despite the opinions of theparents (the respondents), the researcher gathered enough evidence to be able to conclude thatchildren do engage in a fair amount of household and farming tasks.
But the assumption that division of labour was strictly divided along sexual lines among male andfemale children was discounted. True to expectations, female children engaged in more householdtasks than male children, although the male children did carry out more household tasks thanexpected. When it came to the farm there was no significant difference in the type of tasks that maleand female children engaged in. But when it came to the adults, this changed. Table 15 illustrateshow tasks are shared between the adults of both sexes. Housework, fetching firewood and childrearing were almost exclusively done by women, while post harvest activities and land preparationwere almost exclusively done by men.
Apart from that, crop picking was carried out equally by all sexes while cultivation was moreequitably distributed although skewed towards the men. The most interesting finding was that postharvest activity was perceived to be carried out by men to the exclusion of women. This responsewas patently erroneous to the researcher as direct observation and casual conversation as well asthe focus group discussions pointed to heavy female participation in sorting, grading, delivery, etc.
ATPS WORKING PAPER SERIES NO. 4434
Post harvest follow-up elicited the fact that this question was seen to refer to follow-up of deliveriesand payments, which indeed was almost exclusively a male domain.
Table 15: Task allocation between the sexes (percent)
This probably reflects the fact that the person whose name appears on the title deed of the farmis the person who is recognised by societies that process and sell coffee on behalf of the farmers.
Further analysis was done to point out any differences that might exist between the different typesof households with respect to division of labour. As expected, female-headed households and female-operated households had a dearth of adult males capable of performing most tasks. When necessary,adult male relatives or employees were recruited. Surprisingly, even in those households wherewomen shied away from certain tasks such as irrigation, land preparation and post harvest activities(see appendix II), some activities such as pruning, picking and farmyard manure application wereshared among four categories, namely adult males, adult females, male child and female child.
4.6 Agricultural Extension vs. Types of Households
About two thirds of the respondents knew that an extension agent worked in their area, and almost allof them knew the agents by sight. When analysed according to gender, some differences emerged,for example 57% of the respondents knew of the existence of the agent compared to 51% and 50%of the female headed households and female operated household respectively.
When asked whether they had ever talked to the extension agent, and if so what issues they haddiscussed with them, the respondents gave a wide range of answers. They included crop rotation,fertiliser and manure application, crop spacing, planting methods, soil conservation, disease andpest control, fruit farming, farm preparation, spacing, vegetable farming, crop improvement andgeneral agriculture. In addition, tea farming featured for about 20% of the respondents, but not onementioned coffee, which was unexpected. Follow-up questions elicited the fact that coffee farmersare so unhappy with the crop that they would prefer to discuss other enterprises with farm experts.However, just over half the respondents (51%) said that they had never discussed farm issues withthe extension agent.
AN ASSESSMENT OF THE EFFECTS OF TECHNOLOGY TRANSFER ON GENDER ROLES WITHIN A COMMUNITY 35
When asked for details, 31% of the respondents said that they had talked with the extension agentwithin the last year, and another 12% had talked with the agent during the last five years. But a lesser41% said that they had never talked with an extension agent. Gender differences began to emergemore strongly here with 70% of the male-headed households having a good opinion of the extensionagent (and the extension service) while a lesser 51% and 66% of the FHH and FOH thought positivelyof the service or the agent. When it came to talking with the extension agent, the female -headed and-operated households scored consistently lower than the male-headed households. For example,40% of MHH respondents said that they had talked with the extension agent about farming within thelast year and this went up to 54% in the last five years. In comparison, only 26% of the FHH respondentshad talked to the extension agent during the last year, which increased to 36% over the last five years.FOH respondents scored lowest on this with only 25% having talked to the agent over the last year orduring the last five years.
By far the most official encounters with the agent took place on the respondent’s farm (41%), withanother 5% taking place on contact farms. A few encounters took place in the local market, thechief’s baraza, the processing factory, or by the roadside.
Table 16: Where did you meet the extension agent? * type of household cross-tabulation(percentage of total)
The respondents were also asked if they would like to hold discussions on farming with theextension agent and if so, on what issues. Over 80% replied favourably with only 18% saying theywere uninterested. They cited much the same issues that were frequently discussed with extensionagents as recorded in 4.6. To these they added proper use of herbicides, and organic farming.Coffee farming was again notable by its absence in the list of issues the farmers wanted to discuss.The responses to this question showed no gender bias.
The respondents were also asked when they had last attended an extension demonstration, andthe results were quite encouraging. Fifty percent of the FHH households had attended suchdemonstrations as had 43% of the MHH and 33% of the FOH. Furthermore, a third of both FHH andMHH households had attended such demonstrations within the last two years.
ATPS WORKING PAPER SERIES NO. 4436
Table 17: Type of household vs. have you ever attended an extension demonstration?(percentage)
Response FHH FOH MHH
Yes 50 33 43No 45 58 51
Source: Field Data
When asked what they had observed in such demonstrations, they cited tea farming, tillage, cropimprovement, horticulture, pest and disease control, soil conservation, soil improvement and livestockmanagement. Again coffee was notable by its absence.
The farmers were also asked to voice their opinion of the local extension agent, to which agentsgot a decisive vote approval with two thirds of all respondents saying they thought them helpful. Justfewer than 5% had a negative opinion with a substantial 21% not being sure.
Table 18: Opinion on the usefulness of the extension agent
In conclusion, the extension service is well-known and generally well thought of by the farmerssampled here. However, it was a bit disappointing to note that the agents had contact with relativelyfew farmers on a regular basis. But even more disappointing was the fact that there appears to belittle gender sensitivity within the service which appears content to allow female-headed or -operatedhouseholds to be served at a rate significantly lower than that of male-headed households.
4.6.1 Record Keeping and Accounts vs. Type of HouseholdThe researcher was also interested in whether the farmers kept farm records and accounts. It wasnot strictly speaking an extension-related question but the researcher thought that it fitted ratherbetter here than anywhere else in this report. Thirty four percent of the respondents said that they keptsome form of farm records and accounts although few had any actual knowledge of book keeping oraccounting. Although below the half way mark, this compares very favourably with results obtainedfrom other studies elsewhere in the country where hardly any farmers kept any records (Karugu andOduol, 1994; Bird-David, Karugu et al. 1998). Table 19 and Figure 4: 3 illustrate this.
AN ASSESSMENT OF THE EFFECTS OF TECHNOLOGY TRANSFER ON GENDER ROLES WITHIN A COMMUNITY 37
Figure 4.3: Do you keep farm records and accounts?
When analysed along gender lines, the results showed that a surprising 42% of FOH respondentskept farm records and accounts, compared to only 20% of the FHH and 37% of the MHH. It wasperceived that these FOH households might have more incentive to keep such records than theFHH, because there is an absentee spouse to account to for use of resources. This may be oneaspect of farming that the extension service has had a significant impact on. However, when followedup, most of the farmers said that they kept rough records according to their own ideas and needs. Acouple of farmers had had some formal training in accounting but the vast majority had none.
Table 20: Do you employ pickers?
Response Frequency Percent
Yes 260 76.9No 78 22.1Total 338 100.0
Source: Field Data
no response
no
yes
ATPS WORKING PAPER SERIES NO. 4438
Both tea and coffee farmers said that they pay an average of Ksh 50/- per person per day to thesepickers. Pay is pegged to per unit picked – for coffee the unit is a debe (bucket) of cherry, and for teathe unit is a kilogramme of leaf.
4.7 Social Affiliation vs. Sex
A comparison was made between men and women to gauge the extent of group affiliations and tosee if there were any differences between them. The results are summarised in Table 21.
Table 21: Sex vs. group membership (percentage of total)
Type of Group Female Male
Women’s groups 34 -Church groups 16 20Farm Co-operatives 34 65
Source: Field Data
A surprising aspect of the responses to this question was the low percentage of female respondentswho admitted to being members of women’s groups. The researcher was unconvinced and followedit up during the focus group discussions and from key informants as well as casual conversation withofficials in the district administration as well as female farmers themselves. The researcher finallyconcluded that it is rare for a woman in this district not to belong to at least one women’s group. Itappeared that the female respondents understood this question to refer to formal registered groupssuch as land buying companies and business units. But the question had been meant to elicit allmembership to any women’s group, formal and informal, and unfortunately it did not do this. Informationregarding access to such memberships is important because this is a common method of bulkingmoney (saving) for such women, and even the financial markets are beginning to recognise suchgroups as a significant source of investment funds. However, those who did respond to this questionfurnished the research team with a run down of the activities of their groups. Such activities in thisdistrict include: real estate acquisition and management; business activities such as poultry projects;savings and credit services; merry-go-rounds; home improvement and collective effort in farming orother activities.
Almost twice as many men as women were members of farming co-operatives, which tallied withearlier results pertaining to post harvest activity being performed almost entirely by men.
The same analysis was also applied to the question regarding attendance of barazas (regularpublic meetings usually convened by the chief). The results are presented in Table 22.
Table 22: Sex vs. indicate how often you attend barazas (percentage)
Sex Every meeting Frequently Seldom Never
Female 41 24 25 10Male 54 17 19 10Source: Field Data
AN ASSESSMENT OF THE EFFECTS OF TECHNOLOGY TRANSFER ON GENDER ROLES WITHIN A COMMUNITY 39
The baraza is used by the local administration to keep the public informed about issues that affectthem. Government officers such as agricultural, veterinary, health social services, etc., routinelyaddress the public accordingly at such fora. In return the government can obtain feedback andgauge public reactions to various programmes or issues. The results revealed that men were keenerto participate in public affairs than women, and this was held up by direct observation of suchmeetings. This question was followed up by another asking whether farming issues were discussedin various fora. The results are shown in Table 23.
Table 23: Sex vs. indicate whether farming issues are discussed in the following (percentage)
Sex Women’s groups Church Co-operatives Barazas
Female 18 7 40 4Male 3 8 56 16
Source: Field Data
More of the respondents thought that farming issues are tackled in the co-operatives than in anyother forum. Surprisingly most of the respondents did not think that the barazas address farmingissues but those that the researcher attended, were invariably addressed by government agriculturalpersonnel. The anomaly here could be one of perception, that such meetings are not suitable for in-depth messages, and the officers restrict themselves to general pronouncements, warnings, etc.Consequently the farmers may not consider the baraza a serious forum for agricultural matters.Another factor may be that the barazas tackle other issues such as security, which may more readilyattract the attention of listeners, than mundane issues.
40
5.1 Summary
This study used a survey instrument, literature search, and direct observation, to collect data fromsmall-scale farmers, regarding the effects of tea and coffee production on gender roles in KiambuDistrict of Central Province of Kenya. Focussed group discussions and key informants were used tovalidate the data collected. During the survey 338 respondents were interviewed using purposiverandom sampling of the six divisions that make up Kiambu District. Of these, 36% were women and64% were men. The respondents were further broken down into three types of households –– male-headed (77%), female-headed (18%) and female-operated households (4%), based on the de jure
and de facto heads of the household. They were also broken down according to the two crops.Analysis was done for socio-economic status, division of labour, access to support services, socialaffiliation and marketing. The original intention of analysing the above for different age groups wasshelved because very few younger people were found engaging in tea or coffee production.
5.2 Conclusions
The production of tea and coffee in this district over the last four or five decades has had a positiveeffect on the households of the farmers.
Coffee production is on the decline in the district mostly as a result of low world prices, but teaappears to be attracting new producers. Coffee farmers invest minimal resources in it’s productionand do not seek advice from the extension service, but tea farmers still invest substantially in production,as well as seek support from extension agents. However, coffee farmers enjoy a higher standard ofliving than tea farmers, probably built on the past success of the crop, as well as the necessaryalternative sources of income.
The results of this study pointed to a confirmation of the results of numerous other studies on theeffects of technology transfer on gender roles in farming communities. Most of the earlier studieshad focussed on instances where technology transfer had been unsuccessful, the premise beingthat subsequent or potential inequalities had led to rejection. This study dealt with two cases wherethe transfer of technology has clearly been successful, yet not only had inequalities arisen, but theydo not appear to be the main reason for rejection in the short run. In the long run, however, suchrejection is tied to gender imbalances as younger generations simply refuse to engage in productiveactivities that are to their disadvantage. Therefore the life cycle of a technology might be more at riskfrom gender disparity than from normal obsolescence.
Chapter Five
Summary, Conclusions and Recommendations
AN ASSESSMENT OF THE EFFECTS OF TECHNOLOGY TRANSFER ON GENDER ROLES WITHIN A COMMUNITY 41
The objectives of this study were as follows:
The main objective was to assess the impact of the adoption of an entire package of technology ongender roles within the farming communities, with the intent of determining any imbalances thatneed to be addressed. In this case, the package of technology under study was that embodied in theproduction of two cash crops – tea and coffee, and the community under study was smallholderfarmers in Kiambu District, Kenya.
The specific objectives were as follows:1) To determine whether the adoption of technology embodied in tea and coffee production
has affected the socio-economic status of males and females in the area of study.2) To determine the extent that the adoption of the technology embodied in tea and coffee
production has affected division of labour along gender lines in the area of study.3) To examine the extent to which extension and other support services for this package
of technology are gender sensitive within the area of study.
The researcher made the following conclusions from this study:1) The adoption of this package of technology has had effects on the gendered socio-
economic status of these farmers in the following ways:a) Young people do not appear to be attracted to cash crop farming in this district as
only 5% were under 30 years of age and 19% were under 40.b) Three quarters of the households sampled were male-headed, with 19% being
female-headed and 4% being female-operated.c) Education level of the head of the household was highest for both MHH and FOH
households while that of the FHH was significantly lower.d) The FHH respondents registered a higher mean age than the others while the
FOH respondents had the lowest mean age. MHH respondents had a wider agespread than the other two.
e) The FOH type of households enjoyed the highest standard of living when comparedto the other two. They had more access to alternative sources of income, andscored higher than the other types of households on all the indicators used in thestudy apart from housing. Only on the housing indicator did the FHH householdsscore better than the other two.
2) The findings showed a distinct division of labour between adult males and femaleswhen it came to crop production and normal household activities. However, there wasno such distinction between male and female children.
3) On extension and other support services:a) There was a significant gender disparity in access to extension and other support
services, with male respondents enjoying more of these services than the femalerespondents. The implication is a male (and age) bias in the delivery of theseservices.
ATPS WORKING PAPER SERIES NO. 4442
b) A third of all respondents kept farm records and accounts but while this held truefor the MHH respondents, only a fifth of the FHH respondents kept such records.
c) Voluntary group affiliation appeared to appeal only to females who revealedmembership to various women and church organisations. The men were attractedto more official organisations such as farming co-operatives. Men also attendedbarazas in larger numbers and more frequently than women.
d) The farmers were generally well informed about the general trends in theirrespective crops but they were ignorant on the finer details. Over half the respondentshad access to credit (mostly from their co-operative societies). But men had greateraccess to such credit than women. The respondents cited numerous problemsthat hinder and discourage the production and marketing of the two crops stressinglow prices, transport problems, expensive and inadequate labour, expensive inputs,inefficient co-operatives and lack of alternative markets.
5.3 Recommendations
From this study and the conclusions, the researcher makes the following recommendations:1) That further studies need to be done on the effects of technology transfer on gender
roles with respect to farmer communities, to investigate the relationship betweensuccess or failure (acceptance or rejection) of technology and its effect on men, womenand different age groups. Such studies can be done on different farm enterprises, othercommunities and on medium or large-scale producers.
2) That gender equality be internalised at the policy level so as to pre-empt situations inwhich gender inequalities occur. This may ensure that technologies enjoy a normallife cycle rather than being rejected pre-maturely by disadvantaged groups.
3) That the policies surrounding tea, coffee and other cash crops in Kenya be urgentlyreviewed to take into account the interests of women and young people. Current policiesprotect the interests of the land owners at the expense of other stakeholders in theirfamilies to the extent that, the family is expected to do what amounts to back-breakingwork for the sole benefit of the holder of the title deed. And while the assumption is thatany benefits will filter down to these groups, this is not always the case. There isgrowing evidence that this situation is not acceptable especially among the youngerpeople, and this must necessarily threaten the future of cash crop production unlesssuitably addressed.
4) Policy makers also need to address the lack of equal access to education, supportservices and marketing for women. It is not clear how the national goals of povertyalleviation, food security and accelerated development can be achieved if any sectionof the society is deprived. Equal access to the resources of society appears to be asurer, more logical path to national goals. This might mean affirmative action in the(near) future to enable disadvantaged groups to catch up with the rest.
43
Ahmed, I. 1985. (Ed) Technology and Rural Women: Conceptual and Empirical Issues. London:Allen and Unwin.
Amin, S. 1974. Accumultion on a World Scale: A Critique of the Theory of Underdevelopment. 2 vols.New York and London: Monthly Review Press
Bird-David, N., Karugu, W. N., and Oduol, W. A., 2001. Technological Change and Rural Third WorldWomen. Report submitted to the Netherlands-Israel Research Project. The Hague.
Boserup, E. 1970. Women’s Role in Economic Development. London: Alec and Unwin.Cernea, M. 1995. ‘Social organisation and development anthropolgy’. 1995 Malinowski Award
Lecture, Society for Applied Anthroplogy. Washington D.C.: The World Bank.Cernea, M Ed. 1985. Putting people first. New York: OU.P.Collingbridge, D. 1981. “The Social Control of Technology”. Open University Press, Milton Keynes.De Groot, J. 1991. ‘Conception and misconceptions: the historical and cultural context of discussion
on women and development’. In: Women, Development and Survival in the Third World. (Ed.Afshar, M) London: Longman.
Economic Intelligence Unit, 2001. Kenya Report 2000.Escobar, A. 1997. “Anthropology and development”. In: International Social Science Journal 154 pp
497-517.Escobar, A. 1995. Encountering Development :The making and unmaking of the third world. Princeton:
Princeton University Press.Feldstein, Flora and Poats, 1989. “The Gender Variable in Agricultural Research” IDRC/CRDI/CID.
Manuscript Report 225e, Ottawa.Feldstein, H., Poats, S., Cloud, K. and Husinga, N., 1989. Working Together: Gender Analysis in
Agriculture. West Hartford, Conn.: Kumarian Press.Feldstein, Poats, Cloud & Norem, 1989. “Conceptual Framework for Gender Analysis in Agriculture”
pp 7-37 Vol. 1 Kumarian Press.Frank. A. G. 1978. Dependent Accumulation and Underdevelopment. London: Macmillan.Gilligan, C. 1982. In a Different Voice. Cambridge Mass.: Harvard University Press.Guyer, J. I. 1984. “Women in the Rural Economy”. African Women South of the Sahara. Longmans.Hay, J. & Stichter, S. 1984. African Women South of the Sahara. Longmans.Jaetzol, J. & Schmidt, H. 1984. “Farm Management Handbook of Kenya Vol. II Central Kenya Part B”.
Ministry of Agriculture, GAT & GTZ, Nairobi.Kaindeh, P. 1995. “Technology Transfer from the Crop Research & Extension Project in Sierra
Leone”. Technology and Practice in Africa (Ed. Ogbu, O., Oyeyinka, B., & Mlawa, H.) IDRC.
Bibliography
ATPS WORKING PAPER SERIES NO. 4444
Kenyatta Jomo. 1937. “Facing Mount Kenya: Tribal Life of the Gikuyu”. New York: Vintage Press.Ker, Moorse, Watts & Gill. 1978. “Agriculture in East Africa”. ELBS, London.Kershaw, C. 1975. “The Changing Roles of Men and Women in the Kikuyu Family by Socio-Economic
Status”. Rural Africana Vol. 29, pp 173-194.Lewis, Barbara. 1984. “The Impact of Development Politics on Women”. African Women South of the
Sahara. Longmans.Marstrand, P. 1979. “Shadow on the 70s: Indicative World Plan, Protein Gap & the Green Revolution”
(Whiston, T. Ed.) Macmillan.Mohanty, C. 1988. “Under western eyes: Feminist scholarship and colonial discourses”. In: Feminist
Review 30:61-88Mullings, Leith. 1976. “Women and Economic Change in Africa”. Women in Africa. Stanford University
Press, California. Hafkin and Bay, Eds.Ngugi, Karau & Nguyo. 1982. “East African Agriculture”. Longmans.Norton, G. W. & Alwang, J. 1993. “Introduction to the Economics of Agricultural Development”. New
York: McGraw-Hill.Oduol, W. A. & Karugu W. N. 1994 .The Improved Sorghum and Millet Programme: Its Social-
Economic Implications for Women Farmers in Kitui District, Eastern Kenya”. Report submittedto the Carnegie Corporation.
Overholt, C. A., Anderson, M. B., Cloud, K., Austi, J. E., 1985. Gender Roles in Development Projects.
West Hartford, Conn.: Kumarian Press.Pala, A. O. 1980. Daughters of the lakes and rivers: Colonization and the land rights of Luo women
(Eds. Etienne, M & Leacock, C.). Women and Colonisation: Anthroplogical Perspectives. NewYork: Praeger.
Parpart, L. J. 1995. “Postmodernism, gender and development”. In: Power of Development (Ed.Crush, J.) London: Routledge. Pp 253-265.
Paterson, D. 1980. Coping with land scarcity: the pattern of household adaptation in one Luhyacommunity WP 360, U O N, Institute for Development Studies, January.
Raeburn, J. R. 1984. “Agriculture: Foundations, Principles & Development”. John Wiley & Sons Ltd.,Chichester, etc.
Rao A., Anderson, M. B., and Overholt, C. A., 1991. Gender Analysis in Development Planning: A
Case Book. West Hartford, Conn.: Kumarian Press.Report (IDRC). 1995. “Gender and Development: Equity for All. Vol. 23 No. 2 July 1995.Republic of Kenya. 1993. “Annual Report: Kiambu”. Ministry of Agriculture, Government Printer.Republic of Kenya. 1993. “Economic Survey”. Central Bureau of Statistics, Government Printer.Republic of Kenya. 1994. “Economic Survey”. Central Bureau of Statistics, Government Printer.Republic of Kenya. 1994. “Kenya Population Census”. Central Bureau of Statistics, Government
Printer.Rostow, W. 1960. The Stages of Economic Growth. Cambridge: Cambridge University Press.Smeltser, N. J. 1963. “The Sociology of Economic Life”. Prentice-Hall.Spelman, M., 1990. Inessential Woman. London: Woman’s Press.Stamp, Patricia. 1995. “Technology, Gender and Power in Africa”. Ottawa: IDRC.
AN ASSESSMENT OF THE EFFECTS OF TECHNOLOGY TRANSFER ON GENDER ROLES WITHIN A COMMUNITY 45
Staudt, K. 1977. Women farmers and inequities in agricultural services. In: Rural Africana. EastLansing Michigan State University, African Studies Center No 29, Winter.
Economic Review October 18-24, 1993. “Tea: Brewing Storm”, pp 4-11.Economic Review November 1st-7th, 1993. “Tea: Record Bonus”, pp 20.Economic Review 5th-14th August, 1994. “Three New Districts”, pp 30.White, Luisa. 1984. “Women in the Changing African Family”. African Women South of the Sahara,
Longmans.Whitehead, A. 1985. Effects of Technological Change on Rural Women: A Review of Analysis and
Concepts. In: (Ed. Ahmed, I), Technology and Rural Women: Conceptual and Empirical Issues.
London: Allen and Unwin.
Appendixes
AN ASSESSMENT OF THE EFFECTS OF TECHNOLOGY TRANSFER ON GENDER ROLES WITHIN A COMMUNITY 47
DATE: ............................................................ RA .................................................................CROP: ……………………………….
QUESTIONNAIRE
BACKGROUND INFORMATION
1) What is your name? .....................................................................................................................2) What is the name of your: -
a) Village ....................................................................................................................................b) Sub-location ..........................................................................................................................c) Location ................................................................................................................................d) Division ..................................................................................................................................
3) What is your tribe? ........................................................................................................................4) Are your married?
a) Yes .........................................................................................................................................b) No ..........................................................................................................................................c) Other (specify) ......................................................................................................................
5) If the answer to question 4 is yes, where is she/he? ...................................................................6) How many people live here? .......................................................................................................7) What is your relationship with them? ..........................................................................................8) What is your age? ........................................................................................................................9) What is your religion? ..................................................................................................................10) What is the level of your education: -
a) Primary Std ............................................................................................................................b) Secondary form ....................................................................................................................c) Certificate in ..........................................................................................................................d) Diploma in .............................................................................................................................e) Degree in ..............................................................................................................................f) Other (specify) ......................................................................................................................
11) Do you have children?a) Yes .........................................................................................................................................b) No ..........................................................................................................................................
12) How many children do you have? ...............................................................................................13) Where are they and why? ............................................................................................................
Sons Daughtersa) Living at home becauseb) At school - Primary level ........................... ...........................
14) Apart from farming, what other economic activities do you engaged in : -a) Formal employment (specify) …………. Where? ………… since when? ………...
Permanent? ………………………………………………….b) Self-employment (specify) ……… Where? ………… since when? ………...c) Other (specify) ……………………… .....................................................................................
15) What is the size of your land? ......................................................................................................16) How much of it do you utilise for agricultural production? .........................................................17) Is there a title deed for your land?
a) Yes .........................................................................................................................................b) No ..........................................................................................................................................c) other (specify) .......................................................................................................................
18) If the answer to question 17 is yes, in whose name is the title deed? ........................................19) How is the owner related to you? ................................................................................................20) Who uses the land? .....................................................................................................................21) Who used it before you? ..............................................................................................................22) Who will use it after you? .............................................................................................................23) Can you dispose of this land? (sell, give, bequeath, etc.) ..........................................................24) If not, who can? ............................................................................................................................25) Do you utilise other pieces of land apart from this one?
a) Yes .........................................................................................................................................b) No ..........................................................................................................................................
26) If yes, how many? .........................................................................................................................27) If yes, do you
a) Own them? ...........................................................................................................................b) Rent them? ...........................................................................................................................c) Other (specify) ......................................................................................................................
28) How do you utilise them? ............................................................................................................29) What kind of house do you live in?
a) Permanent (describe) (i) roof ………... (ii) walls ……….. (iii) floor ……... (iv) windows …….b) Semi-Permanent (describe) (i) roof ….. (ii) walls ……...... (iii) floor …….. (iv) windows ……c) Temporary (describe) (i) roof ………... (ii) walls …….….. (iii) floor ……. (iv) windows ……
30) Describe the homestead and sketch it
31) How did you obtain money to build your house? ........................................................................32) What do you cook with?
a) Earthen cooking place using ...............................................................................................b) Stove using ............................................................................................................................
AN ASSESSMENT OF THE EFFECTS OF TECHNOLOGY TRANSFER ON GENDER ROLES WITHIN A COMMUNITY 49
c) Jiko using ..............................................................................................................................d) Cooker using .........................................................................................................................
33) What form of lighting do you use?a) Hurricane lamp .....................................................................................................................b) Gas ........................................................................................................................................c) Electricity ...............................................................................................................................d) Other (specify) ......................................................................................................................
34) Do you own: -a) Sofa set .................................................................................................................................b) Fridge ....................................................................................................................................c) Sewing machine ..................................................................................................................d) Water tank .............................................................................................................................
35) What is your usual mode of transport?a) PSV ........................................................................................................................................b) Bicycle ...................................................................................................................................c) Motor cycle ...........................................................................................................................d) Own vehicles (describe) ......................................................................................................
36) What is your most usual form of reliable information?a) Radio .....................................................................................................................................b) Newspaper ............................................................................................................................c) TV ..........................................................................................................................................d) Other (specify) ......................................................................................................................
37) What is your access to water?a) Borehole ................................................................................................................................b) Piped water ...........................................................................................................................c) Rain water .............................................................................................................................d) River ………………………….Source ……………………………………e) Spring …………………………source ……………………………………f) Lake …………………………..source ……………………………………g) Other (specify) ......................................................................................................................
38) How did you obtain money to pay fora) Borehole ................................................................................................................................b) Piped water ...........................................................................................................................
39) Indicate the amount of produce you sold last season?Name of Product Amount Sold per Unit Time Price per Unita) .................................. ............................................... ..........................................b) .................................. ............................................... ..........................................c) .................................. ............................................... ..........................................d) .................................. ............................................... ..........................................e) .................................. ............................................... ..........................................f) ................................... ............................................... ..........................................g) .................................. ............................................... ..........................................
ATPS WORKING PAPER SERIES NO. 4450
40) Do you have livestocka) Yes .........................................................................................................................................b) No ..........................................................................................................................................
41) If the answer to question 40 is yes, indicate the type of livestock and the numberType of Livestock Numbera) .................................. ...............................................b) .................................. ...............................................c) .................................. ...............................................d) .................................. ...............................................e) .................................. ...............................................f) ................................... ...............................................g) .................................. ...............................................
42) How did you obtain money to buy these livestock? .....................................................................43) Indicate the livestock or livestock product sold this year ............................................................
Type of Livestock Product Sold Amount per Unit Time Price per Unita) ............................... ..................... ................................... ...............................b) ............................... ..................... ................................... ...............................c) ............................... ..................... ................................... ...............................d) ............................... ..................... ................................... ...............................e) ............................... ..................... ................................... ...............................f) ................................ ..................... ................................... ...............................g) ............................... ..................... ................................... ...............................
CASH CROP PRODUCTION
44) Indicate the crops you grow now and hectarageCrops Grown Hectaragea) .................................. ...............................................b) .................................. ...............................................c) .................................. ...............................................d) .................................. ...............................................e) .................................. ...............................................f) ................................... ...............................................g) .................................. ...............................................
Sketch Farm Plan here
45) What variety do you grow? ...........................................................................................................
AN ASSESSMENT OF THE EFFECTS OF TECHNOLOGY TRANSFER ON GENDER ROLES WITHIN A COMMUNITY 51
46) What is the size of your hectarage under this crop? ...................................................................47) When did you start growing it? .....................................................................................................48) Where did you get the idea of growing it? ...................................................................................49) How many bags/debes did you harvest last season? .................................................................50) What problems do you face when producing this crop?
a) ...................................................................................................................................................b) ...................................................................................................................................................c) ...................................................................................................................................................d) ...................................................................................................................................................e) ...................................................................................................................................................f) ....................................................................................................................................................g) ...................................................................................................................................................
51) Suggest solutions to these problems.a) ...................................................................................................................................................b) ...................................................................................................................................................c) ...................................................................................................................................................d) ...................................................................................................................................................e) ...................................................................................................................................................f) ....................................................................................................................................................g) ...................................................................................................................................................
52) Do you consume the following in your household?a) Tea ........................................................................................................................................b) Coffee ....................................................................................................................................
53) In what form do you consume them and how often?a) Tea ………………….……. Frequency ……………………….b) Coffee ……………………. Frequency ……………………….
DIVISION OF LABOUR
54) Do any member of your family stay away from home?a) Yes .........................................................................................................................................b) No ..........................................................................................................................................c) Other (specify) ......................................................................................................................
55) If your answer to the above question is yes, indicate the following: -Whom Where Living Reasona) .................................. ............................................... ..........................................b) .................................. ............................................... ..........................................c) .................................. ............................................... ..........................................d) .................................. ............................................... ..........................................e) .................................. ............................................... ..........................................f) ................................... ............................................... ..........................................g) .................................. ............................................... ..........................................
56) Who performs their tasks during their absence? ........................................................................
ATPS WORKING PAPER SERIES NO. 4452
57) Indicate whether they send you the following: -Money Food Other (specify)
60) Do you know whether there are extension agents who work in this sub-location? ...................61) When did you last talk to her/him about farming? .......................................................................62) What did you talk about? ..............................................................................................................63) Where did you meet him/her?
a) On your farm .........................................................................................................................b) Contact farm .........................................................................................................................c) Baraza ...................................................................................................................................d) Other (specify) ......................................................................................................................
64) Has the extension agent ever advised you on farming matters?a) Yes .........................................................................................................................................b) No ..........................................................................................................................................c) Other (specify) ......................................................................................................................
65) Why? .............................................................................................................................................66) Do you keep farm records and accounts?
a) Yes .........................................................................................................................................b) No ..........................................................................................................................................c) Other (specify) ......................................................................................................................
67) Indicate membership in-groups and when last attended.Member Last Attendeda) Women group ...............................................b) Church group ...............................................c) Farm co-operatives ...............................................d) Other (specify) ...............................................
68) Indicate how often you attend Barazasa) Every meeting .......................................................................................................................b) Frequently .............................................................................................................................c) Seldom ..................................................................................................................................d) Never .....................................................................................................................................
69) When did you last attend a Baraza? ............................................................................................70) Indicate whether farming issues are discussed in the following: -
Forum Frequency of Discussion Last Discusseda) (Farming)b) Women’s Group ............................................... ..........................................c) Church group ............................................... ..........................................d) Co-operative ............................................... ..........................................e) Baraza ............................................... ..........................................
71) Have you ever attended a course at F.T.C.?a) Yes .........................................................................................................................................b) No ..........................................................................................................................................c) Other (specify) ......................................................................................................................
72) If not, why? ....................................................................................................................................
AN ASSESSMENT OF THE EFFECTS OF TECHNOLOGY TRANSFER ON GENDER ROLES WITHIN A COMMUNITY 55
73) Would you like to attend? .............................................................................................................74) If yes, when attended and why? ...................................................................................................75) Describe the course you studied at the F.T.C. ............................................................................
......................................................................................................................................................76) Have you ever attended an extension demonstration?
a) Yes .........................................................................................................................................b) No ..........................................................................................................................................c) Other (specify) ......................................................................................................................
77) When did you last attend an extension demonstration? .............................................................78) Describe the demonstration you attended? ................................................................................
......................................................................................................................................................79) Some people think the extension agent is helpful. Some do not. What do you think? ............
MARKETING
80) How many bags or smaller units of produce did you retain last seasons?a) Maize .....................................................................................................................................b) Beans ....................................................................................................................................c) Potatoes ................................................................................................................................d) Cabbages ..............................................................................................................................e) Sukuma Wiki .........................................................................................................................
81) Do you purchase inputs for cultivating your cash crop?a) Yes .........................................................................................................................................b) No ..........................................................................................................................................c) Other (specify) ......................................................................................................................
82) If yes, how much did they cost you?Item Type Amount Costa) Fertiliser (specify) ...............................................Ksh………Per ............................b) Pesticides (specify) ...............................................Ksh………Per ............................c) Other (specify) ...............................................Ksh………Per ............................
83) Do you employ pickers?a) Yes .........................................................................................................................................b) No ..........................................................................................................................................
84) If yes, how many? .........................................................................................................................85) If yes, how much do you pay per unit wt/vol./time? .....................................................................86) Have you sold tea/coffee this year? If not last year?
a) Yes .........................................................................................................................................b) No ..........................................................................................................................................c) Other (specify) ......................................................................................................................
87) If yes, indicate the amount sold ...................................................................................................
ATPS WORKING PAPER SERIES NO. 4456
88) Where did you sell your tea/coffee? ............................................................................................89) To whom did you sell it? ..............................................................................................................90) How was the produce transported from your farm?
a) On foot ...................................................................................................................................b) By bicycle ..............................................................................................................................c) By vehicle (specify - hired/own/PSV/borrowed) ...................................................................d) By donkey ..............................................................................................................................e) Other (specify) ......................................................................................................................
91) Indicate costs for this transport Who Paid Cost Ksh/Unit
............................................................... ……………….per .............................................92) What prices did you received for your produce last season? .....................................................93) Do you know the final destination for your produce?
a) Yes .........................................................................................................................................b) No ..........................................................................................................................................
94) If yes, where? ...............................................................................................................................95) Has there been any change in the marketing of this crop in the last five years?
a) Yes .........................................................................................................................................b) No ..........................................................................................................................................
96) If yes, what changes? ........................................................................................................................................................................................................................................................................
97) Is there any grading for this produce?a) Yes .........................................................................................................................................b) No ..........................................................................................................................................c) Do not know ..........................................................................................................................
98) If yes, how was your produce graded last season? ....................................................................99) Do you have any form of credit now?
a) Yes .........................................................................................................................................b) No ..........................................................................................................................................c) Other (specify) ......................................................................................................................
100) If yes, from where did you obtain credit?a) Co-operative ..........................................................................................................................b) AFC .......................................................................................................................................c) Local bank ............................................................................................................................d) Trader ...................................................................................................................................e) Friend ....................................................................................................................................f) Other (specify) ......................................................................................................................
101) Are you a member of the local co-operative society? ………………………102 ) If so, in whose name is the membership? .............................................................................103) In what form did you obtain credit?
a) Direct loan .............................................................................................................................b) Bank overdraft .......................................................................................................................
AN ASSESSMENT OF THE EFFECTS OF TECHNOLOGY TRANSFER ON GENDER ROLES WITHIN A COMMUNITY 57
c) Inputs .....................................................................................................................................d) Other (specify) ......................................................................................................................
104) What problems did you experience when marketing this crop?..........................................................................................................................................................................................................................................................................................................................................................................................................................................................................................................................................................................................................................................................................................................................................................
105) What solutions do you suggest for these problems?......................................................................................................................................................................................................................................................................................................................................................................................................................................................
Table 47: Other enterprises - who do them? * type of household cross tabulation
FHH FOH MHH Total
Adult male 2 2% of Total 0.6 0.6Male Child 15 38 74% of Total 4.2 11.3 15.7Female child 1 3 4% of Total 0.3 0.9 1.2Adult female 48 12 219 279% of Total 14.2 3.6 64.8 82.5Total 64 12 262 338% of Total 18.9 3.6 77.5 100
Table 48: Irrigation * type of household cross tabulation
FHH FOH MHH Total
Adult male 38 7 156 201% of Total 11.2 2.1 46.2 59.5Adult female 14 2 54 70% of Total 4.1 0.6 16.0 20.7Male child 2 1 12 15% of Total 0.6 0.3 3.6 4.4Female child 10 2 40 52% of Total 3.0 0.6 11.8 15.4Total 64 12 262 338% of Total 18.9 3.6 77.5 100
AN ASSESSMENT OF THE EFFECTS OF TECHNOLOGY TRANSFER ON GENDER ROLES WITHIN A COMMUNITY 65
Table 49: Fertilizer * type of household cross tabulation
FHH FOH MHH Total
Adult male 3 10 13% of Total 0.9 3.0 3.9Adult female 3 1 13 17% of Total 0.9 0.3 3.8 5.0Male child 1 8 9% of Total 0.3 2.4 2.7Female child 3 3% of Total 0.9 0.9
2 20.6 0.61 2 30.3 0.6 0.93 18 210.9 5.3 6.2
No response 11 2 61 77% of Total 3.3 1.5 18.0 22.8Not applicable 40 6 147 193% of Total 11.8 1.8 43.5 57.1Total 64 12 262 338% of Total 18.9 3.6 77.5 100
Table 50: Pesticides * type of household cross tabulation
FHH FOH MHH Total
Adult male 1 1% of Total 0.3 0.3Adult female 2 2% of Total 0.6 0.6Male child 1 1% of Total 0.3 0.3Not applicable 50 11 225 286% of Total 14.8 3.3 66.6 84.6No response 14 1 33 48% of Total 4.1 0.3 9.8 14.2Total 64 12 262 338% of Total 18.9 3.6 77.5 100
ATPS WORKING PAPER SERIES NO. 4466
Table 51: Picking * type of household cross tabulation
FHH FOH MHH Total
Adult male 1 4 5% of Total 0.3 1.2 1.5Male Child 13 37 50% of Total 3.8 10.9 14.8Adult female 2 1 3% of Total 0.6 0.3 0.9Female child 1 1% of Total 0.3 0.3No response 1 1% of Total 0.3 0.3Not applicable 48 12 218 278% of Total 14.2 3.6 64.5 82.2Total 64 12 262 338% of Total 18.9 3.6 77.5 100
Table 52: Post harvest activities * type of household cross tabulation
FHH FOH MHH Total
Adult male 62 12 261 335% of Total 18.3 3.6 77.2 99.1Adult female 2 1 3% of Total 0.6 0.3 0.9Total 64 12 262 338% of Total 18.9 3.6 77.5 100
Table 53: Who does the land preparation? * type of household cross tabulation
FHH FOH MHH Total
Adult male 51 10 219 280% of Total 15.2 3.0 65.2 83.3Adult female 4 1 21 26% of Total 1.2 0.3 6.3 7.7Male child 1 5 6% of Total 0.3 1.5 1.8Female child 2 9 11% of Total 0.6 2.7 3.3No response 3 2 5% of Total 0.9 0.6 1.5Not applicable 2 1 5 8% of Total 0.6 0.3 1.5 2.4Total 63 12 261 336% of Total 18.8 3.6 77.7 100
AN ASSESSMENT OF THE EFFECTS OF TECHNOLOGY TRANSFER ON GENDER ROLES WITHIN A COMMUNITY 67
Table 54: who does the planting? * type of household cross tabulation
FHH FOH MHH Total
Adult male 46 8 183 237% of Total 13.6 2.4 54.1 70.1Adult female 17 4 69 90% of Total 5.0 1.2 20.4 26.6Male child 1 6 7% of Total 0.3 1.8 2.1No response 1 1% of Total 0.3 0.3 Not applicable 3 3% of Total 0.9 0.9Total 64 12 262 338% of Total 18.9 3.6 77.5 100
Table 55: Pruning - who does it? * type of household cross tabulation
FHH FOH MHH Total
PRUNING
Adult male 4 10 14% of Total 1.3 3.3 4.71 1 5 5% of total 0.3 1.3 1.71 2 2% of Total 0.7 0.71 2 1 4 7% of Total 0.7 0.3 1.3 2.32 4 8 12% of Total 1.3 2.7 4.02 1 1% of Total 0.3 0.3Adult female 4 1 18 23% of Total 1.3 0.3 6.0 7.72 5 5% of Total 1.7 1.72 2 6 8% of Total 0.7 2.0 2.73 3 3 38 44% of Total 1.0 1.0 12.7 14.73 2 9 11% of Total 0.7 3.0 3.7Male child 2 2
ATPS WORKING PAPER SERIES NO. 4468
% of Total 0.7 0.73 1 1% of total 0.3 0.34 1 1% of Total 0.3 0.3Female Child 8 8% of Total 2.7 2.75 1 2 3% of Total 0.3 0.7 1.05 1 1% of Total 0.3 0.35 3 16 19% of Total 1.0 5.3 6.36 1 1 2% of Total 0.3 0.3 0.66 2 1 10 13% of total 0.7 0.3 3.3 4.37 3 19 22% of Total 1.0 6.3 7.39 8 2 35 45% of Total 2.7 0.7 11.7 15.010 17 1 33 51% of Total 5.7 0.3 11.0 17.0Total 59 9 232 300% of Total 19.7 3.0 77.3 100.0
Table 56: Farmyard manure - who applies it? * type of household cross tabulation
FHH FOH MHH Total
FARMYARD MANURE
Adult male 2 6 8% of Total 0.6 1.8 2.41 4 1 14 19% of total 1.2 0.3 4.1 5.61 3 3% of Total 0.9 0.91 1 4 5% of Total 0.3 1.2 1.52 6 5 11% of Total 1.8 1.5 3.32 1 1% of Total 0.6 0.6Adult female 4 15 19% of Total 1.2 4.4 5.6
AN ASSESSMENT OF THE EFFECTS OF TECHNOLOGY TRANSFER ON GENDER ROLES WITHIN A COMMUNITY 69
2 1 19 20% of Total 0.3 5.6 5.92 3 13 16% of Total 0.9 3.8 4.73 5 4 45 54% of Total 1.5 1.2 13.3 16.03 2 17 19% of Total 0.6 5.0 5.6Male child 1 1 1 3% of Total 0.3 0.3 0.3 0.93 2 2 4% of Total 0.6 0.6 1.24 1 1% of Total 0.3 0.34 3 3% of Total 0.9 0.9Female Child 1 6 7% of Total 0.3 1.8 2.15 1 4 5% of Total 0.3 1.2 1.55 2 2% of Total 0.6 0.65 4 1 20 25% of Total 1.2 0.3 5.9 7.46 2 2 4% of Total 0.6 0.6 1.26 3 1 15 19% of total 0.9 0.3 4.4 5.67 1 12 13% of Total 0.3 3.6 3.88 1 1% of Total 0.3 0.39 4 1 8 13% of Total 1.2 0.3 2.4 3.810 18 2 42 62% of Total 5.3 0.6 12.4 18.3Total 64 12 262 338% of Total 18.9 3.6 77.5 100.0
ATPS WORKING PAPER SERIES NO. 4470
Table 57: Knowledge of any extension agents * type of household cross tabulation
Responses FHH FOH MHH Total
Yes 33 6 163 202% of Total 9.8 1.8 48.2 59.8No 28 6 93 127% of Total 8.3 1.8 27.5 37.6Not sure 3 - 6 9% of Total 0.9 - 1.8 2.7Total 64 12 262 338% of Total 18.9 3.6 77.5 100.0
Table 58: Extension agent helpful *type of household cross tabulation
Response FHH FOH MHH Total
Yes 33 8 184 225% of Total 9.8 2.4 54.4 66.6No 4 2 8 14% of Total 1.2 0.6 2.4 4.1Do not know 10 1 43 54% of Total 3.0 0.3 12.7 16.0Not applicable 1 5 6% of Total 0.3 1.5 1.8No response 16 1 22 39
% of Total 4.7 0.3 6.5 11.5Total 64 12 262 338% of Total 18.9 3.6 77.5 100.0
Table 59: When did you last talk to him or her about farming? * type of household crosstabulation
Response FHH FOH MHH Total
Yes 33 8 184 225% of Total 9.8 2.4 54.4 66.6No 4 2 8 14% of Total 1.2 0.6 2.4 4.1Do not know 10 1 43 54% of Total 3.0 0.3 12.7 16.0Not applicable 1 5 6% of Total 0.3 1.5 1.8No response 16 1 22 39% of Total 4.7 0.3 6.5 11.5Total 64 12 262 338% of Total 18.9 3.6 77.5 100.0
AN ASSESSMENT OF THE EFFECTS OF TECHNOLOGY TRANSFER ON GENDER ROLES WITHIN A COMMUNITY 71
Table 60: Do you keep farm records and accounts? * type of household cross tabulation
Response FHH FOH MHH Total
Yes 13 5 97 115% of Total 3.8 1.5 28.7 34.0No 48 6 159 213% of Total 14.2 1.8 47.0 63.0No response 3 1 6 10% of Total 0.9 0.3 1.8 3.0Total 64 12 262 338% of Total 18.9 3.6 77.5 100.0
NB: The source of all the tables in Appendix II is Field Data