Board of Governors of the Federal Reserve System International Finance Discussion Papers Number 824 January 2005 An Assessment of the Impact of Japanese Foreign Exchange Intervention: 1991-2004 Alain P. Chaboud and Owen F. Humpage NOTE: International Finance Discussion Papers are preliminary materials circulated to stimulate discussion and critical comment. References in publications to International Finance Discussion Papers (other than an acknowledgment that the writer has had access to unpublished material) should be cleared with the author or authors. Recent IFDPs are available on the Web at www.federalreserve.gov/pubs/ifdp/.
Transcript
Board of Governors of the Federal Reserve System
International Finance Discussion Papers
Number 824 January 2005
An Assessment of the Impact of Japanese Foreign Exchange Intervention: 1991-2004
Alain P. Chaboud and Owen F. Humpage
NOTE: International Finance Discussion Papers are preliminary materials circulated to stimulate discussion and critical comment. References in publications to International Finance Discussion Papers (other than an acknowledgment that the writer has had access to unpublished material) should be cleared with the author or authors. Recent IFDPs are available on the Web at www.federalreserve.gov/pubs/ifdp/.
An Assessment of the Impact of Japanese Foreign Exchange Intervention: 1991-2004
Alain P. Chaboud* and Owen F. Humpage**
Abstract: We analyze the short-term price impact of Japanese foreign exchange intervention operations between 1991 and 2004, using official data from Japan’s Ministry of Finance. Over the period as a whole, we find some evidence of a modest “against the wind” effect, but interventions do not have value as a forecast that the exchange rate will move in a direction consistent with the operations. Interventions conducted between 1995 and 2002, which were large and infrequent, met with a much higher degree of success. For the most recent episode of intervention, in 2003 and 2004, despite the record size and frequency of the overall episode, it is difficult to statistically distinguish the pattern of exchange rate movements on intervention days from that of all the days in that particular subperiod, showing little effectiveness. Still, while the evidence of Japanese intervention effectiveness is modest overall, it appears to be stronger than that found using similar techniques for U.S. intervention operations conducted in the 1980s and 1990s. Keywords: Foreign Exchange, Intervention, Japan, JEL Classification: F31, G15
* Division of International Finance, Board of Governors of the Federal Reserve, Washington, D.C., 20551. [email protected] ** (Contact author) Research Department, Federal Reserve Bank of Cleveland, P.O. Box 6387, Cleveland, OH, 44101. [email protected] The authors thank Rasmus Rüfer and Dale Henderson for their helpful comments. The views in this paper are solely the responsibility of the authors and should not be interpreted as reflecting the views of the Board of Governors of the Federal Reserve System or of the Federal Reserve Bank of Cleveland.
Since the early 1990s, the monetary authorities of the major industrialized countries,
with one notable exception, have greatly curtailed their foreign-exchange interventions. That
exception has been Japan, where the Ministry of Finance (MoF), using the Bank of Japan as
its agent, has continued to intervene frequently—and at times massively—in foreign exchange
markets. In the latest episode of intervention, for instance, from January 2003 to March 2004,
the MoF intervened on 126 days, purchasing a total of about $315 billion. The record size
and frequency of Japan’s operations over the past few years afford researchers the opportunity
to reexamine the effectiveness of intervention operations under the current structure of foreign
exchange markets.
Using official MoF data at daily frequency, this paper analyzes the short-term
effectiveness of Japanese foreign exchange intervention operations in the dollar-yen spot
market from April 1991 through March 2004. Generally speaking, we study whether
intervention operations are associated with very specific changes in the distribution of daily
exchange rate movements. We first define several “success” criteria of varying stringency,
each consisting of a pattern of exchange-rate movements that the monetary authority may
wish to attain. Next, following techniques first proposed by Henriksson and Merton (1981)
and Merton (1981) to evaluate the performance of market forecasters, we study whether the
observed frequency of each type of intervention success exceeds the frequency that would
randomly occur in the sample of exchange rate movements under study. In other words, to
use the language of Henriksson and Merton (1981), we examine whether intervention
operations have “forecast value” for the dollar-yen exchange rate. Finally we assess whether
the probability of success depends on specific aspects of the intervention operations,
2
including, among others, their size, their frequency, whether Japan coordinated the operations
with the United States and whether the market anticipated the interventions. Although our
approach is not an investigation of any particular theoretical means through which
intervention might operate, the analysis is compatible with an expectations (or signaling)
channel.
We show that, over our sample as a whole, MoF interventions did not have value as a
forecast that the exchange rate would move in the direction consistent with intervention
operations. However, even though the presence of intervention was therefore a poor predictor
of the direction of exchange rate movements, we also find that it was associated with an
higher-than-expected frequency of moderation in the magnitude of exchange rate movements.
Dollar purchases also had a higher-than-expected frequency of changes in the direction of
daily exchange rate movements. This evidence is generally consistent with a modest
“against-the-wind” effect of Japanese intervention over the 1991-2004 period.
Our study also shows that the nature of the forecast value varied within the sample
period, pointing to different levels of intervention effectiveness for different intervention
strategies. Between June 15, 1995 and December 31, 2002, for instance, a period of large
and infrequent interventions, MoF purchases of dollars had value as a forecast that the dollar
would appreciate, whether or not it had depreciated on the previous day. For the most recent
intervention episode, in 2003 and 2004, we find that, despite the record size and frequency of
the overall episode, it is difficult to statistically distinguish the pattern of exchange rate
movements on intervention days from that of the period as a whole. Finally, we demonstrate
that, over our entire sample, the probability of an intervention scoring a success—defined as
either moving the exchange rate in the desired direction or, if not, at least moderating the
3
exchange rate movement—increases when the operation is large. Intervention operations
coordinated with that of U.S. monetary authorities did meet with that particular definition of
success with a higher frequency than those of the MoF alone over the period, but not high
enough, given the relatively small number of joint operations, to allow us to derive strong
statistical conclusions about their effectiveness.
The paper proceeds as follows. After this introduction, section 2 discusses possible
theoretical connections between official intervention and exchange rate movements, including
some newer, less traditional, concepts. Section 3 briefly reviews some of the recent empirical
literature on Japanese intervention. Section 4 introduces the data on Japanese intervention
since 1991, including an important breakdown into three periods, based on clear differences in
intervention strategy. Section 5 presents our five criteria for assessing the success of
individual intervention operations. Section 6 discusses the testing of MoF intervention
effectiveness under the assumption that individual successes are hypergeometric random
variables; results are presented for the whole sample and for each subperiod. Section 7
presents probit regressions that show how various characteristics of an intervention influence
the probability of success. Here we also consider whether or not the market may have
anticipated a specific intervention. Section 8 summarizes and concludes.
2. Theoretical Channels of Intervention Effectiveness
The traditional theoretical approach to the effectiveness of sterilized intervention has
focused on two avenues of influence, the portfolio-balance channel and the expectations (or
signaling) channel. The portfolio-balance channel builds upon the assumption that investors
may view assets denominated in different currencies as imperfect substitutes. As an
4
intervention operation changes the currency composition of the pool of assets available to
private investors, an exchange rate movement may be required to induce them to hold that
pool. Empirical evidence in favor of a portfolio-balance channel has generally been found to
be weak, although Dominguez and Frankel (1993) is a notable exception. The unprecedented
size of recent Japanese intervention operations, may, however, warrant a new look. The
expectations channel, in contrast, has received a bit more support in past studies. According
to the expectations channel, monetary authorities can use sterilized foreign exchange
intervention to transmit private information to the market, thereby affecting the market
participants’ assessment of the equilibrium rate of exchange (see Baillie, Humpage,
Osterberg, 2000).
New theoretical channels of influence for sterilized foreign exchange intervention
have recently been proposed. One is related to the idea of the well-known Keynesian beauty
contest, in which individuals vote on the contestant that they think is most likely to attract the
most votes from other judges, instead of the contestant that they view as most beautiful (see
Keynes, 1936). In the same vein, an exchange rate could stay misaligned because of
bandwagon effects or collective action problems (see Ramaswamy and Samiei, 2000, and
Sarno and Taylor, 2001.) Under such circumstances, even if most traders felt that the current
level of an exchange rate was inappropriate, no one would be willing to be first to buy or sell
the currency. The behavior of each trader in this setting would be individually rational, and
the misalignment of the exchange rate could persist. Sterilized intervention could provide
departure from this misalignment by offering an opportunity for traders to coordinate toward
the “correct” equilibrium rate. This realignment may occur if central bank intervention
provided a new focal point for the correct exchange rate—perhaps a variant of the signaling
5
channel—or if intervention, particularly repeated intervention, reduced the risks perceived by
traders in making the first move away from the current equilibrium.
Another potential channel of intervention effectiveness at very short horizons is
simply through the immediate impact of the order flow on price. Lyons (2001) discusses this
channel in the context of secret intervention operations. In this context, market makers treat
the appearance of such order flow from a central bank as they would any other sizable order,
with the order flow potentially revealing private information held by their counterparties or
changes in parameters dispersed among market participants, such as the market’s attitude
toward risk. Observing the order flow induces the market makers to adjust their prices,
leading to short term intervention effectiveness. Dominguez (2005) discusses how, in this
order flow framework, trader heterogeneity and the lack of common knowledge may magnify
the impact of foreign exchange interventions.
Whether secret or not, a sizeable central bank intervention would likely affect the
exchange rate, at least in the very short run, even if market makers did not believe that it
revealed private information or that it reflected changing market parameters. Market makers
adjust their prices to protect themselves against the risk of holding a sizeable position for a
period of time. As an intervention pushes the inventory position of market makers further and
further away from neutrality, the compensation that they require grows, and the exchange rate
movement increases. Because of this inventory effect, central bank interventions that are
large enough, all other things equal, should result in an almost mechanical adjustment in
exchange rates, at least temporarily. The size of this adjustment, almost by definition, would
depend on the market’s liquidity at the time of the operations. It is very likely that at least
some of the intervention operations conducted by Japanese authorities over our sample period,
6
particularly after June 1995, were of sufficient size to have temporarily affected the exchange
rate in such a way. Being able to move the exchange rate temporarily by such “brute force”
could then have more permanent effects. One possibility is that, absent a commonly
perceived equilibrium exchange rate, market participants would view the new level of the
exchange rate as a starting point for a new random walk. Moreover, pushing the exchange
rate even temporarily beyond a certain level may lead a number of market participants to
liquidate losing positions, reinforcing the central bank’s action (see Osler, 2003).1
3. Some Recent Empirical Literature on Japanese Intervention
The recent release by Japanese authorities of historical data on foreign exchange
intervention has allowed researchers to begin to study what has clearly been the most active
intervention policy among industrial nations in the past decade. After many years of complete
confidentiality, the MoF released to the public in July 2001 historical data, with currency pair
details, at a daily frequency going back to April 1991. In addition, the MoF now releases
cumulative monthly intervention totals (in yen) at the end of each month, and quarterly
updates of daily intervention data about a month after the end of each quarter.
Takatoshi Ito, fresh from a high-level appointment at Japan’s Ministry of Finance, was
the first researcher to produce work using the newly released data. Ito (2003) provides a well-
informed narrative of Japanese intervention operations from 1991 to 2001, noting changes in
the strategy used by the MoF over the period. The paper then briefly uses several different
1 These are also reasons why the study of the short-term effects of intervention is important, even
though the goal of monetary authorities in intervening is usually a longer-term effect. In any case, it is
difficult to imagine a framework under which long-term intervention “effectiveness” could be
achieved without any type of short term effect.
7
techniques to assess the success and the profitability of Japanese operations over the period.
The author concludes that intervention operations conducted in the second half of the 1990s
often appeared to produce the intended effect on the exchange rate. He also finds that, over
the full sample period, the Japanese authorities made a large profit on their intervention
operations, arising from both exchange rate movements and interest rate differentials. Ito and
Yabu (2004) develop and estimate a complex intervention reaction function for the Japanese
authorities; their specification includes a “political cost” which must be taken into account by
the authorities when deciding whether or not to enter the market. They find that interventions
often came in reaction to large exchange rate movements on the previous days, and that
deviations from a long-term moving average also tended to lead to a decision to intervene.
Fatum and Hutchinson (2003) use an event study methodology to study the
effectiveness of Japanese intervention over the period 1991-2000. They construct
intervention episodes separated by periods of inaction of at least five days, and analyze
exchange rate movements around these episodes. They conclude that evidence of short-term
effectiveness is present, and that effectiveness is boosted by the size of the intervention
episode and by coordination with the Federal Reserve.
Frenkel et. al. (2005) find a positive correlation between official Japanese intervention
and implied volatility derived from options contracts on exchange-rate futures. Their finding
that intervention increases exchange rate volatility is similar to investigations of dollar-yen
volatility that relied on news reports of Japanese intervention (see Bonser-Neal and Tanner
1996, Dominguez 1998). In a market characterized by information imperfections, increased
volatility is often associated with the transmittal of new information; the Frenkel et. al (2005)
8
finding is therefore not necessarily incompatible with intervention having the desired effect
on the level of the exchange rate.
Galati, Melick, and Micu (2005) use MoF intervention data from 1993 to 2000 to
study the effect of intervention on the risk-neutral distribution of future exchange rates, as
derived from option prices. They find no evidence that intervention systematically affected
the mean or higher moments of the distribution of expected exchange rates one month ahead.
4. Japanese Intervention Operations since 1991: the Data
According to official Ministry of Finance data, Japan undertook frequent and, at times,
massive foreign-exchange-market interventions between 1991 and early 2004, most of the
time in a manner consistent with promoting a yen depreciation or limiting a yen appreciation.
Between April 1, 1991 and March 31, 2004, Japanese monetary authorities intervened on 340
days against the U.S. dollar; about 90% of these transactions involved official purchases of
dollars, that is Japanese authorities were more often attempting to counter or slow an
appreciation of the yen (see table 1).2 The intervention amounts ranged from less than $1
million (equivalent) purchase of dollars on November 21, 2003, to an extremely large $20.4
billion (equivalent) sale of dollars on April 10, 1998.3 The median amount of a Japanese
intervention (in absolute terms) was $695 million, but the median dollar purchase ($789
million) was more than three times as large as the median dollar sale ($223 million). On 22
2 Japan undertook eight interventions on U.S. holidays. We rolled these amounts forward to the next
business day. In four of these instances, interventions also took place on the next business day, so we
combined the intervention amounts. 3 The Ministry of Finance data are in yen. We convert daily intervention amounts into dollars using
exchange rate quotes taken at 5:00 p.m. New York time (source: Bloomberg).
9
occasions during our sample period, the United States joined Japan in a coordinated
intervention effort. Unlike Japanese interventions, which often occurred in fairly persistent
strings of activity punctuated with substantial periods of inaction, the coordinated
interventions were usually isolated events. A large majority of these coordinated efforts
(82%) were dollar purchases.
Table 2 presents much of the same data as table 1, but for three subperiods that differ
in the amount, frequency, and persistence of intervention, as well as in the degree of
coordination with the United States. The chosen breaks in the sample also correspond to
personnel changes at the top of the Ministry of Finance’s International Bureau, which bears
responsibility for intervention strategy within the MoF.
The first period, from April 1, 1991 to June 14, 1995 was characterized by frequent,
persistent, and relatively small interventions. Japan intervened on 165 days over the period,
with a median intervention size of $348 million. Eighteen of the 22 joint operations with the
United States occurred during this early period.
Our second period, from June 15, 1995 to December 2002, marks a clear shift in
strategy to large, infrequent interventions. Its beginning coincides with the appointment of
Eisuke Sakakibara as Director General of the International Bureau (see Ito 2003). Between
June 28, 1995 and the end of 2002, the MoF undertook only 49 interventions, including 4
jointly with U.S. authorities. With a median (absolute) size of $3,989 million, these
operations were more than 10 times larger than in the first period. The unconditional
probability of intervention in the second period was 2.6%, substantially below the 18.3%
intervention frequency recorded in the first period. The mean lapse time between
interventions (table 3) rose to 49 days from just 6 days in the first subperiod.
10
MoF intervention operations during our final time period, January 1, 2003, through
March 31, 2004, were exclusively unilateral purchases of dollars. The median amount of an
intervention operation during this last period ($1,753 million) was less than one-half that of
our second period, but still more than 4 times larger than in our first time period. The
unconditional probability of intervention rose substantially, to 40.3%, and the mean lapse time
fell to just 3 days. As a consequence, this period saw what is likely to have been, to date, the
largest overall intervention episode by any monetary authority. The massive effort to prevent
or slow yen appreciation resulted in a substantial increase in Japanese foreign reserves, to
more than $800 billion.
The change of tactic at the beginning of 2003 coincided with the appointment of
Hiroshi Watanabe as Director General of the MoF’s International Bureau. Importantly, the
MoF requested that the Bank of Japan, its agent, modify its usual mode of operation in order
to make its operations more stealthy. According to press reports and to testimony by Japanese
officials, the BoJ, instead of actively conducting foreign exchange trades as it had in most
previous intervention periods, placed confidential standing orders with a limited number of
dealing banks, who then entered the market under their own names to purchases dollars at
agreed-upon levels. As a result, while intervention operations, according to MoF data, began
in mid-January, there were no reports of possible MoF interventions in the financial press
until February.
11
5. Success Criteria
We evaluate the success of each Japanese intervention operation using four specific
criteria and an aggregate criterion that incorporates the first four.
5.1. Appreciate or depreciate the yen.
The first, and most common, success criterion tests whether, when the MoF buys or
sells U.S. dollars, the dollar immediately appreciates or depreciates, respectively, against the
yen. Accordingly, the first success criterion for official purchases of dollars against yen is:
(1) >∆>
= otherwise. 0
and ,0 and ,0 if 11 tt
t
SIbW
The corresponding criterion for official sales of dollars is:
(2) <∆<
= otherwise. 0
and ,0 and ,0 if 11 tt
t
SIsW
In these expressions, It refers to intervention on day t with positive and negative values
indicating purchases or sales of U.S dollars against Japanese yen, respectively. The
exchange-rate change, ∆St, is measured as the difference between today’s closing rate and
yesterday’s closing rate in the New York market, at the end of each trading day (the time of
the change in value date) in foreign exchange markets. Thus, the exchange-rate movement
brackets each U.S. and Japanese intervention, irrespective of whether it took place during
Tokyo, London, or New York trading hours.
5.2. Reversing the direction of the exchange-rate movement.
Our second criterion, a subset of the first, is more stringent. It assumes that when the
MoF intervenes, the yen reverses its recent appreciation or depreciation. Accordingly, an
intervention purchase of dollars against Japanese yen is successful if:
12
(3) <∆>∆>
= −
otherwise. 0 and ,0 and ,0 and ,0 if 1
2 1tttt
SSIbW
An intervention sale of dollars against yen is successful if:
(4) >∆<∆<
= −
otherwise. 0 and ,0 and ,0 and ,0 if 1
2 1tttt
SSIsW
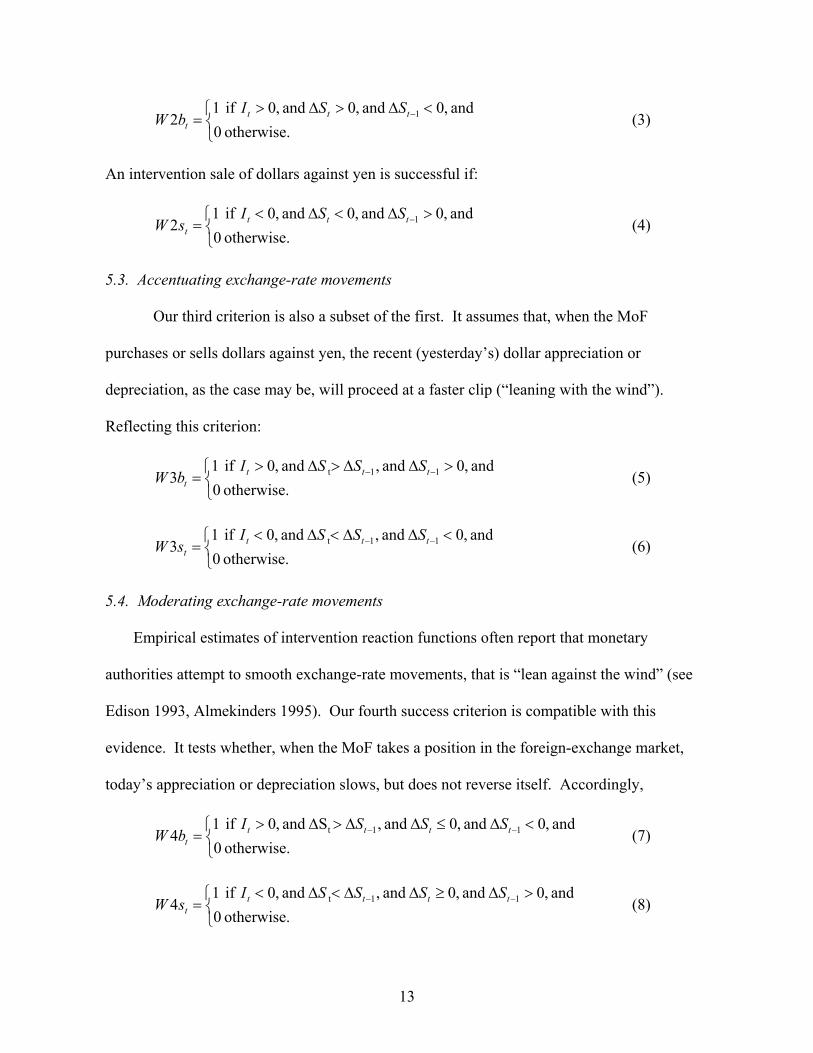
5.3. Accentuating exchange-rate movements
Our third criterion is also a subset of the first. It assumes that, when the MoF
purchases or sells dollars against yen, the recent (yesterday’s) dollar appreciation or
depreciation, as the case may be, will proceed at a faster clip (“leaning with the wind”).
Reflecting this criterion:
(5) >∆∆>∆>
= −−
otherwise. 0 and ,0 and , and ,0 if 1
3 11t tttt
SSSIbW
(6) <∆∆<∆<
= −−
otherwise. 0 and ,0 and , and ,0 if 1
3 11t tttt
SSSIsW
5.4. Moderating exchange-rate movements
Empirical estimates of intervention reaction functions often report that monetary
authorities attempt to smooth exchange-rate movements, that is “lean against the wind” (see
Edison 1993, Almekinders 1995). Our fourth success criterion is compatible with this
evidence. It tests whether, when the MoF takes a position in the foreign-exchange market,
today’s appreciation or depreciation slows, but does not reverse itself. Accordingly,
<∆≤∆∆>∆>
= −−
otherwise. 0 and ,0 and ,0 and ,S and ,0 if 1
4 11t ttttt
SSSIbW (7)
>∆≥∆∆<∆<
= −−
otherwise. 0 and ,0 and ,0 and , and ,0 if 1
4 11t ttttt
SSSSIsW (8)
13
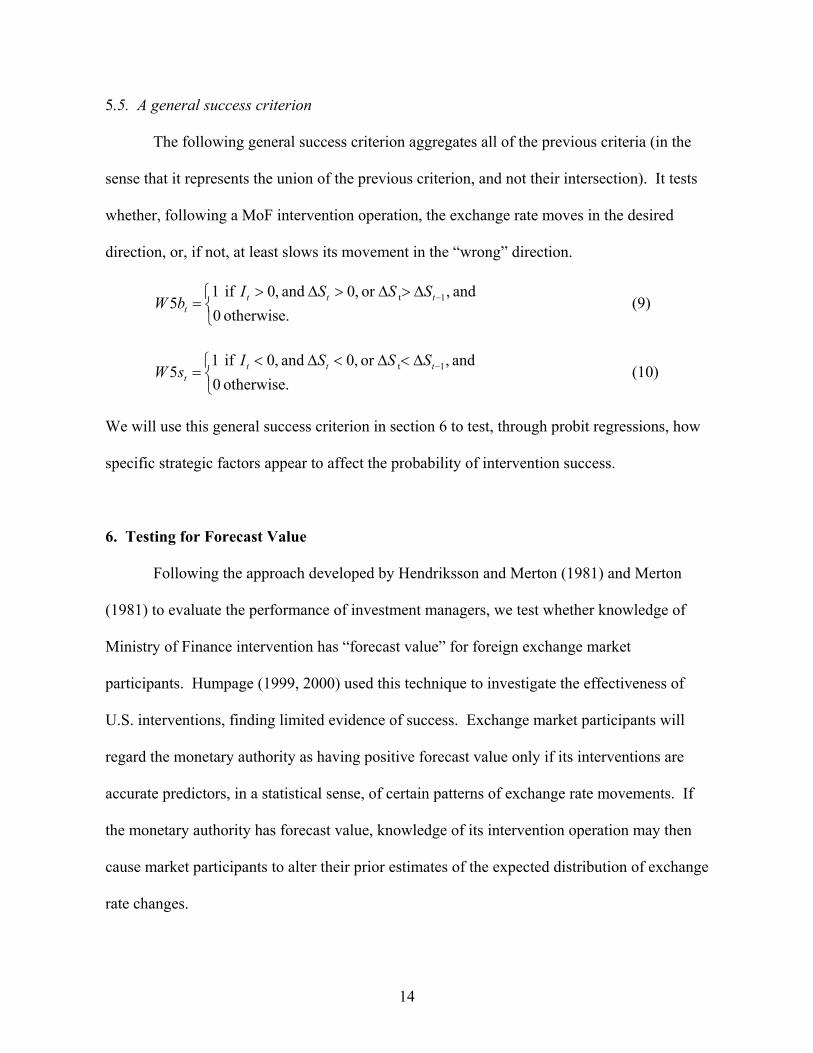
5.5. A general success criterion
The following general success criterion aggregates all of the previous criteria (in the
sense that it represents the union of the previous criterion, and not their intersection). It tests
whether, following a MoF intervention operation, the exchange rate moves in the desired
direction, or, if not, at least slows its movement in the “wrong” direction.
(9) ∆>∆>∆>
= −
otherwise. 0 and ,or ,0 and ,0 if 1
5 1t tttt
SSSIbW
(10) ∆<∆<∆<
= −
otherwise. 0 and ,or ,0 and ,0 if 1
5 1t tttt
SSSIsW
We will use this general success criterion in section 6 to test, through probit regressions, how
specific strategic factors appear to affect the probability of intervention success.
6. Testing for Forecast Value
Following the approach developed by Hendriksson and Merton (1981) and Merton
(1981) to evaluate the performance of investment managers, we test whether knowledge of
Ministry of Finance intervention has “forecast value” for foreign exchange market
participants. Humpage (1999, 2000) used this technique to investigate the effectiveness of
U.S. interventions, finding limited evidence of success. Exchange market participants will
regard the monetary authority as having positive forecast value only if its interventions are
accurate predictors, in a statistical sense, of certain patterns of exchange rate movements. If
the monetary authority has forecast value, knowledge of its intervention operation may then
cause market participants to alter their prior estimates of the expected distribution of exchange
rate changes.
14
The test assumes that Japanese monetary authorities do not directly affect underlying
exchange-rate fundamentals when they intervene. As discussed in Ito (2002), the fact that the
reserves used in intervention operations belong to and accrue to the MoF and not to the Bank
of Japan ensure that intervention operations are automatically fully sterilized in the long run.
In any case, the Bank of Japan routinely acts, if needed, to prevent MoF interventions from
altering even the short-run supply of yen reserves in breach of its monetary policy operating
targets.4
Given the martingale nature of exchange-rate changes, one would expect to observe a
fairly high number of intervention successes merely by chance. To have forecast value, the
frequency with which a particular exchange-rate pattern coincides with an intervention—a
success—must significantly exceed the frequency with which it occurs irrespective of
interventions. If, for example, we knew that the dollar appreciated against the yen on 55
percent of all the trading days in our sample, then finding that 55 percent of all official dollar
purchases were associated with dollar appreciations (a 55 percent frequency of success under
our first criterion) would carry no forecast value.
We evaluate the probability of observing a specific number of successes under the
assumption that their occurrence is a hypergeometric random variable. The hypergeometric
distribution does not require individual events to be independent and does not depend on the
4 Japanese intervention operations have therefore been sterilized under the standard (narrow) definition
of sterilization. It is clear, however, that changes in the monetary policy stance of the BoJ occurred in
the midst of some of the recent episodes of intervention, particularly in 2003. This led some analysts
to call the most recent intervention episode “partially unsterilized,” using a broader, less common,
definition of sterilization. We test for the effects of monetary policy changes on intervention
effectiveness in section 7.
15
presumed probability of an individual success. Our null hypothesis states that the actual
number of successes equals the expected (unconditional) number of successes.
Our results appear in table 4, for the entire sample, and in tables 5 through 7, for each
of our subperiods. The first column of each table lists the success criteria for unilateral MoF
interventions in the top half and for coordinated interventions (if any) in the bottom half. The
second column presents a count of the total interventions by each monetary authority during
the sample period. For example, the second column of table 4 reports that the MoF bought
dollars on 307 days and sold dollars on 33 days between April 1, 1991 and March 31, 2004.
The United States sold yen on 18 days and purchased yen on 4 days in concert with Japan
during the entire sample. Column 3 lists the number of interventions that were successful
according to each of the specific criteria, while column 4 records those successes as a
percentage of the total interventions. For example, of the 307 MoF purchases of dollars in the
entire sample, 140, or 45.6%, were associated with a dollar appreciation against the yen. We
therefore count these 140 as “successful” interventions under the first criterion.
The next two columns in tables 4 through 7, labeled virtual successes, refer to
unconditional exchange-rate movements over the sample period. Column 5 records the
number of times that the exchange rate moved in conformity with the corresponding success
criterion, whether or not intervention took place. As shown in table 4, between April 1, 1991
and March 31, 2004, the dollar appreciated on 1616 days, including days with and without
official interventions. Column 6 expresses the data in column 5 as a percentage of the total
observations in the relevant sample period. In our case, the dollar appreciated nearly half of
the time over the whole sample; it was unchanged about 1 percent of the time.
16
The three rightmost columns relate to the hypergeometric distribution. Columns 7 and
8 show the expected number of successes under each criterion and its standard deviation
given the particular sample size (either the whole sample or each of our three subperiods).
Column 9 reports the p-value associated with rejecting the null hypothesis that the observed
number of successes is equal to the expected number of successes. In other words, column 9
shows the p-value associated with a one sided test that, under a hypergeometric distribution
based on the unconditional frequencies of each sample period, the conditional frequency of
success exceeds the unconditional frequency of success.
6.1. The Whole Sample: April 1, 1991 to March 31, 2004 (Table 4)
Table 4 shows that, over the whole sample, the frequency with which, conditional on
there being an intervention, the dollar moved in the direction consistent with each intervention
operation (up for purchases or down for sales of dollars) was about 45%. Overall, on an
unconditional basis, the dollar appreciated or depreciated almost 50% of the time. Therefore,
MoF interventions clearly did not have forecast value with respect to signaling that the
exchange rate would move in the direction of the intervention. However, of the 140 times
when the dollar appreciated on the day of an official purchase of dollars, 92 of those came on
a day following a depreciation of the dollar, a higher frequency of change in direction than
would have been expected on an unconditional basis. With a p-value of about 0.02, MoF
purchases, despite their lack of overall predictive power about the direction of exchange rate
movements, therefore had forecast value that the frequency of a change in the direction of
movements would exceed the unconditional frequency.
Interventions also had forecast value over our entire sample period that exchange rate
movements, if they continued to move in a direction not consistent with an intervention
17
operation, would at least moderate, an “against the wind” effect. Over our sample of 3,268
business days, we would expect to find that 36.2 out of 307 official dollar purchases were
associated with a moderating dollar depreciation. Similarly, we would expect randomly to
find that 4.0 out of 33 dollar sales were associated with a moderating dollar appreciation.
Instead, the actual numbers of successes (56 and 6, respectively) are significantly greater than
the anticipated amounts, with p-values of 0.000 and 0.099, respectively. MoF intervention
then had value as a forecast that dollar movements would moderate on the day of the
intervention relative to their movements on the previous day.
As for our general success criterion (the exchange rate moving in a direction
consistent with the intervention operation or, if not, a moderation in the exchange rate
movement), we find that the criterion was met 196 times out of 307 intervention purchases of
dollars. However, based on the unconditional frequency of success, we would have expected
to find that pattern on 188 occasions, almost as many. Therefore, with a p-value of about
0.15, we cannot claim, within standard statistical significance levels, that MoF intervention
operations had forecast value under our general success criterion.
For intervention operations coordinated with U.S. monetary authorities (18 purchases
and 4 sales of dollars over the sample), we note that the frequency with which coordinated
interventions were associated with exchange rate movements in a direction consistent with the
operation (our first criterion) exceeds what a random draw would have predicted and what we
found for interventions by the MoF alone. Also, out of 22 coordinated intervention
operations, 17 meet our general success criterion, exceeding both the expected unconditional
frequency and the frequency found for uncoordinated interventions. However, because Japan
and the United States undertook coordinated interventions on only 22 days, the small sample
18
size does not permit us to draw strong statistical conclusions about the importance of
coordination. Although we cannot proclaim that coordination has, strictly speaking, forecast
value, we nevertheless interpret these results as offering tentative evidence that coordinated
intervention was somewhat more effective that uncoordinated intervention.
6.2. April 1, 1991 to June 14, 1995 (Table 5)
As we have described, between April 1, 1991 and June 14, 1995, Japanese
interventions were frequent, relatively small in size, and likely to proceed in long strings.
During this first subperiod, MoF interventions, both purchases and sales of dollars, had value
only as a forecast that the previous day’s dollar movements would moderate. Out of 138
Japanese purchases of dollars, the pace of the previous day’s dollar depreciation slowed, but
did not reverse, on 28 occasions on the current day. This count was substantially greater than
the expected 18.3, yielding a very small p-value from the relevant hypergeometric
distribution. Similarly, of the 27 official dollar sales, 5 successfully predicted that the
previous day’s dollar appreciation would moderate over the current day, above the 2.8
successes that we would expect to occur randomly. However, relative to our first success
criterion, the dollar-yen exchange rate moved in a direction consistent with the intervention
operations with a lower frequency than that expected from a random draw. As for our general
success criterion, it was met on intervention days with a frequency a bit lower or very close to
that found in the subperiod as a whole.
The number of coordinated interventions over this period—15 dollar purchases and 3 dollar
sales—is too small to draw firm statistical inferences about the value of joint interventions.
We note, however, that the frequency of “general success” for coordinated interventions
19
exceeds what a random draw would have predicted, clearly better than for unilateral Japanese
interventions.
6.3. June 15, 1995 to December 31, 2002 (Table 6)
The results for the second period, June 15, 1995 to December 31, 2002, when MoF
intervention grew much larger but became far less frequent, were dramatically different than
those for the first period. Of the 43 official MoF purchases of dollars—the dominant type of
intervention—33 (76.7%) successfully “predicted” that the dollar would appreciate on the
current day. We would have randomly expected only 22.3 such successes in our sample,
yielding clear statistical significance, an obvious contrast to our first subperiod. Of these 33
successes, 22 were a reversal of the previous day’s depreciation, a substantially greater count
than the expected number (10.8). The frequency of success under our general success
criterion (83.7 percent) is also well above that seen in the whole sample (62.1%), yielding a
very small p-value. All in all, therefore, the MoF’s intervention operations during this period
appeared to be far more effective than those of our first subperiod and had clear forecast value
of exchange rate movement in a direction consistent with the operation. The 4 instances of
intervention coordinated with the USA met with success under our general criterion.
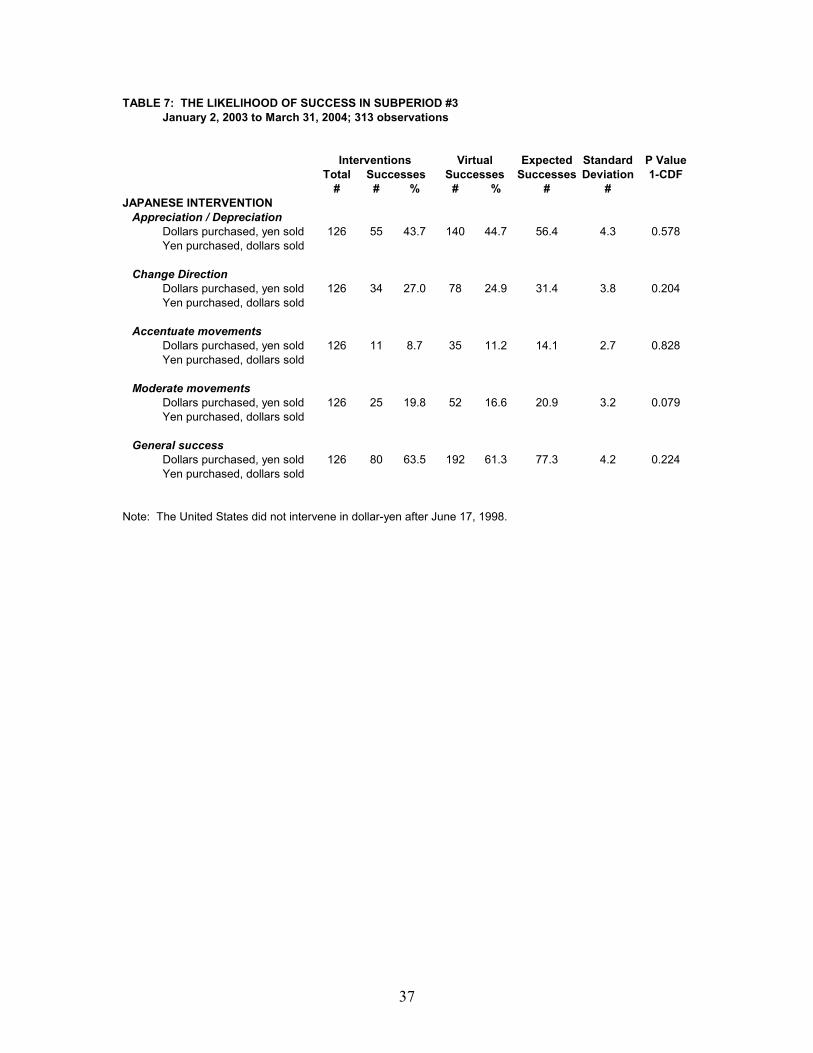
6.4. January 1, 2003 to March 31, 2004 (Table 7)
During the last 15 months of our study, the MoF conducted only purchases of dollar,
none of which were coordinated with the United States. As described above, the operations
remained large and their frequency and persistence increase substantially. For this last
subperiod, however, we find that these interventions purchases of dollar generally did not
have a high rate of success, based on any of our criteria. Only under our third success
criterion (moderating movements) can we reasonably claim to have uncovered some forecast
20
value, with a p-value of about 0.08. Our general success criterion is fulfilled on 80 occasions
out of 126 intervention operations, barely above the 77.3 expected on an unconditional basis.
Based on this analysis, therefore, the most recent period of Japanese intervention, despite its
unprecedented magnitude, does not appear to have met with a high level of success.
It is not unlikely, however, that the intervention strategy apparently followed by the
Ministry of Finance for much of 2003 and 2004 may have rendered the detection of the
impact of intervention more difficult. Market commentary reported at the time that the MoF
appeared to have given instructions to buy dollars if the exchange rate declined to certain
levels (with these levels varying over time). However, the MoF reportedly often did not
appear to have instructed the dealers to attempt to move the exchange rate substantially up
from those levels. As a result, the dollar-yen exchange rate, during periods of intervention,
often seemed to remain very near a given floor and showed little net movement. Under these
circumstances, assessing the impact of foreign exchange intervention without a good
counterfactual model of exchange rate movements (which, of course, does not exist) would be
particularly difficult.
7. Factors affecting Intervention Success
We now consider whether a number of contemporaneous factors influenced the
probability of an intervention’s outcome over our entire sample. As we cannot presume to
know which of the success criteria was used by the MoF in judging the effectiveness of its
own operations (and that choice likely changed over time), we use the general success
criterion, the union of the other criteria discussed in section 4, to assess the success of each
intervention operation. The probit regressions in section 7.2 are then based on the list of
21
“successes” and “failures” derived under this criterion. We start by testing whether
unanticipated interventions are more successful under this general criterion than anticipated
interventions. We then proceed to consider a number of other variables that might affect the
flow of information or that control for other policy actions. We show that the size of an
official transaction appears to significantly affect the probability of its success.
7.1. Expected Interventions
The effect of policy changes on financial variables often depends on whether or not
market participants correctly anticipated the official actions. To see if unanticipated
interventions had a higher frequency of success than anticipated interventions, we first used
probit regression to calculate the day-to-day probability of an intervention’s occurrence over
the entire sample period (see Frenkel, et. al. 2005). We conditioned these probabilities on two
variables. First, since interventions very often occur in strings of activity, we included lagged
interventions into the regressions. Second, we included the difference between the actual yen-
dollar exchange rate on the day prior to an intervention and the sample median (¥117.5). This
allows us to proxy for most target ranges that the MoF might have adopted without guessing
as to possible values (see Ito 2001 and Frenkel, et. al. 2005).
Table 8 contains our estimated probit regressions for intervention sales and purchases
of dollars. T-statistics appear below the relevant coefficients. No more than two lags on the
interventions were significant in either regression. Deviations from the median, lagged one
day, were significant in both equations.
We use these fitted equations to calculate the probabilities of intervention for each day
in the sample period. We then use the estimated probabilities in the regressions below to see
if anticipated interventions had a different effect on the probability of success than
22
unanticipated interventions, combining the results for dollar purchases and sales by creating a
single dummy variable that equals one on any day for which the predicted probability of an
intervention is greater than 50%.
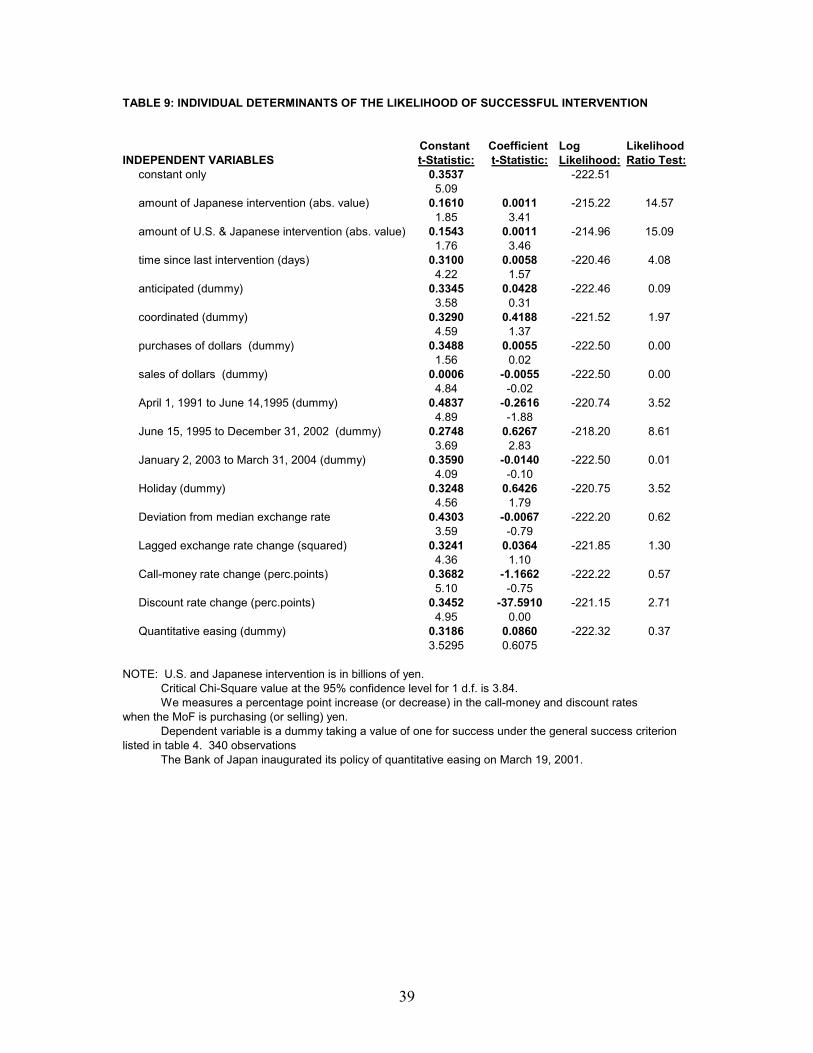
7.2. The Likelihood of Success
How and when the MoF undertakes an intervention is likely to have some bearing on
its ability to affect market expectations about near-term yen movements. Using probit
regressions, we investigate the individual influence of sixteen variables on the likelihood of
scoring a success according to our general criterion. We start by combining the success
counts for official purchases and sales of dollars into a single bivariate independent variable
containing 340 observations. Of these, 217, or 64%, were successful under the general success
criterion, which is a bit higher than the unconditional frequency of success (61%) observed
over the entire sample period (see table 4). We regress the bivariate success variable on the
sixteen individual explanatory variables listed in the first column of table 9. The next two
columns of table 9 present the estimated parameters from the probit regressions of the
bivariate success variable on each of the individual explanatory variable. Corresponding t-
statistics appear under each coefficient. The likelihood function and the likelihood ratio test
statistic appear the final two columns of table 9.
Only a few of the variables have individual explanatory power at commonly-accepted
significance levels. First, the probability of an intervention scoring a success increases with
the size of the intervention, whether this is a unilateral intervention or the combined amount
of a coordinated intervention. In an expectations framework, large interventions may be seen
as evidence by market participants that the MoF maintains a higher than usual degree of
confidence in its near-term outlook for the yen. We also see that the dummy variable for our
23
second subperiod (1995-2002) is strongly positive and significant, while the dummy variable
for the first period (1991-1995) is negative, confirming our earlier results. We find positive
effects, but not clearly statistically significant, for the time elapsed since the previous
intervention, coordination with the United States, and intervention by the MoF on a holiday in
U.S. financial markets. The predicted probabilities of an intervention—our proxy for the
likelihood that the market anticipated the action—had no apparent bearing on the chances of
success. Although, as we saw previously, the level of deviation in the exchange rate from its
median helped predict the likelihood of an intervention, it has little apparent bearing on the
probability of success.
The last two variables in table 9 control for developments in money markets—we use
changes in the call-money rate (a market rate) and changes in the Bank of Japan’s discount
rate—that could have affected exchange rates independent of an intervention. We configured
the changes in the two interest rates to correspond with the direction of the interventions. For
Japanese purchases (sales) of dollars, we enter either the percentage point decline (increase)
in an interest rate or zero on the belief that only corresponding changes would contribute to
success. We find, however, that neither variable is statistically significant. We also included
a dummy variable equal to one during the Bank of Japan’s quantitative easing period (March
19, 2001 through March 31, 2004). The dummy variable was not significant, indicating that
this change in policy operations had no obvious statistical impact on the effectiveness of MoF
interventions.
Next, we consider the joint significance of several of the variables that appeared to
have some effect on the probability of intervention success. Table 10 records the results for
five probit regressions containing various combinations of the variables that appear in the first
24
column: the size of MoF intervention, whether or not the operation was coordinated with the
United States, the time elapsed since the last intervention, and a dummy for the 1995-2002
period. We consistently find again that the probability of success under the general success
criterion increases with the amount of a MoF intervention. The time elapsed since the
previous intervention and the dummy for coordinated interventions are not statistically
significant once the amount of intervention is included in the regression, while coordination
with the United States appears to bring a marginal amount of explanatory power. The dummy
variable for the second time period seems to be somewhat collinear with the amount of
intervention, showing lower statistical significance in a joint regression relative to the
individual regression. This is not surprising given that large, infrequent interventions are the
hallmark of the second time period.
8. Conclusions
In contrast to the other major industrial nations, Japan has continued to intervene
frequently in foreign exchange markets since the mid 1990s. In particular, the most recent
episode of intervention, in 2003 and early 2004, was notable for the large size and high
frequency of its operations. Using official intervention data from Japan’s Ministry of
Finance, and applying a set of tools developed by Humpage (1999, 2000) to study the impact
of U.S intervention operations, we have studied the short-term effectiveness of Japanese
intervention since 1991. We find that, for the sample as a whole, Japanese intervention
operations had little predictive power as to the daily direction of exchange rate movements.
In other words, to use the language of Henrikson and Merton (1981), Japanese operations
over the period had no forecast value relative to the sign of daily dollar-yen exchange rate
25
movements. However, consistent with an “against-the-wind” effect of intervention we find
that Japanese intervention operations between 1991 and 2004 were associated with a
substantially higher-than-expected frequency of both moderation and reversals in daily
exchange rate movements, and therefore had forecast value relative to these two types of
events.
The impact of Japanese intervention operations varied over time and appeared to be
affected by the strategy used by the Ministry of Finance. In particular, intervention operations
conducted between June 1995 and December 2002, which tended to be extremely large and
relatively infrequent, had, in contrast to the sample as a whole, clear forecast value relative to
the direction of exchange rate movements. As for the intervention episode of 2003 and 2004,
despite the high number of data points and the large size of the operations, we are unable to
statistically detect a clear impact on exchange rate movements associated with these
intervention operations. We caution, however, that the tactics employed by the Japanese
Ministry of Finance during this latest episode of intervention may have made detection of any
impact more difficult.
We find that intervention operations conducted in coordination with those of U.S.
monetary authorities, which occurred mainly in the early part of our sample period, met with a
slightly higher frequency of success under several of our criteria than those of the Japanese
authorities alone. The relatively small number of joint operations since 1991 does not allow
us, however, to draw strong statistical conclusions as to their overall effectiveness. Of the
numerous factors that we consider in explaining intervention effectiveness, only the size of an
intervention operation has a clear, undeniable effect on its probability of success. The time
26
elapsed since another intervention operation and whether or not the operation was coordinated
with the United States also appear to have some explanatory power for success.
Our findings are consistent with the conclusion that, for the period 1991-2004 as a
whole, Japanese foreign exchange interventions had a modest, but clearly detectable, impact,
on short-term movements in the dollar-yen exchange rate. In addition, the large and rather
infrequent operations conducted between mid-1995 and the end of 2002 met with a higher
degree of success under several of our criteria. These findings, although still modest, are
more favorable to the effectiveness of intervention than much of the previous work based on
U.S. intervention operations only.
27
References
Almekinders, G. J., 1995. Foreign exchange intervention: theory and evidence. Elgar,
Brookfield, Vt.
Baillie, R. T., Humpage, O.F., Osterberg W.P., 2000. Intervention from an information
perspective. Journal of International Financial Markets, Institutions, and Money 10,
407-422.
Bonser-Neal, C., and Tanner, G., 1996. Central bank intervention and the volatility of foreign
exchange rates: evidence from the options market. Journal of International Money and
Finance 15 (6), 853-878.
Dominguez, K., 2005. When do central bank interventions influence intra-daily and longer-
term exchange rate movements?" Journal of International Money and Finance,
forthcoming
Dominguez, K. M., 1998. Central bank intervention and exchange rate volatility. Journal of
International Money and Finance 18, 161-190.
Dominguez, K., Frankel, J., 1993. Does foreign exchange intervention matter? The portfolio
effect. American Economic Review 83, 1356-1369.
Edison, H., 1993. The effectiveness of central bank intervention: a survey of the literature
after 1982. Princeton University, Special Papers in International Economics, No. 18.
Fatum, R., Hutchison, M. M., 2003. Effectiveness of official daily foreign-exchange-market
intervention operations in Japan. NBER Working Paper 9648.
Frenkel, M., Pierdzioch, C. Stadtmann, G., 2005. The effects of Japanese foreign exchange
market intervention on the yen/U.S. dollar exchange rate volatility. International
Review of Economics and Finance 14, 27-40.
28
Galati, G., Melick, W., and Micu, M., 2005. Foreign-exchange market intervention and
expectations: an empirical study of the dollar/yen exchange rate. Journal of
International Money and Finance, forthcoming.
Henriksson, R. D., Merton, R.C., 1981. On market timing and investment performance. II.
Statistical procedures for evaluating forecasting skills. Journal of Business 54, 513-
533.
Humpage, O.F., 2000. The United States as an informed foreign-exchange speculator. Journal
of International Financial Markets, Institutions, and Money 10, 287-302.
Humpage, O.F., 1999. U.S. intervention: assessing the probability of success. Journal of
Money, Credit, and Banking 31, 731-747.
Ito, T., 2002. Is foreign exchange intervention effective?: the Japanese experiences in the
1990s. NBER Working Paper 8914.
Ito, T. Yabu, T., 2002. What promotes Japan to intervene in the forex market? A new
approach to a reaction function. NBER Working Paper 10456.
Keynes, J.M., 1936. The general theory of interest, employment and money. London:
Macmillan.
Lyons, R. K., 2001. The microstructure approach to exchange rates. Cambridge, MA: The
MIT Press.
Merton, R. C., 1981. On market timing and investment performance. I. An equilibrium theory
of value for market forecasts. Journal of Business 54, 363-406.
Osler, C., 2003. Currency orders and exchange rate dynamics: an explanation for the
predictive success of technical analysis. Journal of Finance, October, 1791-1819.
29
Ramaswamy, R., Samiei, H., 2000. The yen-dollar rate: have interventions mattered? IMF
Working Paper 00/95.
Sarno, L., Taylor, M., 2001. Official intervention in the foreign-exchange market: is it
effective and, if so, how does it work? Journal of Economic Literature 39, 839-868.
30
TABLE 1: INTERVENTION STATISTICS AND COUNTSApril 1, 1991 to March 31, 2004; 3268 observations
Count Average Median St. Dev Max Min Japan interventions (in millions of dollars)
Yen purchased, dollars sold 33 $1,145 $223 $3,594 $20,366 $25Dollars purchased, yen sold 307 1880 789 2551 15604 <1Total (absolute value) 340 1809 695 2672 20366 <1No interventions 2928
Japan interventions (in billions of yen)Yen purchased, dollars sold 33 ¥148 ¥29 ¥462 ¥2620 ¥3Dollars purchased, yen sold 307 207 84 284 1666 <1Total (absolute value) 340 201 72 305 2620 <1No interventions 2928
Coordinated U.S. interventions (in millions of dollars)
Yen purchased, dollars sold 4 $258 $75 $384 $833 $50Dollars purchased, yen sold 18 408 372 188 800 165Total 22 381 352 230 833 50No interventions 3246
Japan interventions (in millions of dollars)Yen purchased, dollars sold 4 $609 $348 $762 $1,691 $49Dollars purchased, yen sold 18 1101 657 1614 7411 161Total 22 1012 621 1493 7411 49No interventions 3246
Combined interventions (in millions of dollars)Yen purchased, dollars sold 4 $868 $423 $1,130 $2,524 $99Dollars purchased, yen sold 18 1509 1052 1672 7911 326Total 22 1392 1002 1584 7911 99No interventions 3246
NOTE: 2 observations lost to 1st differencing and lags.
31
TABLE 2: INTERVENTION STATISTICS AND COUNTS BY SUBPERIODok
APRIL 1, 1991 to JUNE 14, 1995 Count Average Median St. Dev Max Min Japan interventions (in millions of dollars)
Yen purchased, dollars sold 27 $223 $151 $155 $598 $25Dollars purchased, yen sold 138 514 388 490 3915 45Total (absolute value) 165 466 348 465 3915 25No interventions 893
U.S. interventions (in millions of dollars)Yen purchased, dollars sold 3 $67 $50 $29 $100 $50Dollars purchased, yen sold 15 414 374 202 800 165Total 18 356 335 227 800 50No interventions 1040
Combined interventions (in millions of dollars)Yen purchased, dollars sold 3 $315 $199 $292 $648 $99Dollars purchased, yen sold 15 1164 1101 533 2212 326Total 18 1022 927 591 2212 99No interventions 1040
June 15, 1995 to December 31, 2002 Japan interventions (in millions of dollars)
Yen purchased, dollars sold 6 $5,296 $1,948 $7,567 $20,366 $595Dollars purchased, yen sold 43 4456 4018 3148 13207 496Total (absolute value) 49 4559 3989 3835 20366 496No interventions 1848
U.S. interventions (in millions of dollars)Yen purchased, dollars sold 1 $833 $833 $0 $833 $833Dollars purchased, yen sold 3 378 333 107 500 300Total 4 492 417 244 833 300No interventions 1893
Combined interventions (in millions of dollars)Yen purchased, dollars sold 1 $2,524 $2,524 $0 $2,524 $2,524Dollars purchased, yen sold 3 3236 1001 4050 7911 796Total 4 3056 1762 3326 7911 796No interventions 1893
January 2, 2003 to March 31, 2004 Japan interventions (in millions of dollars)
Yen purchased, dollars sold 0 $0 $0 $0 $0 $0Dollars purchased, yen sold 126 2498 1753 2758 15604 <1Total (absolute value) 126 2498 1753 2758 15604 <1No interventions 187
NOTE: In first subperiod, two observations are lost to differencing and lags.
32
TABLE 3: FREQUENCY AND PERSISTENCE OF INTERVENTIONS
PROBABILITIES OF INTERVENTION CONDITIONAL ON DAYS OF CONSECUTIVE INTERVENTIONNumber of interventions in a row
April 1, 1991 to Mar. 31, 2004 1 2 3 4 8 12 16Japanese dollar sales 1.0% 0.3% 0.1% 0% 0% 0% 0%
Japanese dollar purchases 9.4% 6.2% 4.6% 3.3% 1.1% 0.3% 0.0%
April 1, 1991 to June 14, 1995 1 2 3 4 8 12 16Japanese dollar sales 2.6% 0.6% 0% 0% 0% 0% 0%
Japanese dollar purchases 13.0% 9.0% 6.3% 4.3% 0.9% 0.5% 0.1%
June 15, 1995 to Dec. 31, 2002 1 2 3 4 8 12 16Japanese dollar sales 0.3% 0.2% 0.1% 0% 0% 0% 0%
Japanese dollar purchases 2.3% 0.5% 0.2% 0.1% 0% 0% 0%
Jan. 2, 2003 to Mar. 31, 2004 1 2 3 4 8 12 16Japanese dollar sales 0% 0% 0% 0% 0% 0% 0%
Japanese dollar purchases 40.3% 31.6% 25.2% 20.1% 8.6% 1.9% 0%
DAYS SINCE LAST INTERVENTIONmean mode max.
April 1, 1991 to Mar. 31, 2004 10 1 455April 1, 1991 to June 14, 1995 6 1 160
June 15, 1995 to Dec. 31, 2002 49 1 455 Jan. 2, 2003 to Dec. 31, 2004 3 1 136
Note: Zero entry with a decimal point indicates a small number.
33
TABLE 4: THE LIKELIHOOD OF SUCCESS April 1, 1991 to March 31, 2004; 3268 observations
Expected Standard P ValueTotal Successes Deviation 1-CDF
NOTE: U.S. and Japanese intervention is in billions of yen. Critical Chi-Square value at the 95% confidence level for 1 d.f. is 3.84. We measures a percentage point increase (or decrease) in the call-money and discount rates when the MoF is purchasing (or selling) yen. Dependent variable is a dummy taking a value of one for success under the general success criterion listed in table 4. 340 observations The Bank of Japan inaugurated its policy of quantitative easing on March 19, 2001.
39
40
TABLE 10: COMBINED DETERMINANTS OF THE LIKELIHOOD OF SUCCESSFUL INTERVENTION
1.69 1.65Time since last intervention (days) 0.0053 0.0051
1.41 1.37June 15, 1995 to December 31, 2002 (dummy) 0.3627
1.49
Log Likelihood -215.22 -213.71 -213.63 -212.21 -214.09Likelihood Ratio Test (against constant only) 14.57 17.60 17.75 20.60 16.83Likelihood Ratio Test (one less) 3.02 3.18 3.00 2.26
5% p-valueCritical Chi-Square value 1 d.f. 3.84Critical Chi-Square value 2 d.f. 5.99Critical Chi-Square value 3 d.f. 7.81
Note: Intervention is in billions of yen. Likelihood Ratio Test (one less) is a test of an equation against an equation with one fewer regressor. In cases of multiple possible comparisons, we report the highest LR test. Dependent variable is a dummy taking a value of one for success under the general success criterionlisted in table 4. 340 observations.