+ All Categories
Home > Documents > An Assessment of the Potential Impacts of Emerald Ash Borer … · 2020-01-22 · An Assessment of...

An Assessment of the Potential Impacts of Emerald Ash Borer … · 2020-01-22 · An Assessment of...

Date post: 22-Apr-2020
Category:
Upload: others
View: 3 times
Download: 0 times
Share this document with a friend
86
An Assessment of the Potential Impacts of Emerald Ash Borer (Agrilus planipennis Fairmaire) on Virginia’s Municipal Street Trees G. Tyler Wright Thesis submitted to the faculty of the Virginia Polytechnic Institute and State University in partial fulfillment of the requirements for the degree of Master of Science in Forestry P. Eric Wiseman, Chair Susan D. Day Scott M. Salom July 22, 2011 Blacksburg, Virginia Keywords: exotic pests, tree inventory, urban forest, urban forestry Copyright 2011, G. Tyler Wright
Transcript

An Assessment of the Potential Impacts of

Emerald Ash Borer (Agrilus planipennis Fairmaire) on

Virginia’s Municipal Street Trees

G. Tyler Wright

Thesis submitted to the faculty of the

Virginia Polytechnic Institute and State University

in partial fulfillment of the requirements for the degree of

Master of Science

in

Forestry

P. Eric Wiseman, Chair

Susan D. Day

Scott M. Salom

July 22, 2011

Blacksburg, Virginia

Keywords: exotic pests, tree inventory, urban forest, urban forestry

Copyright 2011, G. Tyler Wright

An Assessment of the Potential Impacts of

Emerald Ash Borer (Agrilus planipennis Fairmaire) on

Virginia’s Municipal Street Trees

G. Tyler Wright

ABSTRACT

Emerald ash borer (Agrilus planipennis Fairmaire) (EAB) is an invasive, wood-boring

beetle (Coleoptera: Buprestidae) introduced unintentionally to the United States from East Asia

that infests and eventually kills native ash trees (Fraxinus spp.). First detected near Detroit,

Michigan in 2002, EAB had spread to fifteen U.S. states by 2011, killing an estimated 50 million

ash trees along the way. EAB was first discovered in Virginia in 2003 and re-infested the state

in 2008, raising concerns over impacts that the invasive pest might have on municipal urban

forests and street trees. Despite these concerns, little is known about native ash abundance in

Virginia‘s urban forests; as a result, potential EAB impacts have been difficult to project. In this

study, street tree assessments were conducted in fourteen Virginia municipalities using i-Tree

Streets®, which is a software program developed by the U.S. Forest Service that uses field

inventory data to estimate street tree abundance and composition along with the quantity and

monetary worth of functional benefits provided by these street trees. In addition to estimating

potential losses of functional benefits provided by native ash street trees, information obtained

from Virginia Dept. of Transportation was used to estimate the potential cost of removing these

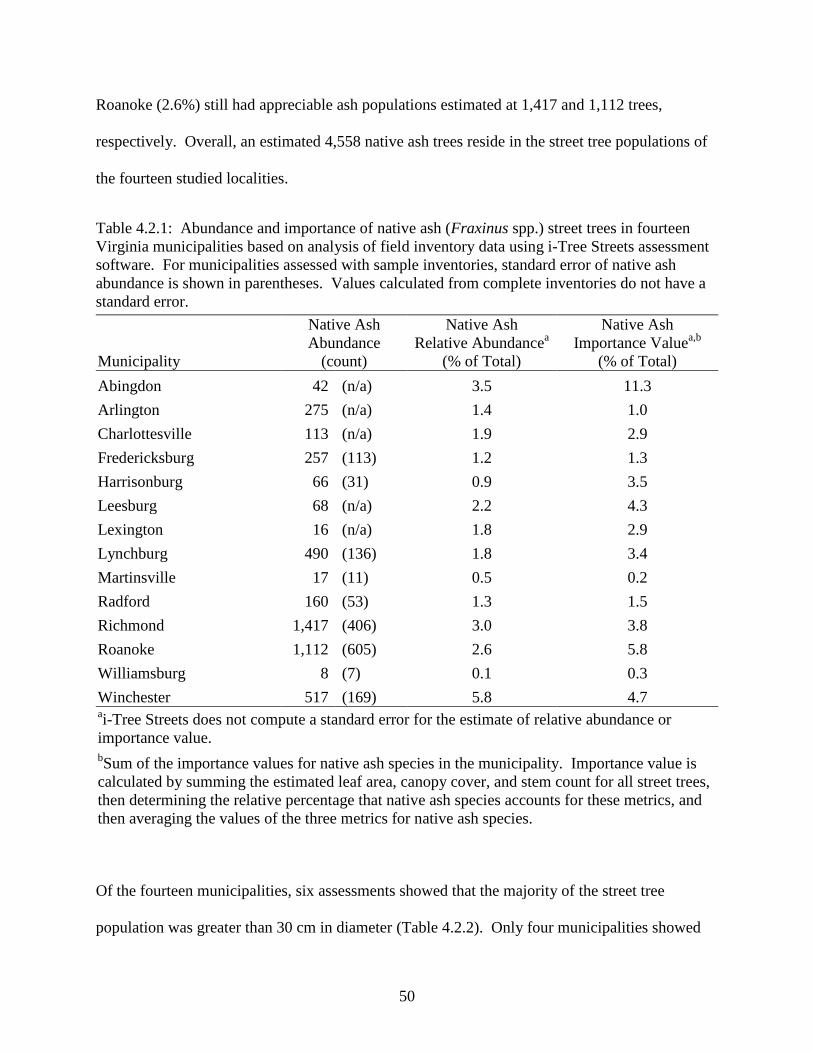
trees from the street side. The assessment indicated that there are about 4,600 native ash street

trees in the fourteen studied localities and that native ash species comprise about 2% of

municipal street tree populations on average. The highest relative abundance of native ash was

found in Winchester City (5.8% of all street trees) whereas Richmond City had the greatest

number of native ash street trees (estimated at 1,417). In terms of species importance (which

accounts for both the relative abundance and relative size of trees in the population), only two

localities (City of Roanoke and Town of Abingdon) had a native Fraxinus species among the

top-five most important street tree species in the locality. In contrast, every municipality had at

least one Acer species among the top-five, and eight of fourteen localities had at least one top-

five Quercus species. Native ash street trees in the studied localities were estimated to provide

functional benefits (energy conservation, stormwater mitigation, air pollution abatement, carbon

sequestration, and aesthetic contributions) valued at over $535,000 annually, or roughly $38,000

per locality. In addition, carbon stored in these trees (about 17 million kilograms) was valued at

nearly $277 thousand. The total estimated cost of removing lost ash trees was estimated at

nearly $1.75 million, averaging about $124,000 for each municipality, and replacing the canopy

cover and basal area provided by existing native ash street trees would exceed $17 million. In

total, the studied localities would incur a gross financial impact of about $20.26 million due to

losses of functional benefits and structural assets provided by native ash street trees.

iii

ACKNOWLEDGEMENTS

First, I would like to give a special thank you to my committee chair and advisor, Dr. P. Eric

Wiseman, and subsequent appreciation to my committee members, Dr. Scott Salom and Dr.

Susan Day, for their support and expertise throughout this degree. Dr. Wiseman, I would like to

personally thank you for allowing me to study under your tutelage and watchful eye. Also, many

thanks go to the Department of Forest Resources and Environmental Conservation at Virginia

Tech. Thank you for providing me with a Graduate Research Assistantship. It has been my

pleasure to work with some of the brightest minds in forestry over the last few years.

Thanks is also necessary to the Davey Resource Group, the USDA Forest Service, and the VA

Department of Forestry for providing me with software necessary for data collection and funding

this project. I also need to express gratitude to the GIS coordinators, city arborists and

horticulturists, and other employees from municipalities that were contacted to provide data. Jen

McKee, John Peterson, Jeannette Hoffman, Mason Patterson, and John Pancake have earned my

respect and gracious appreciation for being a part of the VT EAB Team.

Lastly, I need to thank my family. Mom, thank you for believing in me. Dad, thank you for

your support. Siblings, thank you for your encouragement. I would never have been able to

finish this degree if it were not for your continual generosity and spoken love.

A most gracious THANK YOU is awarded to all those involved in this project. We were able to

make this project a success, due in part to everyone‘s expertise, eagerness to work, and respect.

iv

TABLE OF CONTENTS

LIST OF FIGURES ...................................................................................................................... v

LIST OF TABLES ....................................................................................................................... vi

CHAPTER 1 – INTRODUCTION .............................................................................................. 1

CHAPTER 2 – LITERATURE REVIEW .................................................................................. 6 2.1 The Urban Forest .......................................................................................................... 6 2.2 Emerald Ash Borer ..................................................................................................... 16 2.3 Street Tree Assessment and i-Tree Streets.................................................................. 22

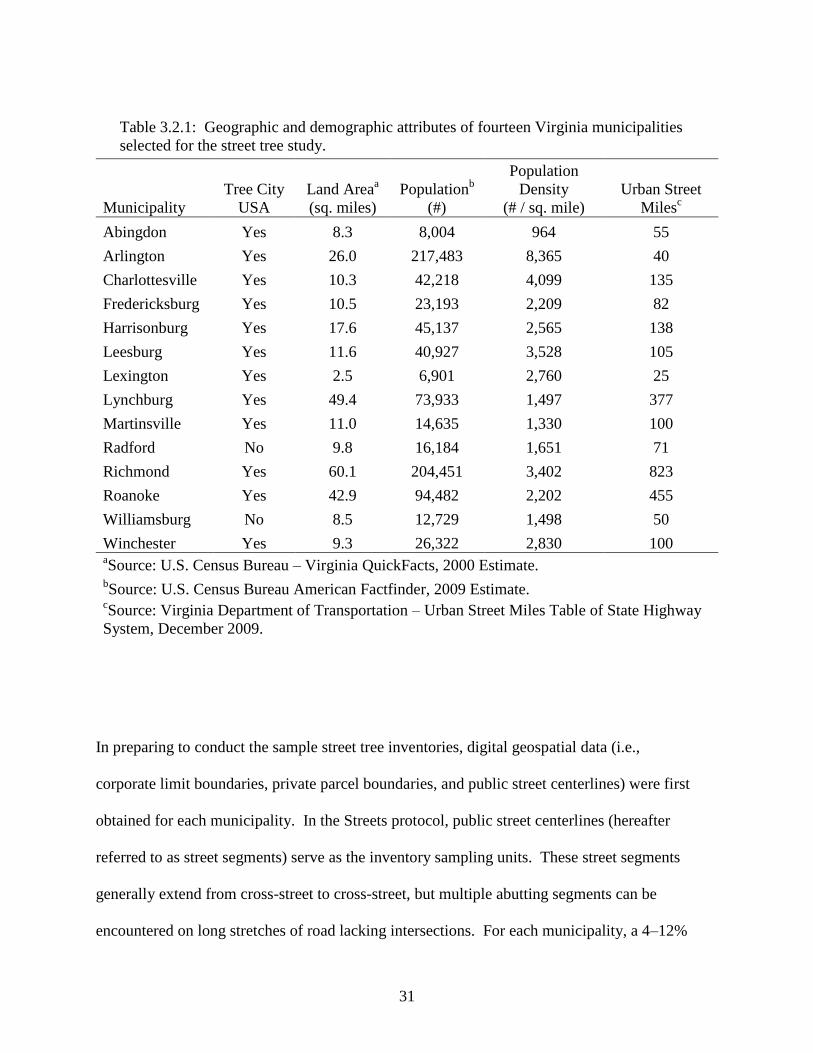
CHAPTER 3 – RESEARCH METHODS ................................................................................ 28 3.1 Study Site Selection .................................................................................................... 28

3.2 Data Collection ........................................................................................................... 30 3.3 Data Analysis .............................................................................................................. 35

CHAPTER 4 – RESULTS .......................................................................................................... 38

4.1 Structure, Function, and Value of Municipal Street Trees ......................................... 38 4.2 Native Ash Composition in Street Tree Populations .................................................. 49

4.3 Potential Impacts of Native Ash Loss on Street Tree Population ............................... 56 4.4 Potential Costs of Removing and Replacing Native Ash Trees ................................. 59

CHAPTER 5 – DISCUSSION.................................................................................................... 62

5.1 Implications of Native Ash Loss from Emerald Ash Borer ........................................ 62

5.2 Consequences for Municipal Budget and Public Safety ............................................. 66 5.3 Response and Recovery from Emerald Ash Borer ..................................................... 68 5.4 Future Work and Conclusions .................................................................................... 69

LITERATURE CITED .............................................................................................................. 72

APPENDIX A .............................................................................................................................. 78

v

LIST OF FIGURES

Figure 3.1.1: Virginia state map depicting the nine regions delineated for the street tree study

and the locations of fourteen study sites symbolized by street tree inventory type (complete or

sample inventory)……………………………………………………………………………..28

Figure 3.1.2: Venn diagram showing the composition of Virginia municipalities that were

candidates for either obtaining existing street tree inventories or conducting new street tree

inventories during the street tree study. Count is shown in parentheses…………………….29

vi

LIST OF TABLES

Table 3.1.1: Street tree inventory status of Virginia municipalities that are a Tree City USA

(TCUSA), county seat, or independent city based on contact efforts from 2008 to 2011..…….30

Table 3.2.1: Geographic and demographic attributes of fourteen Virginia municipalities selected

for the street tree study…………………………………………………………………………...31

Table 3.2.2: Description of street tree inventories obtained in fourteen Virginia municipalities

selected for the street tree study. Complete inventories did not employ a street segment sampling

procedure; thus this information is not provided for complete inventories……………………..32

Table 4.1.1: Street tree population attributes and associated values for fourteen Virginia

municipalities based on analysis of field inventory data using i-Tree Streets assessment software.

For municipalities assessed with sample inventories, standard errors of the attributes and values

are shown in parentheses………………………………………………………………………..39

Table 4.1.2: Five most important street tree species populating fourteen Virginia municipalities

based on analysis of field inventory data using i-Tree Streets assessment software. Importance

values are calculated by averaging the % leaf area, % canopy cover, and % stem count that each

species accounts for in the total tree population…………………………………………………42

Table 4.1.3: Condition of street trees in fourteen Virginia municipalities based on analysis of

field inventory data using i-Tree Streets assessment software. Condition ratings were determined

through visual evaluation of tree health and vitality only. Values are expressed in terms of

relative abundance (% of total stem count in municipality) for each condition class…………..43

Table 4.1.4: Gross annual benefits of street trees in fourteen Virginia municipalities based on

analysis of field inventory data using i-Tree Streets assessment software. Resource units are

shown in shaded lines and their monetary worth is shown in un-shaded lines. i-Tree does not

compute a standard error for resource units or for values calculated from complete inventories.48

Table 4.1.5: Gross annual benefits (ecosystem services and aesthetic/real estate enhancements)

provided by street trees in fourteen Virginia municipalities based on analysis of field inventory

data using i-Tree Streets assessment software. Values calculated from complete inventories do

not have a standard error…………………………………………………………………………49

Table 4.2.1: Abundance and importance of native ash (Fraxinus spp.) street trees in fourteen

Virginia municipalities based on analysis of field inventory data using i-Tree Streets assessment

software. For municipalities assessed with sample inventories, standard error of native ash

abundance is shown in parentheses. Values calculated from complete inventories do not have a

standard error…………………………………………………………………………………….50

vii

Table 4.2.2: Native ash (Fraxinus spp.) street tree attributes and associated values for fourteen

Virginia municipalities based on analysis of field inventory data using i-Tree Streets assessment

software. Values calculated from complete inventories do not have a standard error………….52

Table 4.2.3: Pairwise correlation analyses between native ash relative abundance (% of total tree

population) and select municipal attributes hypothesized to be related to ash abundance in fifteen

Virginia municipal street tree populations. Ash abundance calculated from street tree inventories

using i-Tree Streets assessment software………………………………………………………...54

Table 4.2.4: Gross annual benefits of native ash (Fraxinus spp.) street trees in fourteen Virginia

municipalities based on analysis of inventory data using i-Tree Streets software. Resource units

are shown in shaded lines and their monetary worth is shown in un-shaded lines. i-Tree does not

compute a standard error for resource units or for values calculated from complete inventories.55

Table 4.2.5: Gross annual benefits (ecosystem services and aesthetic/real estate enhancements)

provided by native ash (Fraxinus spp.) street trees in fourteen Virginia municipalities based on

analysis of field inventory data using i-Tree Streets assessment software. Values calculated from

complete inventories do not have a standard error………………………………………………56

Table 4.4.1: Estimated removal cost of native ash (Fraxinus spp.) street trees in fourteen

Virginia municipalities. Removal costs are based on statewide average contractor fee charged

per tree by diameter class to Virginia Department of Transportation in fiscal year 2011……….61

1

CHAPTER 1 – INTRODUCTION

The urban forest is the collection of all woody vegetation located within an area of dense human

settlement (Nowak et al. 2008) and is a critical component of the natural and artificial

infrastructure in every municipality. Trees are the dominant woody vegetation in most urban

forests and can be found residing in parks, streetscapes, remnant forests, and other maintained

and un-maintained areas where they provide a multitude of benefits for citizens and the

environment. In the conterminous United States, it has been estimated that there are nearly 3.8

billion urban trees, their canopies overhanging 27% of urbanized lands on average (Nowak et al.

2001). Street trees – although accounting for a relatively small proportion of the trees in a

typical city – are a conspicuous and critical component of most urban forests. Their proximity to

people and their importance to our day-to-day lives make them the focal point of municipal

forestry programs, encompassing the majority of management efforts and expenditures

Urban forests in general – and street trees in particular – provide a broad range of benefits to

urban areas. Many of these benefits are intrinsic to the physiological function of woody plants.

Examples of these so-called ecosystem services include stormwater abatement, energy

conservation, air pollution removal, and carbon sequestration and storage (McPherson 2003).

These services can potentially save hundreds of thousands of dollars in environmental

management costs for municipalities annually and create job opportunities for urban forestry

professionals that grow, plant, and maintain trees. Urban forests also provide benefits for

communities that go beyond the environment. The presence of abundant, healthy trees in the

urban environment has also been associated with higher real estate values (McPherson et al.

2

2005), lower crime rates, improved citizen health, and enhancement of outdoor recreation (Lohr

et al. 2004).

There are a number of non-native, invasive pests (plants, pathogens, and insects) that threaten the

health of North American urban forests and their provision of benefits. Many pests are brought

to North America from foreign continents with similar climate and physiography, yet they often

arrive to an environment with few natural enemies and abundant, vulnerable host plants

(Liebhold et al. 1995). These circumstances allow pests to flourish in our native ecosystems and

overtake the natural flora. In the United States, there is a growing list of insects that have been

introduced over the last 60 years (Ball et al. 2007). It is estimated that nearly 2.5 exotic pests are

introduced each year into the United States (Aukema et al. 2010). Most of these pests do very

little harm to native ecosystems, in part due to environmental controls such as climate,

physiography, or predators. However, some become tree pests, causing significant ecologic

harm and economic loss to both forestlands and urban forests.

In 1928, an exotic tree pest was first reported in the United States that would eventually cause

unprecedented harm to North America‘s urban forests (Stipes and Campana 1981). American

elm (Ulmus americana L.) had been widely planted in suburbs and along city streets throughout

the Northeast and Midwest during the early 20th century. The species‘ redeeming qualities (ease

of propagation, fast growth rate, urban tolerance, and attractive form) had contributed to its

overplanting, leading to near monocultures in some cities. Then Dutch elm disease (Ophiostoma

ulmi Buisman and O. novo-ulmi Brasier), a fungal pathogen, was introduced from Europe,

3

purportedly on veneer logs shipped from the Netherlands to Ohio (Brasier 1990). It was rapidly

spread via two coleopterans: the native elm bark beetle (Hylurgopinus rufipes Eichhoff)

and the smaller European elm bark beetle (Scolytus multistriatus Marsham). This insect-disease

combination claimed nearly 77 million native elm trees, by the 1970s within urban areas of

eastern North America, according to one Washington Post writer (McCombs 2001). This

instance shows that low species richness, e.g. street tree monocultures, can drastically increase

the susceptibility of urban forests to pest invasions.

Now the urban forests of North America are under attack by a newly-introduced pest, the

emerald ash borer (EAB) (Agrilus planipennis Fairmaire). EAB was purportedly introduced from

Asia in the 1990s through infested wooden packaging materials (Poland and McCullough 2006).

Although EAB causes limited ecological and economic harm to ash trees (Fraxinus spp.) in its

native habitat, the pest has decimated native ash populations in parts of North America where it

has been introduced (Sydnor et al. 2007). First detected near Detroit, Michigan in 2002, EAB

has rapidly dispersed throughout several Midwestern and Eastern states (Asaro 2006, 2008), and

its spread is predicted to encompass 25 Eastern states by 2019 (Kovacs et al. 2010). Since its

introduction, EAB has led to the destruction over 53 million native ash trees, with another 38

million predicted to be affected in urban areas alone over the next decade (Kovacs et al. 2010).

It is projected that the cost of treatment, removal, and replacement of urban ash trees impacted

by EAB will exceed $10 billion by 2019 (Kovacs et al. 2010).

4

EAB was first discovered in Virginia in 2003 at an elementary school in Fairfax County, brought

from Michigan in illegal ash tree nursery stock that was subsequently planted on the school

grounds (VDACS 2010a). An aggressive eradication effort was undertaken, and a subsequent

trapping survey suggested that the pest had been successfully eliminated from the state.

However, in 2008, EAB was found again in three locations in Fairfax County (Asaro 2008).

Survey trapping throughout Virginia in 2009 revealed no EAB detections outside Fairfax County

(VDACS 2009). About 4,000 survey traps were deployed throughout the state in spring 2010 to

continue EAB monitoring efforts (VDACS 2010). At present, there is a federal quarantine on

seven counties (Arlington, Clarke, Fairfax, Fauquier, Frederick, Loudon, and Prince William) in

the state (APHIS 2008) and a state quarantine on eleven localities (Arlington, Fairfax, Fauquier,

Loudoun, and Prince William, and the cities of Alexandria, Fairfax City, Falls Church,

Manassas, Manassas Park, and Winchester) (VDACS 2010).

Native ash abundance in Virginia‘s urban forests is not well documented; therefore, the potential

impacts of EAB outbreak on Virginia‘s municipalities are uncertain. Although urban tree

inventories have been performed in various localities throughout the state, these data have not

been collected in a standardized manner nor have they been analyzed in a comprehensive

fashion. Data from the US Forest Service (USFS) Forest Inventory Analysis (FIA) program

suggest that native ash species generally occupy only 1% of the standing tree count in rural

forests in Virginia (USFS 2008). While these data might provide insight on native ash

abundance in remnant forests within urban areas, ash abundance in managed landscapes may

differ significantly because people exert much more control on species composition in managed

landscapes. Kirwan et al. (2007) inventoried landscape trees on 105 K-12 school campuses in

5

Virginia during 2000 – 2005 and found that green ash (Fraxinus pennsylvanica Marshall)

accounted for only 2% of inventoried trees; no other native ash species exceeded 1%. To the

extent that school campuses are a reflection of the communities in which they reside, these

findings may imply low abundance of native ash in Virginia‘s urban forests. However, more

comprehensive assessment of these urban forests is necessary to document native ash abundance,

which is an integral first step for determining the potential impacts of EAB in Virginia.

Given the severity of EAB impacts incurred by numerous Midwestern cities – both in ecological

and economic terms, Virginia localities would be wise to begin preparing for impending EAB

outbreaks. Yet Virginia municipalities have practically no information on the abundance of

native ash trees in their street tree populations, nor do they have an empirical understanding of

the contribution that these trees make to the local community and environment. Without this

information, municipalities cannot fully appreciate the potential impacts of an EAB outbreak and

thus cannot adequately prepare a response plan. The goal of the current study was to address

these information needs by assessing street tree populations in select municipalities throughout

the Commonwealth of Virginia. This study had three main objectives:

1. Assess the abundance, composition, and condition of native ash species in street tree

populations from select Virginia municipalities.

2. Quantify the relative magnitude and monetary value of benefits provided by ash street

trees in these localities.

3. Estimate the potential cost of removal and replacement of these ash street trees in the

event of an EAB outbreak.

6

CHAPTER 2 – LITERATURE REVIEW

2.1 The Urban Forest

2.1.1 Resource Overview

The urban forest comprises planted and naturally occurring trees within the municipal boundary

(Johnston and Shimada 2004). As a unit, this resource is controlled and influenced by

constituents of the municipality. Naturally occurring trees in remnant forests are present due to

natural selection and regeneration and are usually managed differently than trees planted near

buildings and streets, which are typically selected by people for diversity or specific

characteristics (e.g. form, tolerance of site conditions, pest resistance, etc.).

Street tree populations also comprise both naturally occurring (such as those located in forest

fragments next to roadsides) and planted trees within public rights-of-way. The street tree

population is one aspect of the larger municipal urban forest. With nearly four-fifths of the

United States population residing in urban areas, it is essential that street tree populations be

healthy, diverse, and properly situated so that benefits are maximized and costs are minimized.

However, urban trees are often subjected to inhospitable conditions and vulnerable to attacks

from insects and pathogens. Non-native pests are an important consideration for urban forest

and street tree management in the United States. These pests are capable of eradicating entire

taxa from the urban forest, as was the case with Dutch elm disease (Ophiostoma novi-ulmi),

which nearly extirpated native elms (Ulmus spp.) from urban forests during the 20th

century. As

7

the world becomes more dependent on global trade, new threats to urban forests and street trees

are emerging at an unprecedented rate (Aukema et al. 2010). Arguably, the greatest pest threat

to urban forests and street trees currently in the United States is emerald ash borer (EAB), an

invasive exotic insect that threatens to eliminate native ash (Fraxinus spp.) from much of the

eastern United States.

2.1.2 Resource Abundance and Composition

Nearly 4% of the total land area in the United States has been classified as urban and is estimated

to contain nearly 80% of the United States‘ population (Nowak et al. 2001). The influx of

people moving into urbanized areas has caused peri-urban forests to be denuded for buildings,

parking lots, and utilities. There are approximately 4 billion trees located in urban areas of the

conterminous United States, equaling roughly 17 trees per urban inhabitant (Nowak et al. 2001).

These trees provide canopy cover over about 27% of urban lands on average. It has been

estimated that there are over 60 million street trees in the U.S. (Kielbaso 1990), which suggests

that there is one street tree for every 67 trees beyond the road edge in any given urban forest.

In the Commonwealth of Virginia, urban areas constitute about 8% of total land area, roughly

8,800 square kilometers (Nowak and Crane 2002). There is an estimated 157 million urban trees

in Virginia (Nowak et al. 2001); however, there is limited comprehensive information about

species composition in Virginia‘s urban forests. Tree canopy coverage in these areas has been

estimated at about 35% (Nowak et al. 2002), but this is based on low-resolution (1-km2) Landsat

data. Researchers at Virginia Tech have recently conducted urban tree canopy (UTC)

assessments in 23 localities using high-resolution (1-m2) NAIP data and have seen great variance

8

in canopy coverage across the state. Lynchburg, Radford, and Arlington lead Virginia

municipalities with the highest percentage of area covered in canopy (58%, 53%, and 52%

respectively). In contrast, Purcellville and Woodstock have the least amount of canopy coverage

at 20% and 22% respectively (Program 2011).

Forest Inventory Analysis (FIA) data from the USFS provide some insight on tree species

composition in Virginia‘s forests (USFS 2010). FIA data from 2007 indicated that the top-five

most abundant species (in terms of stem count) were red maple (Acer rubrum), loblolly pine

(Pinus taeda), yellow-poplar (Liriodendron tulipifera), sweetgum (Liquidambar styraciflua), and

blackgum (Nyssa sylvatica) (Rose 2007). Fraxinus americana (ranked 28th

) and F.

pennsylvanica (ranked 32nd

) were the only native ashes among the fifty most abundant species.

In total, FIA data indicated that there were about 178 million native ash trees in Virginia‘s

forests, which accounted for only about 2.2% of all forestland trees (Rose 2007). However,

these FIA plots are located on a randomly generated grid, which have very few plots located in

urban areas. These estimates are likely not an accurate indication of native ash abundance in

urban forests.

Little is known about native ash abundance in Virginia‘s urban areas. Based on estimates of

native ash density and canopy cover on developed lands in sixteen eastern cities (none in

Virginia), Kovacs et al. (2010) estimated that there are about 1.3 million ash trees in Virginia and

District of Columbia. In a study conducted on 105 K-12 public school campuses across Virginia,

researchers found that the ten most important species of landscape trees (>12.5 cm diameter)

9

comprised mostly native taxa within Acer, Pinus, and Quercus (one notable exception was Pyrus

calleryana ―Bradford‖) (Kirwan et al. 2007). Only one native ash species (Fraxinus americana)

was among the thirty-five most important species surveyed on school grounds. It was found on

only 10% of school campuses and comprised only 1% of the total school campus tree inventory

statewide. Although many localities in Virginia possess street tree inventories that might provide

insight on urban tree composition, these data are rarely available to the public in a

comprehensive fashion.

2.1.3 Resource Benefits and Values

Urban forests provide numerous benefits with tangible monetary value for citizens within

municipalities (Nowak et al. 2008). These benefits are related to both the function and structure

of the urban forest. Among the most significant functional benefits of urban forests are real

estate value enhancement, temperature moderation and energy conservation, stormwater

abatement, air pollution mitigation, and carbon sequestration. Urban forests also have value as

structural assets. This structural value is derived from long-term carbon storage as well as the

replacement value of the green infrastructure itself. Street trees are often on the front-line of

functional and structural benefit provision given their proximity to people and built

infrastructure.

Once trees and other vegetation are planted outside a home or office building, the real estate

value of the residence can increase by as much as seven to ten percent (Buhyoff et al. 1984). A

study in Portland (OR) revealed that street trees located adjacent to residential property increased

10

the home value by $8,900 on average. Also, all trees in Portland yielded nearly $1.35 billion in

monetary benefits (Donovan and Butry 2010).

Street trees shade and cool hardscapes of municipalities (Nowak and Dwyer 2007). Ultra-violet

radiation is captured by the leaves (nearly 90%), leaving hardscapes cooler and less likely to

rapidly degrade (Heisler 1986) and reduces re-radiated heat from these surfaces. By intercepting

solar radiation and through evaporative cooling, trees also facilitate energy conservation. When

broadleaf trees are planted on the south aspect of a domicile, they cast shade upon the structure

during the summer months and effectively cool the area under the tree by about 5 °C (Heisler

1986). If evergreen trees are planted on the north aspect of a landscape, harsh winter winds can

be blocked, thus slowing heat loss from the domicile (Heisler 1990, Akbari et al. 1992).

Leaves and stems, in combination with the soil surrounding the root system, also act as ‗traps‘

for stormwater runoff. In a storm event, water quickly runs off compacted soil and impervious

surfaces of roads, parking lots, and other hardscapes. If trees are planted near the roadside, more

rainfall will be intercepted by the canopy and accompanying root systems, preventing nearly

26% of intercepted rainfall from running off (Neville 1996). The soil immediately surrounding

the tree provides the stormwater a place to infiltrate, saturate, and slowly release. Highly

urbanized areas can also use trees and structural soils (soil created from several media

homogenized together) that allow for water penetration and root growth as stormwater detention

infrastructure (Day and Dickinson 2008).

11

In addition to energy conservation and stormwater abatement, trees improve air quality through

pollution mitigation. As leaf gas exchange occurs, air quality will increase by removing gaseous

pollutants from the atmosphere through stomata openings (Smith 1990, McPherson 2003). Trees

can also filter harmful particulates from the atmosphere. In Chicago, for example, urban trees are

estimated to remove nearly 1% of all ozone from the atmosphere (Nowak 1994).

Urban trees also sequester significant amounts of carbon on an annual basis. During the growing

season, trees remove carbon dioxide from the atmosphere and use this molecule to synthesize

glucose, the primary foodstuff for photosynthetically active plants. Each year, urban trees in the

U.S. sequester nearly 23 million tons of carbon, valued at $460 million annually (Nowak and

Crane 2002).

Trees in urban forests are also structural assets to municipalities, an infrastructure analogous to

the bricks-and-mortar of a factory that creates widgets for revenue. Because trees are perennial

plants, they store significant amounts of carbon in the wood that composes branches, trunks, and

roots. In total, it is estimated that urban trees in the United States store 700 million tons of

carbon, which is valued at over $14 billion (Nowak and Crane 2002). These researchers also

estimated urban tree carbon storage in Virginia at nearly 30 million tons, the sixth largest stock

of urban tree carbon storage in the U.S.

12

Much like any other infrastructure asset in a city, urban trees can also be valued using appraisal

methods that estimate the cost to replace the assets. With urban trees, this value is often called a

compensatory or replacement value. Using the Council of Tree and Landscape Appraisers

method, compensatory value has been estimated for street trees in certain municipalities, the

entire street tree population of the United States, and for the urban forests of the coterminous

United States. Nowak et al. (2002) estimated the value for structural replacement of urban trees

within the United States at over $2 trillion. New York City had the highest compensatory value

for urban trees amongst investigated municipalities at $5.2 billion. Virginia was estimated to

have nearly $100 billion in compensatory value, which was the sixth highest total in the

coterminous United States (Nowak et al. 2002).

2.1.4 Resource Threats and Vulnerabilities

Many people for various reasons manage the urban forest: city officials, horticulturists, arborists,

and municipal constituents all influence the structure and function of the urban forest. Due to the

limited growing space in urban planting sites (soil pits adjacent to roadways, islands in parking

lots), poor quality soil (Wray 2003), and urbanization, urban trees may suffer poor health or

structural instability. In parking lots and along streets, trees must survive the heat island effect

(re-radiated heat from the hardscape), injury from road salt, poor soil conditions, and pedestrian

or vehicular traffic. Stressful conditions can make urban trees more susceptible to pests and

other disorders that can lead to poor growth and early mortality (Kozlowski 1969). These factors

also have the potential to cause safety hazards, poorly developed root systems, stunted growth,

lowered vitality, and loss of ecosystem benefits to the municipality. Due to these potential

issues, urban trees require careful planning and management to maximize benefits and value. If

13

trees are not protected and managed properly, health issues can overwhelm municipal resources

and attribute to premature tree mortality.

As trees are predisposed by environmental and human-related stress factors, inciting factors arise

that can lead to tree mortality (Roberts 1977). Fungi, bacteria, and insects can overcome

compromised defense mechanisms of trees. Insects, such as foliage feeding beetles and wood

boring beetles, can attack stressed trees. As trees become stressed, resources are not allocated to

contain or tolerate insect damage. Over time, numerous infestations of a stressed tree can lead to

premature mortality. This fact has lead to several urban tree pests becoming severe enough to

threaten the structure, function, and value of the urban forest.

Improper cultural practices also negatively affect urban trees. Improper pruning, such as

‗topping,‘ creates pathways for decay organisms to enter, weakening the trees‘ structure (Gilman

and Knox 2005). Trees that have been pruned improperly may respond with epicormic branches

that are usually poorly attached and can potentially fail in high winds or heavy precipitation

events.

Urban trees can also be inflicted with a condition called heat stress. Trees located in parking lots

and along streets encounter the heat island effect; radiant heat from the sun is magnified due to

the dark surfaces of the road or pavement. This excess heat may cause trees to have depressed

vigor, early senescence, and poor vitality (Roberts 1977, Cregg and Dix 2001). Urban trees

14

affected by heat stress are also predisposed to drought-like symptoms. These characteristics

include wilting of leaves, crown dieback, epicormic branching and eventually death.

As the global economy expands and international shipping expands, the threat of accidental

introduction of exotic pests becomes greater (Aukema et al. 2010). Insect pests can be

introduced to new areas via wooden packing material, nursery stock, firewood transport, and

other means. These introductions can prove to be disastrous from both an economical and

ecological standpoint.

In a balanced ecosystem, insects co-evolve with host defense mechanisms, natural enemies, and

a suppressive climate. These natural control factors serve as a system of checks-and-balances to

the pest population. Non-native insect populations establish in new habitats often do so without

natural enemies (DeBach 1964). Thus, these non-native pest populations may increase in an

unchecked manner and damage local flora. As the population increases, then the number of

plants attacked becomes greater, possibly leading to total extirpation of the native species. A

lack of species diversity within the forest attributes to the damage more quickly.

Over the last 100 years, the United States has seen several major tree pest infestations resulting

from the introduction of exotic organisms and lack of tree diversity (Liebhold et al. 1995,

Aukema et al. 2010). Aukema et al. (2010) estimated that on average about 2.5 non-indigenous

forest pests are introduced to the United States each year. For example, a popular street tree,

15

American elm (Ulmus americana L.), was decimated by an introduced pathogen (Ophiostoma

novi-ulmi) and insect (Hylurgopinus rufipes Eichhoff and Scolytus multistriatus Marsham)

combination. This insect/pathogen combination is a classic example of how monoculture

plantings and lack of species richness can decimate the urban forest as a whole. Hence, the

reason species diversity is paramount to properly managing the urban forest.

There are over 400 species of phytophagous insects that are naturalized to the United States

(Raupp et al 2006). These species range from innocuous to devastating. By 1977, it was

estimated that DED had contributed to the death or removal of nearly 50 million elm trees

(Schlarbaum et al. 1997). The majority of these pest species are inciting factors that contribute

to the mortality of pre-disposed trees. Many insect species must co-infest with other insects and

pathogens before tree mortality is possible (Mayo et al. 2003). For example, native oaks

(Quercus spp L.) may need to have both gypsy moth (Lymantria dispar L.) and forest tent

caterpillar (Malacosoma disstria Hubner) infestations in coordination with microclimate stress

and soil conditions before tree vitality is expended and health declines rapidly (Mayo et al.

2003).

Many exotic pests introduced to the United States have caused both economic and ecological

damage. The recent introduction of EAB also has the potential to dramatically alter the urban

landscape as well potentially extirpating all native ash trees within the United States. With the

new tools available for street tree assessment, we have the opportunity to anticipate and prepare

for the full impact of EAB on Virginia‘s urban forests.

16

2.2 Emerald Ash Borer

2.2.1 Pest Overview

Emerald ash borer is a phloem-feeding beetle first named in 1888 in southeastern China, which is

within its native range (Fairmaire 1888). Thought to have been first introduced into the United

States in the late 1990s, this insect has quickly become the most catastrophic tree pest epidemic

in U.S. history (Kovacs et al. 2010). Since its introduction, it has killed nearly 56 million native

ash trees in the United States, and costs of mitigation could exceed $25 billion (Aukema et al.

2010).

Since the early 2000s, EAB has spread to over 20 states. Virginia was originally colonized by

EAB in 2003; however, after remediation and sanitation by the USFS, the outbreak seemed to

have been eradicated. In 2008, another EAB outbreak was found in northern Virginia and

another colony was discovered outside Winchester in 2010. It has been estimated that urban

areas of Virginia and the District of Columbia contain nearly 1.3 million native ash trees and the

cost to treat and remove ash trees impacted by EAB has been placed at $641 million (Kovacs et

al. 2010).

2.2.2 Pest Ecology

Emerald ash borer is a metallic-colored, flat-headed, wood-boring beetle (Coleoptera:

Buprestidae) that is native to East Asia. Mitochondrial evidence from Michigan State University

suggests EAB specimens found in the United States are related to EAB from the Heilongjiang

and Tianjin Provinces of China (Wei et al. 2007). In its native range, EAB does not cause

17

significant damage to indigenous ash species and is considered a minor pest. The insect feeds

primarily on Fraxinus species in the United States (Anulewicz et al. 2007). The adults feed on

the foliage of the crown; however, this does little harm to the overall vitality of the tree. The

larvae feed during the summer months and create galleries within the stem and branches of the

tree. These galleries restrict the flow of water, nutrients, and foodstuffs from the roots to the

leaves and effectively girdles the tree. This girdling typically kills the tree within five years.

In early June, adult beetles emerge from the host tree in which they spent their juvenile and pupal

stages to disperse, find mates, and reproduce. Adults feed on the foliage of host trees until

sexual maturity is reached (Poland and McCullough 2006). The female lays 50 to 90 eggs in

cracks, crevices, and furrows on the outer bark of a host tree (Poland and McCullough 2006).

The adult beetles usually live for about three to six weeks. In late July and early August, the

eggs hatch and the larvae bore through the bark and into the phloem (Anulewicz et al. 2007). As

the larvae feed and mature, they create S-shaped galleries within the phloem. The larvae ingest

the phloem and grow in size, creating a progressively larger gallery. The enlargement of the

gallery can sometimes score the outer surface of the sapwood (Anulewicz et al. 2007). The

larvae overwinter in the prepupal stage in shallow excavations in the gallery. Pupation begins in

early April and requires approximately two weeks after which adults emerge in early June.

EAB creates many signs and symptoms as it infests the host plant. The first symptom the host

shows is thinning of the canopy (Anulewicz et al. 2007). As the larvae feed, they damage the

tree‘s vascular system, leading to canopy thinning and dieback. As the larvae continue to

18

develop, additional symptoms appear; epicormic sprouts proliferate from the base of the tree and

dieback is evident in the uppermost parts of the canopy (Ball et al. 2007). This is the natural

survival reaction of the host tree trying to reestablish leaf area for photosynthesis. The final life-

stage sign of EAB is the D-shape exit hole in the bark surface that the adult insect creates after

pupation and emergence from the tree (Poland and McCullough 2006).

EAB seems to prefer native ashes of North America while some oriental ashes show resistance

(Anulewicz et al. 2007). The most common native ash species include white ash (Fraxinus

americana L.), green ash (F. pennsylvanica L.), black ash (F. nigra L.), blue ash (F.

quadrangulata L.), and red ash (F. profunda L.). EAB has not been documented to feed and

infest any other genus in the Oleaceae family. Host preference by the insect does not appear

related to tree age. However, stressed trees, such as those on parking lots, streets, and other

stressful growing spaces, seem to be attacked first (Anulewicz et al. 2007). Once attacked and

infested, trees usually expire in two to three years. This pest is difficult to control because it

often goes undetected during early stages of infestation. Signs and symptoms of the insect often

do not become apparent until the second season of infestation (Nzokou et al. 2008), making it

difficult to control the pest and rehabilitate the tree.

2.2.3 Pest Introduction and Impacts

In the summer of 2002, EAB was first detected infesting white ash and green ash in the greater

Detroit, Michigan area and soon thereafter was found infesting green ash in southern Ontario,

Canada (Sydnor et al. 2007). It was most likely brought to North America in wood packing

material constructed from wood products containing EAB larvae that was shipped from east Asia

19

without having been properly treated for wood boring insects (Heimlich et al. 2008). Since

being discovered, EAB has killed over 30 million ash trees in the Detroit, Michigan area and

several surrounding states in the United States and several million ash trees in Ontario, Canada

(Anulewicz et al. 2007). More recently, EAB has spread from Michigan, to Wisconsin, Ohio,

Indiana, Missouri, Illinois, West Virginia, Pennsylvania, and Virginia (Asaro 2008, Kovacs et al.

2010). EAB has the capability of winged flight from one-half mile to up to three miles after

emerging from the host tree (Taylor et al. 2005).

EAB has spread rather quickly from its original area of concentration in Detroit, Michigan.

After its initial report in 2002, Ohio was the next state to have a confirmed infestation of EAB in

2003 (Nzokou et al. 2008). Also, in the same year, Maryland and Virginia both had small,

isolated pockets of the insect discovered. Each state began an aggressive quarantine of the areas

infested. EAB outbreaks in Virginia were thought to be eradicated; however, Maryland still

remained quarantined with EAB (Asaro 2006) Indiana was the next state that was confirmed

with an EAB attack. In 2006, resurgence was discovered in Maryland, and Illinois became

another state with a confirmed infestation. Pennsylvania and West Virginia were then infested in

2007 (Anulewicz et al. 2007). In 2008, three more states were added to the list of confirmed

EAB populations: Wisconsin, Missouri, and Virginia (again). In less than seven years, EAB had

infested 10 states and two additional Canadian provinces. The quick spread has been helped due

to the fact of limited natural control of the insect in North America and that native ash of North

America have practically no natural resistance (Anulewicz et al. 2007).

20

In 2003, EAB was detected in Fairfax County, Virginia, adjacent to the Maryland border. The

insect was introduced to the northern Virginia area via infested nursery stock, which had not

been properly inspected (Asaro 2006). After a quarantine effort by the Animal and Plant Health

Inspection Service (APHIS), the United States Forest Service (USFS) and the Virginia

Department of Forestry (VDOF), the insect was thought to be eradicated from the area in early

2004. However, in 2008 the insect was again detected in Fairfax County(Asaro 2008) and was

discovered near Winchester city in 2010.

To slow the spread of the insect, the Virginia Department of Agriculture and Consumer Services,

along with the above agencies, have quarantined seven counties (Arlington, Clarke, Fairfax,

Fauquier, Frederick (found in traps), Loudon, and Prince William) and six independent

municipalities (Alexandria, Fairfax, Falls Church, Manassas, Manassas Park, and Winchester)

(VDACS 2010b). Under this quarantine, it is unlawful to transport known native ash, which has

not been properly treated, from a quarantined county into a county not quarantined.

The introduction of EAB to the United States has the potential to drastically alter the

composition and ecology of urban and rural forests. Areas where native ash are naturally

abundant or have been heavily planted will be affected the most. Ball et al. (2007) estimated that

approximately 36% of street trees of select communities in South Dakota are populated with

native ash species. Sydnor et al. (2007) estimated there are 4.3 million urban ash trees in Ohio.

Native ash are particularly good street trees due to their fast growing nature and ability to tolerate

stressful environments. Also, native ash trees are tolerant to alkaline soils (which are prevalent

21

in the Midwest of the United States). Kovacs et al. (2010) estimated that managing native ash

trees impacted by EAB on developed lands (treatment, suppression, and removals) will cost over

$10 billion and will affect close to 38 million trees nationwide by 2019. In Virginia, Kovacs et

al. (2010) estimates that over 1.3 million native ash trees will be affected at a cost of $641

million.

Two different strategies have been used to suppress EAB populations. The first method of

suppression is through quarantine, which revolves around regulating the intrastate and interstate

transport of native ash biomass (VDACS 2010b) from counties known to harbor EAB to counties

that do not. In the EAB quarantine, regulatory organizations, such as the USFS, VDOF, and

Virginia Department of Agriculture and Consumer Services (VDACS), monitor the spread of the

insect using bait traps and intentionally girdled ash trees set up on a 0.5 mile by 0.5 mile gird to

detect any spread of the insect (Ball et al. 2007). Although these traps are not universally

applied, it identifies if the insect is moving from flight or with the help of humans.

The second strategy is to use conventional pest management techniques such as pesticides and

natural enemies to prevent and suppress EAB outbreaks. Several insecticides have been found

that effectively control EAB when injected into the tree trunk or drenched around the root

system. Currently, standards dictate the use of imidacloprid, a systemic insecticide, to control

population levels (Nzokou et al. 2008). However, new products such as TREE-age (emamectin

benzoate) and Safari (dinotefuran) have shown promise in recent studies (Herms et al. 2009).

These pesticides are most effective when applied to trees prior to EAB infestation. Moreover,

22

limited research has been conducted on pesticide efficacy with trees over 63 cm trunk diameter

(Herms et al. 2009).

Researchers are currently studying the efficacy of the entomopathogen Beauveria bassiana and

releasing Asian stingless wasps that parasitize and kill EAB in its native range. Three parasitic

wasps are being evaluated for their efficacy in controlling EAB larvae. Research has previously

shown these wasps, especially Tetrastichus planipennisi (Yang), have the potential to kill 50% of

EAB larvae before adults emerge (Yang et al. 2006) Beauveria bassiana (Bals. - Criv.) is a

naturally occurring fungus that is being studied to determine its control efficacy on EAB if

released prior to parasitic wasps (Castrillo et al. 2010).

2.3 Street Tree Assessment and i-Tree Streets

2.3.1 Assessment Overview

Past estimates have indicated that there are nearly 60 million street trees located within rights-of-

way in the United States (Kielbaso 1990). Street trees are critical components of the urban

forest; these trees shade sidewalks and streets (causing less UV light degradation), help calm

traffic, reduce glare from headlights, reduce traffic noise, beautify the landscape, and help reduce

the amount of water that runs off from hardscapes (Maco and McPherson 2003). To properly

manage this resource and maximize its benefits to society, a resource assessment is periodically

conducted as part of the resource management cycle (Miller 1997). A street tree assessment

provides a detailed view of the street tree population (McPherson 2003). When performed

correctly, street tree assessments provide critical information on tree health as well as the

23

benefits trees provide for the municipality (Nowak et al. 2006). These assessments provide a

wealth of information about street tree abundance, composition, and condition, aid in calculating

street tree benefits and costs, as well as detailing vulnerabilities that may be present (McPherson

2003). This information is valuable to planners, arborists, and urban forest managers of the

municipality so there is a better understanding of resource management needs.

Until the last decade, street tree assessments had focused solely on evaluating tree abundance,

composition, and condition (i.e., the structure of the street tree population). As scientists have

learned more about the function of street trees (and the relationship between structure and

function), quantification of these benefits has been incorporated into the assessment process.

The USFS pioneered this contemporary paradigm of street tree assessment to develop a software

program called i-Tree Streets (Nowak et al. 2008). It is a peer reviewed, state-of-the-art program

that has the capability to not only evaluate structural attributes of the street tree population, but

also the quantity of benefits along with their monetary worth. This information on function and

value expands understanding of urban forest benefits and provides evidence for resource

conservation, investment, and management.

2.3.2 Street Tree Inventories

The street tree inventory is a management tool that has been used since the advent of urban

forestry. Quite simply, a tree inventory is a record of the location and characteristics of

individual trees within a well-defined group (Bond and Buchanan 2006). These data form the

basis for planning and managing the urban forest (Miller 1997). Three types of tree inventories

24

are commonly conducted by urban foresters: complete, partial, and sample inventories (Bond and

Buchanan 2006). In a complete inventory, all trees located within a defined population or

geographic area are enumerated. This creates an inventory that is highly precise, but requires

extensive time and money to complete. A partial inventory is simply a complete inventory for a

subset of a tree population or geographic area (e.g., only trees of a particular species or only on

primary streets). In contrast to complete and partial inventories, a sample inventory procures

data for a representative portion of the population and then uses statistical methods to calculate

population level attributes. This method is much quicker and cost-effective than a complete

inventory; however, the resulting statistics will possess some degree of uncertainty depending on

sample intensity and variation in attributes of interest within the tree population.

Once an inventory has been completed, these data can be analyzed using software programs

designed for various purposes. Inventory software programs are used to assess abundance and

composition and to identify management needs for the street tree population (Smiley and Baker

1988, Bond and Buchanan 2006). These characteristics of the urban forest are valuable data that

allow for determination of urban forest health and planning of management. Among these

inventory analysis programs, i-Tree Streets has the distinction of being the only program that

uses street tree inventory data to assess multiple aspects of street tree structure, function, and

value.

25

2.3.3 i-Tree Streets

Currently, the most widely available street tree assessment software in the United States is i-Tree

Streets (hereafter referred to as Streets). This peer-reviewed, empirically derived application was

developed through a partnership of the USFS and the Davey Resource Group. Streets uses a

complete or sample inventory to estimate street tree abundance and composition within a

municipality. Sample inventories are created by generating a random sample of street segments

within a municipality (typically 3–12% sample fraction) and then field measuring all trees

residing on the sampled streets for key attributes (e.g. species, condition, and trunk diameter).

These inventory attribute data are then used as inputs for empirical models that estimate (by

species) stem count, leaf area, canopy coverage, and quantity and monetary value of functional

benefits for the entire street tree population within the municipality (i-Tree 2008).

To predict street tree dimensions, Streets uses empirical models developed through research that

began in the San Joaquin Valley of California in the summer of 1998 and then continued in other

model cities throughout the United States (Peper et al. 2001, McPherson 2003). Researchers

used regression analysis to build empirical models between trunk diameter and age (R2 = 0.85),

height (R2 = 0.86), crown diameter (R

2 = 0.92), crown height (R

2 = 0.86), and leaf area (R

2 =

0.91). The original study entailed collecting field data from 12 different street trees species

commonly found in several neighborhoods in the San Joaquin Valley. The neighborhoods were

rated as young (those created between 1970 an 1990) and old (created pre-1970) neighborhood.

This stratification allowed researchers to determine the age of the trees.

26

To develop empirical models for other areas of the United States, Streets researchers in Davis,

California divided the United States into 16 regional climate zones based on Sunset‘s National

Garden Book. Within each of these zones, a model city was selected and 800 street trees were

randomly selected and intensively sampled. Sampling consisted of 40 trees of the 20 most

common species growing in the region. Municipal records were solicited for each tree to

determine its age and then other attributes were measured in the field (e.g. DBH, leaf area, crown

height, tree height, etc.) (Peper et al. 2001, McPherson 2003).

Economic analyses of the street tree inventory through Streets uses specific values to determine

the monetary value for functional benefits provided by each tree. Values from energy

conservation were calculated from savings of electrical power and natural gas and were obtained

from regional electric power companies. Stormwater runoff benefits were priced from local

department of works as to budget augmentations and deflations from areas of high tree

populations to low tree populations. Retention and detention ponds were taken into

consideration, as well as sanitary treatment of stormwater. Median home sales price was also

obtained from localities to allow for aesthetic benefit appraisal using the Council of Tree and

Landscape Appraisers guide. Carbon storage and carbon sequestration values were defined from

www.eCO2.com (i-Tree 2008).

In the past five to ten years, street tree inventories and assessments have become more popular

and prevalent (Maco and McPherson 2003). Urban planners and municipality leaders are being

urged to perform these analyses to permit more informed decisions about urban forest

27

management. These inventories and assessments provide much needed information that can be

used for policy decision-making and for bolstering funding for the urban forest (Peper et al.

2001). In particular, i-Tree Streets enables urban forest managers to better understand not only

the structure of street tree populations, but also interpret the monetary value of the functional

benefits provided by street trees. In addition to typical applications for resource management, i-

Tree Streets can also be a valuable tool for identifying urban forest vulnerabilities to invasive

pests and understanding the full scope of impacts that these pests might have on an urban forest,

including losses of structural and functional values.

28

CHAPTER 3 – RESEARCH METHODS

3.1 Study Site Selection

This study was conducted over a three-year period (2008–2010) in fourteen municipalities within

Virginia. To facilitate selection of these study sites, Virginia was first divided into nine regions

based roughly on existing geo-physical and socio-political boundaries (Figure 3.1.1).

Figure 3.1.1: Virginia state map depicting the nine regions delineated for the street tree study

and the locations of fourteen study sites symbolized by street tree inventory type (complete or

sample inventory).

29

Within these nine regions, 132 localities were identified as study site prospects based on their

designation as (1) an independent city, (2) a Tree City USA designee, or (3) a county seat

(Figure 3.1.2). Contact information for the municipal agent responsible for street trees (i.e.,

forester, horticulturist, or engineer) in each locality was then obtained. Primarily focusing on

independent cities and Tree City USA designees, about 60 municipalities were contacted to

determine if a street tree inventory already existed (Table 3.1.1).

Figure 3.1.2: Venn diagram showing the composition of Virginia municipalities that were

candidates for either obtaining existing street tree inventories or conducting new street tree

inventories during the street tree study. Count is shown in parentheses.

30

Table 3.1.1: Street tree inventory status of Virginia municipalities that are a Tree City USA

(TCUSA), county seat, or independent city based on contact efforts from 2008 to 2011.

Existing Street Tree Inventory Status

Locality Type Yes No Unknown Total

County Seat (Not TCUSA) 0 4 68 72

Independent City (Not TCUSA) 0 6 10 16

Tree City USA

Independent City 9 12 2 23

Not Independent City 5 16 0 21

Total 14 38 80 132

Based on these contact efforts, existing inventory data were obtained from nine localities that

met our selection criteria: (1) inventory less than 10 years old, (2) inventory containing street

trees only, and (3) inventory representative of all street trees within municipal boundaries. To

enhance geographic representation across the nine study regions, we also conducted sample

street tree inventories in nine additional localities. These selections were not part of a statistical

sampling design, but were rather purposefully chosen to broadly assess street tree populations

across the state and provide management information for key municipal stakeholders.

Geographic and demographic attributes for all fourteen municipalities included in the study are

shown in Table 3.2.1.

3.2 Data Collection

In addition to compiling existing inventories from nine localities, sample street tree

inventories were also conducted in nine Virginia municipalities. These inventories were

performed, assessed, and reported using i-Tree Streets (Streets). The Streets inventory

protocol entails random sampling of discrete street segments within a locality to enumerate

and characterize all trees growing adjacent to the sampled street segments.

31

Table 3.2.1: Geographic and demographic attributes of fourteen Virginia municipalities

selected for the street tree study.

Municipality

Tree City

USA

Land Areaa

(sq. miles)

Populationb

(#)

Population

Density

(# / sq. mile)

Urban Street

Milesc

Abingdon Yes 8.3 8,004 964 55

Arlington Yes 26.0 217,483 8,365 40

Charlottesville Yes 10.3 42,218 4,099 135

Fredericksburg Yes 10.5 23,193 2,209 82

Harrisonburg Yes 17.6 45,137 2,565 138

Leesburg Yes 11.6 40,927 3,528 105

Lexington Yes 2.5 6,901 2,760 25

Lynchburg Yes 49.4 73,933 1,497 377

Martinsville Yes 11.0 14,635 1,330 100

Radford No 9.8 16,184 1,651 71

Richmond Yes 60.1 204,451 3,402 823

Roanoke Yes 42.9 94,482 2,202 455

Williamsburg No 8.5 12,729 1,498 50

Winchester Yes 9.3 26,322 2,830 100 aSource: U.S. Census Bureau – Virginia QuickFacts, 2000 Estimate.

bSource: U.S. Census Bureau American Factfinder, 2009 Estimate.

cSource: Virginia Department of Transportation – Urban Street Miles Table of State Highway

System, December 2009.

In preparing to conduct the sample street tree inventories, digital geospatial data (i.e.,

corporate limit boundaries, private parcel boundaries, and public street centerlines) were first

obtained for each municipality. In the Streets protocol, public street centerlines (hereafter

referred to as street segments) serve as the inventory sampling units. These street segments

generally extend from cross-street to cross-street, but multiple abutting segments can be

encountered on long stretches of road lacking intersections. For each municipality, a 4–12%

32

random sample of all street segments within the corporate boundaries was inventoried (Table

3.2.2). The specific sampling intensity chosen for each locality was based on its land area,

land use mix, and development density with the goal of generating a total street tree

population estimate with a standard error not more than 10% of the population estimate.

Smaller, less-urban localities were sampled at higher intensities due to greater variation in

street tree abundance amongst their street segments. In some localities, street segment

sampling was stratified by land use in an effort to further reduce sampling error.

Table 3.2.2: Description of street tree inventories obtained in fourteen Virginia

municipalities selected for the street tree study. Complete inventories did not employ a

street segment sampling procedure; thus this information is not provided for complete

inventories.

Municipality

Inventory

Type

Total Street

Segments

Sampled Street

Segments

Percent

Sampled

Date

Inventoried

Abingdon Complete – – 100 2007

Arlington Complete – – 100 2003

Charlottesville Complete – – 100 2009

Fredericksburg Sample 1,304 127 9.7 2008

Harrisonburg Sample 1,771 214 12.1 2010

Leesburg Complete – – 100 2004

Lexington Complete – – 100 2008

Lynchburg Sample 4,175 375 9.0 2009

Martinsville Sample 1,103 133 12.1 2009

Radford Sample 1,784 212 11.9 2008

Richmond Sample 14,249 553 3.9 2009

Roanoke Sample 6,245 309 4.9 2008

Williamsburg Sample 949 124 13.1 2010

Winchester Sample 1,611 162 10.1 2008

33

For each municipality, ArcMap 9.3.1 (ESRI Inc., Redlands, CA) GIS software was used to

select a random sample of street segments at the designated sampling intensity. Using

ArcMap‘s Field Calculator tool, every street segment within the city was assigned a

randomly generated number between 0 and 1. The tabular dataset was then sorted in

ascending order by the assigned random numbers and a sample was selected from the sorted

list of street segments equal to the designated sampling intensity (e.g., if a locality had 1,000

street segments and the sampling intensity was 10%, then the first 100 street segments in the

randomized, sorted list were selected).

The sampled street segments were then overlaid on high-resolution aerial imagery of the

locality and visually inspected for sampling suitability. Those segments that were atypically

short or long, that had atypical right-of-way boundaries, or that had been recently impacted

by land development (street closure or widening, building construction, etc.) were removed

from the sample and replaced with additional, randomly-sampled segments. To ease

identification of right-of-way boundaries in the field, a geoprocessing tool of ArcMap‘s 3D

Analyst called Near Analysis was used to calculate the perpendicular distance from edge of

street pavement to edge of right-of-way along the extent of each sampled street segment.

Paper field maps were then created based on this analysis depicting the sampled street

segment, its adjacent right-of-way boundaries, and its calculated right-of-way widths overlaid

on aerial imagery of the vicinity. These maps were used to orient the field crews, determine

whether trees were within the public right-of-way, and document the location of inventoried

trees.

34

Field data were collected using a hand-held computer (Dell Axim x51v, Dell Inc., Round

Rock, TX) running the Streets field application. For the purpose of this project, a tree was

defined as any self-supporting, woody plant either greater than 2.44 meters tall or possessing

a single stem within 0.30 meters of ground line. This definition captured large trees, large

shrubs that function as trees, and small juvenile trees. All trees residing within the public

right-of-way (naturally-occurring trees, publicly-planted trees, and privately-planted trees)

were inventoried. Along streets retaining a forested character (i.e. an unmaintained ground

cover), only trees greater than 10.2 cm diameter breast height (DBH) and not more than 6.1

meters from the edge of pavement were inventoried.

The following attributes were measured and documented for each inventoried tree:

Tree ID number

Street segment number

Street name and address

Botanical name

Trunk diameter (DBH) class

Age class

Structural condition

Functional condition (health)

Land use

Site type

The definitions and value ranges for these attributes are reported in Appendix A. The only

quantitative measures taken in the field were tree distance from edge of pavement and DBH

35

measurement, which were measured using a diameter tape or calipers. All other attributes were

qualitative, categorical measures.

3.3 Data Analysis

Existing and sample street tree inventory data sets were thoroughly reviewed for missing and out

of range values prior to analysis. Incomplete or erroneous records (e.g., a tree having a trunk

diameter of 1,000 inches), were corrected when possible or discarded from the data sets. Data

sets were then uploaded to a computer running the Streets desktop application, and a project file

was created for each locality. Streets calculates the quantity and monetary value of tree benefits

based on meteorological and tree-modeling data collected from reference cities throughout the

US. For this study, calculations for all localities were based on the South Climate Zone, which

uses Charlotte, NC as its reference city. After designating the climate zone, municipal attributes

such as land area and human population were defined in the project set-up for each locality.

Default values provided by STREETS for pricing ecosystem services and tree benefits were used

for all municipal assessments. Finally, a species matching procedure was performed in the

project set-up to define any tree species tallied in a project locality that did not exist in the South

Climate Zone data base. For example, Chinese tupelo (Nyssa sinensis)—which is not in the

modeling data base—would be best matched as blackgum (Nyssa sylvatica) because they are

similar in stature, form, and growth rate.

Once the project files were prepared, Streets assessment reports were generated for each locality.

Two report types were provided by the Streets application: a resource structural analysis (which

calculates street tree abundance, composition, condition, and land-use occupation) and a benefit-

36

cost analysis (which calculates gross ecosystem services, replacement value, and aesthetic/real

estate contributions). To assign a value to the structural resource, the Council of Tree and

Landscape Appraisers (CTLA) guidelines for tree valuation were followed. In this procedure,

the estimated value of the tree is determined with a formula that uses the base price of a

replacement nursery tree, and adds value to the base price by factoring in the tree (being

appraised) species, condition of the tree, location of the tree, and the diameter of the tree (CTLA

2000). These characteristics of the tree allow for an accurate representation of the value of the

tree that is being appraised.

To analyze the discrepancies between native ash removal by EAB, all native ash trees were

coded as being private trees, except in those municipalities where native ash were present in high

enough numbers to not warrant such a specific code. Added to these impacts were estimates of

potential costs to remove and replace, based on the trunk formula method of the CTLA, the

native ash component of each street tree population. Based on conversations with contractors

from the Virginia Department of Transportation, the range for removing trees varies from $98

per tree under 15 cm to nearly $1,400 per tree for tree diameters that reach over 100 cm. By

summing these costs with the lost ecosystem and aesthetic/real estate benefits, an estimate of the

total economic impact of EAB outbreak for each locality was calculated.

In addition to estimating EAB economic impacts, correlation analyses were performed in an

effort to better understand the relationship of native ash abundance in municipal street tree

populations to the characteristics of municipalities in Virginia. Several bio-physical and socio-

37

demographic variables hypothesized to be related to native ash abundance were tabulated for

each locality in the study and compiled into a single database for the fourteen study sites. After

screening the attribute data to ensure normal distribution, pairwise correlation analysis between

each municipal attribute and native ash relative abundance (% of total tree population) was

performed using JMP statistical software (SAS Institute Inc., Cary, NC). All statistical tests

were performed at the α=0.05 significance level.

38

CHAPTER 4 – RESULTS

4.1 Structure, Function, and Value of Municipal Street Trees

Street tree population estimates ranged from 868 in Lexington to 46,792 in the state capitol of

Richmond (Table 4.1.1). Across all municipalities, street tree populations averaged 14,798 trees.

On a per-capita basis, Arlington had the least amount of street trees per person (0.09). In

contrast, Fredericksburg had the highest per-capita street tree abundance (0.90). On average,

each municipality contained 0.32 street trees per capita.

39

Table 4.1.1: Street tree population attributes and associated values for fourteen Virginia municipalities based on analysis of field

inventory data using i-Tree Streets assessment software. For municipalities assessed with sample inventories, standard errors of the

attributes and values are shown in parentheses.

Municipality

Street Tree

Population

Top-Five

Importance

Valuea,b

(%)

CO2 Storage

Quantityb (kg)

CO2 Storage

Value ($)

Structural Replacement

Valuec ($)

Abingdon 1,193 (n/a) 50 1,818,574 30,070 (n/a) 2,829,814 (n/a)

Arlington 20,355 (n/a) 45 18,886,325 312,279 (n/a) 35,616,064 (n/a)

Charlottesville 5,988 (n/a) 32 12,642,818 209,045 (n/a) 28,892,459 (n/a)

Fredericksburg 20,792 (1,675) 42 20,237,274 334,617 (28,402) 48,940,606 (4,154,024)

Harrisonburg 6,985 (662) 26 6,937,249 114,705 (10,875) 12,889,427 (1,222,059)

Leesburg 3,088 (n/a) 30 2,339,793 38,688 (n/a) 5,297,012 (n/a)

Lexington 868 (n/a) 43 2,081,745 34,421 (n/a) 3,231,249 (n/a)

Lynchburg 26,820 (2,088) 31 27,260,859 450,749 (34,978) 60,480,330 (4,693,236)

Martinsville 3,566 (433) 39 3,463,036 57,260 (6,959) 7,075,858 (859,900)

Radford 12,724 (1,157) 33 16,973,730 280,655 (25,519) 32,728,620 (2,975,864)

Richmond 46,792 (3,645) 57 117,638,538 1,945,115 (151,529) 211,889,829 (16,506,728)

Roanoke 43,371 (3,433) 35 76,340,639 1,262,267 (99,917) 33,096,528 (2,619,825)

Williamsburg 5,640 (550) 40 7,566,145 125,104 (12,199) 19,061,256 (1,858,617)

Winchester 8,990 (774) 57 18,184,381 300,673 (25,875) 33,228,972 (2,859,631) aSum of the importance values for the five most important species (i.e., largest importance values) in the municipality. Importance

value is calculated by summing the estimated leaf area, canopy cover, and stem count for all street trees, then determining the

relative percentage that each species accounts for these metrics, and then averaging the values of the three metrics for each species. bi-Tree Streets does not compute a standard error for the estimate of importance value or carbon storage quantity.

cStructural replacement value is calculated by i-Tree Streets using the trunk formula appraisal method of the Council of Tree and

Landscape Appraisers whereby the worth of an existing tree is based on the cost to plant a quantity of nursery trees of equal trunk

basal area.

40

Species diversity of the municipal street tree populations was investigated using a metric called

importance value (IV), which accounts for both the relative abundance and the relative biomass

of each species in the population. IV is calculated by first summing the stem count, leaf area,

and canopy cover (area under tree dripline) for all species and then determining the percentage of

each summed attribute that is accounted for by each species. The percentage value for each of

the three structural attributes is then averaged for each species to derive the IV (McPherson et al.

2005). Like relative abundance of stems, the higher the IV, the more common the species is in a

particular urban forest. However, IV gives a better indication of the dominance of particular

species because it accounts for both tree number and tree size. Summing IVs for the five most

important species in a locality provides insight on structural diversity and therefore population

stability and resiliency (McPherson et al. 2005).

In the studied localities, summed top-five IVs ranged from 26% (out of 100% total species IV in

street tree population) in Harrisonburg to 57% in Richmond and Winchester (Table 4.1.1). Top-

five IVs averaged 40% across all fourteen localities. Looking more closely at the species

comprising the top-five IVs, the genera Acer and Quercus dominated the important species

across all municipalities (Table 4.1.2). Every municipality had at least one Acer species among

the top-five, and eight of fourteen localities had at least one top-five Quercus species. In four

localities, total IVs of the Acer species among the top-five exceeded 20%: Abingdon,

Fredericksburg, Richmond, and Winchester. Both Charlottesville and Richmond had Quercus

species among the top-five with IVs totaling nearly 30%. In total, there were 25 instances of

Acer species among the top-five IVs and 12 instances of Quercus species across the studied

localities. Only two localities (Abingdon and Roanoke) had a Fraxinus species among the top-

41

five most important species. Nine localities exhibited a situation where one species garnered

over 10% of the total IV.

42

Table 4.1.2: Five most important street tree species populating fourteen Virginia municipalities based on analysis of field inventory

data using i-Tree Streets assessment software. Importance values are calculated by averaging the % leaf area, % canopy cover, and %

stem count that each species accounts for in the total tree population.

Municipality

#1 Important

Species (IV)

#2 Important

Species (IV)

#3 Important

Species (IV)

#4 Important

Species (IV)

#5 Important

Species (IV)

Abingdon Acer saccharum

(17)

Fraxinus americana

(10)

Pinus strobus

(9)

Acer saccharinum

(7)

Cornus florida

(6)

Arlington Quercus phellos

(13)

Acer rubrum

(13)

Quercus palustris

(9)

Acer saccharinum

(5)

Quercus alba

(5)

Charlottesville Acer rubrum

(8)

Pinus strobus

(7)

Cornus florida

(6)

Quercus alba

(6)

Acer saccharum

(5)

Fredericksburg Acer rubrum

(15)

Acer saccharum

(14)

Liquidambar styrac.

(5)

Quercus phellos

(5)

Pyrus calleryana

(4)

Harrisonburg Ulmus pumila

(6)

Pyrus calleryana

(5)

Quercus phellos

(5)

Juglans nigra

(5)

Acer platanoides

(5)

Leesburg Morus rubra

(8)

Acer rubrum

(6)

Cornus kousa

(6)

Quercus palustris

(5)

Pyrus calleryana

(5)

Lexington Acer saccharum

(13)

Ulmus americana

(9)

Platanus occident.

(8)

Juglans nigra

(7)

Acer negundo

(5)

Lynchburg Acer rubrum

(8)

Liriodendron tulipif.

(8)

Robinia psuedoacac.

(6)

Cornus florida

(4)

Acer saccharum

(4)

Martinsville Quercus alba

(9)

Acer rubrum

(8)

Cornus florida

(8)

Quercus falcata

(8)

Liriodendron tulipif.

(6)

Radford Pinus strobus

(11)

Acer rubrum

(6)

Acer saccharinum

(6)

Ulmus pumila

(6)

Acer platanoides

(5)

Richmond Quercus phellos

(15)

Quercus palustris

(15)

Acer saccharum

(13)

Acer rubrum

(8)

Zelkova serrata

(6)

Roanoke Acer saccharum

(14)

Ulmus pumila

(7)

Fraxinus americana

(5)

Acer platanoides

(5)

Pinus strobus

(5)

Williamsburg Lagerstroemia spp.

(10)

Quercus phellos

(10)

Acer rubrum

(8)

Pinus taeda

(7)

Juniperus virginiana

(5)

Winchester Acer saccharum

(21)

Acer platanoides

(13)

Platanus occident.

(12)

Ulmus pumila

(6)

Pyrus calleryana

(5)

43

Based on the assessed municipalities, Virginia‘s street trees are in favorable health overall (Table

4.1.3). Averaged across localities, 89% of the street trees were rated as fair or good health.

Street trees were rated as good health most frequently in Winchester (59% of trees) and least

frequently in Martinsville (22% of trees). Radford had the highest proportion of street trees rated

as dead or dying (3.4%) whereas only 0.1% of Charlottesville‘s street trees were rated as such.

On average, about 10% of the street tree populations were rated as dead, dying, or poor health.

Table 4.1.3: Condition of street trees in fourteen Virginia municipalities based on analysis of

field inventory data using i-Tree Streets assessment software. Condition ratings were determined

through visual evaluation of tree health and vitality only. Values are expressed in terms of

relative abundance (% of total stem count in municipality) for each condition class.

Condition Rating (% of Total)

Municipality Dead Poor Fair Good

Abingdon 0.6 11.0 59.4 29.0

Arlington 2.0 13.6 65.3 19.1

Charlottesville 0.1 4.4 49.6 45.9

Fredericksburg 2.3 11.9 31.3 54.5

Harrisonburg 1.3 9.9 69.7 19.1

Leesburg 2.2 11.4 36.5 49.9

Lexington 1.3 10.1 21.3 67.3

Lynchburg 1.5 6.6 45.8 46.1

Martinsville 1.4 7.7 69.1 21.8

Radford 3.4 8.2 34.4 54.0

Richmond 2.6 10.0 35.1 52.3

Roanoke 2.4 12.0 41.7 43.9

Williamsburg 0.8 5.5 39.8 53.9

Winchester 0.3 3.1 37.8 58.8

Monetary worth of the structural assets in these street tree populations was assessed using i-Tree

Streets‘ calculations of carbon storage and of replacement value. Total street tree carbon storage

in these localities was estimated at over 332 million kilograms, a structural asset valued at nearly

44

$5.5 million (Table 4.1.1). Carbon storage ranged from about 1.8 million kilograms in Abingdon

(valued at $30,000) to about 117 million kilograms in Richmond (valued at nearly $2 million).

Average street tree carbon storage in each municipality was over 23 million kilograms and

averaged $392,000 in value. Total replacement value of street trees in these localities ranged

from $2.8 million in Abingdon to $211 million in Richmond (Table 4.1.1). The average

replacement value across all municipalities was about $38 million and the total replacement

value for all municipalities was over $535 million.

Functional benefits of street trees assessed in the studied localities included aesthetic

enhancements, stormwater interception, energy conservation, carbon dioxide sequestration, and

air pollution reduction. For ecological benefits (other than aesthetics), i-Tree Streets calculated

both the quantity of benefits (referred to as ―resource units‖ in Table 4.1.4) as well as the

monetary worth of these benefits. Because costs of street tree management could not be obtained

from every locality for this study, monetary worth of all functional benefits are reported on a

gross basis (i.e., the management costs were not deducted from the benefits valuation). Aesthetic

benefits of street trees in the studied localities were appreciable, totaling over $9.4 million. On

average, each locality‘s street trees were estimated to provide over $675,000 in aesthetic

enhancements to real estate. Richmond had the highest aesthetic benefit, close to $3 million, and

Abingdon had the least at $26,000.

Street trees mitigate stormwater runoff by intercepting rain that might otherwise fall upon

impervious surfaces and flow to stormwater drainage systems, thereby reducing the volume of

45

water that must be handled by this infrastructure. On average, over 129,000 cubic meters of

stormwater were estimated to be intercepted annually by street trees in each locality, valued at

over $339,000 (Table 4.1.4). An Olympic-sized swimming pool contains roughly 2,500 cubic

meters of water. Richmond had the highest annual benefit from stormwater mitigation at $1.64

million whereas the lowest annual benefit was estimated for Abingdon at about $25,000. In

total, street trees in these Virginia municipalities were estimated to mitigate over 1.8 million

cubic meters of stormwater annually at a gross value of close to $5 million.

Energy conservation estimates were based on street tree reductions in natural gas usage for

heating in winter and electricity usage for air conditioning in summer. Richmond had the largest

overall energy conservation benefit, with street trees conserving over 33,000 gigajoules of

electricity annually at a value of about $521,000 (Table 4.1.4). Abingdon had the smallest

energy benefit with street trees conserving 552 gigajoules of electricity annually at a value of

$9,000. Average annual energy conservation benefits provided by street trees in these

municipalities were estimated at about 7,000 gigajoules, with gross value of over $118,000. In

total, street trees in these localities were estimated to conserve over 100,000 gigajoules of energy

annually at a value of nearly $1.7 million. One barrel of crude oil (159 liters) contains about 6.1

gigajoules of potential energy.

Carbon dioxide sequestration estimates included both net sequestration by trees (photosynthesis

minus respiration) and avoided emissions from power plants due to street tree reduction of

building energy usage. On average, over 2 million kilograms of carbon dioxide were estimated

46

to be sequestered annually by street trees in these localities at a gross value of nearly $35,000

(Table 4.1.4). Street trees in Richmond sequestered the highest amount of carbon dioxide

annually, around 9 million kilograms (valued at about $153,000), whereas street trees in

Abingdon sequestered just over 139,000 kilograms (valued at about $2,000). In total, street trees

in these localities sequestered over 29 million kilograms of carbon annually at a gross value of

about $486,000. The average American is responsible for about 19,000 kilograms of carbon

dioxide emissions annually.

Estimates of air pollution reduction accounted for pollutants both intercepted by trees (O3, NO2,

SO2, and PM10) and avoided emissions (NO2, SO2, PM10, and VOCs) from power plants due to

street tree reduction of building energy usage. From this reduction calculation was subtracted

the emissions of biogenic volatile organic compounds (VOCs) by street trees. Thus in some

instances, the net air pollution reduction (in resource units) by street trees was a negative value,

meaning that trees were net emitters of air pollution. Depending on species composition and size

distribution and on pricing of individual air pollutants, it was possible to have a negative value

for both the resource units and monetary worth (or one or the other) in individual localities.

Richmond‘s street trees were the only net emitters of air pollution (1,422 kilograms annually),

yet eight out of fourteen localities had net negative values for pricing of air pollution benefits.

Roanoke‘s street trees removed the largest amount of pollutants (over 5,000 kilograms), but had

negative value of over $21,000. Fredericksburg had the second highest annual pollution

reduction at 3,292 kilograms and also had a positive monetary impact at about $13,000, which

was the highest of any locality.

47

Summed across all functional benefit types, street trees in these fourteen Virginia localities were

estimated to provide over $16 million in gross annual benefits (Table 4.1.5), or roughly $1.1

million per locality. Richmond‘s street trees provide the highest gross annual benefits, valued at

nearly $5 million, whereas Abingdon‘s street trees only provide about $62,000 in benefits. On a

per-tree basis, annual street tree benefits averaged about $74 per tree, ranging from about $32 per

tree in Martinsville to about $109 per tree in Winchester. On a per-capita basis, street tree

benefits averaged about $23 per person, ranging from about $5 per person in Leesburg to about

$73 per person in Fredericksburg.

48

Table 4.1.4: Gross annual benefits of street trees in fourteen Virginia municipalities based on

analysis of field inventory data using i-Tree Streets assessment software. Resource units are

shown in shaded lines and their monetary worth is shown in un-shaded lines. i-Tree does not

compute a standard error for resource units or for values calculated from complete inventories.

Aesthetic

Benefits

(n/a)

Stormwater

Interception

(m3)

Energy

Conservation

(GJ)

Net CO2

Sequestration

(kg)

Net Air

Pollution Red.

(kg)

Municipality

$

×

1000

SE

×

1000

$

×

1000

SE

×

1000

$

×

1000

SE

×

1000

$

×

1000

SE

×

1000

$

×

1000

SE

×

1000

Abingdon 26 25 9 2 0.2

resource units 9,387 552 139,278 175

Arlington 1,699 280 102 31 -5.1

resource units 106,946 6,708 1,887,688 1,411

Charlottesville 350 168 58 17 0.4

resource units 64,111 3,746 1,007,278 1,131

Fredericksburg 1,193 101 329 28 132 11 37 3 13.2 1.1

resource units 125,729 8,663 2,234,501 3,292

Harrisonburg 207 20 103 10 40 4 12 1 0.5 0.1

resource units 39,250 2,607 731,176 754

Leesburg 147 34 14 4 -0.1

resource units 12,886 901 238,273 231

Lexington 48 27 9 3 -0.4

resource units 10,208 552 156,323 131

Lynchburg 624 48 412 32 159 12 48 4 -1.4 -0.1

resource units 157,698 3,276 2,881,381 2,745

Martinsville 39 5 50 6 19 2 6 1 0.2 0.1

resource units 19,038 1,220 336,633 348

Radford 319 29 243 22 88 8 27 2 1.9 0.2

resource units 92,790 5,733 1,620,344 1,776

Richmond 2,827 220 1,642 128 521 41 153 12 -148.7 -11.5

resource units 627,773 33,729 9,270,269 -1,422

Roanoke 1,070 85 1,062 84 373 30 109 9 -21.1 -1.7

resource units 406,039 24,271 6,597,462 5,197

Williamsburg 296 29 111 11 40 4 11 1 -4.7 -0.5

resource units 42,487 2,603 665,547 408

Winchester 617 53 262 23 91 8 26 2 -11.5 -1.0

resource units 100,113 5,923 1,546,924 773

49

Table 4.1.5: Gross annual benefits (ecosystem services and aesthetic/real estate enhancements)

provided by street trees in fourteen Virginia municipalities based on analysis of field inventory

data using i-Tree Streets assessment software. Values calculated from complete inventories do

not have a standard error.

Total Annual Benefits

Annual Benefits

Per Tree

Annual Benefits

Per Capita

$ SE $ SE $ SE

Abingdon 61,589 – 51.63 – 7.69 –

Arlington 2,107,244 – 103.52 – 9.69 –

Charlottesville 592,338 – 98.92 – 14.03 –

Fredericksburg 1,703,803 144,617 81.95 6.96 73.46 6.24

Harrisonburg 361,757 34,299 51.79 4.91 8.01 0.76

Leesburg 198,568 – 64.30 – 4.85 –

Lexington 85,003 – 97.93 – 12.32 –

Lynchburg 1,241,733 96,358 46.30 3.59 16.80 1.30

Martinsville 113,117 13,747 31.72 3.85 7.73 0.94

Radford 678,477 61,691 53.32 4.85 41.92 3.81

Richmond 4,995,158 389,135 106.75 8.32 24.43 1.90

Roanoke 2,593,302 205,278 59.79 4.73 27.45 2.17

Williamsburg 453,955 44,264 80.49 7.85 35.66 3.48

Winchester 983,585 84,646 109.41 9.42 37.37 3.22

4.2 Native Ash Composition in Street Tree Populations

Three species of native ash (Fraxinus americana, F.nigra, and F. pennsylvanica) were

inventoried in the fourteen studied Virginia localities. F. americana was inventoried in 14 out of

14 municipalities, F. pennsylvanica in 12 out of 14, and F. nigra in 2 out of 14. In the studied

localities, tree species of the genus Fraxinus were very uncommon in the street tree population.

Combined relative abundance of native ash species ranged from 0.1% in Williamsburg to 5.84%

in Winchester and averaged 2.0% across all localities (see Table 4.2.1). Importance values were

also calculated using Streets. Only two municipalities had native ash as one of the top five most

important species. Abingdon‘s native ash street trees tallied approximately 10% of the most

important species. Although having low relative abundance of native ash, Richmond (3%) and

50

Roanoke (2.6%) still had appreciable ash populations estimated at 1,417 and 1,112 trees,

respectively. Overall, an estimated 4,558 native ash trees reside in the street tree populations of

the fourteen studied localities.

Table 4.2.1: Abundance and importance of native ash (Fraxinus spp.) street trees in fourteen

Virginia municipalities based on analysis of field inventory data using i-Tree Streets assessment

software. For municipalities assessed with sample inventories, standard error of native ash

abundance is shown in parentheses. Values calculated from complete inventories do not have a

standard error.

Municipality

Native Ash

Abundance

(count)

Native Ash

Relative Abundancea

(% of Total)

Native Ash

Importance Valuea,b

(% of Total)

Abingdon 42 (n/a) 3.5 11.3

Arlington 275 (n/a) 1.4 1.0

Charlottesville 113 (n/a) 1.9 2.9

Fredericksburg 257 (113) 1.2 1.3

Harrisonburg 66 (31) 0.9 3.5

Leesburg 68 (n/a) 2.2 4.3

Lexington 16 (n/a) 1.8 2.9

Lynchburg 490 (136) 1.8 3.4

Martinsville 17 (11) 0.5 0.2

Radford 160 (53) 1.3 1.5

Richmond 1,417 (406) 3.0 3.8

Roanoke 1,112 (605) 2.6 5.8

Williamsburg 8 (7) 0.1 0.3

Winchester 517 (169) 5.8 4.7 ai-Tree Streets does not compute a standard error for the estimate of relative abundance or

importance value.

bSum of the importance values for native ash species in the municipality. Importance value is

calculated by summing the estimated leaf area, canopy cover, and stem count for all street trees,

then determining the relative percentage that native ash species accounts for these metrics, and

then averaging the values of the three metrics for native ash species.

Of the fourteen municipalities, six assessments showed that the majority of the street tree

population was greater than 30 cm in diameter (Table 4.2.2). Only four municipalities showed

51

the majority of the street tree population as being less than 15 cm in diameter. Relative

Performance Index (RPI) is a comparison between a single tree species and all other species in

the street tree population based on relative condition rating in the inventory. If the RPI is below

1.00, then trees of that taxon are generally in poorer condition than the average tree in the

population. If the RPI is above 1.00, then trees of that taxon are in better condition than the

average tree in the population. On average, native ash street trees are performing just slightly

below other street trees (Table 4.2.2) with an average RPI of 0.97. Harrisonburg‘s native ash

street trees are performing the best of all studied localities (RPI of 1.02) and three localities

(Abingdon, Lexington, and Richmond) share the same RPI for native ash street trees of 0.90.

52

Table 4.2.2: Native ash (Fraxinus spp.) street tree attributes and associated values for fourteen Virginia municipalities based on

analysis of field inventory data using i-Tree Streets assessment software. Values calculated from complete inventories do not have a

standard error.

Trunk Diameter Classb

(% of Native Ash Trees)

CO2 Storage

Quantityb

CO2 Storage

Value

Structural

Replacement Valuec

Municipality RPIa

0–15 cm 15–30 cm > 30 cm kg $ SE $ SE

Abingdon 0.90 38.1 2.4 59.5 352,326 5,826 – 377,095 –

Arlington 1.00 71.3 17.5 11.2 144,492 2,389 – 261,188 –

Charlottesville 0.98 8.8 29.2 62.0 436,627 7,219 – 776,218 –

Fredericksburg 1.00 71.6 8.2 20.2 319,896 5,289 2,337 580,988 256,669

Harrisonburg 1.02 0 37.9 62.1 431,951 7,142 3,325 461,712 214,929

Leesburg 1.00 14.7 54.5 30.9 134,241 2,220 – 312,645 –

Lexington 0.90 12.5 31.3 56.2 73,632 1,217 – 114,989 –

Lynchburg 1.00 20.4 43.3 36.3 1,325,653 21,919 6,073 2,290,352 634,556

Martinsville 0.94 100 0 0 749 12 8 4,675 3,088

Radford 1.00 26.3 31.3 42.4 242,013 4,002 1,334 492,915 164,289

Richmond 0.90 9.1 20.0 70.9 5,250,422 86,814 24,856 9,038,222 2,587,807

Roanoke 1.00 29.1 16.4 45.5 7,111,173 117,581 63,911 1,603,326 871,490

Williamsburg 1.00 0 0 100 28,528 472 440 41,217 38,430

Winchester 1.00 57.6 19.1 23.3 871,278 14,406 4,710 1,341,406 438,524 aRelative Performance Index (RPI) > 1 indicates that native ash are in better condition than the typical street tree in the municipality

and < 1 indicates that native ash are in poorer condition than the typical street tree in the municipality. RPI shown is the weighted

average for all native ash species in the municipality. bi-Tree Streets does not compute a standard error for the estimate of trunk diameter class or carbon storage quantity.

cStructural replacement value is calculated by i-Tree Streets using the trunk formula appraisal method of the Council of Tree and

Landscape Appraisers whereby the worth of an existing tree is based on the cost to plant a quantity of nursery trees of equal trunk

basal area.

53

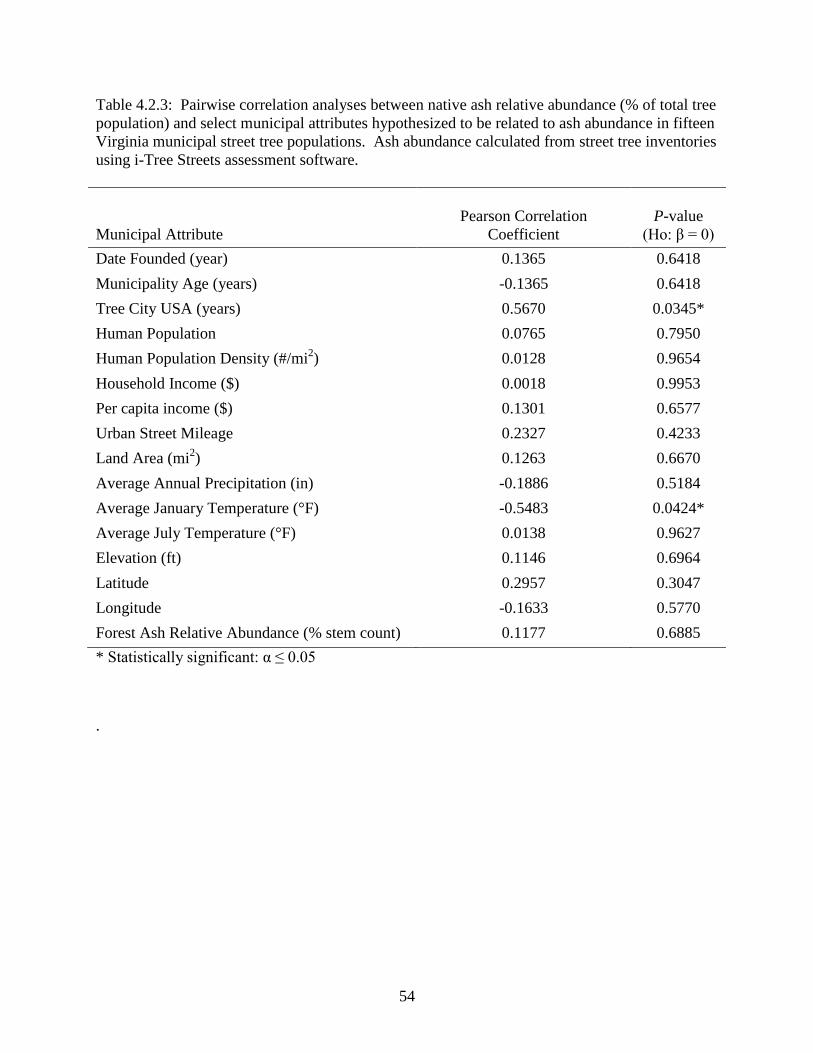
To gain insight on factors that might influence native ash abundance in Virginia‘s street tree

populations, multivariate correlation analyses were performed between native ash relative

abundance (% of total street tree count) and sixteen municipal characteristics ranging from the

date of foundation to demographic and environmental information. Within the fourteen

municipalities studied, two significant correlations (P<0.05) were found. A positive, significant

correlation was found between relative ash abundance and Years as a Tree City USA. A

negative, significant correlation was determined for relative native ash abundance and average

January temperature (see Table 4.2.3)

54

Table 4.2.3: Pairwise correlation analyses between native ash relative abundance (% of total tree

population) and select municipal attributes hypothesized to be related to ash abundance in fifteen

Virginia municipal street tree populations. Ash abundance calculated from street tree inventories

using i-Tree Streets assessment software.

Municipal Attribute

Pearson Correlation

Coefficient

P-value

(Ho: β = 0)

Date Founded (year) 0.1365 0.6418

Municipality Age (years) -0.1365 0.6418

Tree City USA (years) 0.5670 0.0345*

Human Population 0.0765 0.7950

Human Population Density (#/mi2) 0.0128 0.9654

Household Income ($) 0.0018 0.9953

Per capita income ($) 0.1301 0.6577

Urban Street Mileage 0.2327 0.4233

Land Area (mi2) 0.1263 0.6670

Average Annual Precipitation (in) -0.1886 0.5184

Average January Temperature (°F) -0.5483 0.0424*

Average July Temperature (°F) 0.0138 0.9627

Elevation (ft) 0.1146 0.6964

Latitude 0.2957 0.3047

Longitude -0.1633 0.5770

Forest Ash Relative Abundance (% stem count) 0.1177 0.6885

* Statistically significant: α ≤ 0.05

.

55

Table 4.2.4: Gross annual benefits of native ash (Fraxinus spp.) street trees in fourteen Virginia

municipalities based on analysis of inventory data using i-Tree Streets software. Resource units

are shown in shaded lines and their monetary worth is shown in un-shaded lines. i-Tree does not

compute a standard error for resource units or for values calculated from complete inventories.

Aesthetic

Benefits

(n/a)

Stormwater

Interception

(m3)

Energy

Conservation

(GJ)

Net CO2

Sequestration

(kg)

Net Air

Pollution Red.

(kg)

Municipality

$

×

1000

SE

×

1000

$

×

1000

SE

×

1000

$

×

1000

SE

×

1000

$

×

1000

SE

×

1000

$

×

1000

SE

×

1000

Abingdon 2.4 3.8 0.8 0.2 -0.9

resource units 1,445 50.9 12,698 -52

Arlington 18.5 2.3 0.9 0.3 -0.3

resource units 892 59.6 16,455 -5.7

Charlottesville 12.0 5.6 1.6 0.5 -1.1

resource units 2,131 100 27,962 -51.2

Fredericksburg 14.4 6.4 4.5 2.0 1.4 0.6 0.4 0.2 -0.8 0.3

resource units 1,720 90.5 25,158 -31.7

Harrisonburg 6.0 2.8 5.0 2.3 1.2 0.6 0.3 0.2 -1.1 -0.5

resource units 1,919 76.4 20,510 -59.2

Leesburg 7.5 1.8 0.6 0.2 -0.3

resource units 696 37.1 10,522 -13.1

Lexington 1.6 0.9 0.2 0.1 -0.2

resource units 349 12.2 4,215 -9.4

Lynchburg 22.8 6.3 17.5 4.8 5.0 1.4 1.5 0.4 -3.3 -0.9

resource units 6,672 326 92,011 -149

Martinsville 0.1 0.1 0.02 0.01 0.02 0.01 0.01 0.003 0.003 0.002

resource units 9.0 1.3 297 0.5

Radford 6.6 2.2 3.8 1.3 1.3 0.4 0.4 0.1 -0.6 -0.2

resource units 1,456 86.9 25,402 -18

Richmond 122.6 35.1 71.2 20.4 20.4 5.8 6.2 1.8 -13.4 -3.8

resource units 27,233 1,321 376,941 -601

Roanoke 52.3 28.4 81.5 44.3 18.9 10.2 5.2 2.8 -18.8 -10.2

resource units 31,145 1,191 315,901 -1,003

Williamsburg 1.3 1.2 0.4 0.4 0.1 0.1 0.04 0.03 -0.08 -0.07

resource units 164 8.6 2,484 -3.1

Winchester 28.1 9.2 11.2 3.7 3.3 1.1 1.0 0.3 -2.1 -0.7

resource units 4,293 216 58,770 -92

56

Table 4.2.5: Gross annual benefits (ecosystem services and aesthetic/real estate enhancements)

provided by native ash (Fraxinus spp.) street trees in fourteen Virginia municipalities based on

analysis of field inventory data using i-Tree Streets assessment software. Values calculated from

complete inventories do not have a standard error.

Total Annual Benefits

Annual Benefits

Per Tree

Annual Benefits

Per Capita

$ SE $ SE $ SE

Abingdon 6,292 – 149.81 – 0.79 –

Arlington 21,694 – 78.89 – 0.10 –

Charlottesville 18,528 – 163.96 – 0.44 –

Fredericksburg 20,009 8,840 77.86 34.40 0.86 038

Harrisonburg 11,472 5,340 173.82 80.91 0.25 0.12

Leesburg 9,733 – 143.13 – 0.24 –

Lexington 2,657 – 166.07 – 0.39 –

Lynchburg 43,449 12,038 88.67 24.57 0.59 0.16

Martinsville 123 81 7.24 4.78 0.01 0.01

Radford 11,605 3,868 72.53 24.17 0.72 0.24

Richmond 207,046 59,281 146.12 41.84 1.01 0.29

Roanoke 139,078 75,596 125.07 67.98 1.47 0.80

Williamsburg 1,779 1,659 222.38 207.34 0.14 0.13

Winchester 41,547 13,582 80.36 26.27 1.58 0.52

4.3 Potential Impacts of Native Ash Loss on Street Tree Population

By analyzing the native ash trees located in the street tree population, potential environmental

and economic impacts of EAB could be quantified. It is estimated that these fourteen

municipalities could lose a total of 4,558 native ash trees should there be an EAB outbreak and

no intervention performed. Losing these trees means losing a range of functional benefits and

their associated monetary values for the municipalities.

57

On average, each locality would expend an additional 181 gigajoules of energy (valued at

$3,900) annually in the absence of native ash street trees for each municipality (see Table 4.2.5).

Monetary loss for annual energy conservation ranges from $20 in Martinsville to $20,400 in

Richmond. In total, loss of native ash street trees to EAB would result in an additional 2,500

gigajoules of annual energy consumption (valued at about $56,000).

Should native ash street trees be suddenly lost to EAB outbreak, these municipalities will also

face managing an additional 80,000 cubic meters of non-intercepted rainfall annually (valued at

about $209,000) (Table 4.2.4). This means each municipality will need to prepare for, on

average, over 5,700 cubic meters of stormwater each year. Roanoke could face the largest

increase in runoff (over 31,000 cubic meters) and Martinsville the least (nine cubic meters). The

economic impact from loss of stormwater mitigation benefits ranges from $20 per year in

Martinsville to over $71,200 in Richmond.

The loss of native ash street trees would result in reduced accumulations of carbon and

diminished aesthetic benefits to real estate value. In total, native ash street trees sequester nearly

990,000 kilograms of carbon each year. This equates to an average of 70,000 kilograms per

municipality (valued at $1,100) per municipality, or over $16,000 in total. Richmond would lose

the highest amount of carbon sequestration (376,000 kilograms) and Martinsville would lose the

least amount (297 kilograms). On average, each municipality could lose up to $21,000 in

aesthetic benefits. Richmond has the greatest estimated impact of aesthetic damage, valued at

58

over $122,000. Martinsville has the least estimated aesthetic damage, valued near $100. In total,

aesthetic benefits could be reduced by about $296,000 across all municipalities.

Summed across all functional benefit types, each native ash street tree in the studied localities

provides about $121 in gross annual benefits on average (Table 4.2.5). Should EAB extirpate all

native ashes, these localities stand to lose over $535,000 in gross annual benefits, or roughly

$38,200 per locality (Table 4.2.5). Richmond faces the largest loss at over $207,000 in annual

benefits while Martinsville will lose just under $125 per year in benefits. On average, each

municipality could faces losses close to $38,200 in annual benefits.

In addition to negatively impacting functional benefits of street trees, EAB would also deplete

native ash trees as structural assets in the municipal infrastructure. One critical aspect of this

infrastructure is the carbon stored in native ash street trees. Nearly 17 million kilograms of

stored carbon, valued at over $276,000, could be lost from these ash trees should they be

removed and the wood waste not utilized in wood products or by similar carbon-securing means.

Potential losses of stored carbon range from about 750 kilograms in Martinsville (valued at

$120) to over 7.1 million kilograms in Roanoke (valued at about $117,000). In addition, the

replacement of these lost street trees would be vital to restoring green infrastructure and its

associated functional benefits. Replacement values of native ash trees, calculated from Streets,

range from about $4,600 in Martinsville to over $9 million in Richmond. On average, each

municipality would need to replace around $1.2 million in street trees, totaling across all

municipalities nearly $17.7 million dollars.

59

4.4 Potential Costs of Removing and Replacing Native Ash Trees

Under a worst-case scenario, municipalities would undertake no interventions to control an EAB

outbreak and all native ash street trees would eventually succumb to the pest. Once dead, these

trees could become hazardous to vehicular and pedestrian traffic. Utility lines could also be

damaged by falling dead debris, causing power outages and risking public safety. These

potential consequences would compel municipalities to remove dead trees or risk substantial

liabilities. Localities might also be compelled to proactively remove native ash street trees in

order to slow the spread of EAB or to get a head start on reforestation with non-ash species. As

such, a worst-case scenario might see the complete removal of native ash street trees from

localities within a single year following outbreak. In the fourteen studied localities, it was

estimated that there are a total of 4,558 native ash street trees. Using itemized tree removal

costs from Virginia Department of Transportation contractors for fiscal year 2011, it was

estimated that the total cost of removing all native ash trees in the studied localities would be

nearly $1.75 million (Table 4.4.1), averaging $125,000 for each municipality.

Roanoke would potentially incur the largest expense (over $705,000) and Martinsville the least

expense (nearly $790). Given that the structural replacement value of native ash street trees in

these studied localities was estimated at $17.7 million (see Table 4.2.2), the total mitigation costs

for native ash street tree removal and replacement (assuming replanting at a density that would

instantly replace lost canopy cover) would therefore be $19.45 million. Added to this cost of

mitigating structural losses would be the value of carbon dioxide stored in native ash trees.

Assuming that removed trees were incinerated or chipped (thus resulting in oxidation of carbon

60

stored in their wood), the lost carbon value would be about $277,000 (see Table 4.2.2). This

would bring total losses in structural value as well as mitigation costs to $19.72 million. In

addition to these costs related to the structural assets, the studied localities would also be facing a

near-term loss in annual functional benefits totaling about $535,000 (see Table 4.2.5). As a

result, the studied localities – should they incur the cost of removing and replacing all native ash

trees within a single year – would experience a gross financial impact of about $20.26 million

due to invasion by EAB.

61

Table 4.4.1: Estimated removal cost of native ash (Fraxinus spp.) street trees in fourteen Virginia municipalities. Removal costs are

based on statewide average contractor fee charged per tree by diameter class to Virginia Department of Transportation in fiscal year

2011.

Tree Removal Cost by Trunk Diameter Class ($)

Municipality 0–15 cma 15–30 cm 30–46 cm 46–61 cm 61–76 cm > 76 cm

b Total

Abingdon 784 98 222 352 3,570 23,358 28,384

Arlington 9,604 4,704 3,996 2,816 1,190 4,122 26,432

Charlottesville 490 3,234 5,328 7,744 7,735 15,114 39,645

Fredericksburg 9,016 2,058 0 10,912 5,950 13,740 41,676

Harrisonburg 0 2,450 1,776 2,816 0 34,350 41,392

Leesburg 490 3,626 3,108 352 595 6,870 15,041

Lexington 98 490 444 352 1,785 4,122 7,291

Lynchburg 4,900 20,776 9,990 15,840 26,775 60,456 138,737

Martinsville 784 0 0 0 0 0 784

Radford 2,058 4,900 9,324 2,816 10,115 0 29,213

Richmond 6,321 25,284 85,914 81,664 122,570 248,694 570,447

Roanoke 15,876 17,836 8,880 7,040 71,995 583,950 705,577

Williamsburg 0 0 0 2,816 0 0 2,816

Winchester 14,602 9,702 8,880 14,080 5,950 41,220 94,434 aBecause Virginia Department of Transportation does not contract per-tree removals under 15 cm, the cost used for this class was

half of the per-tree cost of the 15–30 cm class.

bMedian contractor fee for all 15-cm diameter classes over 76 cm was used to estimate per-tree removal cost of this class.

62

CHAPTER 5 – DISCUSSION

5.1 Implications of Native Ash Loss from Emerald Ash Borer

Exotic pests are appearing more rapidly in areas of the United States and becoming a nuisance,

both in the rural and urban environment. Aukema et al. (2010) estimates that nearly 2.5 non-

indigenous pest are brought into the United States each year. As these non-native pests encroach

on native flora, ecosystem relationships are disturbed, benefits are lost, and municipal

governments have had to produce additional funding for managing these infestations. Since its

introduction, EAB has spread to 17 states and has eliminated over 50 million native ash trees

from rural and urban forests (Kovacs et al 2010).

Given its current location in Fairfax County and outside of the city of Winchester, EAB has the

potential to spread throughout the state of Virginia. Kovacs et al. (2010) suggests that EAB

could be widespread in Virginia by 2015 and in all counties of Virginia by 2019. This

suggestion takes into consideration both natural flight patterns and human interaction. Table

4.2.3 also gives insight as to factors that may cause native ash composition in municipalities.

Although these analyses were performed on a small portion of the state, and thus no statewide

inferences can be made, native ash street trees either naturally occur or are planted in areas that

are Tree City USA stewards which have a highly urbanized road system that have a colder

average January temperature (see Table 4.2.3). These factors along with Kovacs formulations

could show a trend as EAB spreads through the Commonwealth of Virginia.

Relative ash abundance in street tree populations in Virginia seems to be low. On average of the

fourteen municipalities in the study, native ash comprises approximately 2% ranging from 0.1%

63

to 5.8%. This follows with evidence from Forest Inventory Analysis (FIA) data provided by the

U. S. Forest Service that relative ash composition is low. This evidence could stem from the

random plot generator of FIA data and spatial infrastructure of urban areas (e.g. random plots

being centered on roadways or buildings). Comparatively, municipalities in Virginia should not

be impacted like Midwestern portions of the United States. Some Midwestern cities and states

will need to remove and replace tens of thousands of native ash street trees which can comprise a

high percentage of their respective street tree population. Relative ash abundance in street tree

populations in mid-western portions of the United States is as high as 36% of the total street tree

population (Ball et al 2007).

Virginia‘s native ash component is not as significant as cities in the Midwest. Sydnor (2007)

estimates Ohio‘s urban forests could lose $7 billion in ecosystem service benefits and removal

costs from EAB invasion due to the proportionally higher amounts of native ash trees located in

the Midwestern portion of the United States. Some factors that could influence the difference

between this relative ash abundance in Virginia and the Midwest are the climactic variations, i.e.

milder winters in Virginia, more precipitation during the growing season, and lower likelihood of

major storm/wind events, parent soil material, and the greater diversity of tree species available

for planting. Many urban tree species are selected because they are able to resist urban stress

factors, thrive in depleted or water inundated soil conditions, and have the ability to grow to

appreciable size and show positive aesthetic characteristics. Native ash trees are capable of

surviving in harsh climate conditions, can grow quickly, withstand urban stressors, produce

beautiful winter characteristics, and thrive in adverse soil conditions.

64

These fourteen street tree populations combine to potentially lose 4,558 native ash street trees.

Native ash that will be removed in these municipalities will tally a loss of over $545,000 in

annual benefits Richmond losing the majority of this figure. Stormwater management will be a

key issue. Richmond has a larger street tree population than Roanoke, yet Roanoke will lose

4,000 extra cubic meters of stormwater abatement benefits; stormwater abatement being the most

lost annual resource for these two municipalities.

Stormwater management is also difficult to manipulate. Once the infrastructure has been

created, it is complicated to upgrade or remove. If stormwater loads are underestimated, or

runoff has increased from urbanization, structures can be inundated and could be compromised.

This management system is not easy to retrofit and accurate measurements of potential loads are

required. Street trees could act as a buffer for peak flow and help infiltration into the soil and

should be taken into consideration for stormwater management for future projects.

The most affected aspect of the municipality, in terms of the constituent of the municipality, is

the real estate contribution street trees provide. As these trees are removed, median home values

should begin to decline. Consumers value trees, and other shrubbery as well, in landscapes, and

will pay a higher home premium to attain this value (Heimlich et al. 2008). As EAB progresses

through the state, home prices may see a sharper decline, especially considering the current

economic recession.

Although Abingdon and Winchester may lose fewer trees, a higher percentage of the street tree

population will need to be replaced. Winchester has the highest reported ash abundance in the

65

studied municipalities. Removing 5.8% of the street tree population could lead to gaps in formal

street lawn areas, stumps located near the roadside, and, overall, detracting from the aesthetic

value of the municipality. Abingdon could lose 3.5% of its street tree population, some of which

are large, mature trees. Nearly 85% of the native ash in Abingdon is larger than 60 centimeters

in diameter. Larger diameter trees have the capacity to impose more damage, as failures begin,

and will need more monies to remove and dispose of the waste properly.

Richmond and Roanoke will be the most affected municipalities by EAB. However, smaller

municipalities will be affected to a lesser extent. Leesburg, Charlottesville, and Lexington are

above the average for percent composition in terms of native ash abundance and will need to

allow for management of this pest.

Relative Performance Index (RPI) estimates native ash species performed at the same level as a

typical municipal street tree, meaning these trees are high in vitality and, essentially, performing

well with other trees in the municipality. Given the reported ―Importance Values‖, native ash

were found to be in top 5 species, for RPI, for two municipalities. Abingdon and Roanoke both

had native ash to be important in terms of leaf area, canopy cover, and stem count. Using

Santamour‘s (1990) rule of 30-20-10 (no proportion of urban forest higher than 30% of one

family, 20% of one genera, and 10% of one species), relative importance values can be viewed in

the same concept. If one species comprises more than 10% of the importance of the entire

population, issues with monocultures could become a factor. Each municipality from this study

had at least one Acer genus in the top 5 of Importance Values. This could be a concern if Asian

long-horned beetle spreads from the Northeast.

66

As these street trees are removed, municipalities will need to be cautious as to which species will

replace native ash street trees. Street tree diversity is a key element to sustaining and managing

the urban forest. If a street tree population contains low species richness, widespread damage

can occur if an insect or a pathogen, infesting a solitary species or genus, is introduced. Using

the urban forest model of species diversity (Santamour 1990), this study could be an opportunity

to evaluate urban forests across the state and begin discussing diversity on a street tree level and

in places where critical management is needed, i.e. hazardous, dying, dead, or structurally poor

trees exist.

Overall, EAB will impact the state, but not to the extent that has occurred in the Midwest.

However, as trees begin to die, removal and replacements costs will begin to be revealed. We

estimate that well over $2 million will be needed to remove EAB-killed trees properly and an

additional $17 million to replenish lost canopy cover. All total, over $20 million will need to be

allocated in these studied localities for EAB management and response.

5.2 Consequences for Municipal Budget and Public Safety

Annual monetary benefits will be lost from native ash trees being removed from street tree

populations across Virginia. Richmond and Roanoke stand to lose the most in both lost

functional benefits and have the largest removal and structural replacement cost. Due diligence

would also dictate the municipality to investigate native ash which are present as non-street trees

in the urban forest.

67

Winchester and Abingdon are smaller municipalities, yet, have the highest relative ash

abundance. Since these municipalities are small, in population, local government may become

strained from removing, replacing, and handling the lost portion of their street tree population.

Richmond and Roanoke will be dealing with a similar situation. These municipalities are large

and have low relative ash abundance; however, the total number of trees that need to be

removed, and replaced, will be more than a thousand street trees, per municipality. These

municipalities will need to begin strategizing an approach to ensure the safety of the public.

As benefits are lost to EAB, homeowners and municipalities will see reductions in ecosystem

service provision. Stormwater runoff will flow on hardscapes at a quicker pace and at higher

volumes. This will cause more resources to be needed to channel or divert runoff into

detention/retention ponds, facilities to filter and clean the water, or into an adjacent

stream/creek/river. Roanoke and Richmond, who have a history of flooding issues, will have to

bear the cost of additional water infiltrating their flood water management system during rain

events. Energy conservation will decrease with more solar radiation interacting with hardscape

surfaces. Summer cooling from canopy shading will be lost and more radiation will enter the

road surface; degrading the hardscape at a quicker pace and causing the municipality to repave

the road surface more often. The potential for carbon storage will be reduced because overall

woody biomass will be subtracted. This could play a role in future carbon sequestration models

for the municipalities.

68

5.3 Response and Recovery from Emerald Ash Borer

In the Midwest, a few communities are trying to be proactive in managing this insect. Many

areas are removing this species from their urban forests to slow the spread of the insect

(Heimlich et al 2008). At www.emeraldashborer.info, there are photographs that show

volunteers stopping tourists at highway rest areas and handing out literature about EAB; even

conducting searches for firewood in recreational vehicles and campers. In Virginia, a position

has been created within the Department of Forestry that oversees all pertinent information about

EAB and its connection to Virginia‘s forests. There are also signs being posted at National

Forest entrances which describe EAB and why firewood needs to remain in the area from where

it originated.

As native ash street trees begin to succumb to EAB, municipalities will be tasked with removing

these trees and disposing waste properly. Standard USFS protocol, when dealing with an

invasive insect infestation, is to quarantine the area so that wood products are not allowed to

move outside the area; and dispose of the waste by burning or treating as necessary. In urban

areas, handling of these dead trees may become hazardous, due to overhead powerlines,

pedestrians, vehicles, and affluent landscapes.

As trees are being removed and disposed of properly, local government will need to begin

reviewing tree species that will replace native ash in the public rights of way. Now, with the

establishment of DED and EAB, urban forest managers need to realize that planning and

planting a variety of tree species is critical in attempting to diversify and effectively manage

69

urban forests. Species richness needs to be reviewed in many localities to discover where

diversity may be lacking.

Tree species selection will play a vital role in the structure, function, and value of the urban

forest. Streets where power lines reside, trees will need to be of smaller stature. Trees in

medians will need to be chosen with no low lying limbs or canopies which touch the ground.

Lastly, this could be a chance to use the urban forest management module of 30% of the urban

forest not be in the same family, 20% not of the same genus, and 10% not of the same species.

5.4 Future Work and Conclusions

Assessing the structure, function, value, and management needs of urban forests are in high

demand. Urban forest assessments are helpful by providing information on management issues

and value on urban trees, which municipalities can use to try and acquire more funding. These

inventories can be altered to suit the goals of the municipality, e.g. improper pruning performed,

pest issues, hazard/health assessment, sidewalk damage from lifting roots, etc., and can provide a

multitude of benefits to the managers of the urban forest.

As information gathering and storing technology improves, these inventories should become

more readily available to smaller municipalities. Many urban forest assessments can be

performed by pencil and paper, later loaded into a computer database; a simple inventory could

be performed with pencil, paper, and a diameter tape or Biltmore stick.

70

As more assessments are performed, inventory programming should become efficient and more

accurate in estimating structure, function, and value. As empirical models become more precise,

emphasis can be placed on the statistical significance. These inventories should lead to better

protocols for inventorying trees and streamline the process.

As this portion of the project is being finished, the second portion will begin. Several more

inventories will be completed and municipalities will still be contacted to determine if additional

street tree inventories exist. This next portion of the project will look more in detail on existing

inventories within this study and check for errors in current datasets. The project will then be

reassessed and a second graduate student will begin to decipher the inner workings of i-Tree

Streets and determine if the statistical models are accurate in determining overall street tree

populations from the random samples taken.

Anecdotal evidence suggests that native ash trees are low in relative abundance throughout the

Commonwealth of Virginia. In the fourteen studied municipalities, relative native ash street tree

composition ranges from 0.1% to 5.8%, averaging approximately 2% of the total street tree

population. This constitutes about 4,500 street trees within the Commonwealth. These street

trees provide ecosystem service benefits that allow for energy conservation, stormwater

mitigation, carbon storage, carbon sequestration, and improve aesthetic and real estate value.

These trees account for approximately $535,000 in annual functional benefits, $277,000 in

71

structural benefits, and have a replacement cost of over $17 million; there could be a total loss of

over $20 million to these select municipalities in Virginia.

This study also found through Importance Values and other data not shown, that municipalities

with high abundance of Acer genera, Richmond, Roanoke, Fredericksburg, and Winchester, in

their street tree populations will need to start preparing plans for Asian long-horned beetle

(Anolophora glabripennis Motschulsky) spread. Also, through the use of pairwise correlation, a

relationship was evident that native ash populations may be more abundant in municipalities that

are Tree City USA with a highly urbanized transportation system that have a lower average

January temperature.

As our economy expands and becomes more global, diligence is key to lessening the odds of

incidental introductions of non-native pests. A lack of species diversity within the urban forest

has shown, repeatedly, that proactive management and planting the right tree in the right place is

paramount in actively managing the differing populations of urban trees. City planners and other

professionals in the Green Industry could use this study to better understand the complex

environment of the urban forest and the other tangible benefits that arise from trees in urban

areas.

72

LITERATURE CITED

Akbari, H., S. Davis, S. Dorsano, J. Huang, and S. Winnett. 1992. Cooling our Communities: A

guidebook on tree planting and light-colored surfacing. US Environmental Protection

Agency, Washington, D.C.

Anulewicz, A. C., D. G. McCullough, and D. L. Cappaert. 2007. Emerald Ash Borer (Agrilus

planipennis) Density and Canopy Dieback in Three North American Ash Species.

Arboriculture and Urban Forestry 33:338-349.

APHIS. 2008. Plant-Pest Information.in USDA, editor., Washington, D.C.

Asaro, C. 2006. Forest Health Review. Virginia Department of Forestry, Charlottesville,

Virginia.

Asaro, C. 2008. Forest Health Review. Virginia Department of Forestry, Charlottesville,

Virginia.

Aukema, J. E., D. G. McCullough, B. V. Holle, A. M. Liebhold, K. Britton, and S. J. Frankel.

2010. Historical Accumulation of Nonindenginous Forest Pests in the Contintental

United States. BioScience 60:886-897.

Ball, J., S. Mason, A. Keisz, D. McCormick, and C. Brown. 2007. Assessing the Hazard of

Emerald Ash Borer and Other Exotic Stressors to Community Forests. Arboriculture and

Urban Forestry 33:350-359.

Bond, J. and B. Buchanan. 2006. Best Management Practices - Tree Inventories. International

Society of Arboriculture, Champaign, IL.

Buhyoff, G. J., L. J. Gautheir, and J. D. Wellman. 1984. Predicting Scenic Quality for Urban

Forests Using Vegetation Measures. Forest Science 30:71-82.

Castrillo, L. A., L. S. Bauer, H. Liu, M. H. Griggs, and J. D. Vandenberg. 2010. Characterization

of Beauveria bassiana (Ascomycota: Hypocreales) isolates associated with Agrilus

planipennis (Coleoptera: Buprestidae) populations in Michigan. Biological Control

54:135.

CTLA 2000. Guide for Plant Appraisal. 9th

ed. Savor, IL. ISA; 134 pp

73

Cregg, B. M. and M. E. Dix. 2001. Tree Moisture Stress and Insect Damage in Urban Areas in

Relation to Heat Island Effects. Journal of Arboriculture 27:8-19.

Day, S. D. and S. B. Dickinson. 2008. Managing Stormwater for Urban Sustainability using

Treees and Structural Soils. Virginia Polytechnic Institute and State University,

Blacksburg, VA.

DeBach, P. (ed.). 1964. Biological Control of Pests and Weeds. Reinhold Publishing Co. New

York. p. 844.

Donovan, G. H. and D. T. Butry. 2010. Trees in the city: Valuing street trees in Portland,

Oregon. Landscape and Urban Planning 94:77-83.

Fairmaire. 1888. Agrilus planipennis. Page 121 in S. o. F. Entomologists, editor. Revue

d'entomologie.

Gilman, E. and G. Knox. 2005. Pruning Type Affects Decay and Structure of Crapemyrtle.

Journal of Arboriculture 31:48-53.

Heimlich, J., T. D. Sydnor, M. Bumgardener, and P. O'Brien. 2008. Attitudes of Residents

Toward Street Trees on Four Streets in Toledo, Ohio, U.S. Before Removal of Ash Trees

(Fraxinus spp.) from Emerald Ash Borer (Agrilus planipennis). Arboriculture and Urban

Forestry 34:47-53.

Heisler, G. M. 1986. Energy swings with trees. Journal of Arboriculture 12:113-125.

Heisler, G. M. 1990. Tree plantings that save energy. Pages 58-62 in Proceedings of the 4th

National Urban Forestry Conference. American Forestry Association, Washington, D.C.

Herms, D. A., D. McCullough, D. Smitley, C. Sadof, R. C. Williamson, and P. L. Nixon. 2009.

Insecticide options for protecting ash trees from emerald ash borer.

i-Tree. 2008. i-Tree User Manual version 2.1. Page 252. Davey Resource Group and USFS,

Kent, Ohio.

Johnston, M. and L. D. Shimada. 2004. Urban Forestry in a Multicultural Society. Journal of

Arboriculture 30:185-192.

74

Kielbaso, J. J. 1990. Trends and Issues in City Forests. Journal of Arboriculture 16:69-76.

Kirwan, J., P. E. Wiseman, and J. Seiler. 2007. Trees on K-12 School Campuses in Virginia.

Virginia Journal of Science 58:3-16.

Kovacs, K. F., R. G. Haight, D. G. McCullough, R. J. Mercader, N. Q. Siegert, and A. M.

Liebhold. 2010. Cost of Potential Emerald Ash Borer Damage in U.S. Communities,

2009-2019. Ecological Economics 69:569-578.

Kozlowski, T. T. 1969. Tree Physiology and Forest Pests. Journal Of Forestry 67:118-123.

Liebhold, A. M., W. L. MacDonald, D. Bergdahl, and V. C. Mastro. 1995. Invasion by Exotic

Forest Pests: A Threat to Forest Ecosystems. Forest Science - Monograph 41:1-50.

Lohr, V., C. Pearson-Mims, H. Tarnai, and D. Dillman. 2004. How Urban Residents Rate and

Rank the Benefits and Problems Associated with Trees in Cities. Journal of Arboriculture

30:28-35.

Maco, S. E. and E. G. McPherson. 2003. A Practical Approach to Assessing Structure, Function,

and Value of Street Tree Populations in Small Communities. Journal of Arboriculture

29:84-97.

Mayo, J. H., T. J. Straka, and D. S. Leonard. 2003. The Cost of Slowing the Spread of Gypsy

Moth (Lepidoptera: Lymantriiadae). Journal of Economic Entomology 96:1448-1454.

McCombs, P. 2001. Making a Stand: The Stately elm, symbol of serenity, fell on hard times in

the last century. Now devotees are making strides to restore its shady reputation. The

Washington Post, Washington, D.C.

McPherson, E. G. 2003. A Benefit-Cost Analysis of Ten Street Tree Species in Modesto,

California, U.S. Journal of Arboriculture 29:1-8.

McPherson, G., J. Simpson, P. Peper, S. Maco, and Q. Xiao. 2005. Municipal Forest Benefits

and Costs in Five US Cities. Journal Of Forestry 103:411-416.

Neville, L. R. 1996. Urban Watershed Management: The Role of Vegetation. State University of

New York, Syracuse, NY.

75

Nowak, D. J. 1994. Air pollution removal by Chicago's urban forest. Pages 83-94 in E. G.

McPherson, D. J. Nowak, and R. A. Rowntree, editors. Chicago's Urban Forest

Ecosystem: Results of the Chicago Urban Forest Climate Project. USDA Forest Service

Northeastern Forest Experiment Station, Radnor, PA.

Nowak, D. J. and D. E. Crane. 2002. Carbon storage and sequestration by urban trees in the

USA. Environmental Pollution 116:381-389.

Nowak, D. J., D. E. Crane, and J. F. Dwyer. 2002. Compensatory value of urban trees in the

United States. Journal of Arboriculture 28:194-199.

Nowak, D. J., D. E. Crane, J. C. Stevens, R. E. Hoehn, J. T. Walton, and J. Bond. 2008. A

Ground-Based Method of Assessing Urban Forest Structure and Ecosystem Services.

Arboriculture and Urban Forestry 34:347-358.

Nowak, D. J. and J. F. Dwyer. 2007. Understanding the Benefits and Costs of Urban Forest

Ecosystems. Pages 24-46 in J. E. Kuser, editor. Urban and Community Forestry in the

Northeast. State University of New Jersey, New Brunswick.

Nowak, D. J., M. H. Noble, S. M. Sissinni, and J. F. Dwyer. 2001. Assessing the U.S. Urban

Forest Resource. Journal Of Forestry 99:37-42.

Nowak, D. J., D. Twardus, R. Hoehn, M. Mielke, B. Smith, J. T.Walton, D. E. Crane, A.

Cumming, and J. C. Stevens. 2006. Urban forest health monitoring in the United States.

General Technical Report - USDA Forest Service wo-70:41-47.

Nzokou, P., S. Tourtellot, and D. P. Kamdem. 2008. Impact of Pesticides Borate and

Imidacloprid on Insect Emergence from Logs Infested by the Emerald Ash Borer.

Arboriculture and Urban Forestry 34:173-178.

Peper, P. J., E. G. McPherson, and S. M. Mori. 2001. Equations for Predicting Diameter, Height,

Crown Width, and Leaf Area of San Joaquin Valley Street Trees. Journal of

Arboriculture 27:306-317.

Poland, T. M. and D. G. McCullough. 2006. Emerald Ash Borer: Invasion of the Urban Forest

and the Threat to North America's Ash Resource. Journal Of Forestry 104:118-124.

76

Program, V. G. E. 2011. Urban Tree Canopy Analysis of Virginia Localities.in V. G. E.

Program, editor. Virginia Tech.

Roberts, B. 1977. The Response of Urban Trees to Abiotic Stress. Journal of Arboriculture 3:75-

78.

Rose, A. 2007. Virginia's Forests. Southern Research Station, Knoxville, TN.

Santamour, F. 1990. TREES FOR URBAN PLANTING: DIVERSITY UNIFORMITY, AND

COMMON SENSE. Conf. Metropolitan Tree Improvement Alliance(METRIA) Proc.

7th:57-65.

Schlarbaum, S. E., F. Hebard, P. C. Spaine, and J. C. Kamalay. 1997. Three American Tragedies:

Chestnut Blight, Butternut Canker, and Dutch Elm Disease.in Exotic Pests of Eastern

Forests. Tennessee Exotic Pest Plant Council, Nashville, TN.

Smiley, T. E. and F. A. Baker. 1988. Options in Street Tree Inventories. Journal of Arboriculture

14:36-42.

Smith, W. H. 1990. Air Pollution and Forests. Springer-Verlag, New York, NY.

Stipes, R. J. and R. J. Campana. 1981. Compendium of elm diseases. American Phytopathology

Society.

Sydnor, T. D., M. Bumgardener, and A. Todd. 2007. The Potential Economic Impacts of

Emerald Ash Borer (Agrilus planipennis) on Ohio, U.S., Communities. Journal of

Arboriculture and Urban Forestry 33:48-54.

Taylor, R. A., L. S. Bauer, D. L. Miller, and R. A. Haack. 2005. Emerald ash borer flight

potential. Pages 15-16 in V. Mastro and R. Reardon, editors. FHTET-2004-15. USDA

Forest Service, Morgantown, WV.

USFS. 2010. FIDO II FIA. Forest Inventory Data Online. Department of Agriculture, Forest

Service.

VDACS. 2009. Trapping Program Determines That Emerald Ash Borer is Confined to Nothern

Virginia. Press Release.

77

VDACS. 2010a. Trapping Program Helps Track Movement of the Destructive Emerald Ash

Borer in Virginia. Press Release. Virginia.gov.

VDACS. 2010b. Virginia Emerald Ash Borer Survey and Quarantine.in R. Services, editor.

Emerald Ash Borer, Richmond, Virginia.

Wei, X. A., Y. N. Wu, R. Reardon, T.-H. Sun, M. N. Lu, and J.-H. Sun. 2007. Biology and

damage traits of emerald ash borer (Agrilus planipennis Fairmaire) in China. Insect

Science 14:367-373.

Wray, P. 2003. Soil, Roots, and Construction: A Deadly Combination. Journal Of Forestry:4-8.

Yang, Z. Q., Y. X. Yao, and X. Y. Wang. 2006. A new species of emerald ash borer parasitoid

from China belonging to genus Tetrastichus Haliday (Hymenoptera:Eulophidae). Page

550 in D. R. Smith, editor. Proceedings of the Entomological Society of Washington. The

Entomological Society of Washington.

78

APPENDIX A

Appendix A: Tree attributes and value ranges employed in sample street tree inventories

conducted in six Virginia localities during 2008–2010.

Trunk Diameter Class

0-3‖ 3-6‖

6-12‖ 12-18‖

18-24‖ 24-30‖

30-36‖ 36-42‖

>42‖

Structural Condition

Dead/Dying - Extreme problems Poor - Major problems

Fair - Minor problems Good - No apparent problems

Functional Condition (Health)

Dead/Dying - Extreme problems Poor - Major problems

Fair - Minor problems Good - No apparent problems

Prevailing Land Use

Single family Residential Multi-family Residential

Small Commercial Industrial/Institutional/Large Commercial

Park/Vacant/Other

Site Type

Front Yard Planting Strip

Cutout Median

Backyard Forest edge

Other Maintained Location Other Un-maintained Location

Age Class

Young Immature

Mature Geriatric

Critical Risk Assessment

Yes No

Critical Health Assessment

Yes No


Recommended