1 An atlas of active enhancers across human cell types and tissues Robin Andersson 1# , Claudia Gebhard 2# , Irene Miguel-Escalada 3 , Ilka Hoof 1 , Jette Bornholdt 1 , Mette Boyd 1 , Yun Chen 1 , Xiaobei Zhao 1,4 , Christian Schmidl 2 , Takahiro Suzuki 5,6 , Evgenia Ntini 7 , Erik Arner 5,6 , Eivind Valen 1,8 , Kang Li 1 , Lucia Schwarzfischer 2 , Dagmar Glatz 2 , Johanna Raithel 2 , Berit Lilje 1 , Nicolas Rapin 1,9 , Frederik Otzen Bagger 1,9 , Mette Jørgensen 1 , Peter Refsing Andersen 7 , Nicolas Bertin 5,6 , Owen Rackham 5,6 , A. Maxwell Burroughs 5,6 , J. Kenneth Baillie 10 , Yuri Ishizu 5,6 , Yuri Shimizu 5,6 , Erina Furuhata 5,6 , Shiori Maeda 5,6 , Yutaka Negishi 5,6 , Christopher J. Mungall 11 , Terrence F. Meehan 12 , Timo Lassmann 5,6 , Masayoshi Itoh 5,6,13 , Hideya Kawaji 5,13 , Naoto Kondo 5,13 , Jun Kawai 5,13 , Andreas Lennartsson 14 , Carsten O. Daub 5,6,14, ,Peter Heutink 15 , David A. Hume 10 , Torben Heick Jensen 7 , Harukazu Suzuki 5,6 , Yoshihide Hayashizaki 5,13 , Ferenc Müller 3 , Alistair R.R. Forrest 5, 6 *, Piero Carninci 5, 6 *, Michael Rehli 2 * † , Albin Sandelin 1 * † 1 The Bioinformatics Centre, Department of Biology & Biotech Research and Innovation Centre, University of Copenhagen, Ole Maaloes Vej 5, DK-2200 Copenhagen, Denmark 2 Department of Internal Medicine III, University Hospital Regensburg, Franz-Josef-Strauss- Allee 11, 93042 Regensburg, Germany 3 School of Clinical and Experimental Medicine, College of Medical and Dental Sciences, University of Birmingham, Edgbaston, Birmingham B15 2TT, UK 4 Lineberger Comprehensive Cancer Center, University of North Carolina, Chapel Hill, NC 27599, USA 5 RIKEN OMICS Science Centre, RIKEN Yokohama Institute, 1-7-22 Suehiro-cho, Tsurumi-ku, Yokohama City, Kanagawa, 230-0045, Japan 6 RIKEN Center for Life Science Technologies (Division of Genomic Technologies), RIKEN Yokohama Institute, 1-7-22 Suehiro-cho, Tsurumi-ku, Yokohama City, Kanagawa, 230-0045, Japan 7 Centre for mRNP Biogenesis and Metabolism, Department of Molecular Biology and Genetics, C.F. Møllers Alle 3, Bldg. 1130, DK-8000 Aarhus, Denmark 8 Department of Molecular and Cellular Biology, Harvard University, USA 9 The Finsen Laboratory, Rigshospitalet and Danish Stem Cell Centre (DanStem), University of Copenhagen, Ole Maaloes Vej 5, DK-2200, Denmark 10 Roslin Institute, Edinburgh University, Easter Bush, Midlothian, EH25 9RG Scotland, UK 11 Genomics Division, Lawrence Berkeley National Laboratory, 1 Cyclotron Road MS 64-121, Berkeley, CA 94720, USA 12 EMBL Outstation - Hinxton, European Bioinformatics Institute, Wellcome Trust Genome Campus, Hinxton, Cambridge, CB10 1SD 13 RIKEN Preventive Medicine and Diagnosis Innovation Program, RIKEN Yokohama Institute, 1-7-22 Suehiro-cho, Tsurumi-ku, Yokohama City, Kanagawa, 230-0045, Japan 14 Department of Biosciences and Nutrition, Karolinska Institutet, 14183 Huddinge, Stockholm, Sweden. 15 Department of Clinical Genetics, VU University Medical Center, van der Boechorststraat 7, 1081 BT Amsterdam, Netherlands # These authors contributed equally to this work. † These authors contributed equally to this work. * Correspondence should be addressed to ARRF ([email protected]), PC ([email protected]), MR ([email protected]) or AS ([email protected]). This is the peer reviewed version of the following article: Andersson R, Gebhard C, Miguel-Escalada I, Hoof I, Bornholdt J, Boyd M, Chen Y, Zhao X, Schmidl C, Suzuki T, Ntini E, Arner E, Valen E, Li K, Schwarzfischer L, Glatz D, Raithel J, Lilje B, Rapin N, Bagger FO, Jørgensen M, Andersen PR, Bertin N, Rackham O, Burroughs AM, Baillie JK, Ishizu Y, Shimizu Y, Furuhata E, Maeda S, Negishi Y, Mungall CJ, Meehan TF, Lassmann T, Itoh M, Kawaji H, Kondo N, Kawai J, Lennartsson A, Daub CO, Heutink P, Hume DA, Jensen TH, Suzuki H, Hayashizaki Y, Müller F; FANTOM Consortium, Forrest AR, Carninci P, Rehli M, Sandelin A. (2014) An atlas of active enhancers across human cell types and tissues. Nature. 507:455-461, which has been published in final form by Nature publishing Group at doi: 10.1038/nature12787.
Transcript
1
An atlas of active enhancers across human cell types and tissues Robin Andersson1#, Claudia Gebhard2#, Irene Miguel-Escalada3, Ilka Hoof1, Jette Bornholdt1, Mette Boyd1, Yun Chen1, Xiaobei Zhao1,4, Christian Schmidl2, Takahiro Suzuki5,6, Evgenia Ntini7, Erik Arner5,6, Eivind Valen1,8, Kang Li1, Lucia Schwarzfischer2, Dagmar Glatz2, Johanna Raithel2, Berit Lilje1, Nicolas Rapin1,9, Frederik Otzen Bagger1,9, Mette Jørgensen1, Peter Refsing Andersen7, Nicolas Bertin5,6, Owen Rackham5,6, A. Maxwell Burroughs5,6, J. Kenneth Baillie10, Yuri Ishizu5,6, Yuri Shimizu5,6, Erina Furuhata5,6, Shiori Maeda5,6, Yutaka Negishi5,6, Christopher J. Mungall11, Terrence F. Meehan12, Timo Lassmann5,6, Masayoshi Itoh5,6,13 , Hideya Kawaji5,13, Naoto Kondo5,13, Jun Kawai5,13, Andreas Lennartsson14, Carsten O. Daub5,6,14,,Peter Heutink15, David A. Hume10
, Torben Heick Jensen7 , Harukazu Suzuki5,6,
Yoshihide Hayashizaki5,13, Ferenc Müller3, Alistair R.R. Forrest5, 6*, Piero Carninci5, 6*, Michael Rehli2*†, Albin Sandelin1*† 1The Bioinformatics Centre, Department of Biology & Biotech Research and Innovation Centre, University of Copenhagen, Ole Maaloes Vej 5, DK-2200 Copenhagen, Denmark 2Department of Internal Medicine III, University Hospital Regensburg, Franz-Josef-Strauss-Allee 11, 93042 Regensburg, Germany 3School of Clinical and Experimental Medicine, College of Medical and Dental Sciences, University of Birmingham, Edgbaston, Birmingham B15 2TT, UK 4 Lineberger Comprehensive Cancer Center, University of North Carolina, Chapel Hill, NC 27599, USA
5RIKEN OMICS Science Centre, RIKEN Yokohama Institute, 1-7-22 Suehiro-cho, Tsurumi-ku, Yokohama City, Kanagawa, 230-0045, Japan 6RIKEN Center for Life Science Technologies (Division of Genomic Technologies), RIKEN Yokohama Institute, 1-7-22 Suehiro-cho, Tsurumi-ku, Yokohama City, Kanagawa, 230-0045, Japan 7Centre for mRNP Biogenesis and Metabolism, Department of Molecular Biology and Genetics, C.F. Møllers Alle 3, Bldg. 1130, DK-8000 Aarhus, Denmark 8Department of Molecular and Cellular Biology, Harvard University, USA 9The Finsen Laboratory, Rigshospitalet and Danish Stem Cell Centre (DanStem), University of Copenhagen, Ole Maaloes Vej 5, DK-2200, Denmark 10 Roslin Institute, Edinburgh University, Easter Bush, Midlothian, EH25 9RG Scotland, UK 11Genomics Division, Lawrence Berkeley National Laboratory, 1 Cyclotron Road MS 64-121, Berkeley, CA 94720, USA 12EMBL Outstation - Hinxton, European Bioinformatics Institute, Wellcome Trust Genome Campus, Hinxton, Cambridge, CB10 1SD 13RIKEN Preventive Medicine and Diagnosis Innovation Program, RIKEN Yokohama Institute, 1-7-22 Suehiro-cho, Tsurumi-ku, Yokohama City, Kanagawa, 230-0045, Japan 14Department of Biosciences and Nutrition, Karolinska Institutet, 14183 Huddinge, Stockholm, Sweden. 15Department of Clinical Genetics, VU University Medical Center, van der Boechorststraat 7, 1081 BT Amsterdam, Netherlands # These authors contributed equally to this work. † These authors contributed equally to this work. * Correspondence should be addressed to ARRF ([email protected]), PC ([email protected]), MR ([email protected]) or AS ([email protected]).
This is the peer reviewed version of the following article: Andersson R, Gebhard C, Miguel-Escalada I, Hoof I, Bornholdt J, Boyd M, Chen Y, Zhao X, Schmidl C, Suzuki T, Ntini E, Arner E, Valen E, Li K, Schwarzfischer L, Glatz D, Raithel J, Lilje B, Rapin N, Bagger FO, Jørgensen M, Andersen PR, Bertin N, Rackham O, Burroughs AM, Baillie JK, Ishizu Y, Shimizu Y, Furuhata E, Maeda S, Negishi Y, Mungall CJ, Meehan TF, Lassmann T, Itoh M, Kawaji H, Kondo N, Kawai J, Lennartsson A, Daub CO, Heutink P, Hume DA, Jensen TH, Suzuki H, Hayashizaki Y, Müller F; FANTOM Consortium, Forrest AR, Carninci P, Rehli M, Sandelin A. (2014) An atlas of active enhancers across human cell types and tissues. Nature. 507:455-461, which has been published in final form by Nature publishing Group at doi: 10.1038/nature12787.
2
SUMMARY Enhancers control the correct temporal and cell type-specific activation of
gene expression in higher eukaryotes. Knowing their properties, regulatory
activity and targets is crucial to understand the regulation of differentiation and
homeostasis. We use the FANTOM5 panel of samples covering the majority
of human tissues and cell types to produce an atlas of active, in vivo
transcribed enhancers. We show that enhancers share properties with CpG-
poor mRNA promoters but produce bidirectional, exosome-sensitive, relatively
short unspliced RNAs, the generation of which is strongly related to enhancer
activity. The atlas is used to compare regulatory programs between different
cells at unprecedented depth, identify disease-associated regulatory single
nucleotide polymorphisms, and classify cell type-specific and ubiquitous
enhancers. We further explore the utility of enhancer redundancy, which
explains gene expression strength rather than expression patterns. The online
FANTOM5 enhancer atlas represents a unique resource for studies on cell
type-specific enhancers and gene regulation.
INTRODUCTION Precise regulation of gene expression in time and space is required for
development, differentiation and homeostasis in higher organisms1. Sequence
elements within or near core promoter regions contribute to regulation2, but
promoter-distal regulatory regions like enhancers are essential in the control
of cell type specificity1. Enhancers were originally defined as remote elements
that increase transcription independent of their orientation, position and
distance to a promoter3. They were only recently found to initiate RNA
polymerase II (RNAPII) transcription, producing so-called eRNAs4. Genomic
locations of enhancers used by cells can be detected by mapping of
chromatin marks and transcription factor binding sites from chromatin
immunoprecipitation (ChIP) assays and DNase I hypersensitive sites (DHSs)
(reviewed in ref. 1), but there has been no systematic analysis of enhancer
usage in the large variety of cell types and tissues present in the human body.
Using Cap Analysis of Gene Expression5 (CAGE), we show that enhancer
activity can be detected through the presence of balanced bidirectional
capped transcripts, enabling the identification of enhancers from small primary
3
cell populations. Based upon the FANTOM5 CAGE expression atlas
encompassing 432 primary cell, 135 tissue and 241 cell line samples from
human6, we identify 43,011 enhancer candidates and characterize their
activity across the majority of human cell types and tissues. The resulting
catalogue of transcribed enhancers enables classification of ubiquitous and
cell type-specific enhancers, modeling of physical interactions between
multiple enhancers and TSSs, and identification of potential disease-
associated regulatory single nucleotide polymorphisms (SNPs).
RESULTS
Bidirectional pairs of capped RNAs identify active enhancers
The FANTOM5 project has generated a CAGE-based transcription start site
(TSS) atlas across a broad panel of primary cells, tissues, and cell lines
covering the vast majority of human cell types6. Within that dataset, well-
studied enhancers often have CAGE peaks delineating nucleosome-deficient
regions (NDRs) (Supplementary Fig. 1). To determine whether this is a
general enhancer feature, FANTOM5 CAGE (Supplementary Table 1) was
superimposed on active (H3K27ac-marked) enhancers defined by HeLa-S3
ENCODE ChIP-seq data7. CAGE tags showed a bimodal distribution flanking
the central P300 peak, with divergent transcription from the enhancer (Fig. 1a).
Similar patterns were observed in other cell lines (Supplementary Fig. 2a).
Enhancer-associated reverse and forward strand transcription initiation events
were, on average, separated by 180 bp and corresponded to nucleosome
boundaries (Supplementary Figs 3 and 4). As a class, active HeLa-S3
enhancers had 231-fold more CAGE tags than polycomb-repressed
enhancers, suggesting that transcription is a marker for active usage. Indeed,
ENCODE-predicted enhancers7 with significant reporter activity8 had greater
CAGE expression levels than those lacking reporter activity (P<4e-22, Mann-
Whitney U test). A lenient threshold on enhancer expression increased the
validation rate of ENCODE enhancers from 27% to 57% (Supplementary Fig.
5).
While capped RNAs of protein-coding gene promoters were strongly biased
towards the sense direction, similar levels of capped RNA in both directions
were detected at enhancers (Fig. 1b, and Supplementary Fig. 2b, c). Thus,
4
bidirectional capped RNAs is a signature feature of active enhancers. On this
basis, we identified 43,011 enhancer candidates across 808 human CAGE
libraries (see Supplementary Text and Supplementary Figs 6-8). Interestingly,
the candidates were depleted of CpG islands (CGI) and repeats (with the
exception of neural stem cells, see ref. 9).
To confirm the activity of newly-identified candidate enhancers, we randomly
selected 46 strong, 41 moderate and 36 low activity enhancers (as defined by
CAGE tag frequency) and examined their activity using enhancer reporter
assays compared to randomly selected untranscribed loci with regulatory
potential in HeLa-S3 cells: 15 DHSs10, 26 ENCODE-predicted ‘strong
enhancers’7 and 20 enhancers defined as in Figure 1A (Supplementary
Tables 2 and 3). While 67.4-73.9% of the CAGE-defined enhancers showed
significant reporter activity, only 20-33.3% of the untranscribed candidate
regulatory regions were active (Fig. 1c, and Supplementary Fig. 9a). The
same trend was observed in HepG2 cells (Supplementary Fig. 10a, b).
Corresponding promoter-less constructs showed that the enhancer
transcription read-through is negligible (Supplementary Fig. 9b, c). Large
fractions of CAGE-defined enhancers overlapped predicted ENCODE ‘strong
enhancers’ or ‘TSS’ states (25% and 62%, respectively, for HeLa-S3), but
there was no substantial difference in validation rates between these classes
(Supplementary Fig. 10c, d). In summary, active CAGE-defined enhancers
were much more likely to be validated in functional assays than untranscribed
candidate enhancers defined by histone modifications or DHSs.
Enhancer TSSs share regulatory features with mRNA TSSs but produce short,
exosome-‐sensitive RNAs
RNA-seq data from matching primary cells and tissues showed that ~95% of
RNAs originating from enhancers were unspliced and typically short (median
346 nt) - a striking difference to mRNAs (19% unspliced, median 56 nt) (Fig.
2a, and Supplementary Fig. 11a-c). Unlike TSSs of mRNAs, which are
enriched for predicted 5’ splice sites but depleted of downstream
polyadenylation (pA) signals11,12, enhancers showed no evidence of
associated downstream RNA processing motifs, and thus resemble antisense
5
PROMoter uPstream Transcripts (PROMPTs)11 (Fig. 2b, and Supplementary
Fig. 11d). Most CAGE-defined enhancers gave rise to nuclear (>80%) and
non-polyadenylated (~90%) RNAs13 (Supplementary Fig. 11e). Based on
RNA-seq, few enhancer RNAs overlap exons of known protein-coding genes
or lincRNAs (9 and 1 out of 4208 enhancers detected, respectively),
suggesting that they are not a substantial source of alternative promoters for
known genes (as in ref. 14).
TSS-associated, uncapped small RNAs (TSSa-RNAs), attributed to RNAPII
protection and found immediately downstream of mRNA TSSs15,16, were
detectable in the same positions downstream of enhancer TSSs
(Supplementary Fig. 12), indicating that RNAPII initiation at enhancer and
mRNA TSSs is similar. Indeed, CAGE-defined enhancer TSSs resembled the
proximal position-specific sequence patterns of non-CGI RefSeq TSSs (Fig.
2c, and Supplementary Fig. 13a). Furthermore, de novo motif analysis
revealed sequence signatures in CAGE-defined enhancers closely resembling
non-CGI promoters (Fig. 2d, and Supplementary Fig. 13b).
Because of the similarity with PROMPTs, we reasoned that capped enhancer
RNAs might be rapidly degraded by the exosome. Indeed, siRNA-mediated
depletion of the hMTR4 (SKIV2L2) co-factor of the exosome complex resulted
in a median 3.14-fold increase of capped enhancer-RNA abundance (Fig. 2e,
and Supplementary Fig. 14a, b), but only a negligible increase at mRNA TSSs.
This increasing trend is similar to that of PROMPT regions upstream of TSSs,
although the increase of enhancer RNAs was significantly higher (P<4.6e-67,
Mann-Whitney U test, Fig. 2e, and Supplementary Fig. 14b, c). Thus, the
bidirectional transcriptional activity observed at enhancers is also present at
promoters, as suggested previously17, but in promoters only the antisense
RNA is degraded. Furthermore, the CAGE expression of enhancers in control
and hMTR4-depleted cells was proportional (Supplementary Fig. 14d),
suggesting that virtually all identified enhancers produce exosome-sensitive
RNAs. The number of detectable bidirectional CAGE peaks increased 1.7-fold
upon hMTR4 depletion and novel enhancer candidates had on average
similar, but weaker, chromatin modification signals compared to control HeLa
AS interpreted results. RA, CG, IH, EV, IME, JB, FM, DAH, MR, AS wrote the
paper with input from all authors.
Acknowledgements FANTOM5 was made possible by a Research Grant for RIKEN Omics
Science Center from MEXT to YH and a Grant of the Innovative Cell Biology
by Innovative Technology (Cell Innovation Program) from the MEXT, Japan to
YH. The AS group was supported by funds from the European Research
Council FP7/2007-2013/ERC #204135, the Novo Nordisk and Lundbeck
16
foundations. Work in MRs group was funded by grants from the Deutsche
Forschungsgemeinschaft (RE 1310/7, 11, 13) and Rudolf Bartling Stiftung.
FM and IME were supported by “BOLD” Marie Curie ITN and “ZF- Health”
Integrated project of the European Commission. We thank i) Shohei Noma,
Mizuho Sakai, and Hiroshi Tarui for RNA-seq and sRNA-seq preparation, ii)
RIKEN GeNAS for generation and sequencing of the Heliscope CAGE
libraries, Illumina RNAseq and sRNAseq, iii) the Copenhagen National High-
throughput DNA Sequencing Center for Illumina CAGE-seq, iv) Anders
Albrechtsen, Ida Moltke, Wyeth Wasserman for advice, and v) the
Netherlands Brain Bank for post-mortem human brain material.
Competing interests. The authors declare no competing interests.
Methods summary
Single molecule HeliScopeCAGE data was generated as described
elsewhere6. Sequencing and processing of rRNA-depleted RNAs, short RNAs,
and H3K27ac or H3K4me1 ChIPs as well as the processing of publicly
available DNase-seq data are described in the Supplementary Methods online.
Putative enhancers were identified from bidirectionally transcribed loci having
divergent CAGE tag clusters separated by at most 400 bp (described in
Supplementary Figure 6a). We required loci to be divergently transcribed in at
least one FANTOM5 sample, defined by CAGE tag 5’ ends within 200 bp
divergent strand-specific windows immediately flanking the loci midpoints. The
expression of each enhancer in each FANTOM5 sample was quantified as the
normalized sum of strand-specific sums of CAGE tags in these windows. A
sample-set wide directionality score, D, for each locus over aggregated
normalized reverse, R, and forward, F, strand window-expression values
across all samples, D=(F-R)/(F+R), were then used to filter putative
enhancers to have low, non-promoter-like, directionality scores (abs(D)<0.8).
Further filtering ensured enhancers to be located distant to TSSs and exons
of protein- and non-coding genes.
Motif enrichment analyses were done using HOMER36. Regulatory targets of
enhancers were predicted by correlation tests using the sample-set wide
17
expression profiles of all enhancer-promoter pairs within 500kb. The
regulatory effects of multiple enhancers were modeled using linear regression
followed by lasso-based model-shrinkage37.
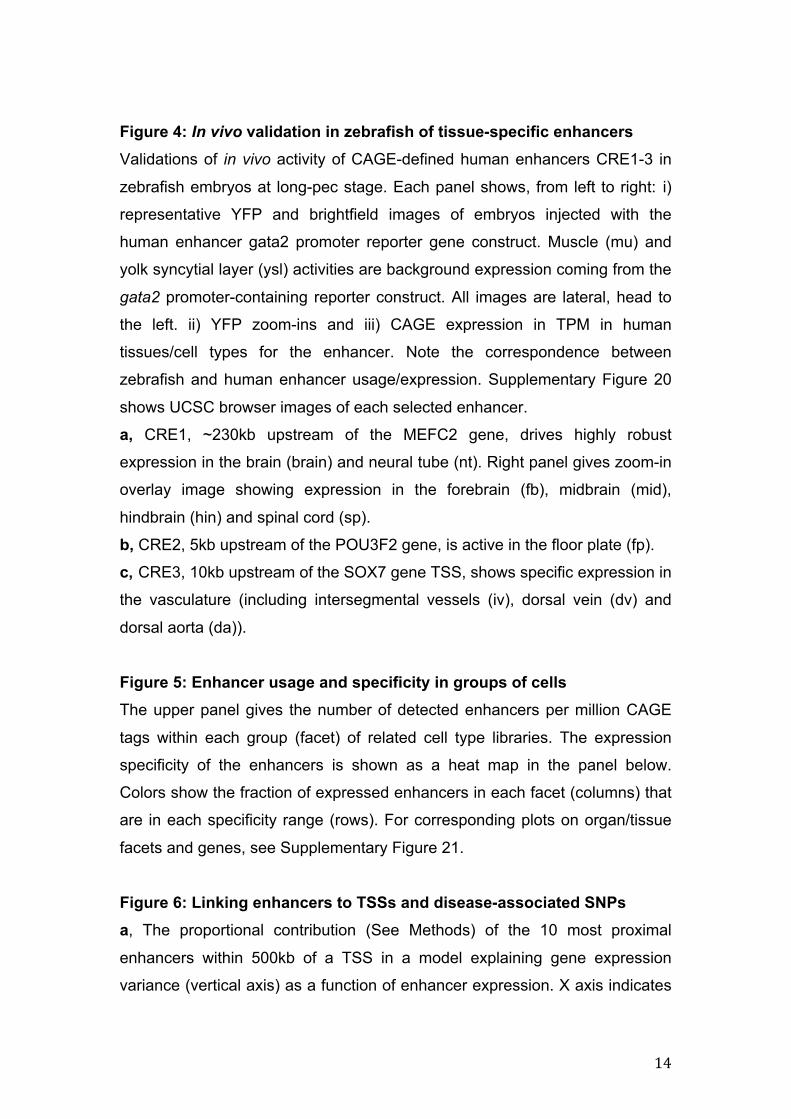
Enhancer activity was tested in vivo in zebrafish embryos using Tol2-
mediated transgenesis38. Expression patterns were documented at 48 hpf
using >200 eggs per construct. Large-scale in vitro validations on randomly
selected enhancers were performed using Firefly/Renilla luciferase reporter
plasmids with enhancer sequences cloned upstream of an EF1α basal
promoter separated by a synthetic polyA signal/transcriptional pause site in a
modified pGL4.10 (Promega) vector (Supplementary Fig. 9d). Full details are
provided in the Supplementary Methods online.
Methods (full – for online materials)
CAGE data Single molecule HeliScopeCAGE39 data was generated as described elsewhere 6. We used a set of 432 primary cell, 135 tissue, and 241 cell line samples that passed quality control measures of >500,000 Q20 Delve (Lassmann et al., in prep) mapped CAGE tags, RNA integrity and reproducibility (for further details, see ref 6).
Proof of concept analysis We defined silent and active enhancers from ENCODE HeLa-S3, GM12878 and K562 broad peaks (Broad Institute, Bernstein), downloaded from the UCSC ENCODE repository, according to the co-existence of histone modifications H3K4me1, H3K27ac and H3K27me3. Active enhancers were defined as co-localized H3K4me1 and H3K27ac peaks with no H3K27me3 peak, while silent enhancers were considered loci with H3K4me1 and H3K27me3 peaks but no H3K27ac peak. Loci were filtered to be located distant to TSSs (500 bp) and exons (200 bp) of protein-coding genes, multi-exonic non-coding genes and mRNAs (from ENSEMBL, GENCODE (v10), RefSeq and UCSC, downloaded January 12, 2012), and other lncRNAs from a gene-centric set derived from literature40 as well as manually annotated sense-antisense pairs (coding-noncoding and noncoding-noncoding sense-antisense pairs) with 5' EST and cDNA support, and 5' ESTs with no locus protein-coding capacity. Transcriptional differences between active and silent enhancer sets were determined by comparing the average number of FANTOM5 CAGE tag 5’ ends from the same ENCODE cell lines (pooled triplicates) in a window +/- 300 bp around the H3K4me1 peak mid points. The active enhancer sets of HeLa-S3, GM12878 and K562 cells were then centered on proximal (within 200bp) P300 (Stanford, Snyder) ENCODE binding site peaks (joint P300 and GATA1 (Yale) peaks for K562) to derive center positions. FANTOM5 CAGE data from the same ENCODE cell lines
18
(pooled triplicates) were then overlaid these centered enhancer regions and the absence (0) and presence (1) of (one or more) CAGE tag 5’ ends in 10bp non-overlapping windows were determined and an average profile was calculated to assess the average bidirectional pattern of transcription at chromatin-derived enhancers. Pooled CAGE data from all FANTOM5 libraries (described above) were further overlaid with these regions and a directionality score based on the aggregate of CAGE tags falling within +/- 300bp from the center positions were calculated to determine potential strand bias. For comparison, we repeated the same calculations for genomic regions +/- 300bp around TSSs of RefSeq protein coding genes. Directionality was calculated as (F - R) / (F + R), where F and R is the sum of CAGE tags aligned on the forward and reverse strand, respectively. Directionality close to -1 or 1 indicates a unidirectional behavior while 0 indicates perfectly balanced bidirectional transcription. Positional cross correlations were calculated between reverse and forward CAGE tag 5’ ends at ChIP-seq derived active HeLa-S3 and GM12878 enhancer center positions (as determined by P300 peaks) +/-300 bp (max lag 300) to identify their most likely separation. Cross correlations were also calculated in 300 bp windows (max lag 150) flanking the enhancer centers between CAGE 5’ ends and ENCODE H2A.Z signals (from the same cell line) for HeLa-S3 and GM12878 as well as between CAGE 5’ ends and ENCODE GM12878 nucleosome MNase-seq 5’ ends (9 pooled replicates). In the latter analysis, correlations were made using reads on the same strand. Pooled, unique CAGE tags (in which only one CAGE tag per bp was counted) were considered in all correlation analyses and enhancers were weighed according to the aggregated signal before subsequent averaging over lags not to make any library or enhancer have an undue influence.
Reporter activity of ENCODE enhancers in relation to transcriptional status We used published8 results on a massively parallel reporter assay measuring the activity of ENCODE-predicted enhancers in HepG2 and K562 cells. All results on non-scrambled sequences were considered, regardless of the level of conservation. 198 out of 738 tested K562 enhancers and 307 out of 1136 tested HepG2 enhancers had significant enhancer reporter activity (as determined by the original publication). We determined the expression in 401bp windows centered on mid points of ENCODE-predicted enhancers using FANTOM5 CAGE from the same cell lines. We further calculated the false discovery rate after a minimum expression threshold in the interval [0,0.5] TPM, as the fraction of non-significant enhancers among those fulfilling the expression cutoff.
Identification of bidirectionally transcribed loci Bidirectionally transcribed loci were defined from a set of 1,714,047 forward and 1,597,186 reverse strand CAGE tag clusters (TCs) supported by at least two CAGE tags in at least one sample (TCs defined in 6). Only TCs not overlapping antisense TCs were used. We identified 1,261,036 divergent (reverse-forward) TC pairs separated by at most 400 bp and merged all such pairs containing the same TC, while at the same time avoiding overlapping forward and reverse strand transcribed regions (prioritization by expression
19
ranking), which resulted in 200,171 bidirectional loci (procedure illustrated in Supplementary Figure 6a). A center position was defined for each bidirectional locus as the mid position between the rightmost reverse strand TC and leftmost forward strand TC included in the merged bidirectional pair. Each bidirectional locus was further associated with two 200 bp regions immediately flanking the center position, one (left) for reverse strand transcription and one (right) for forward strand transcription, in a divergent manner. The merged bidirectional pairs were further required to be bidirectionally transcribed (CAGE tags supporting both windows flanking the center) in at least one individual sample, and to have a greater aggregate of reverse CAGE tags (over all FANTOM5 samples) than forward CAGE tags in the 200 bp region associated with reverse strand transcription, and vice versa. These filtering steps resulted in 78,555 bidirectionally transcribed loci.
Expression quantification of bidirectionally transcribed loci and prediction of enhancers We quantified the expression of bidirectional loci for each strand and 200 bp flanking window in each of the 432 primary cell, 135 tissue and 241 cell line samples separately by counting the CAGE tags whose 5' ends were located within these windows. The expression values of both flanking windows were normalized by converting tag counts to tags per million mapped reads (TPM) and further normalization between samples was done using the RLE normalization procedure in edgeR41. The number of CAGE tags aligned on ChrM was subtracted from the total number of aligned CAGE tags in each library before normalization. The normalized expression values from both windows were used to calculate a sample-set wide directionality score, D, for each enhancer over aggregated normalized reverse, R, and forward, F, strand expression values across all samples (Supplementary Fig. 6a); D = (F-R) / (F+R). D ranges between -1 and 1 and specifies the bias in expression to reverse and forward strand, respectively (D=0 means 50% reverse and 50% forward strand expression, while abs(D) close to 1 indicates unidirectional transcription). A directionality score calculated from pooled data is a good estimate of sample directionality (Supplementary Fig. 6b). Each bidirectional locus was assigned one expression value for each sample by summing the normalized expression of the two flanking windows. Bidirectional loci were further filtered to have low, non-promoter-like, directionality scores (abs(D) < 0.8) and to be located distant to TSSs and exons of protein- and non-coding genes (see ‘Proof of concept analysis’ above for details). This resulted in a final set of 43,011 putative enhancers. We further tested whether the expression level for each sample and candidate enhancer was significantly greater than the genomic background (see construction of random genomic background regions below). A P-value was calculated for each enhancer expression value for each primary cell, tissue and cell line sample by counting the fraction of random genomic regions with greater expression level in the same sample. Enhancers with P-values less than 0.001 and Benjamini-Hochberg adjusted FDR < 0.05 was considered transcribed in that sample. This analysis yielded binary expression values, which were used for constructing enhancer sets associated with each sample. In total, 38,554 enhancers were transcribed at a significant expression level in at least one primary cell or tissue sample. Below, we refer to this set as the
20
‘robust set’ of enhancers and indicate whenever it was used. For all analyses, we use the whole (‘permissive’) set of 43,011 enhancers if not otherwise mentioned.
Construction of random genomic background regions We randomly sampled 100,000 genomic regions of 401 bp that were distal to TSSs and exons of known genes (same as the filtering procedure described above for bidirectionally transcribed loci). These were further filtered to not overlap with our set of 43,011 predicted enhancers, which yielded 98,942 random genomic regions whose expression levels were quantified and normalized in the same manner as described for bidirectional loci (above).
Correlation between ENCODE epigenomic data and CAGE-‐defined enhancers Using the UCSC ENCODE repository data (downloaded and pooled March 26 2012), we assessed the signal of RNA Polymerase II (RNAPII), the pooled transcription factor super track (all TFs), CCCTC-binding factor (CTCF), E1A binding protein P300, DNase I hypersensitive sites (DHSs) and two histone marks: H3K4me1 and H3K27ac around enhancers, TSSs and random genomic sites.
Large scale enhancer reporter validations We randomly selected 125 CAGE-defined enhancers with significantly higher expression than random genomic regions in at least two out of three HeLa-S3 replicates. These were grouped according to Hela-S3 expression tertiles: (low (36), mid-level (41) and strong (46). These could be split up further according to overlap (mid position) with combined ENCODE (release Jan 2011) segmentations of Segway42 and ChromHMM43 chromatin state prediction: 25, 27, and 14 strongly, mid-level and lowly expressed CAGE enhancer overlapped ENCODE state ‘E’ (‘strong enhancer’) while 21, 16, and 22 strongly, mid-level and lowly expressed CAGE enhancer overlapped ENCODE state ‘TSS’. We further randomly selected 26 and 15 untranscribed (negligible amount of overlapping FANTOM5 HeLa-S3 CAGE tags) 500bp regions centered on mid positions of HeLa-S3 E states and HeLa-S3 ENCODE DHSs. Two literature-derived44 HeLa-S3 positive enhancers and 4 random regions (see ‘Construction of random genomic background regions’) were used for comparison. For comparison, we also randomly selected 20 manually defined untranscribed HeLa-S3 chromatin-defined active enhancers (see ‘Proof of concept analysis’). PCR primers for the amplification of enhancer and control regions were designed using the PerlPrimer tool45, and purchased from Operon Ltd. Primers included BamHI or SalI restriction sites for cloning and sequences are listed in Supplementary Tables 2 and 3. Control fragments ranged between 420-1452bp. Enhancer fragments usually included a 500bp window around the mid point of our predicted enhancers and depending on the availability of unique primer sequences, enhancer fragments ranged between 470-840bp. We inserted an EF1α basal promoter fragment into HindIII and NheI sites of the multiple cloning site in pGL4.10 (Promega) to construct a basal pGL4.10EF1α backbone. We next removed the the BamHI and SalI containing fragment located at downstream of the SV40 late poly(A) signal of
21
the original pGL4.10 vector backbone, and re-inserted the fragment at the SpeI site that is located upstream of the synthetic poly(A) signal/transcriptional pause site to generate modified versions of pGL4.10EF1α and pGL4.10 (see Supplementary Figure 9d). Enhancer and control regions were PCR-amplified using KOD plus polymerase (TOYOBO) from HEK-293T gDNA, digested with BamHI and SalI (TAKARA BIO), and purified using the E-Gel® SizeSelect™ system (Life Technologies). Five µl of purified PCR products were ligated with 100 ng of the BamHI- and SalI-digested modified pGL4.10EF1α and pGL4.10 plasmids using Ligation-high (TOYOBO), and transformed into DH5α competent cells (TOYOBO). Correct insertion of the PCR products into the plasmids was checked by colony PCR. Vectors were purified using the QIAGEN Plasmid Plus 96 Miniprep Kit (QIAGEN). HeLa-S3 cells (JCRB Cell Bank) were cultured in MEM (WAKO) supplemented with 10% FBS (NICHIREI BIOSCIENCE INC., Lot No. 7G0031), 100 Units/mL penicillin and 100 µg/mL streptomycin (both Life Technologies). HepG2 Cells (RIKEN BRC) were cultured in DMEM (Life Technologies) supplemented with 10% FBS (NICHIREI BIOSCIENCE INC., Lot No. 7G0031), and MEM (WAKO) supplemented with 10% FBS (NICHIREI BIOSCIENCE INC., Lot No. 7G0031), 100 Units penicillin and 100 µg/mL streptomycin (Life Technologies). Cell lines were seeded into 96 well plates at a density of 7.5 × 10³ cells/well one day before transfection. Firefly luciferase reporter plasmids (190 ng) and 10 ng of pGL4.73 renilla luciferase plasmid (Promega) were co-transfected into HepG2 or HeLa-S3 cells using Lipofectamine (Life Technologies) according to the manufacturer’s instruction. Each transfection was independently performed three times. After 24 hours, the luciferase activities were measured by GloMax 96 Microplate luminometer (Promega) using the Dual-glo luciferase assay system (Promega) according to the manufacturer’s instruction.
Sequence motif analysis on global CAGE enhancer and promoter sets To compare motif signatures characterizing bidirectionally transcribed enhancers (permissive set) with those of CAGE-defined promoters, we used the set of 184,827 robust human CAGE clusters defined by 6 separated into 61,322 CGI and 123,505 nonCGI-associated clusters. We made further subsets of these CAGE clusters, contingent on their overlap with annotated TSSs from Refseq and Gencode. We merged overlapping extended CAGE clusters (-300, +50; based on the robust cluster set; average size nonCGI: 422 bp; average size CGI: 544 bp) contingent on CGI status and subtracted CAGE cluster regions that overlapped with extended enhancers (mid position +/- 200 bp). This created five sets of regions representing non-overlapping bidirectional enhancers, nonCGI promoters and CGI promoters (annotated and full sets for the two latter ones). Motif enrichment was analyzed using HOMER36 version 3, a suite of tools for motif discovery and next-generation sequencing analysis (http://biowhat.ucsd.edu/homer/). Sequences of the three region sets (enhancers, nonCGI and CGI promoters) were compared to equal numbers of randomly selected genomic fragments of the average region size, matched for GC content and autonormalized to remove bias from lower-order oligo sequences. After masking repeats, motif enrichment was calculated using the
22
cumulative binomial distribution by considering the total number of target and background sequence regions containing at least one instance of the motif. One hundred motifs were searched for a range of motif lengths (7-14 bp) resulting in a set of 800 de novo motifs per set. After filtering redundant motifs, the top 50 motifs resulting from each search were combined, remapped and ranked according to enrichment (depletion) in the enhancer set. In parallel, we also used HOMER to calculate the enrichment of ChIP-seq derived known transcription factor motifs. Motif collections including search parameters are deposited in a web database at http://enhancer.binf.ku.dk. Histograms of PhastCons scores were generated using the annotation tool in HOMER.
Analysis of splice site and termination signals downstream of CAGE enhancer TSSs and promoter TSSs To identify motifs downstream of TSSs potentially differing between the structurally related bidirectionally transcribed enhancer TSSs and nonCGI-associated promoter TSSs, we extracted 600bp regions downstream of each TSS and performed comparative de novo motif searches using HOMER. Here, we analyzed one set using the other set as background (corrected for region size, matched for GC content and autonormalized) to calculate motif enrichment only on the given strand. The top motif enriched downstream of nCGI promoters was the 5’-splice site motif. Genomic distributions of the enriched splice site motif, as well as the AATAAA termination signal were generated using HOMER.
RNA-‐seq samples and library preparation Prior to preparation of sequencing libraries, rRNA was removed by poly(A)+ selection (CD19+ B-cells, CD8+ T-cells, 500 ng) or rRNA depletion (fetal heart, 1 ug). Poly(A)+ selection was done twice by using Dynabeads Oligo(dT)25 (Life Technologies) according to the manufacturer’s manual. rRNA depletion was done by using Ribo-Zero rRNA removal kit (Epicentre, Illumina) according to the manual. The treated RNA was dissolved in 20 µL water. The pretreated RNA was then fragmented by heating at 70°C for 3.5 min in fragmentation buffer (Ambion), followed by immediate chilling on ice and addition of 1 µl of Stop solution. Fragmented RNA was purified with the RNeasy MinElute kit (Qiagen) following the instructions of the manufacturer except 675 µL of 100% ethanol is used in step two, instead of 500 µl. Purified RNA was dephosphorylated in phosphatase buffer (New England Biolabs) with 5 U of Antarctic phosphatase (New England Biolabs) and 40 U of RNaseOut (Life Technologies) at 37°C for 30 min followed by 5 min at 65°C. After chilling on ice RNA was phosphorylated by addition of the following reagents; 5 µl of 10× PNK buffer, 20 U of T4 polynucleotide kinase (New England Biolabs), 5 µl of 10 mM ATP (Epicentre, Illumina), 40 U of RNaseOut, 17 µl of water. The reaction was incubated at 37°C for 60 min. Phosphorylated RNA was purified with the RNeasy MinElute kit (Qiagen) as described above. Purified RNA was concentrated to 6 µl by vacuum centrifugation on a SpeedVac (Eppendorf). One µl of 2 µM pre-adenylated 3’ DNA adaptor, 5’-App/ATC TCG TAT GCC GTC TTC TGC TTG-3' was added to the concentrated RNA. After incubation at 70°C for 2 min followed by chilling on ice for 2 min, the following reagents were added to ligate the adapter at the 3’ end of the RNA; 1 µl of 10× T4 RNA ligase 2 truncated buffer,
23
0.8 µl of 100 mM MgCl2, 20 U of RNaseOUT and 200 U of RNA ligase 2 truncated (New England Biolabs). After the incubation at 20°C for 60 min, 1 µl of heat-denatured 5 µM 5’ RNA adapter, 5’-guu cag agu ucu aca guc cga cga ucg aaa-3’ was ligated with 3’ adapter ligation products with 20 U of T4 RNA ligase 1 (New England Biolabs) and 1 µl of 10 mM ATP (New England Biolabs) at 20°C for 60 min. 4 µl of adapter ligated RNA was mixed with 1 µl of 20 µM RT Primer, 5’-CAA GCA GAA GAC GGC ATA CGA-3’, followed by incubation at 70°C for 2 min, and immediately kept on ice. RT reaction was done with 2 µl 5× Prime Script buffer, 1 µl of 10 mM dNTP, 20 U of RNaseOUT and 200 U of PrimeScript Reverse Transcriptase (TakaraBIO) at 44°C for 30 min. The cDNA product was amplified by PCR with 10 µl of 5× HF buffer, 1.25 µl of 10 mM each dNTP mix, 2 µl of 10 µM FWD primer, 5’-AAT GAT ACG GCG ACC ACC GAC AGG TTC AGA GTT CTA CAG TCC GA-3’, 2 µl of RT primer and 1 U of Phusion High-Fidelity DNA Polymerase (New England Biolabs). PCR was carried out in a total volume of 50 µl with the following thermal program; 98°C for 30 sec, 12 PCR cycles of 10 sec at 98°C, 30 sec at 60°C, and 15 sec at 72°C, followed by at 72°C for 5 min and then kept at 4°C. Remaining PCR primers were removed twice by using 1.2 volumes of AMPure XP beads (Beckman Coulter). The resulting libraries were checked for size and concentration by BioAnalyzer (Agilent) using the High-Sensitivity DNA Kit (Agilent). Qualified sequencing libraries were loaded on the HiSeq2000 (Illumina) using the custom sequencing primer, 5’-CGA CAG GTT CAG AGT TCT ACA GTC CGA CGA TCG AAA-3’. All RNA-seq samples profiled in this study were also profiled in the FANTOM5 promoterome manuscript and are described in detail there 6. Briefly all human samples used in the project were either exempted material (available in public collections or commercially available), or provided under informed consent. All non-exempt material is covered under RIKEN Yokohama Ethics applications (H17-34 and H21-14). For the samples profiled by RNA-seq, the human fetal heart RNA was purchased from Clontech (Cat no.636583). CD19+ B-cells and CD8+ T-cells were isolated using the pluriBead®system (huCD4/CD8 cascade and huCD19 single; PluriSelect). RNA was then extracted using the miRNeasy kit (Qiagen).
RNA-‐seq mapping and transcript assembly Single-end 100bp long reads from libraries originating from the similar cell sources (all six “CD19+ B cells” libraries, all six “CD8+ T cells” libraries and one “Fetal heart” library) were processed together via the Moirai pipeline (Hasegawa et al., manuscript in preparation). The processing steps implemented within the Moirai pipeline included 1) raw sequenced reads PolyA tail and “CTGTAGGCACCATCAAT” adaptor clipping using FASTQ/A Clipper from FASTX-Toolkit (http://hannonlab.cshl.edu/fastx_toolkit/ ), 2) removal of sequenced reads containing “N” and sequences similar to ribosomal RNA using rRNAdust version 1.02 (Lassmann et al., manuscript in preparation), and 3) mapping the resulting reads against the hg19 human genome using TopHat46 (version 1.4.1) using both TopHat de novo junction finding mode and known exon-exon junctions extracted from GENCODE V10, with all the other parameters set to their default values. Mapped reads flagged as PCR duplicates were removed and the remaining TopHat aligned reads
24
were then assembled using Cufflinks47 (version 1.3.0) with Cufflinks parameters set to their default values.
Assessment of lengths of RNAs emanating from enhancers and promoters All Cufflinks assembled transcripts, whose 5’ends, regardless of strand, were located within the outer boundaries of CAGE enhancers or, on the same strand, within 200bp (upstream or downstream) of a GENCODE (v10) protein-coding TSS were considered for further analysis. For these Cufflinks transcripts we calculated their (intron-less) RNA length, (possibly intron-containing) genomic length as the genomic distance between their 5’ and 3’ ends, as well as their number of exons. Exons of Cufflinks transcripts with 5’ ends in enhancers were further checked for at least 50% (reciprocal) overlap with exons of GENCODE (v10) known, level 1, protein-coding genes and lincRNAs. We repeated the same analysis specifically for u-enhancers.
Small RNA library preparation and mapping Short RNA-seq sequencing libraries were prepared as 24-plex using the TruSeq Small RNA Sample Prep Kit (Illumina) following the manufacturer’s manual. All starting sources were 1 µg of total RNA. The prepared sequencing libraries were loaded on a HiSeq2000 (Illumina). All samples profiled in this study were also profiled in the FANTOM5 promoterome paper6 and are described in detail there. Briefly, all human samples used in the project were either exempted material (available in public collections or commercially available), or provided under informed consent. All non-exempt material is covered under RIKEN Yokohama Ethics applications (H17-34 and H21-14). For the samples profiled by sRNA-seq, the human fetal heart RNA was purchased from Clontech (Cat no.636583). CD19+ B-cells and CD8+ T-cells were isolated using the pluriBead®system (huCD4/CD8 cascade and huCD19 single; PluriSelect). RNA was then extracted using the miRNeasy kit (Qiagen). Short RNAs were profiled using the Truseq protocol from Illumina, using an 8-plex. The 8-plex was first split by barcode and the resulting FASTQ sequences trimmed of the 3' adapter sequence. Sequences with low quality base N were removed. Ribsomal RNA sequences were then removed using the rRNAdust program. Remaining reads were then mapped using BWA version is 0.5.9(r16) and multimappers were randomly assigned.
Analysis of small RNAs at enhancer TSSs and promoter TSSs 5’ and 3’ ends of mapped sRNAs as well as pooled CAGE 5’ ends were overlaid windows of 601 bp centered on forward strand summits of enhancer-defining CAGE tag clusters and sense strand summits in promoters of RefSeq protein-coding genes. The average cross-correlation between CAGE 5’ ends and sRNA 3’ ends were calculated in these windows allowing a max lag of 300. For footprint plots, reads mapping to the same genomic locations were only counted once not to make any library or genomic region have an undue influence.
HeLa cells culturing and hMTR4 depletion HeLa cells were grown in DMEM medium supplemented with 10% fetal bovine serum at 37°C and 5% CO2. siRNA-mediated knockdown of either EGFP(control), and hMTR4 (SKIV2L2) were performed using 22 nM of siRNA
25
and Lipofectamin2000 (Invitrogen) as transfecting agent. A second hit of 22 nM siRNA was given after 48 h. Cells were harvested an additional 48 h after the second hit, and protein depletion was verified by western blotting analysis as described elsewhere48. The following siRNA sequences were used: egfp GACGUAAACGGCCACAAGU[dT][dT] egfp_as ACUUGUGGCCGUUUACGUC[dT][dT] hMTR4 CAAUUAAGGCUCUGAGUAA[dT][dT] hMTR4_as UUACUCAGAGCCUUAAUUG[dT][dT]
HeLa CAGE library preparations and data processing CAGE libraries were prepared from 5 µg of total RNA purified from 2x10⁶ HeLa cells using the Purelink mini kit (Ambion) with 1% 2-Mercaptoethanol (Sigma) and on-column DNAse I treatment (Ambion) as recommended by manufacturer. CAGE libraries were prepared according as described previously49. Prior to sequencing four libraries with different barcodes were pooled and applied to the same sequencing lane. The libraries were sequenced on a HiSeq2000 instrument (Illumina). To compensate for the low complexity in 5’end of the CAGE libraries 30% Phi-X spike-in were added to each sequencing lane as recommended by Illumina. CAGE reads were assigned to their respective originating sample according to identically matching barcodes. Assigned reads were trimmed to remove linker sequences and subsequently filtered for a minimum sequencing quality of 30 in 50% of the bases using the FASTX-Toolkit (http://hannonlab.cshl.edu/fastx_toolkit/). Mapping to the human genome (hg19) was performed using Bowtie50 (version 0.12.7), allowing for multiple good alignments and subsequently filtering for uniquely mapping reads. Reads that mapped to unplaced chromosome patches or chrM were discarded.
Assessment of degradation rates of RNAs emanating from CAGE enhancers and promoters Bidirectionally transcribed loci were identified in the same way as with pooled FANTOM5 CAGE libraries (see ‘Identification of bidirectionally transcribed loci’ and ‘Expression quantification of bidirectionally transcribed loci and prediction of enhancers’ above) from tag clusters (as defined in 51) derived from pooled HeLa CAGE (mock treated control, hMTR4) libraries. From 5,892 bidirectional loci distant to TSSs and exons, 4196 were predicted to be enhancers based on balanced directionality of transcription of which 3,896 had significantly greater expression than random genomic regions in at least one library. These were then overlapped with the whole set of FANTOM5 CAGE enhancers to estimate the fraction of unseen transcribed enhancers. The expression fold change of HeLa depleted of hMTR4 compared to mock treated control were assessed and compared between expressed HeLa CAGE enhancers, promoters of RefSeq protein-coding genes in general and broken up into CpG and non-CpG promoters, and ubiquitous FANTOM5 CAGE enhancers. We further calculated the average footprints of H3K4me1, H3K4me2 and H3K27ac from ENCODE (Broad, Bernstein) signal files in 601 bp windows centered on mid points of enhancers identified in HeLa cells and those that were novel in hMTR4-.
26
Purification of blood cell types Peripheral blood mononuclear cells were isolated from leukapheresis products of healthy volunteers by density gradient centrifugation over Ficoll/Hypaque (Biochrom AG, Germany). Collection of blood cells from healthy donors was performed in compliance with the Helsinki Declaration. All donors signed an informed consent. The leukapheresis procedure and subsequent purification of peripheral blood cells was approved by the local ethical committee (reference number 92-1782 and 09/066c). CD4+ cells were enriched using magnetically labeled human CD4 MicroBeads (Miltenyi Biotec,Germany) and the Midi-MACS system (Miltenyi Biotec). The CD4+ fraction was stained with CD4 FITC (Becton Dickinson, cat no. 345768), CD25 PE (Becton Dickinson, cat no. 341011) and CD45RA APC and CD3+CD4+CD25- T cells were sorted on a FACS-Aria high-speed cell sorter (BD Biosciences, Germany). CD8+ cells were enriched using magnetically labeled human CD8 MicroBeads (Miltenyi). The CD8+ fraction was stained with CD3 FITC (Becton Dickinson, cat no 345763) and CD8 APC (Becton Dickinson, cat no. 345775) and sorted for CD3+CD8+ T cells. CD19+ and CD56+ cells were enriched from the CD8- fraction using magnetically labeled human CD19 and CD56 MicroBeads (Miltenyi). Enriched cells were stained with CD3 FITC (Becton Dickinson,cat no. 345763), CD19 PE (Becton Dickinson, cat no. 345777) and CD56 APC (Becton Dickinson, cat no.341027) and sorted into CD3+CD19+ B cells and CD3+CD56+ NK cells. Purification of blood monocytes is described elsewhere52.
Generation of ChIP data for blood cells Chromatin was obtained from CD4+CD25- T cells, CD8+ T cells, CD19+ B cells, and CD56+ NK cells of two healthy male donors each. Chromatin immunoprecipitation (ChIP) for H3K4me1 and H3K27ac and library construction were done essentially as described elsewhere52. Sequence tags were mapped to the current human reference sequence (GRCh37/hg19) using Bowtie50 and only uniquely mapped tags were used for downstream analyses. H3K4me1 and H3K27ac ChIP-seq data for CD14+ monocytes was generated elsewhere52. Complementary DNase hypersensitivity sequencing data was obtained from the Epigenetics Roadmap project (www.roadmapepigenomics.org) and mapped as above. Blood cell ChIP-seq data have been deposited with the NCBI GEO database (accession code GSE40668) and UCSC Genome Browser track hub data of the entire blood cell data set can be found at http://www.ag-rehli.de/NGSdata.htm . Also see Supplementary Table 4.
Clustering of blood cell CAGE and epigenetics data CAGE samples corresponding to CD4+, CD8+, B cells, NK cells and monocytes were selected in triplicates from among the set of primary cell samples. Based on the total set of 43,011 permissive enhancers, a subset of 6,609 blood-expressed enhancers was defined as being significantly expressed above genomic background (described above) in at least two of the triplicate samples for at least one blood cell type. This subset of enhancers was clustered for heat map visualization using complete linkage agglomerative hierarchical clustering based on enhancer usage per cell type (binary matrix) and Manhattan distance.
27
Enhancers were defined as being specifically expressed in one blood cell type if having a pairwise log2 fold change >1.5 with respect to the other four blood cell types. The fold change was calculated based on the mean expression over triplicate samples per cell type. Footprints for DNase I hypersensitivity (DHS), H3K4me1 and H3K27ac were calculated per cell type-specific enhancer set and cell type by extension of reads to 200 bp and overlap aggregation for a window of +/- 1kb around enhancer midpoint as the mean TPM signal over all enhancers in that specific subset. Peak-calling was done using MACS253 on pooled data for DHS, H3K4me1 and H3K27ac. Per cell type, peaks were regarded as significant if the peak summit fell within the upper 1 percentile of the background signal (max values in 92,604 random 1kb non-TSS non-enhancer regions). DHS regions were defined as +/-500 bp around peak summits. Since ChIP-Seq signals for H3K4me1 and H3K27ac often form bimodal peaks around enhancer sites, peak regions were defined as merged regions resulting from overlapping +/-500 bp regions around MACS2 called peak summits.
Transient enhancer-‐reporter assays in blood cells Selected blood cell type-specific enhancer regions (ranging from 800-1200 bp) were PCR-amplified from human genomic DNA and cloned directly into the CpG-free pCpGL-CMV/EF1 vector 54,55replacing the CMV enhancer with the DMR regions. Primer sequences are given in Supplementary Table 5. All inserts were verified by sequencing. For transient transfections, plasmids were isolated and purified using the EndoFree Plasmid Kit (Qiagen). Each luciferase construct was transiently transfected into three model cell lines (the monocytic THP-1 cell line, the Jurkat T cell line, and the B cell lymphoma cell line DAUDI). THP-1 and DAUDI cells were transfected using DEAE-dextran with 200 ng reporter plasmid and 10 ng Renilla control vector essentially as described56. Jurkat cells were transfected as described elsewhere54. The transfected cell lines were cultivated for 48 h, harvested, and cell lysates were assayed for firefly and Renilla luciferase activity using the Dual Luciferase Reporter Assay System (Promega) on a Lumat LB9501 (Berthold, Wildbach, Germany). Firefly luciferase activity of individual transfections was normalized against Renilla luciferase activity. Transfections correspond to at least three independent experiments measured in duplicates. To correct enhancer activity for the amount of read-through that is potentially generated from the enhancer TSS, we additionally generated constructs lacking the basal EF1α promoter for all B cell-specific constructs. Relative luciferase activities generated by read-through activity were subtracted from the activity of enhancer/EF1 constructs to reveal ‘true’ enhancer activities of individual regions. To further determine the position and activity of reporter TSS, 5’ RACE-PCR for the luciferase gene was performed as follows: RNA of transfected DAUDI cells was reverse transcribed using the SMARTerTM RACE cDNA Amplification Kit (Clontech, France) according to the manufacturers’ instructions. Rapid Amplification of luciferase 5’ cDNA ends (5’ RACE) was performed with the Advantage 2 Polymerase System (Clontech) and a LUC specific primer (5’-CAT GGC TTC TGC CAG CCT CAC AGA CAT C-3’) using the recommended touchdown-PCR program. 15µl of the PCR products were analyzed by agarose gel electrophoresis (2.5%). In addition, fragments were
28
cloned using the StrataClone PCR cloning Kit (Agilent) according to the manufacturers’ instructions and sequenced (Life Technologies, Germany).
Mass spectrometry analysis of bisulfite-‐converted DNA For the set of genomic regions that were also used in transient enhancer-reporter assays, PCR primers were designed using the MethPrimer web tool57 and purchased from Sigma-Aldrich (Munich, Germany) (for sequences see Supplementary Table 7). Sodium bisulfite conversion was performed using the EZ DNA methylation kit (Zymo Research, California, USA) using 200-1000 ng of genomic DNA from CD4+CD25- T cells, CD8+ T cells, CD14+ monocytes, CD19+ B cells, and CD56+ NK cells (two donors each) and an alternative conversion protocol. Amplification of target regions was followed by SAP treatment, reverse transcription and subsequent RNA base-specific cleavage (MassCLEAVE, San Diego, CA) as previously described58. Cleavage products were loaded onto silicon chips (SpectroCHIP, CA) and analyzed by MALDI-TOF mass spectrometry (MassARRAY Compact MALDI-TOF, U.S.Sequenom, San Diego, CA). Methylation was quantified from mass spectra using the Epityper software (Sequenom, U.S), and averaging methylation levels of CpG dinucleotides located in the central DNase hypersensitive (nucleosome-free) region that is flanked by CAGE clusters. The methylation data for individual CpGs are provided in Supplementary Table 8.
Definition of expression facets and differentially expressed 'specific' facets Cell and UBERON ontology term mappings were extracted from the FANTOM5 sample ontology 6 for primary cell and tissue samples, respectively, using indirect and direct ‘is_a’ and ‘part_of’ relationships. Ontology terms were manually selected to construct groups (facets) of samples that were mutually exclusive and to cover as broad histological and functional annotations as possible. 362 primary cell samples and 138 tissue and whole blood samples were grouped into 69 cell type facets and 41 organ/tissue facets, respectively (the groupings of samples into facets are provided in Supplementary Tables 10 and 11). A few samples were ignored because they were difficult to assign to a facet with certainty, which means that the number of samples within facets is slightly lower than the total number of samples. For each facet, we defined a set of robustly expressed enhancers from the union of significantly expressed enhancers (see calculation of expression significance above) associated with each contained sample. For motif search (see below), we identified the set of robust enhancers that were significantly deviating between facets using Kruskal-Wallis rank sum tests (Benjamini-Hochberg FDR < 0.05) and performed pair wise post-hoc tests (Nemenyi-Damico-Wolfe-Dunn (NDWD) test59,60 using the R coin package61 to identify enhancers with significant differential expression (Bonferroni single-step adjusted P < 0.05) between facets. Cell type facets and tissue/organ facets were analyzed separately. Each enhancer was considered differentially expressed in a facet with at least one pair-wise significant differential expression and overall positive standard linear statistics. This procedure means that we, for each robust enhancer, selected the facets, if any, with strong overall differential expression compared to all other facets.
29
It should be noted that differential expression in this sense is not equivalent to facet-specific (exclusive) expression.
Specificity and usage level analysis For each robust enhancer, we calculated a 'specificity' score across cell type and organ/tissue facets. The specificity score was defined to range between 0 and 1, where 0 means unspecific (ubiquitously expressed across facets) and 1 means specific (exclusively expressed in one facet). In detail, specificity(X) = 1 – (entropy(X) / log2(N) ), where X is a vector of sample-average expression values for an enhancer over all facets (cell types and organs/tissues were analyzed separately) and N its cardinality (|X|, the number of facets). The same calculations were done for TPM and RLE normalized CAGE-derived expression levels of RefSeq protein-coding gene promoters (TSS +/- 500 bp). In order to visualize the complexity and specialization of facets according to usage and specificity score of enhancers and genes, we counted the frequency of facet-used enhancers (significantly expressed in at least one contained sample) and gene promoters (≥ 1 TPM in at least one sample) with a specificity score in any of 20 bins distributed between 0 and 1. The number of robustly expressed enhancers and genes per sample were normalized to enhancers and genes per million mapped tags, utilizing the total number of mapped CAGE tags in each sample, and further log-transformed. The counts per million mapped tags were visualized in box plots split by facet (only facets with more than one contained sample were considered).
Motif analysis on differentially specific enhancer sets To identify and compare motif signatures characterizing facet-specific enhancers (permissive set) we applied de novo motif analyses. Motif enrichment was analyzed using HOMER. Enhancer regions (400bp) were compared to ~50,000 randomly selected genomic fragments of the same region size, as described above. Twenty-five motifs were searched for a range of motif lengths (7-14 bp) resulting in a set of 200 de novo motifs per set, which was further filtered to remove redundant motifs. In parallel, we also used HOMER to calculate the enrichment of ChIP-Seq derived motifs. Motif collections including search parameters for all facets are deposited in the web database at http://enhancer.binf.ku.dk. Known transcription factor motifs were used to compare motif enrichment between facets.
Hierarchical clustering of samples Tissue and primary cell samples mapped to ontology facets were clustered by complete linkage agglomerative hierarchical clustering based on Jensen-Shannon (JS) divergence59. In detail, expression values for all enhancers in the permissive set were normalized to sum to 1 for each sample and the square root (proper distance metric) of all pair wise JS divergences between samples was calculated. Manually selected clades of samples were analyzed for differential expression in a similar way as was done for facets (see above). In summary, differentially expressed enhancers (robust set) were identified by Kruskal-Wallis rank sum tests (Benjamini-Hochberg FDR<0.05) and subsequent NDWD post-hoc tests were performed to find all significant pair-wise differences (Bonferroni single-step adjusted P<0.05) between clades.
30
Hierarchical clustering of enhancers We used matrices describing each enhancer expression in TPMs for each facet (primary cell facets and tissue facets were clustered independently) and clustered these by complete linkage agglomerative hierarchical clustering using Euclidan distances, as implemented in the gputools R package62, and ran these in parallel on a GTX960 Nvidia GPU. Due to limited memory in the GPU, we reduced the matrices to enhancers with total expression > 2.5 TPM in the primary cell set and >0.6 TPM in the tissue/organ set, resulting in sets of roughly 22.500 enhancers each. To make sure these results were stable, we also explored normalization using fold change vs. background in each facet instead of TPM normalization, which resulted in very similar results (data not shown). We then used the cutree method to select 5 sub-clusters in each tree, starting from the root. Enhancers in each set were then extended +-300 nt from their midpoints, and CpG islands and observed / expected CpG ratios were calculated. The resulting sub-clusters broke up enhancers into 201 and 247 ubiquitous enhancers (u-enhancers) defined by cell type and tissue facets, respectively, (these sets intersect by 106 enhancers) and non-ubiquitous enhancers. To summarize the features of u-enhancers in terms of expression width and variance, identified in a single plot, we used those enhancers falling into u-enhancer group from the tissue clustering. We then plotted the mean TPM over all tissue facets, as well as the coefficient of variation (expression variance over all tissue facets scaled by mean expression). Then we repeated this for the remaining enhancers (non-u-enhancers).
Zebrafish reporter transgenesis experiments We selected enhancers for validation based on human-zebrafish conservation (>70% sequence identity over 100 nt, hg19 vs DanRer7) in order to take into account the large evolutionary separation between the two species, and selected enhancers that were only expressed in a subset of tissues/cells. We did not take epigenetic data (ChIP/DHS etc.) into consideration. We also selected three negative control regions, chosen randomly from the human genome with the following constraints: low conservation with zebrafish and no other enhancer-selective feature, that is, no DNase hypersensitivity, no H3K4me1 or H3K27ac signals and CAGE signal only at noise levels. Selected human enhancers (CRE1-5) were amplified from human genomic DNA using primers (Supplementary Table 9). PCR products were purified using NucleoSpin Gel and PCR Clean-up Kit (Macherey Nagel) and were digested using appropriate enzymes (listed in Supplementary Table 9). Human enhancers were cloned into EcoRV/SpeI or HindIII/EcoRI sites of pDB896 vector (gift from Darius Balciunas) upstream of zebrafish gata2 promoter63,64 and YFP reporter gene. Plasmid DNA was purified using NucleoBond® Xtra Midi Kit (Macherey Nagel) and quality checked by sequencing before injections. Zebrafish stocks (Danio rerio) were kept and used according to Home Office regulations (UK) at the University of Birmingham. For these experiments wild-type fish (AB* strain) were used. Adults were crossed pairwise and eggs were collected 10-15 minutes after fertilization. Microinjection solutions contained 30 ng/µl of plasmid DNA, 0,2% of phenol red (Sigma) and 15 ng/µl of Tol2 mRNA transcribed in vitro from pCS2:Tol2 plasmid using mMESSAGE
31
machine SP6 Kit (Ambion). Injections were performed through the chorion and into the cytoplasm of zygotes using an analogue pressure-controlled microinjector (Tritech Research). More than 200 eggs were injected per construct and experiments were replicated at least three times. Embryos were kept according to65 in E3 Medium containing 50 ng/ml of gentamicin (Fisher Scientific) and 0,03% phenylthiourea (PTU, Sigma) in an incubator at 28.5ºC. Injected embryos were screened during the first 5 days post-fertilization using a Nikon SMZ1500 fluorescence stereomicroscope. Specific expression patterns were documented at 48 hpf and levels of expression were quantified by counting the number of embryos showing enhancer-specific expression. In order to control for overall background activity from the construct (ie, promoter, backbone) an empty pDB896 vector containing gata2 zebrafish promoter linked to the reporter gene but lacking an enhancer sequence was used. Any tissue-specific enrichment shown by enhancer-containing vectors over the activity shown by the empty control vector was considered enhancer-specific. Additionally, three negative regions were also cloned to check the specificity of the enhancer selection process. These regions were chosen randomly from the human genome to have low conservation with zebrafish and no other enhancer-selective feature, that is, no DNase I hypersensitivity, no H3K4me1 or H3K27ac signals and CAGE signal only at noise levels. In parallel, 5 selected human enhancers were also analyzed. See Supplementary Table 9 for a summary of zebrafish validations, including expression patterns, signal strengths and primers.
Analysis of cohesin data We used MCF7 cell ChIP experiments with antibodies targeting STAG1 and RAD21 proteins, downloaded from the Short Read archive (accession ERR011980, ERR011982). These were mapped using Bowtie50 with standard settings but discarding non-unique hits, and peak-called using MACS53 with default settings. We then used the intersection between peak sets as proxy binding sites for the cohesin complex.
Linking TSSs and enhancers by expression correlations We identified all intra-chromosomal enhancer-promoter pairs (470,315 cases, permissive set of enhancers and unique locations of RefSeq protein-coding gene transcript TSSs +/- 500 bp) within 500 kb, in which the TSS was expressed >1 TPM in at least one sample, and performed Pearson correlation tests between the expression of such pairs: 64% of enhancers had at least one significant association (Benjamini-Hochberg FDR <= 1e-5) within that distance. On average, a TSS was associated with 4.9 enhancers and an enhancer with 2.4 TSSs. Next, we identified which predicted associations were supported by ENCODE ChIA-PET (via RNAPII (MMS-126R)) interaction data21 from four ENCODE cell lines (HCT-116, HeLa-S3, K562, MCF-7) by requiring an overlap of both enhancer and promoter in both (and different) sites of a ChIA-PET interaction pair. An association was considered supported if it overlapped in this way with any cell line replicate of interactions. For comparison, the fraction of 1,672,958 published10 predicted enhancer-promoter associations derived from DNase data supported by ENCODE ChIA-PET interaction data was calculated.
32
Analysis of genomic clusters of densely positioned enhancers By pairwise distance calculations between CAGE enhancers, we identified clusters of densely positioned enhancers in the genome. 815 regions of length >=2kb containing >2 enhancers were identified. Of these, 198 regions contained enhancers whose average pairwise expression correlation (Pearson’s r) were >=0.75. The expression of associated Refseq genes (see ‘Linking TSSs and enhancers by expression correlations’) as well as their enrichment of gene ontology biological process terms (via the DAVID tool66) were compared to that of genes associated with non-clustered enhancers.
Inferring regulatory architectures by multiple linear regression Multiple linear regression was performed for all 25,144 expressed (max TPM >1) RefSeq TSSs with at least ten FANTOM5 CAGE-defined enhancers within 500 kb. Enhancers were ranked by proximity to the TSS and the expression values across all samples of the ten closest were used as predictor variables in a model with the TSS expression as response variable. The expression data of enhancers and TSSs were centered and rescaled. 2,206 TSS models, considering in total 11,386 enhancers, with R2 ≥ 0.5 were considered for further analyses. We also fitted a simple linear regression model using each enhancer as predictor variable on their own, in order to compare the predictive power of a single enhancer to the power of using all ten. We defined a new measure of ‘proportional contribution’ to the variance explained as the ratio between simple linear regression r2 and multiple linear regression R2, for each enhancer among the ten considered for each TSS. This measure yielded highly similar ranking results of enhancers as the R2 contribution averaged over orderings among regressors67,68 and R2 decorrelation decomposition67,69 (data not shown), implemented in the ‘relaimpo’ R package37,69 (lmg and car methods, respectively). We used ranking of enhancers according to proportional contribution and within-model enhancer-enhancer correlations to identify TSSs with different enhancer architectures. Redundant enhancers were identified for TSSs that had enhancers that were, by proportional contribution, ranked second and onwards with at least some proportional contribution (>0.2) and high correlation (Pearson’s r>0.7) with any other of the nine enhancers in the model. Patterning architectures were considered for enhancers in non-redundant models that were, by proportional contribution, ranked second and onwards with at least some proportional contribution (>0.2) and low correlation (Pearson’s r<0.3) with all other of the nine enhancers in the model. Penalized lasso-based regression was used to reduce the number of enhancers in the models. The optimal models were selected using 100-fold cross validation and the largest value of lambda such that the mean squared error was within one standard error of the minimum, using the R package glmnet29,37
SNP analysis The NIH NHGRI catalog of published genome-wide association studies29 (GWAS catalog, downloaded May 7, 2012) contained 7,899 SNP-disease/trait associations. We extended this set to 190,356 autosomal associations by propagating disease/trait associations to proxy SNPs using the SNAP proxy search tool70 (http://www.broadinstitute.org/mpg/snap/) based on linkage
33
disequilibrium (r2 > 0.8) between SNPs (within 250kb) in any of the three populations in the 1000 genomes project pilot71 data. The 1000 genome data coordinates were in hg18 coordinates and were mapped to hg19 using the UCSC liftOver tool72. For robust enhancers (center +/- 200 bp), promoters (unique locations of RefSeq protein-coding gene transcript TSSs +/- 200 bp), exons (unique locations of RefSeq protein-coding gene transcript inner exons), and random regions (described above), we calculated the number of overlapping and non-overlapping GWAS SNPs associated with each disease/trait in the extended GWAS catalog. Non-associated SNPs were extracted from the NCBI single nucleotide polymorphism database (dbSNP, build 135). For each genomic feature and disease/trait with an odds ratio > 1, we tested whether the observed overlap was significantly greater than expected (Fisher’s exact test P < 0.01). Only diseases/traits with more than three SNPs overlapping were tested. The same analysis was repeated for each set of significantly expressed enhancers associated with each facet. For ease of visualization and interpretation, only odds ratios for which the filtering criteria on both significance and overlap number were met are shown. Lists of enhancer-overlapped GWAS SNPs are in S16.
Statistical tests, visualization and tools used Statistical tests were done in the R environment (http://www.R-project.org). Graphs were made using lattice, ggplot2 and gplots R packages. Cluster trees were generated by the APE73 R package and visualized using the FigTree software (http://tree.bio.ed.ac.uk/software/figtree/). Intersections of and distances between various genomic features were calculated using BEDTools74
REFERENCES (for the editors: 1-38 are from main text and methods summary) 1. Bulger, M. & Groudine, M. Enhancers: The abundance and function of regulatory
sequences beyond promoters. Developmental Biology 339, 250–257 (2010). 2. Lenhard, B., Sandelin, A. & Carninci, P. Metazoan promoters: emerging
characteristics and insights into transcriptional regulation. Nat Rev Genet 13, 233–245 (2012).
3. Banerji, J., Rusconi, S. & Schaffner, W. Expression of a β-globin gene is enhanced by remote SV40 DNA sequences. Cell 27, 299–308 (1981).
4. Kim, T.-K. et al. Widespread transcription at neuronal activity-regulated enhancers. Nature 465, 182–187 (2010).
5. Kodzius, R. et al. CAGE: cap analysis of gene expression. Nature methods 3, 211–222 (2006).
6. The FANTOM Consortium. A promoter level mammalian expression atlas. Submitted 7. The ENCODE Consortium. P. An integrated encyclopedia of DNA elements in the
human genome. Nature 489, 57–74 (2012). 8. Kheradpour, P. et al. Systematic dissection of regulatory motifs in 2000 predicted
human enhancers using a massively parallel reporter assay. Genome Research 23, 800–811 (2013).
9. Fort, A. et al. Deep transcriptome profiling reveals that retrotransposons regulate pluripotency. Submitted
10. Thurman, R. E. et al. The accessible chromatin landscape of the human genome. Nature 489, 75–82 (2012).
11. Ntini, E. et al. Polyadenylation site–induced decay of upstream transcripts enforces promoter directionality. Nat Struct Mol Biol 20, 923–928 (2013).
34
12. Almada, A. E., Wu, X., Kriz, A. J., Burge, C. B. & Sharp, P. A. Promoter directionality is controlled by U1 snRNP and polyadenylation signals. Nature 499, 360–363 (2013).
13. Djebali, S. et al. Landscape of transcription in human cells. Nature 489, 101–108 (2012).
14. Kowalczyk, M. S. et al. Intragenic Enhancers Act as Alternative Promoters. Molecular Cell 45, 447–458 (2012).
15. Valen, E. et al. Biogenic mechanisms and utilization of small RNAs derived from human protein-coding genes. Nat Struct Mol Biol 18, 1075–1082 (2011).
16. Taft, R. J. et al. Tiny RNAs associated with transcription start sites in animals. Nat Genet 41, 572–578 (2009).
17. Core, L. J., Waterfall, J. J. & Lis, J. T. Nascent RNA Sequencing Reveals Widespread Pausing and Divergent Initiation at Human Promoters. Science 322, 1845–1848 (2008).
18. Rönnerblad, M. et al. Analysis of the DNA methylome and transcriptome in granulopoiesis reveal timed changes and dynamic enhancer methylation. Submitted
19. Biddie, S. C. et al. Transcription Factor AP1 Potentiates Chromatin Accessibility and Glucocorticoid Receptor Binding. Molecular Cell 43, 145–155 (2011).
20. Schmidt, D. et al. A CTCF-independent role for cohesin in tissue-specific transcription. Genome Res 20, 578–588 (2010).
21. Li, G. et al. Extensive Promoter-Centered Chromatin Interactions Provide a Topological Basis for Transcription Regulation. Cell 148, 84–98 (2012).
22. Chepelev, I., Wei, G., Wangsa, D., Tang, Q. & Zhao, K. Characterization of genome-wide enhancer-promoter interactions reveals co-expression of interacting genes and modes of higher order chromatin organization. Cell Res 22, 490–503 (2012).
23. Fraser, P., Pruzina, S., Antoniou, M. & Grosveld, F. Each hypersensitive site of the human beta-globin locus control region confers a different developmental pattern of expression on the globin genes. Genes & Development 7, 106–113 (1993).
24. Dostie, J. et al. Chromosome Conformation Capture Carbon Copy (5C): A massively parallel solution for mapping interactions between genomic elements. Genome Research 16, 1299–1309 (2006).
25. Barolo, S. Shadow enhancers: Frequently asked questions about distributed cis-regulatory information and enhancer redundancy. Bioessays 34, 135–141 (2011).
26. Schaffner, G., Schirm, S., Müller-Baden, B., Weber, F. & Schaffner, W. Redundancy of information in enhancers as a principle of mammalian transcription control. J. Mol. Biol. 201, 81–90 (1988).
27. Whyte, W. A. et al. Master Transcription Factors and Mediator Establish Super-Enhancers at Key Cell Identity Genes. Cell 153, 307–319 (2013).
28. Göring, H. H. H. et al. Discovery of expression QTLs using large-scale transcriptional profiling in human lymphocytes. Nat Genet 39, 1208–1216 (2007).
29. Hindorff, L. A. et al. Potential etiologic and functional implications of genome-wide association loci for human diseases and traits. Proceedings of the National Academy of Sciences 106, 9362–9367 (2009).
30. Ward, L. D. & Kellis, M. HaploReg: a resource for exploring chromatin states, conservation, and regulatory motif alterations within sets of genetically linked variants. Nucleic Acids Research 40, D930–D934 (2011).
31. Maurano, M. T., Wang, H., Kutyavin, T. & Stamatoyannopoulos, J. A. Widespread Site-Dependent Buffering of Human Regulatory Polymorphism. PLoS Genet 8, e1002599 (2012).
32. Mercer, E. M. et al. Multilineage Priming of Enhancer Repertoires Precedes Commitment to the B and Myeloid Cell Lineages in Hematopoietic Progenitors. Immunity 35, 413–425 (2011).
33. Ostuni, R. et al. Latent Enhancers Activated by Stimulation in Differentiated Cells. Cell 152, 157–171 (2013).
34. Rada-Iglesias, A. et al. A unique chromatin signature uncovers early developmental enhancers in humans. Nature 470, 279–283 (2010).
35. Shen, Y. et al. A map of the cis-regulatory sequences in the mouse genome. Nature 488, 116–120 (2012).
36. Heinz, S. et al. Simple Combinations of Lineage-Determining Transcription Factors Prime cis-Regulatory Elements Required for Macrophage and B Cell Identities. Molecular Cell 38, 576–589 (2010).
35
37. Friedman, J., Hastie, T. & Tibshirani, R. Regularization Paths for Generalized Linear Models via Coordinate Descent. Journal of Statistical Software 33, 1–22 (2010).
38. Gehrig, J. et al. Automated high-throughput mapping of promoter-enhancer interactions in zebrafish embryos. Nature methods 6, 911–916 (2009).
39. Kanamori-Katayama, M. et al. Unamplified cap analysis of gene expression on a single-molecule sequencer. Genome Research 21, 1150–1159 (2011).
40. Khalil, A. M. et al. Many human large intergenic noncoding RNAs associate with chromatin-modifying complexes and affect gene expression. Proceedings of the National Academy of Sciences 106, 11667–11672 (2009).
41. Robinson, M. D., McCarthy, D. J. & Smyth, G. K. edgeR: a Bioconductor package for differential expression analysis of digital gene expression data. Bioinformatics 26, 139–140 (2009).
42. Hoffman, M. M. et al. Unsupervised pattern discovery in human chromatin structure through genomic segmentation. Nature methods 9, 473–476 (2012).
43. Ernst, J. & Kellis, M. ChromHMM: automating chromatin-state discovery and characterization. Nature methods 9, 215–216 (2012).
44. Heintzman, N. D. et al. Histone modifications at human enhancers reflect global cell-type-specific gene expression. Nature 459, 108–112 (2009).
45. Marshall, O. J. PerlPrimer: cross-platform, graphical primer design for standard, bisulphite and real-time PCR. Bioinformatics 20, 2471–2472 (2004).
46. Trapnell, C., Pachter, L. & Salzberg, S. L. TopHat: discovering splice junctions with RNA-Seq. Bioinformatics 25, 1105–1111 (2009).
47. Trapnell, C. et al. Transcript assembly and quantification by RNA-Seq reveals unannotated transcripts and isoform switching during cell differentiation. Nat Biotechnol 28, 511–515 (2010).
48. Preker, P. et al. RNA Exosome Depletion Reveals Transcription Upstream of Active Human Promoters. Science 322, 1851–1854 (2008).
49. Takahashi, H., Lassmann, T., Murata, M. & Carninci, P. 5′ end–centered expression profiling using cap-analysis gene expression and next-generation sequencing. Nat Protoc 7, 542–561 (2012).
50. Langmead, B., Trapnell, C., Pop, M. & Salzberg, S. L. Ultrafast and memory-efficient alignment of short DNA sequences to the human genome. Genome Biol. 10, R25 (2009).
51. Carninci, P. et al. Genome-wide analysis of mammalian promoter architecture and evolution. Nat Genet 38, 626–635 (2006).
52. Pham, T. H. et al. Dynamic epigenetic enhancer signatures reveal key transcription factors associated with monocytic differentiation states. Blood 119, e161–e171 (2012).
53. Zhang, Y. et al. Model-based Analysis of ChIP-Seq (MACS). Genome Biol. 9, R137 (2008).
54. Schmidl, C. et al. Lineage-specific DNA methylation in T cells correlates with histone methylation and enhancer activity. Genome Research 19, 1165–1174 (2009).
55. Klug, M. & Rehli, M. Functional analysis of promoter CpG methylation using a CpG-free luciferase reporter vector. Epigenetics 1, 127–130 (2006).
56. Rehli, M. PU.1 and Interferon Consensus Sequence-binding Protein Regulate the Myeloid Expression of the Human Toll-like Receptor 4 Gene. Journal of Biological Chemistry 275, 9773–9781 (2000).
57. Li, L. C. & Dahiya, R. MethPrimer: designing primers for methylation PCRs. Bioinformatics 18, 1427–1431 (2002).
58. Ehrich, M. et al. Quantitative high-throughput analysis of DNA methylation patterns by base-specific cleavage and mass spectrometry. Proceedings of the National Academy of Sciences 102, 15785–15790 (2005).
59. Lin, J. Divergence measures based on the Shannon entropy. IEEE Trans. Inform. Theory 37, 145–151 (1991).
60. Nonparametric statistical methods. (Wiley-Interscience, 1999). 61. Hothorn, T., Hornik, K., Van De Wiel, M. A. & Zeileis, A. A lego system for conditional
inference. The American Statistician 60, 257–263 (2006). 62. Buckner, J. et al. The gputools package enables GPU computing in R. Bioinformatics
26, 134–135 (2009). 63. Ellingsen, S. et al. Large-scale enhancer detection in the zebrafish genome.
Development 132, 3799–3811 (2005).
36
64. Meng, A., Tang, H., Ong, B. A., Farrell, M. J. & Lin, S. Promoter analysis in living zebrafish embryos identifies a cis-acting motif required for neuronal expression of GATA-2. Proc. Natl. Acad. Sci. U.S.A. 94, 6267–6272 (1997).
65. The Zebrafish Book. A Guide for the Laboratory Use of Zebrafish(Danio rerio). (University of Oregon Press, 1995).
66. Huang, D. W., Sherman, B. T. & Lempicki, R. A. Systematic and integrative analysis of large gene lists using DAVID bioinformatics resources. Nat Protoc 4, 44–57 (2008).
67. Zuber, V. & Strimmer, K. High-Dimensional Regression and Variable Selection Using CAR Scores. Statistical Applications in Genetics and Molecular Biology 10, 1–27
68. Chevan, A. & Sutherland, M. Hierarchical Partitioning. The American Statistician 45, 90–96 (1991).
69. Groemping, U. Relative Importance for Linear Regression in R: The Package relaimpo. Journal of Statistical Software 17, 27 (2006).
70. Johnson, A. D. et al. SNAP: a web-based tool for identification and annotation of proxy SNPs using HapMap. Bioinformatics 24, 2938–2939 (2008).
71. Durbin, R. M. et al. A map of human genome variation from population-scale sequencing. Nature 467, 1061–1073 (2010).
72. Rhead, B. et al. The UCSC Genome Browser database: update 2010. Nucleic Acids Research 38, D613–D619 (2009).
73. Paradis, E., Claude, J. & Strimmer, K. APE: Analyses of Phylogenetics and Evolution in R language. Bioinformatics 20, 289–290 (2004).
74. Quinlan, A. R. & Hall, I. M. BEDTools: a flexible suite of utilities for comparing genomic features. Bioinformatics 26, 841–842 (2010).