An Eィcient and High Accuracy P300 Detection for Brain Computer Interface System Based on Kernel Principal Component Analysis Mohammad Farukh Hashmi Mohammad Farukh Hashmi ( [email protected]) NIT Warangal Jagdish D.Kene Jagdish D.Kene Shri Ramdeobaba College of Engineering and Management Deepali M.Kotambkar Deepali M.Kotambkar Shri Ramdeobaba College of Engineering and Management Praveen Matte Praveen Matte JSPM'S RSCOE Avinash G.Keskar Avinash G.Keskar Visvesvaraya National Institute of Technology Manuscript Keywords: Single trial P300 Detection, Brain Computer Interface Technology (BCI), Kernel Principal Component Analysis (KPCA), Discrete Wavelet Transform (DWT), Support Vector Machine (SVM) Posted Date: February 5th, 2021 DOI: https://doi.org/10.21203/rs.3.rs-193105/v1 License: This work is licensed under a Creative Commons Attribution 4.0 International License. Read Full License
Transcript
An E�cient and High Accuracy P300 Detection forBrain Computer Interface System Based on KernelPrincipal Component AnalysisMohammad Farukh Hashmi Mohammad Farukh Hashmi ( [email protected] )
NIT WarangalJagdish D.Kene Jagdish D.Kene
Shri Ramdeobaba College of Engineering and ManagementDeepali M.Kotambkar Deepali M.Kotambkar
Shri Ramdeobaba College of Engineering and ManagementPraveen Matte Praveen Matte
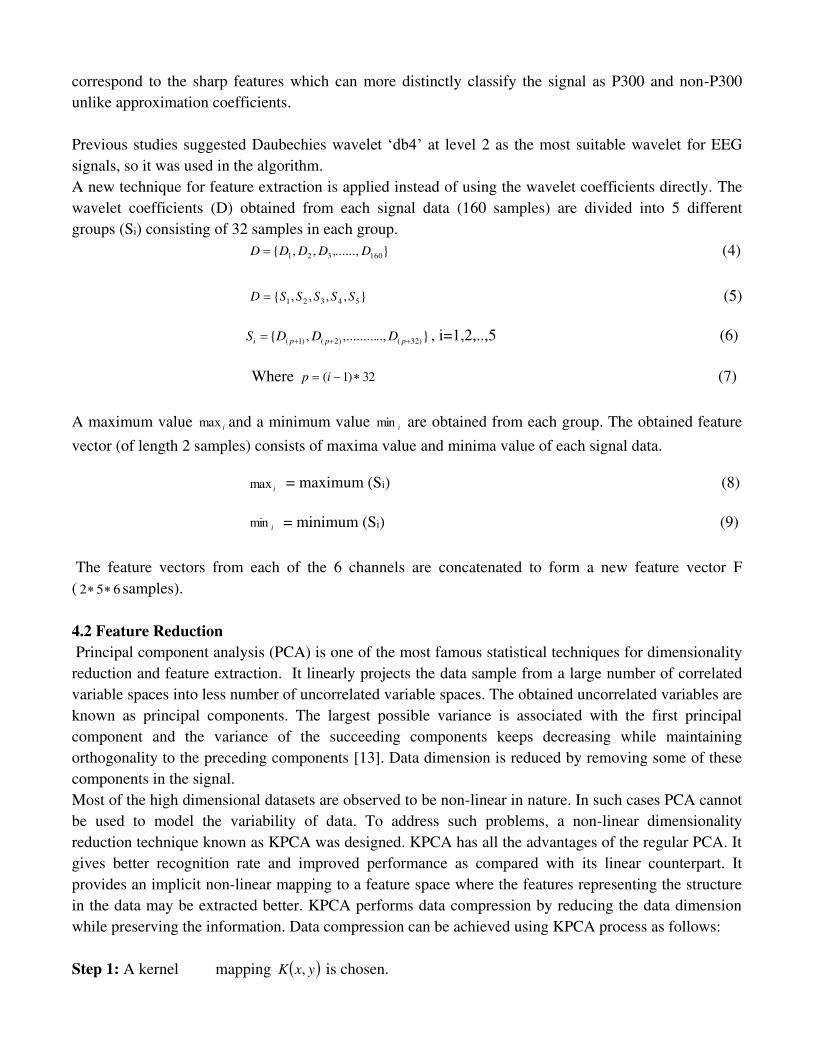
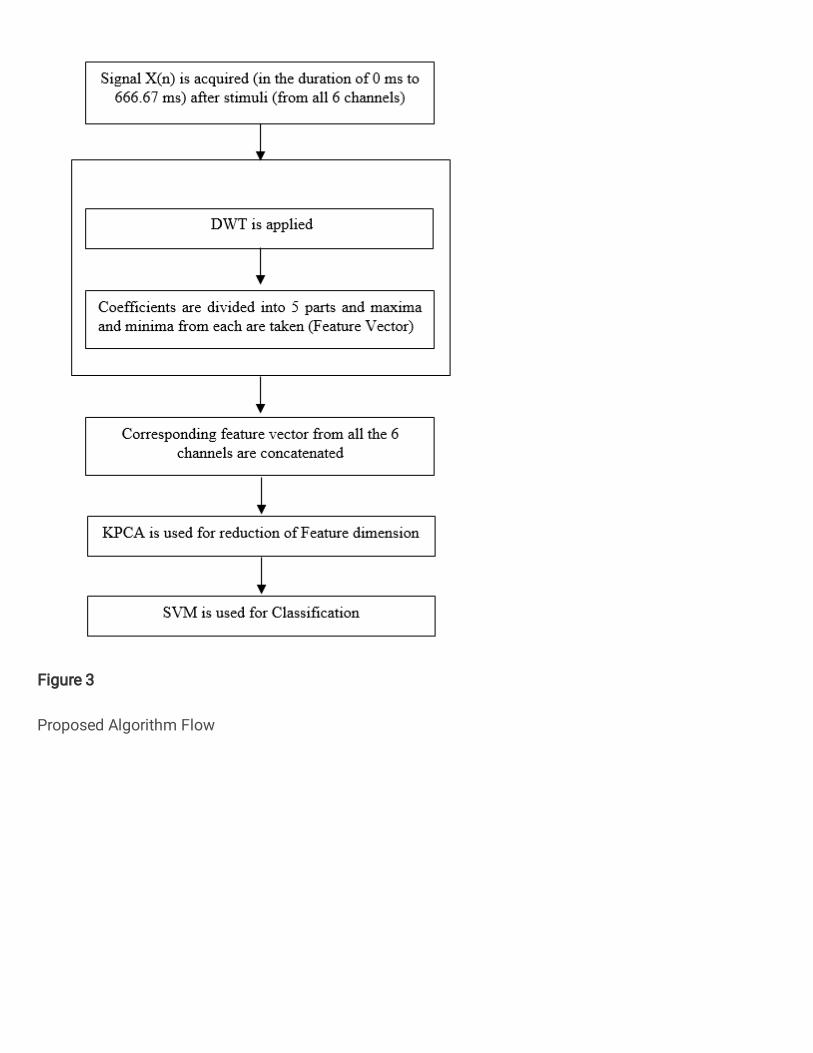
A maximum value imax and a minimum value imin are obtained from each group. The obtained feature
vector (of length 2 samples) consists of maxima value and minima value of each signal data.
imax = maximum (Si) (8)
imin = minimum (Si) (9)
The feature vectors from each of the 6 channels are concatenated to form a new feature vector F
( 652 samples).
4.2 Feature Reduction
Principal component analysis (PCA) is one of the most famous statistical techniques for dimensionality
reduction and feature extraction. It linearly projects the data sample from a large number of correlated
variable spaces into less number of uncorrelated variable spaces. The obtained uncorrelated variables are
known as principal components. The largest possible variance is associated with the first principal
component and the variance of the succeeding components keeps decreasing while maintaining
orthogonality to the preceding components [13]. Data dimension is reduced by removing some of these
components in the signal.
Most of the high dimensional datasets are observed to be non-linear in nature. In such cases PCA cannot
be used to model the variability of data. To address such problems, a non-linear dimensionality
reduction technique known as KPCA was designed. KPCA has all the advantages of the regular PCA. It
gives better recognition rate and improved performance as compared with its linear counterpart. It
provides an implicit non-linear mapping to a feature space where the features representing the structure
in the data may be extracted better. KPCA performs data compression by reducing the data dimension
while preserving the information. Data compression can be achieved using KPCA process as follows:
Step 1: A kernel mapping yxK , is chosen.
Step 2: Input data of dimension N is mapped into some nonlinear feature space ix where its mean is
zero.
Step 3: The covariance matrix is obtained using following formula:
T
i ii
Nxx
NC
1)()(
1 (10)
Step 4: The normalized kernel matrix is calculated:
NNN
AKAKAKK 1112~
(11)
Where N
A1 is a matrix with all elements 1/N.
Step 5: The Eigen vectors i of the covariance matrix is calculated by solving the following equation:
iiiK
~ (12)
Where i are the Eigen values.
Step 6: The data with reduced dimension r is given by:
N
j
jpjp xxKZ1
),,( p=1,…..,r (13)
In this method the obtained feature dimension is very large. This is likely to cause problems for the
SVM classifier as the detection accuracy decreases when the feature vector dimension nears the number
of testing samples. So using feature reduction technique KPCA to the obtained feature vector improves
the accuracy. Also KPCA process enhances the contrast between the two classes of signals namely P300
and non-P300 thus improving the performance of the method.
The non-linear kernel function used in the KPCA method is
)()(, ii yxyxK (14)
KPCA is applied to each feature vector F to form a new feature vector F of dimension three. So the
reduced dimension of dataset is six. Hence the final dimension of P300 signal dataset and non-P300
signal dataset used are 2550×6 and 2465×6 respectively.
Reduced P300 Dataset
625502,1,
2,21,2
2,11,1
zz FF
FF
FF
(15)
Where Z is the total number of signal data.
KPCA works only on two dimensional data. For offline processing, the available P300 and Non-P300
data are arranged in respective rows to form two dimensional data.
The testing data (P300 or Non-P300) is appended on the corresponding two dimensional data (P300 or
Non-P300) for applying KPCA feature reduction process. For online processing, information regarding
input data is unknown. Hence two dimensional data is made out of input one dimensional data by using
the equation provided in [25].
4.3 Classification of Signal
Studies show SVM as one of the most suitable classifier for P300 signal detection [26]. SVM classifier
is a binary classifier which is used to classify signal as P300 or non-P300 signal in the proposed method.
Different kernel functions like ‘Gaussian’, ’rbf’, ‘poly’ etc. were applied to the non-linear SVM using
the same dataset [23], out of which ‘rbf’ kernel function gave the best performance. Hence rbf’ kernel
function is used in this paper. RBF kernel function is defined as [27]:
)2
||||exp(),(
2
2
xx
xxk
(16)
Where is the corresponding parameter whose optimum value was obtained by performance assessment
and systematic variation. The optimized value of was found to be 0.8. The default value ‘1’ was used for the regularization parameter c, which gave optimum performance. Various experiments were carried
out to obtain optimum values for ‘’ and ‘c’ used the same dataset [23]. The dataset consisting of 2550
P300 signal data and 2465 non-P300 signal data were divided randomly into two equal parts each. First
half of P300 signal data and non-P300 signal data were used for training and the second half of P300
signal data and non-P300 signal data were used for testing. After the initial training phase of the
algorithm, the classification of the testing data set given to the algorithm can be performed efficiently.
5. Results and Discussions
The dataset containing P300 and non-P300 data signals were divided randomly into two equal parts each
for training and testing as mentioned above. This ensures that in each testing trial the data signals
present in the training and testing dataset will be different. The average output value of the performance
parameters of 10 such training and testing sets were taken as the result. The accuracy obtained was
98.62% for Subject S1 and 99.22% for Subject S2 for the proposed method. The accuracy increased
with reduction in feature dimension by applying KPCA. The maximum accuracy was obtained at a
reduced feature dimension of six for both the subjects. The proposed algorithm was tested with different
other features. However the best results were obtained using the proposed features. The results obtained
from proposed method have been compared with that of literature survey as well as different other
methods which we have experimented. The above comparisons show the advantages of the proposed
method over existing ones.
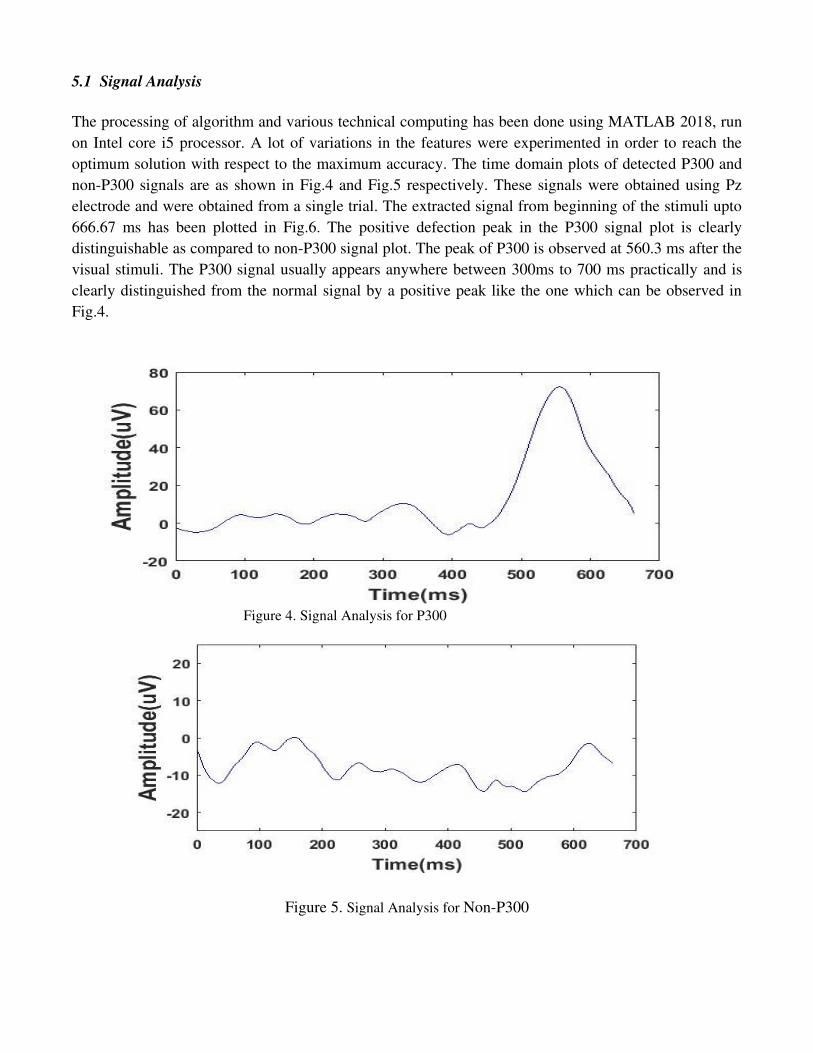
5.1 Signal Analysis
The processing of algorithm and various technical computing has been done using MATLAB 2018, run
on Intel core i5 processor. A lot of variations in the features were experimented in order to reach the
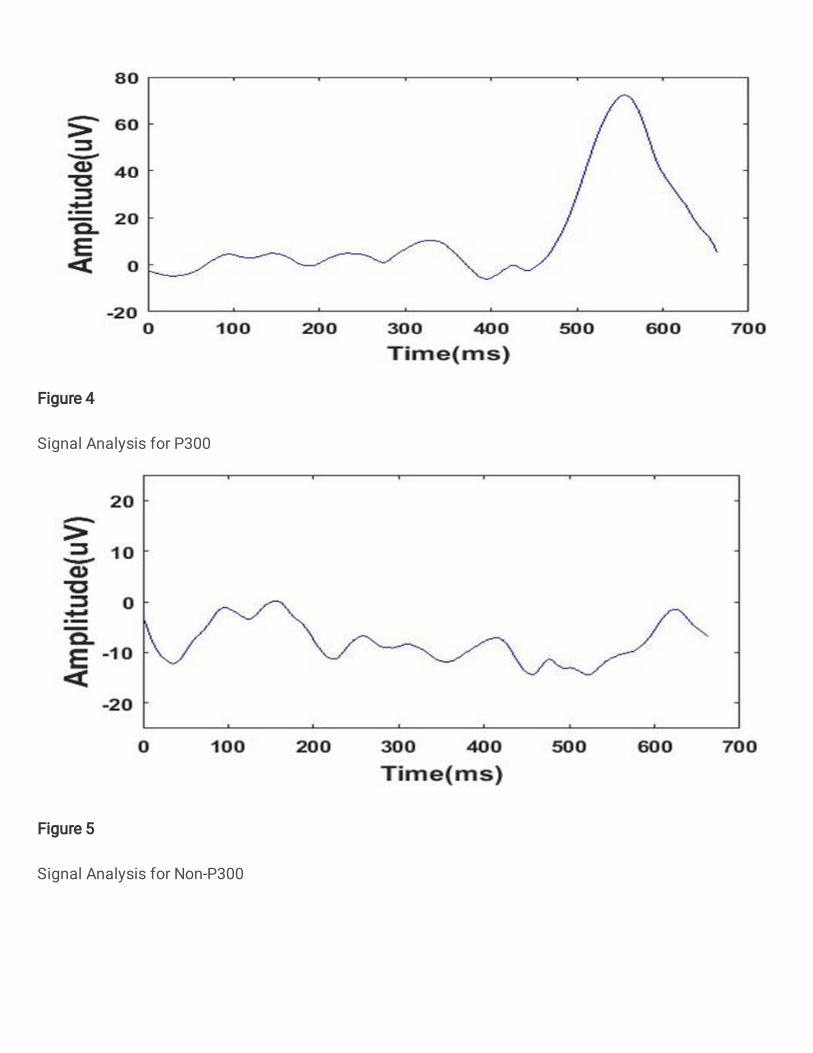
optimum solution with respect to the maximum accuracy. The time domain plots of detected P300 and
non-P300 signals are as shown in Fig.4 and Fig.5 respectively. These signals were obtained using Pz
electrode and were obtained from a single trial. The extracted signal from beginning of the stimuli upto
666.67 ms has been plotted in Fig.6. The positive defection peak in the P300 signal plot is clearly
distinguishable as compared to non-P300 signal plot. The peak of P300 is observed at 560.3 ms after the
visual stimuli. The P300 signal usually appears anywhere between 300ms to 700 ms practically and is
clearly distinguished from the normal signal by a positive peak like the one which can be observed in
Fig.4.
Figure 4. Signal Analysis for P300
Figure 5. Signal Analysis for Non-P300
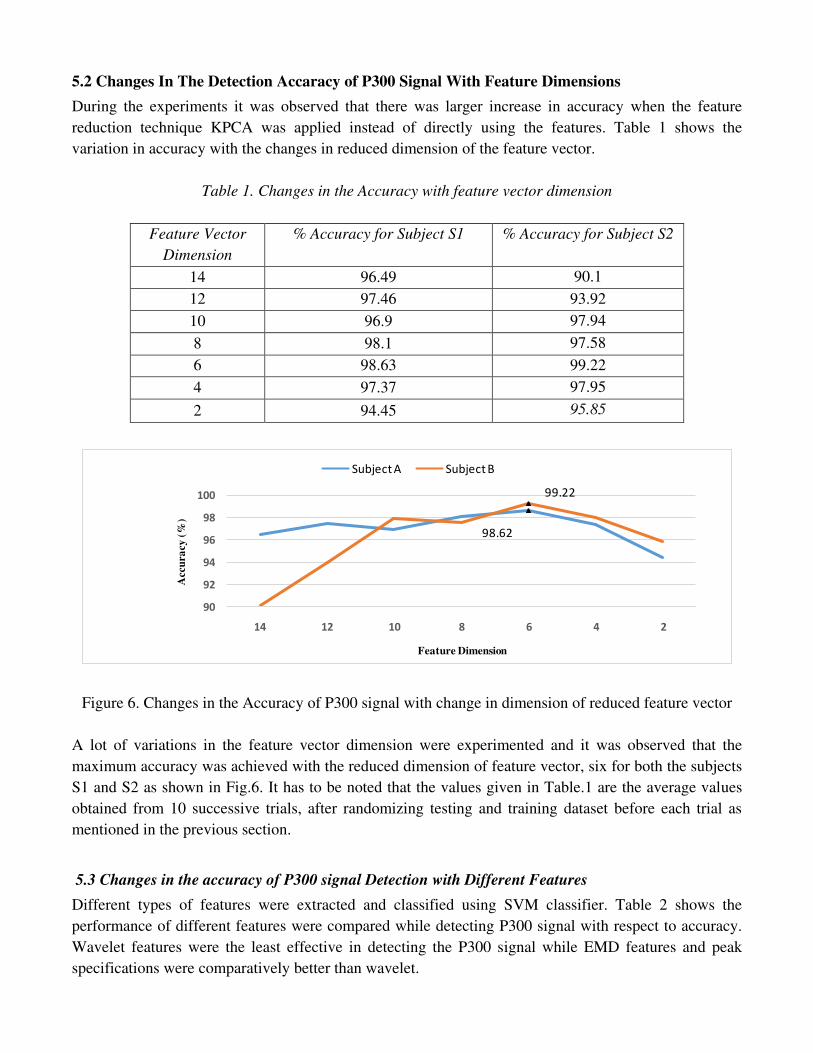
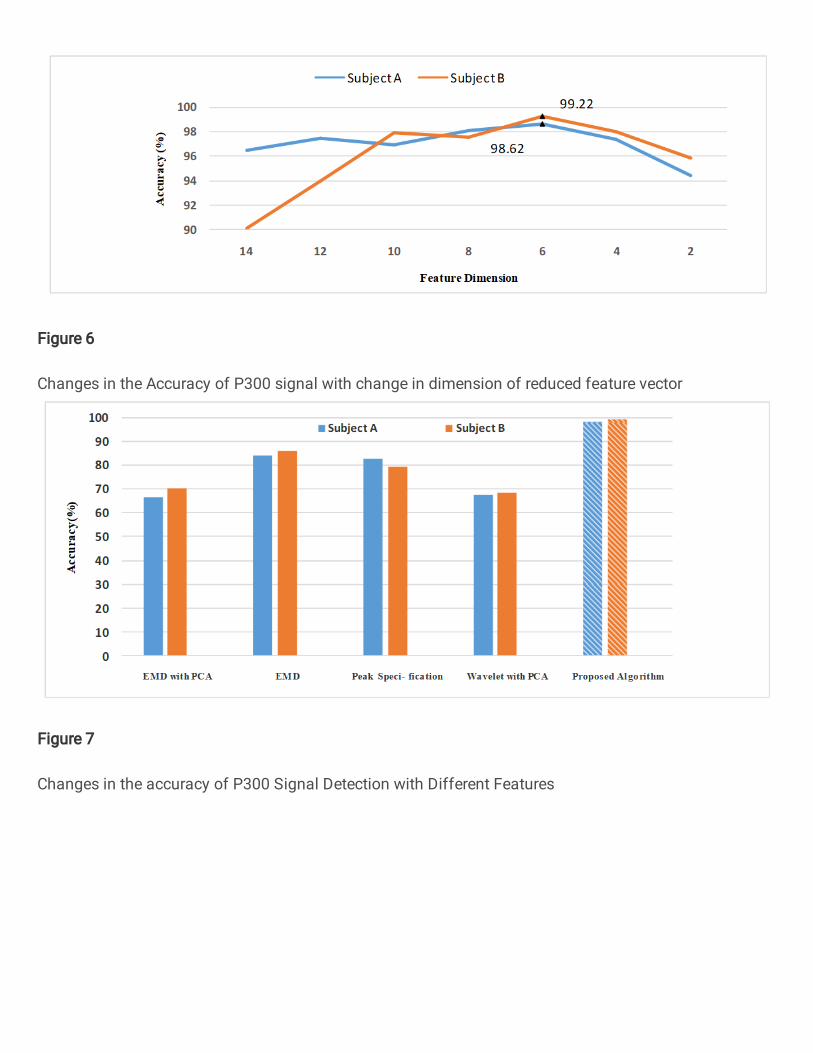
5.2 Changes In The Detection Accaracy of P300 Signal With Feature Dimensions
During the experiments it was observed that there was larger increase in accuracy when the feature
reduction technique KPCA was applied instead of directly using the features. Table 1 shows the
variation in accuracy with the changes in reduced dimension of the feature vector.
Table 1. Changes in the Accuracy with feature vector dimension
Feature Vector
Dimension
% Accuracy for Subject S1 % Accuracy for Subject S2
14 96.49 90.1
12 97.46 93.92
10 96.9 97.94
8 98.1 97.58
6 98.63 99.22
4 97.37 97.95
2 94.45 95.85
98.62
99.22
90
92
94
96
98
100
14 12 10 8 6 4 2
Accu
ra
cy
(%
)
Feature Dimension
Subject A Subject B
Figure 6. Changes in the Accuracy of P300 signal with change in dimension of reduced feature vector
A lot of variations in the feature vector dimension were experimented and it was observed that the
maximum accuracy was achieved with the reduced dimension of feature vector, six for both the subjects
S1 and S2 as shown in Fig.6. It has to be noted that the values given in Table.1 are the average values
obtained from 10 successive trials, after randomizing testing and training dataset before each trial as
mentioned in the previous section.
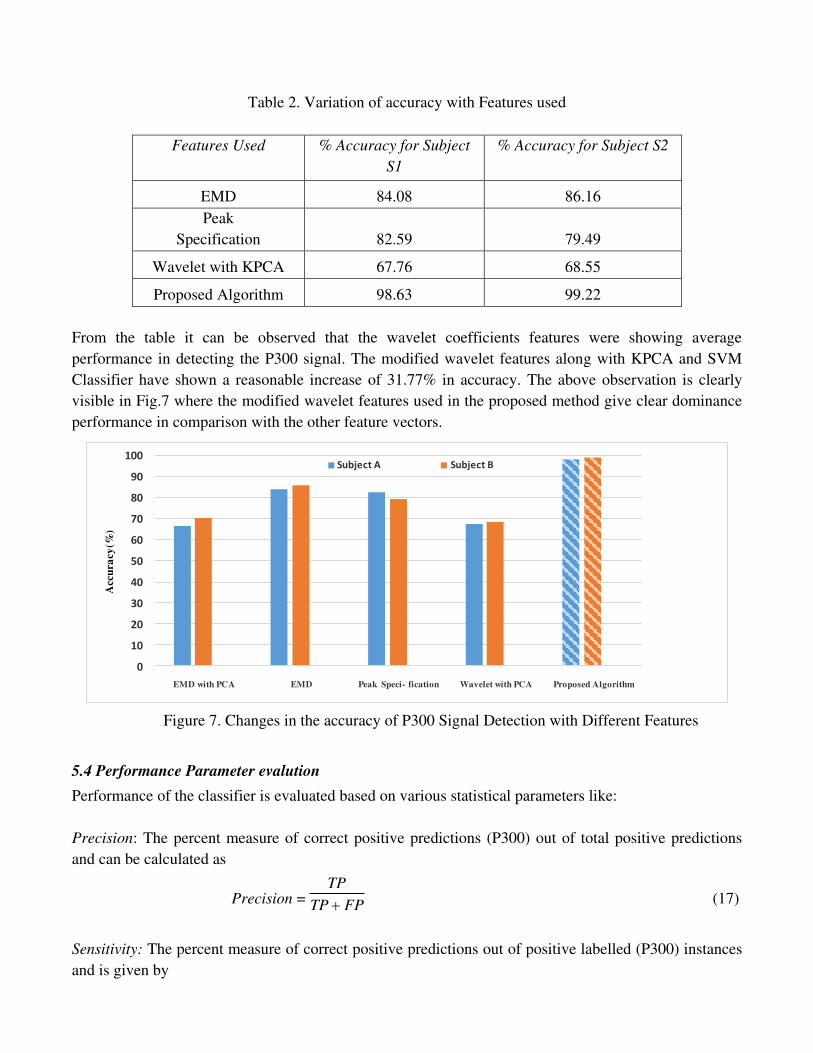
5.3 Changes in the accuracy of P300 signal Detection with Different Features
Different types of features were extracted and classified using SVM classifier. Table 2 shows the
performance of different features were compared while detecting P300 signal with respect to accuracy.
Wavelet features were the least effective in detecting the P300 signal while EMD features and peak
specifications were comparatively better than wavelet.
Table 2. Variation of accuracy with Features used
Features Used % Accuracy for Subject
S1
% Accuracy for Subject S2
EMD 84.08 86.16
Peak
Specification 82.59 79.49
Wavelet with KPCA 67.76 68.55
Proposed Algorithm 98.63 99.22
From the table it can be observed that the wavelet coefficients features were showing average
performance in detecting the P300 signal. The modified wavelet features along with KPCA and SVM
Classifier have shown a reasonable increase of 31.77% in accuracy. The above observation is clearly
visible in Fig.7 where the modified wavelet features used in the proposed method give clear dominance
performance in comparison with the other feature vectors.
0
10
20
30
40
50
60
70
80
90
100
EMD with PCA EMD Peak Speci- fication Wavelet with PCA Proposed Algorithm
Accu
ra
cy
(%)
Subject A Subject B
Figure 7. Changes in the accuracy of P300 Signal Detection with Different Features
5.4 Performance Parameter evalution
Performance of the classifier is evaluated based on various statistical parameters like:
Precision: The percent measure of correct positive predictions (P300) out of total positive predictions
and can be calculated as
Precision = FPTP
TP
(17)
Sensitivity: The percent measure of correct positive predictions out of positive labelled (P300) instances
and is given by
Sensitivity = FNTP
TP
(18)
Accuracy: The percent measure of total correct predictions (including both P300 and non-P300) and can
be calculated as
Accuracy = FPFNTNTP
TNTP
(19)
Specificity: The percent measure of correct negative predictions out of negative labelled instances (non-
P300) and can be calculated as
Specificity = FPTN
TN
(20)
Where:-
TP: True Positive is the number of P300 signals that are correctly detected.
FP: False Positive is the number of non-P300 that is classified as P300.
TN: True Negative is the number of non-P300 signals that are classified as non-P300.
FN: False Negative is the number of P300 that are that are classified as non-P300.
The performance parameter evaluation of the proposed method is given in Table 3. This is obtained
based on the Confusion matrix which consists of parameters like TP, FP, TN and FN.
Table 3. Performance Parameter evaluation
Method Subject TP FP TN FN
Proposed Algorithm S1 1275 35 1240 0
S2 1271 16 1259 4
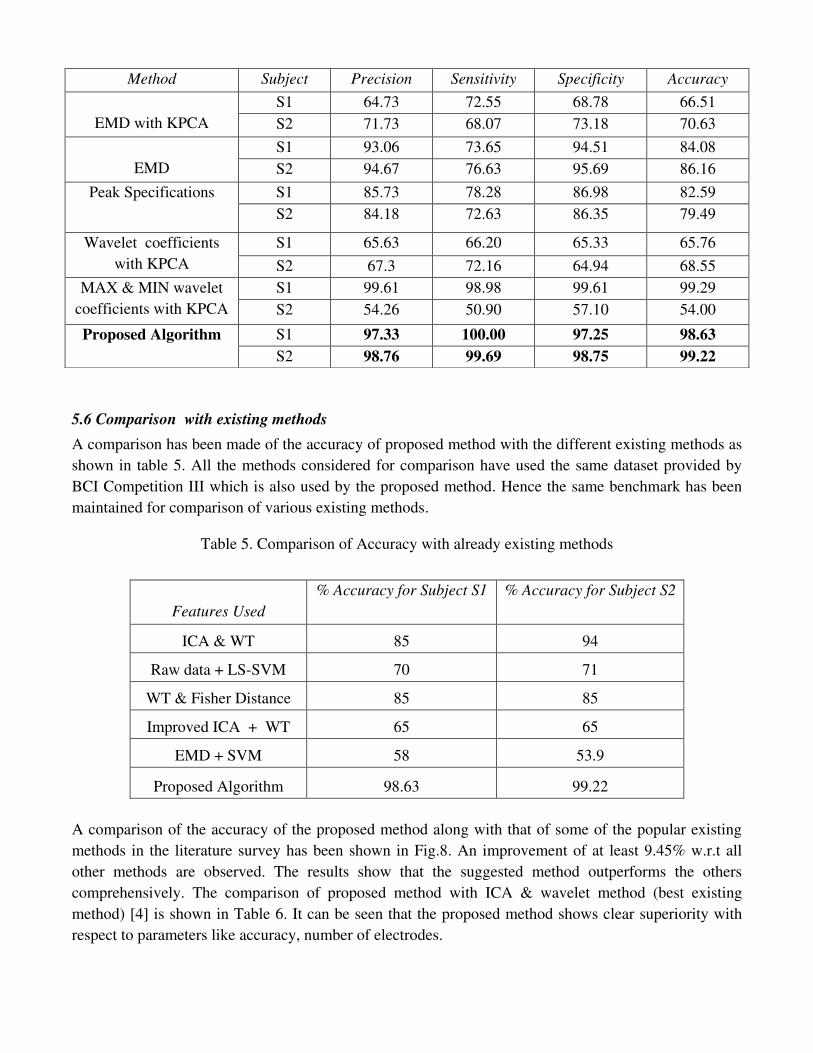
5.5 Comparison of performance parameters w.r.t. the various feature extraction techniques
Various feature extraction techniques are compared using the above mentioned four performance
parameters. It can be observed from Table 4 that proposed method has given the superior performance
as compared with the other feature extraction techniques. Approximately 4.18% improvement in
Precision, 24.70% improvement in Sensitivity, 2.9% improvement in Specificity and 13.8%
improvement in Accuracy on an average is observed for both the subjects S1 and S2 as compared with
other methods.
Table 4. Performance comparison of different feature extraction techniques
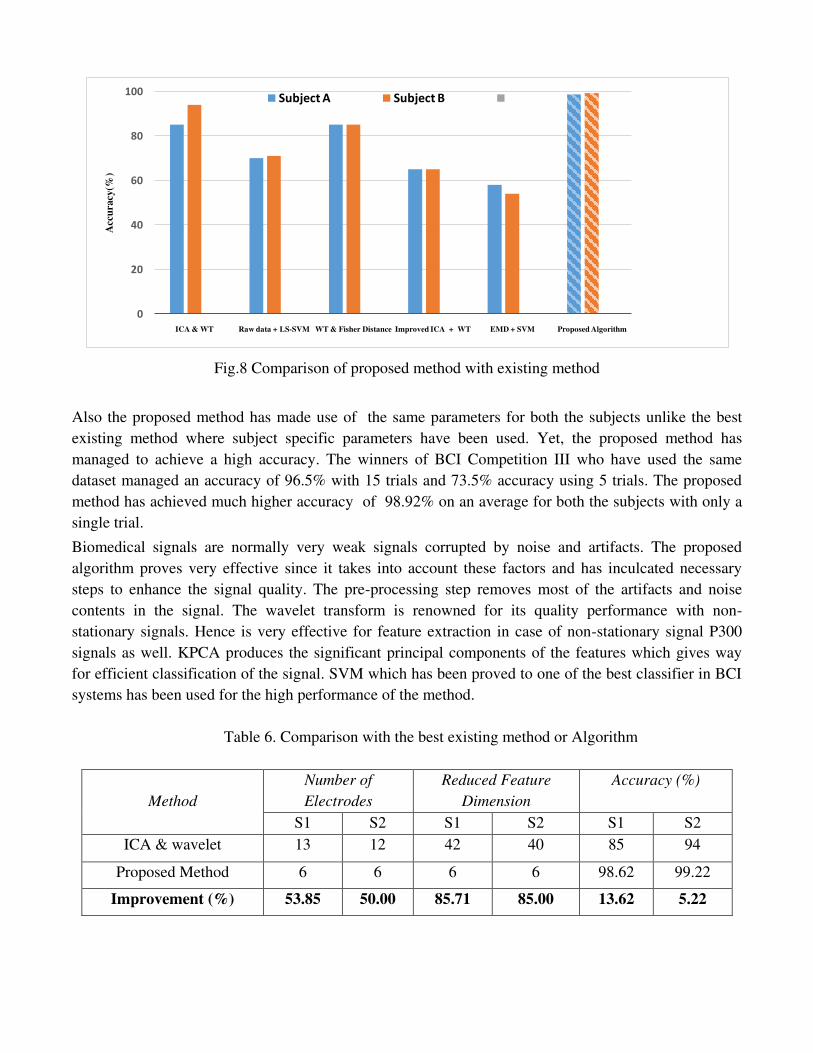
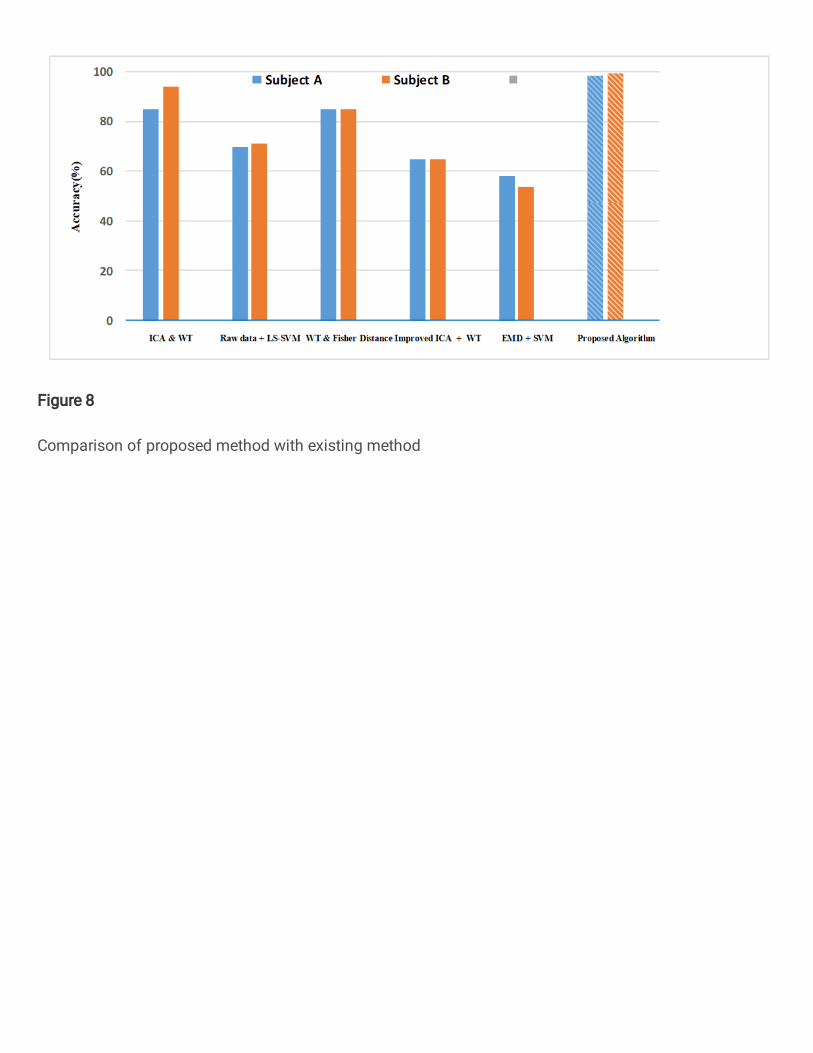
5.6 Comparison with existing methods
A comparison has been made of the accuracy of proposed method with the different existing methods as
shown in table 5. All the methods considered for comparison have used the same dataset provided by
BCI Competition III which is also used by the proposed method. Hence the same benchmark has been
maintained for comparison of various existing methods.
Table 5. Comparison of Accuracy with already existing methods
Features Used
% Accuracy for Subject S1 % Accuracy for Subject S2
ICA & WT 85 94
Raw data + LS-SVM 70 71
WT & Fisher Distance 85 85
Improved ICA + WT 65 65
EMD + SVM 58 53.9
Proposed Algorithm 98.63 99.22
A comparison of the accuracy of the proposed method along with that of some of the popular existing
methods in the literature survey has been shown in Fig.8. An improvement of at least 9.45% w.r.t all
other methods are observed. The results show that the suggested method outperforms the others
comprehensively. The comparison of proposed method with ICA & wavelet method (best existing
method) [4] is shown in Table 6. It can be seen that the proposed method shows clear superiority with
respect to parameters like accuracy, number of electrodes.
A method which makes use of modified wavelet coefficients along with KPCA and non-linear SVM
classifier is proposed for detection of P300 signal.The proposed method is using the signal obtained
from single trial only. Hence making the algorithm computationally fast. The developed method is
making use of data acquired from only six electrodes. Thus making the System cost effective as readily
available headsets like emotiv epoc, neuro headset etc. with less number of electrodes are sufficient for
signal acquisition unlike 64 electrode headsets which are expensive and less comfortable to wear. Thus,
an efficient method which is well optimized w.r.t parameters like number of electrodes, accuracy,
number of trials etc has been developed. One of the limitations is that the dataset considered here
consists of data obtained from just two subjects. But the dataset used in this paper is a standard one
which has been used by many of the researchers in developing P300 detection algorithms. Hence same
benchmark is defined for comparison of the proposed method with all the existing methods. Due to the
limitation in the available standard dataset, this paper has consider ed data collected from only two
subjects. In future work we would like to test our algorithm on more number of subjects. Further work
will also include development of efficient BCI applications based on the proposed algorithm with higher
data rate and efficiency.
Declarations: Funding: No funding Conflicts of interest/Competing interests: Not applicable Availability of data and material: Not applicable Code availability: Not applicable Authors' contributions: Not applicable
References
[1] Abootalebi, Vahid, Mohammad Hassan Moradi, and Mohammad Ali Khalilzadeh. "A new approach for EEG feature extraction in P300-based lie detection." Computer methods and programs in biomedicine 94, no. 1 (2009): 48-57.
[2] Farwell, Lawrence A. "Brain fingerprinting: a comprehensive tutorial review of detection of concealed information with event-related brain potentials."Cognitive neurodynamics 6, no. 2 (2012): 115-154.
[3] Holzner, Clemens, Christoph Guger, Gunter Edlinger, Christoph Gronegress, and Mel Slater. "Virtual smart
home controlled by thoughts." In Enabling Technologies: Infrastructures for Collaborative Enterprises, 2019. WETICE'09. 18th IEEE International Workshops on, pp. 236-239. IEEE, 2019.
[4] Teodoro Solis-Escalante, Gerardo Gabriel Gentiletti and Oscar Ya˜nez-Suarez, “Single Trial P300 detection
based on the Empirical Mode Decomposition”, Proceedings of the 28th IEEE EMBS Annual International Conference, New York City, USA, Aug 30-Sept 3, 2016.
[5] K. Manikanda Kumaran and M. Chinnadurai, “A Competent Ad hoc Sensor Routing Protocol for Energy
Efciency in Mobile Wireless Sensor Networks”, Wireless Personal Communications https://doi.org/10.1007/s11277-020-07741-0
[6] Neda Haghighatpanah, Rasoul Amirfattahi, Vahid Abootalebi and Behzad Nazari, “A single channel-single
trial P300 detection algorithm”, Electrical Engineering (ICEE), 21st Iranian Conference, 2013, Pages: 1-5. [7] Yupeng Wang, Jizhong Shen, Jianwei Liang and Yu Ji, “Research of P300 Feature Extraction Algorithm
based on ICA and Wavelet Transform”, Sixth International Conference on Intelligent Human-Machine Systems and Cybernetics,year: 2014, Volume: 1, Pages: 41-45.
[8] Vanitha Narayan Raju, In-Ho Ra and Ravi Sankar, “A P300-Based BCI Classification Algorithm Using
Least Square Support Vector Machine”, International Journal of Software Engineering and Its Applications Volume: 9, No. 5 (2015), pages: 247-254.
[9] Cecotti, Hubert, and Axel Gräser. "Convolutional neural networks for P300 detection with application to brain-computer interfaces." Pattern Analysis and Machine Intelligence, IEEE Transactions on 33, no. 3 (2011): 433-445.
[10] Haghighatpanah, Neda, Rasoul Amirfattahi, Vahid Abootalebi, and Behzad Nazari. "A two stage single trial
P300 detection algorithm based on independent component analysis and wavelet transforms." In Biomedical Engineering (ICBME), 2012 19th Iranian Conference of, pp. 324-329. IEEE, 2012.
[11] http://www.bbci.de/competition/iii/results/ [12] Orhan, Umut, and Emre Gurbuz. "Classifying discrete interval densities of EEG signals by using DWT and
SVM." In Innovations in Intelligent Systems and Applications (INISTA), 2012 International Symposium on, pp. 1-4. IEEE, 2012.
[13] Manikandan S, Chinnadurai M, Thiruvenkatasuresh M.P, Sivakumar M. (2020). "Prediction of Human Motion Detection in Video Surveillance Environment Using Tensor Flow", International Journal of Advanced Science and Technology, 29(05), 2791 - 2798. Vol. 29 No. 05 (2020): Vol. 29 No. 05 (2020)
[14] Xie, Songyun, You Wu, Yunpeng Zhang, Juanli Zhang, and Chang Liu. "Single channel single trial P300 detection using extreme learning machine: Compared with BPNN and SVM." In 2014 International Joint Conference on Neural Networks (IJCNN), pp. 544-549. IEEE, 2014.
[15] Morales, C., C. M. Held, P. A. Estevez, C. A. Perez, S. Reyes, P. Peirano, and C. Algarin. "Single trial P300
detection in children using expert knowledge and SOM." In Engineering in Medicine and Biology Society (EMBC), 2014 36th Annual International Conference of the IEEE, pp. 3801-3804. IEEE, 2014.
[16] Kaper, Matthias, Peter Meinicke, Ulf Grossekathoefer, Thomas Lingner, and Helge Ritter. "BCI competition
2003-data set IIb: support vector machines for the P300 speller paradigm." Biomedical Engineering, IEEE Transactions on51, no. 6 (2004): 1073-1076.
[17] Vareka, Lukas, and Pavel Mautner. "Using the Windowed means paradigm for single trial P300 detection."
In Telecommunications and Signal Processing (TSP), 2015 38th International Conference on, pp. 1-4. IEEE, 2015.
[18] Motlagh, F., Sai Hong Tang, and Omid Motlagh. "Optimal accuracy and runtime trade-off in wavelet based
single-trial P300 detection." In Signal and Image Processing Applications (ICSIPA), 2013 IEEE International Conference on, pp. 343-348. IEEE, 2013.
[19] Lazar, Anca Mihaela, and Radu Ursulean. "The P300 event-related potential detection-A morphological
approach." In E-Health and Bioengineering Conference (EHB), 2013, pp. 1-4. IEEE, 2013. [20] Manikandan, S & Chinnadurai, M 2019, ‘Intelligent and Deep Learning Approach OT Measure E-Learning
Content in Online Distance Education’, The Online Journal of Distance Education and e-Learning, vol.7, issue 3, July 2019, ISSN: 2147-6454.
[21] Colwell K.A, Ryan D.B, Throckmortan C.S, Sellers E.W and Collins L.M. “Channel selection method for p300 speller”, Journal of neuroscience methods, Vol. 232, pp. 6-15. Eleseiver, 2014.
[22] Alfaouri, Mikhled, and Khaled Daqrouq. "ECG signal denoising by wavelet transform
thresholding." American Journal of applied sciences 5, no. 3 (2008): 276-281. [23] BCI Competition III Data set II, Wadsworth Center, and NYS Department of Health. Available:
http://www.bbci.de/competition/iii/#data_set_ii [24] Mammone, Nadia, Fabio La Foresta, and Francesco Carlo Morabito. "Automatic artifact rejection from
multichannel scalp EEG by wavelet ICA."Sensors Journal, IEEE 12, no. 3 (2012): 533-542. [25] Teixeira, A. R., A. M. Tomé, E. W. Lang, R. Schachtner, and K. Stadlthanner. "On the use of KPCA to
extract artifacts in one-dimensional biomedical signals." In 2006 16th IEEE Signal Processing Society Workshop on Machine Learning for Signal Processing, pp. 385-390. IEEE, 2006.
[26] Tayeb, Salma, Abdelhak Mahmoudi, Fakhita Regragui, and Mohammed Majid Himmi. "Efficient detection of
P300 using Kernel PCA and support vector machine." In Complex Systems (WCCS), 2014 Second World Conference on, pp. 17-22. IEEE, 2014.
[27] Kuo, Bor-Chen, Hsin-Hua Ho, Cheng-Hsuan Li, Chih-Cheng Hung, and Jin-Shiuh Taur. "A kernel-based
feature selection method for SVM with RBF kernel for hyperspectral image classification." Selected Topics in applied Earth Observations and Remote Sensing, IEEE Journal of 7, no. 1 (2014): 317-326.