0 An Economic Analysis of Equity-Indexed Annuities September 10, 2008 Submitted to the North American Securities Administrators Association (NASAA) Prepared by Craig J. McCann, PhD, CFA Securities Litigation & Consulting Group, Inc. (SLCG)* * Securities Litigation & Consulting Group, Inc. (SLCG), www.slcg.com is a financial economics consulting firm based in Fairfax, Virginia. SLCG consultants hold PhDs in finance, economics, statistics and mathematics and have academic, government, and industry experience. SLCG Principals are experts in the economics of securities markets and provide consulting services to a diverse group of clients including law firms, public corporations, domestic and international securities regulators, trade associations, and individuals. Dr. McCann can be reached at [email protected]or 703-246-9381.
Transcript
0
An Economic Analysis of Equity-Indexed Annuities
September 10, 2008
Submitted to the North American Securities Administrators Association (NASAA) Prepared by Craig J. McCann, PhD, CFA Securities Litigation & Consulting Group, Inc. (SLCG)*
* Securities Litigation & Consulting Group, Inc. (SLCG), www.slcg.com is a financial economics consulting firm based in Fairfax, Virginia. SLCG consultants hold PhDs in finance, economics, statistics and mathematics and have academic, government, and industry experience. SLCG Principals are experts in the economics of securities markets and provide consulting services to a diverse group of clients including law firms, public corporations, domestic and international securities regulators, trade associations, and individuals. Dr. McCann can be reached at [email protected] or 703-246-9381.
1
An Economic Analysis of Equity-Indexed Annuities
Executive Summary
The Securities and Exchange Commission has proposed to clarify an exemption
from the federal securities laws to exclude from the exemption equity-indexed annuities
that expose investors to stock market risk.
Equity-indexed annuities are complex contracts that pay investors part of the
capital appreciation in a stock index and provide illusory but superficially appealing
benefits including minimum value guarantees.
Equity-indexed annuities’ issuers obfuscate investment risks by repackaging what
is actually a simple underlying investment in securities and in the process deny investors
the protections federal securities laws provide other investors.
A direct consequence of the lack of SEC oversight is that investors in
equity-indexed annuities cannot determine the true costs they incur when purchasing
equity-indexed annuities relative to alternative investments such as stocks, bonds and
mutual funds. Investors are also exposed to an inadequately regulated, highly
incentivized and frequently unscrupulous sales force as a result of the lack of effective
SEC oversight.
The SEC’s Rule Proposal is an important step towards providing truthful,
complete disclosure and protection from sales practice abuses to investors who are
currently investing $25 billion per year in unregistered securities.
2
I. Introduction A. Rule Proposal On June 25, 2008 the Securities and Exchange Commission issued a rule proposal
that would clarify the annuity contract exemption from the federal securities laws to
exclude equity-indexed annuity contracts whose payoffs are more likely than not to
exceed the amounts guaranteed under the contract.1 All existing equity-indexed annuities
would meet this criterion and so the rule would require that they all be registered under
the Federal securities laws. The rule would therefore provide investors who purchase
equity-indexed annuities with the full protections provided to investors who purchase
economically equivalent investments.
B. Equity-Indexed Annuities Equity-indexed annuities are contracts offered by insurance companies that pay
investors part of the capital appreciation in a stock index and guarantee a minimum return
if the contract is held to maturity. Since their introduction in the U.S. in 1995, sales of
equity-indexed annuities have grown dramatically. Although good data is not available,
commentators have estimated that $25 billion in equity-indexed annuities were sold in
2007.2 Sales have increased because equity-indexed annuities limit downside risk, offer
some participation in stock market gains and generate extraordinary commissions to
salesmen and profits to issuers. Despite the growth in sales, merits of equity-indexed
annuities have remained obscured by their complexity and abusive sales practices
targeting the least sophisticated and most vulnerable investors have flourished.
1 Securities and Exchange Commission Indexed Annuities and Certain Other Insurance Contracts, SEC Release Nos. 33-8933, 34-58022, File No. S7-14-08 (“SEC Rule Proposal") 2 See http://www.indexannuity.org
3
C. Securities Litigation and Consulting Group, Inc. Securities Litigation and Consulting Group, Inc. (“SLCG”) is a financial
economics consulting firm based in the Virginia suburbs outside of Washington, DC
founded in 2000. SLCG’s employees hold PhDs in finance, economics, mathematics and
statistics. SLCG circulated a preliminary working paper which described the stylized
features of equity-indexed annuities and explained how they can be modeled and
evaluated in January 2006.
II. Rule Proposal A. Clarification of Regulation Annuity contracts which meaningfully transfer risks from investors to issuers are
exempt from federal securities laws. The SEC rule proposal would clarify the definition
of an annuity contract for determining this exemption to exclude from the exemption
contracts issued by insurance companies which expose investors to significant investment
risks. Existing equity-indexed annuities superficially appear to protect investors from
these investment risks but, in fact, do not. The investment risks to which investors are
exposed are virtually identical to the risks of investing in mutual funds and variable
annuities.3
3 “Individuals who purchase indexed annuities are exposed to a significant investment risk – i.e., the volatility of the underlying securities index. …Thus, these purchasers obtain indexed annuity contracts for many of the same reasons that individuals purchase mutual funds and variable annuities and open brokerage accounts.” SEC Rule Proposal, page 5.
“Individuals who purchase such indexed annuities assume many of the same risks and rewards that investors assume when investing their money in mutual funds, variable annuities, and other securities”. SEC Rule Proposal, page 6.
“By purchasing this type of indexed annuity, the purchaser assumes the risk of an uncertain and fluctuating financial instrument, in exchange for exposure to future, securities-linked returns. The value of such an indexed annuity reflects the benefits and risks inherent in the securities market, and the contract’s value depends upon the trajectory of that same market. Thus, the purchaser obtains an instrument that, by its very terms, depends on market volatility and risk.” SEC Rule Proposal, page 26.
4
Equity-indexed annuities are quite similar to equity-participation securities, which
are traded on the American Stock Exchange under various brand names. Equity-
participation securities guarantee that investors will receive the initial face value of the
security plus part of the increase in the value of a stock or stock index. The payoffs to
equity-participation securities can be determined using participation rates, caps or
annuals spreads just like equity-indexed annuities. Insurance companies add trivial
insurance benefits, disadvantageous tax treatment and exorbitant costs to equity-
participation securities, mix in complex, arbitrary return calculations and sell the
resulting contracts as equity-indexed annuities. The repackaging of equity-participation
securities as equity-indexed annuities and aggressive anti-regulatory position taken by
issuers has heretofore exempted equity-indexed annuities from effective securities
regulation.
B. Coverage Criterion The rule proposal would apply to any annuity contract whose payoffs to investors
vary significantly with stock market returns.4 Although the rule proposal is not
definitive on the point in time at which the payoffs’ sensitivity to stock market returns
should be assessed, the end of the surrender period is reasonable as proper product design
would not include surrender periods which were intended to extend beyond the expected
term of an investment.5 In what follows, I assess the impact of the proposed rule’s
4 “When the amounts payable by an insurer under an indexed annuity are more likely than not to exceed the amounts guaranteed under the contract, the majority of the investment risk for the fluctuating, equity-linked portion of the return is borne by the individual purchaser, not the insurer. The individual underwrites the effect of the underlying index’s performance on his or her contract investment and assumes the majority of the investment risk for the equity-linked returns under the contract.” SEC Rule Proposal, page 6. 5 Surrender periods designed into EIA products could extend beyond when investors are expected to receive payoffs from contracts but such a design should raise serious consumer and investor protection questions and is ignored in this paper.
5
coverage criterion if applied at the end of surrender periods. All existing equity-indexed
annuities I am aware of would unambiguously be covered by the proposed rule.
C. Need for Regulation Federal securities laws protect investors by requiring full and fair disclosure of all
material facts by issuers and non-abusive sales practices by brokers and agents. The
clarification proposed by the SEC is needed because issuers of existing equity-indexed
annuities obfuscate the investment risks to which investors are exposed by repackaging
what is actually a simple underlying investment with a layer of virtually worthless bells
and whistles.6 This superficial repackaging exposes investors who purchase equity-
indexed annuities to the same risks as investors who purchase stocks, bonds and mutual
funds while denying them the full protections of federal laws afforded other investors.7
A direct consequence of the lack of SEC oversight is that investors in
equity-indexed annuities cannot determine the true costs they incur when purchasing
these investments and cannot effectively compare equity-indexed annuities to alternative
investments such as stocks, bonds and mutual funds. Equity-indexed annuities’
unregistered status also severely limits the recourse available to victims of sales practice
abuses.
6 For example, consistent with issuers’ underlying investment portfolios, academics model equity-indexed annuities as equivalent to portfolios of low risk bonds and call options on stock indexes. See Zvi Bodie and Dwight B. Crane, The Design and Production of New Retirement Savings Products, Harvard Business School Working Paper #98-070 January 28, 2008. Issuers obscure the simple economics of this investment by making it superficially extraordinarily complicated. 7 “The Federal interest in providing investors with disclosure, antifraud, and sales practice protections arises when individuals are offered indexed annuities that expose them to securities investment risk. Individuals who purchase such indexed annuities assume many of the same risks and rewards that investors assume when investing their money in mutual funds, variable annuities, and other securities. However, a fundamental difference between these securities and indexed annuities is that – with few exceptions – indexed annuities historically have not been registered as securities. As a result, most purchasers of indexed annuities have not received the benefits of federally mandated disclosure and sales practice protections.” SEC Rule Proposal, page 6.
6
If federal securities regulation is necessary to protect investors who purchase
stocks, bonds, mutual funds and variable annuities then such regulation is also necessary
to protect investors who purchase equity-indexed annuities. The interpretive loophole
through which equity-indexed annuities have heretofore evaded effective disclosure
requirements and sales practice abuse prohibitions explains the growth in equity-indexed
annuities which neither the target audience - nor the sales force - can adequately evaluate.
III. Equity-Indexed Annuities Equity-indexed annuities’ notional (as opposed to real, spendable) account values
are determined by a set of features including stock market returns, term to maturity,
base and minimum rates of return applied to the evolution of a stock index over the life of
the investment. Payoffs before the end of quite lengthy surrender periods depend on the
substantial surrender charges applied to interim accumulated account values. In addition
to the characteristics that define payoffs, the contracts have features which include
provisions for modest withdrawals without paying surrender charges, death payments,
annuitization options and guaranteed minimum values.
A. Account Value or Accumulation Value: Company Scrip, Not Cash. An equity-indexed annuity contract has a notional value – as opposed to a cash
value – called an account value or accumulation value. This notional value changes once
a year on the contract purchase date’s anniversary as that contract year’s returns are
credited to the previous anniversary’s scrip value. If the investor wants to realize value
from an equity-indexed annuity they are likely to receive substantially less than this
notional value because of the application of surrender charges described below.
The account or accumulation value is economically quite similar to scrip which
has been used infamously in lieu of cash wages in some industries and can only be spent
at company stores at inflated prices. In what follows, I will refer to equity-indexed
annuities’ account or accumulation value as scrip value to differentiate it from the cash
value which could be realized by investors.
7
B. Stock Index Equity-indexed annuities credit investors with a return based on the change in the
level of a stock price index. Most equity-indexed annuities are linked to the level of the
S&P 500 Index; a few equity-indexed annuities are linked to other indices. The indexes
used are price appreciation indexes and so changes in the level of the indexes do not
include the dividends investors would receive if they owned the underlying stocks or
stock mutual funds. Dividends have historically accounted for 20% of the returns
investors have earned in the S&P 500 stocks and so exclusion of dividends causes the
changes in the S&P 500 Index level used in equity-linked annuities to significantly
understate the returns earned by investors in the S&P 500.
Figure 1 illustrates the impact of excluding dividends from the calculation of
stock index returns from 1975 to 2004. On December 31, 1974 the S&P 500 closed at
68.56. The top line shows the value of the S&P 500 over time with reinvested dividends.
The second line from the top shows the level of the S&P 500 index excluding dividends.
Excluding dividends reduces the return over the 30 year period by 64%.
Figure 1Impact of Dividends and Monthly Averaging
4,921
1,768
100544
0
1,000
2,000
3,000
4,000
5,000
6,000
7,000
Dec-74
Dec-76
Dec-78
Dec-80
Dec-82
Dec-84
Dec-86
Dec-88
Dec-90
Dec-92
Dec-94
Dec-96
Dec-98
Dec-00
Dec-02
Dec-04
Date
Inde
x
S&P 500 with Reinvested DividendS&P 500 without Reinvested DividendMonthly Averaging Index
8
C. Term to Maturity One-tier equity-indexed annuities pay out after the end of lengthy surrender
charge periods without additional penalties. That is, after the end of the surrender period
the scrip value equals the cash surrender value. It is common to refer to the end of the
surrender charge period as the maturity of the contract.8 The equity-indexed annuity
payout is a function of the general level of price appreciation in the stock market at, or
shortly before, the contract is wholly or partially liquidated. Other things equal, equity-
indexed annuities with longer surrender periods provide less value to investors than
annuities with shorter maturities.
Unlike one-tier annuities, the cash surrender value of a two-tier equity-indexed
annuity never equals the scrip value. Two-tier annuities require that investors annuitize at
disadvantageous rates of return over long periods of time to apply the scrip value. If
investors don’t annuitize a two-tier equity-indexed annuity they suffer significant losses
even if they have held the investment for many years. For instance, the Allianz
MasterDex 10 annuity is a two-tier equity-indexed annuity that offers a 10% premium
credit that it is forfeited unless the contract is held for at least 5 years and is then
annuitized for at least 10 years at what must then certainly be disadvantageous
annuitization rates.
D. Crediting Method: How Changes in the Stock Index are Measured There are two general formulas - called indexing methods - used to calculate
changes in the index level. The point-to-point method measures the increase in the index
level between two points in time without incorporating dividends, calculated at regular
intervals, usually the contract’s anniversary dates. This point-to-point increase in the
index level is then reduced through one or more gimmicks and the resulting credit is
applied to the previous contract anniversary’s scrip value. The change in the scrip value
from year to year cannot be negative. That is, the scrip value will stay constant rather
8 Maturity is sometimes a defined term in the contracts specifying a date in the future well beyond when any investor will still be alive.
9
than decline if the credit calculated according to the contract’s formula is negative. This
is sometimes described as a reset or ratchet feature. Some point-to-point indexed
annuities have a look-back feature, rather than an annual ratchet, whereupon if the index
level is lower at the end of the contract than it was on some earlier reset date, the
crediting feature will record an increase that is greater than under the simple point-to-
point method, everything else held constant.
The averaging method calculates the difference in the index level from a starting
date – either the contract purchase date or a subsequent anniversary – to the daily or
month-end average value over some subsequent period.9 In its most common form, the
averaging method calculates the difference between the index level at the beginning of a
contract year and the average monthly anniversary date closing levels during the contract
year. As with the point-to-point method, the percentage difference in the month-end
average level during the contract year from the level at the beginning of the year is
reduced by one or more gimmicks and the resulting credit, if positive, is applied to the
prior anniversary’s scrip value.
Yet more complicated monthly averaging equity-index annuities include a look-
back feature which yields the highest average month-end index level over sub-periods
starting from the initial investment. For example, Sun Life’s Keyport MultiPoint annuity
is a monthly averaging equity-indexed annuity with look back to high water mark. It uses
the highest average monthly index level from the purchased date to each anniversary to
calculate index changes.
The Keyport annuity’s value at maturity can be written as:
9 Some equity-indexed annuities average daily index values instead of monthly index values. Our discussion and examples focus on the monthly averaging method. Daily averaging makes evaluation computationally only slightly more difficult than for monthly averaging and doesn’t change any qualitative conclusion.
10
Eq. 1) ( )
⎥⎥⎥⎥⎥⎥
⎦
⎤
⎢⎢⎢⎢⎢⎢
⎣
⎡
+
⎟⎟⎟⎟⎟⎟⎟
⎠
⎞
⎜⎜⎜⎜⎜⎜⎜
⎝
⎛
−+×=
∑∑∑∑×
=
×
=
×
==
T
T
nn
nn
nn
nn
oT I
IIIII
IVV γβα 1,
)12
,,12
,12
,12
,max(1max
0
0
12
1
123
1
122
1
12
10 K
Where,
VT = value of annuity at maturity, V0 = premium paid at initial purchase, α = participation rate,
y.anniversar t
the to term theofstart thefrom levelindex monthly ofmean arithmetic theis,12
th
12
1t
∑×
==
t
nnI
AI
I0, In = index level at purchase date and at nth month, respectively, β = fraction of initial premium earning guaranteed return, γ = guaranteed return, and T = initial term to maturity in years.
A Sun Life Keyport MultiPoint contract was sold to an elderly widow on
December 12, 2003 for $50,126 after she had been convinced by a salesman to liquidate
substantially all of her meager liquid assets which had previously been invested in mutual
funds. This contract’s crediting formula is virtually impenetrable and could not be
effectively evaluated by the customer or the salesman. Without effective annual expense
ratio disclosure, the only way to determine what the annual cost of the Sun Life Keyport
MultiPoint contract – or any other equity-indexed annuity – is to value the contract. The
level of sophistication required to value the annuity described by Eq. 1 is staggering. As
we will see below, this complexity is a façade laid over the top of a simple investment for
which a simple, informative, investor-friendly annual expense disclosure could be made.
Advocates for equity-indexed annuities claim that the monthly average return
method makes the resulting calculated index level changes less volatile and that this
reduced volatility allows the industry to offer investors a higher participation rate on
11
annuities which use monthly averaging. Such statements are misleading since the
volatility relevant to the cost of the guaranteed minimum return is the volatility of the
underlying stock index. Instead, monthly averaging systematically understates the
increase in the level of the index compared to point-to-point indexing. The expected
index change with monthly averaging will be roughly half the expected change calculated
by the traditional point-to-point method. Thus, with the monthly averaging method
insurance companies can claim to pay 100% participation of the calculated index level
change while only paying 50% of the actual change in the index level. The lowest line in
Figure 1 above shows the value of the S&P 500 Index calculated by applying the monthly
averaging with annual reset method. Monthly averaging further reduced the change in
the price level of the index by 70% over 30 years.
The impact of monthly averaging is not a phenomenon of the time period covered.
I constructed 241 10-year periods by rolling 10 years of data forward one month at a time
from 1975 to 2004. The first months’ returns, second months’ returns and so on were
then averaged across the 241 periods. The impact of dividends and monthly averaging on
these average returns is illustrated in Figure 2. Excluding dividends reduces the average
return over 10-year periods by 29%. Monthly averaging reduces the change in the level
of the index by a further 44%. Unsophisticated investors might believe that they will get
100% of the increase from 100 to 463 when in fact they receive only 23% of this
increase.
12
Figure 2Impact of Dividends and Monthly Averaging (10 Year Moving Average)
463
327
183
0
50
100
150
200
250
300
350
400
450
500
0 Year 1 Year 2 Year 3 Year 4 Year 5 Year 6 Year 7 Year 8 Year 9 Year 10Date
Inde
x
S&P 500 with Reinvested Dividend (10 Year Moving Average)S&P 500 without Reinvested Dividend (10 Year Moving Average)S&P Index Monthly Averaging (10 Year Moving Average)
E. Participation Rate: The Fraction of the Index Change Credited A fraction, called the participation rate, of the change in the stock index
calculated according to one of the methods described above is used in determining the
additional return, if any, over and above the guaranteed minimum return an investor will
receive. Participation rates vary significantly, and are easy but misleading to compare; a
higher participation rate may not mean higher payouts to investors. Other things held
constant, the higher the participation rate an equity-indexed annuity pays, the more
valuable it is. However with equity-indexed annuities all else is seldom held constant; a
100% participation rate in a monthly averaging equity-indexed annuity is comparable to a
50% participation rate in a point-to-point equity-indexed annuity.
F. Spreads or Index Margins and Caps The gross credit calculated by multiplying the index change by the participation
rate is then sometimes further reduced by an amount called a spread or an index margin
that can be as great as 3% or 4%.
13
The index-based additional return credited to an investor may be further limited
by a monthly, annual or lifetime cap. For example, the increase in a contract’s index
value under the point-to-point method with annual resets might be capped at 8% meaning
that the contract’s index value will increase by only 8% in years when the index level
increases by more than 20% or 30%. The effect of caps is dramatic because the average
long run return to stocks is heavily influenced by years with unusually high returns. For
example, the annualized price appreciation in the S&P 500 from 1975 to 2004 was
10.0%. If the yearly increase is capped at 14%, the resulting series has an annualized
appreciation of only 5.5%. The index-based returns credited to an investor’s contract are
dramatically reduced as a result of the application of spreads and caps. The impact of
caps and spreads is not readily apparent and two contracts linked to the same index, with
the same indexing method and the same participation rate can have significantly different
net returns.
G. Bonus Credits Bonus premium credits are offered on some equity-indexed annuities. The
bonuses are sold as a free “kicker”, available to offset surrender charges on existing
variable annuities and equity-indexed annuities or contingent deferred sales charges on
mutual funds. These credits are superficially appealing but are illusory. Other features of
the bonus annuities negate the premium credits as the premium credits are fully offset by
higher surrender charges, longer surrender periods and larger pricing spreads. For
example, Allianz has offered both the PremierDex and the PremierDex 5 distinguished
primarily by a 5% premium bonus. The PremierDex 5 has a 15% surrender charge
instead of a 10% surrender charge and its surrender period lasts 10 years instead of 7
years.
H. Surrender Charge Schedules Equity-indexed annuities have surrender charges which usually decline over a
period of years. The average surrender period is 10 years but some annuities, such as the
Bonus Gold annuity issued by American Equity have surrender charges which last for 17
14
years. The surrender charges are frequently 10% or 12% but can be as high as 25%. The
Bonus Gold’s surrender charge in the first year is 20%; even after 10 years the Bonus
Gold’s surrender charge remains 12.5%.
I. Market Value Adjustments (MVA) or Interest Adjustment (IA) In addition to the surrender charges many equity-indexed annuity charge investors
a disguised surrender charge in the form of the Market Value Adjustment or Interest
Adjustment. Equation 2) is an example of a typical MVA
Eq. 2) ( )( )
T
iii
⎥⎦
⎤⎢⎣
⎡+−+
=1
005.1 0Adjustment ValueMarket
where
i0 is the current interest rate on the fixed option when the annuity is purchased,
i1 is the current interest rate on the fixed option when the annuity is surrendered,
T is the remaining whole and partial years remaining to end of surrender period.
The equity-indexed annuity’s scrip value is multiplied by the Market Value
Adjustment factor before the surrender charge is applied to determine the amount an
investor receives if they surrender an annuity. Table 1 illustrates the impact of various
changes in interest rates after 1 year of the Interest Adjustment on an annuity with
10-year surrender period and an initial interest rate of 4%.
Table 1 Market Value or Interest Adjustment Factors
The Market Value Adjustment causes the cash value of an equity-indexed annuity
to fluctuate like the price of a bond but with a significant bias. If interest rates are
unchanged and the contract is surrendered after one year, the investor will pay a 4.2%
penalty in addition to the explicit surrender charge as a result of the Market Value Adjustment. In contrast, the value of a 4.0% coupon bond issued at par one year earlier
with nine years remaining would be unchanged if the yield remained at 4%. The 4.2%
penalty is the additional surrender charge if interest rates are unchanged.
The Market Value Adjustment is applied to the entire scrip value, not just the
portion allocated to a fixed interest option. The Market Value Adjustment introduces
substantial interest rate risk into equity-indexed annuities and adds a hidden surrender
charge that starts out at over 4% and declines along with the disclosed surrender charge
over the surrender period.
J. Guaranteed Cash Surrender Value Equity-indexed annuities guarantee that investors will receive a minimum rate of
return – typically from 1% to 3% on between 75% and 100% of the initial investment.
Due to steep upfront loads and surrender charges, the guaranteed cash value is
substantially less than the original investment for many years after a purchase. The
guaranteed rate of return is typically much less than the risk free rate of return offered on
US Treasury securities with the same maturity as the annuity. On some contracts, no
interest is credited unless the annuity is held to maturity.
This guarantee can be easily misunderstood to be the equivalent in value to that of
the US Treasury but it is in fact only as good as the credit quality of the insurance
company issuing the annuity. While Standard and Poors rates Jackson National Life and
Jefferson Pilot AAA, it rates RBC Insurance A- and American Equity Investment Life
only BBB+. State guarantee funds provide some protection but they are severely limited
and the credit quality of state guarantee funds is not as good as that of the US Treasury.
16
IV. Other Features
A. Penalty free withdrawal
Issuers of equity-indexed annuities and their sales force touts claimed penalty-free
annual withdrawals - whether pursuant to the 10% annual allowance or to a nursing home
or terminal illness-rider. It is false and misleading to refer to these withdrawal options as
penalty-free since investors typically forgo index-related returns for the partial year
already passed whenever they die or surrender a portion of their account value. Since this
partial return cannot be negative, losing this partial year return is clearly a penalty. Also,
investors who purchase registered securities have substantially higher risk-adjusted
expected returns and greater liquidity. It is false and misleading for issuers to tout their
withdrawal features as valuable benefits without disclosing that these features are only
beneficial to the extent they allow investors to avoid the draconian illiquidity and
ongoing, annual expropriation of investors’ wealth.
B. Death benefit
Most equity-indexed annuity contracts waive surrender charges upon death. This
“benefit” cannot be added to the value of future maturity payoffs without also deducting
the expected harm caused by steep, long-lasting surrender charges. The death payment
provision accrues only to investors’ beneficiaries and does not mitigate the illiquidity
burden on investors.
The death payment provisions can be valued by projecting the expected excess of
the equity-indexed annuity’s scrip value over the values of alternative portfolios of stocks
and bonds, weighting these expected excesses, if any, by the probability of death in that
year and discounting the result to the present. I have performed this analysis and
determined that the value of the death benefit is less than 10 basis points per year – a
small amount in comparison to the 275 to 300 basis points implied annual cost of equity-
indexed annuities.
17
C. Annuitization Options
Equity-indexed annuities typically provide contractual rights to annuitize but
often only at annuitization rates as low as 1%. This right would be valuable if the future
interest rates were reasonably likely to be less than the rates specified for annuitization.
The Federal Reserve Board reports the lowest observed daily 5-year and 10-year constant
maturity Treasury yield since the start of this data in 1962 are 2.08% and 3.13%. Thus,
the probability that the annuitization option provided by equity-indexed annuities with a
1% annuitization guarantee would be in the money is essentially zero.10
The annuitization provisions of some equity-indexed annuities are even less
valuable. Some specify annuitization interest rates ranging from 1% to 3% but investors
have no right to annuitize until the end of a 14-year surrender period or, in some cases,
age 115. Seniors who purchase such annuities thus have no right to receive the
guaranteed annuitization rates until a date that approximates or exceeds their life
expectancy. Those who do survive long enough to obtain the specified rate will receive
the benefit for only a short time and - as illustrated in the Federal Reserve Board data -
any rare benefit realized is likely to be small.
V. Underlying Economics A. American Equity’s Form 10-K Tells a Story11 American Equity’s status as a publicly traded company and its focus entirely on
the business of issuing equity-indexed annuities allows us a revealing glimpse into the
underlying economics of the equity-indexed annuities industry. American Equity tells
the Securities and Exchange Commission, stock market investors and Wall Street
analysts that issuing equity-indexed annuities is a simple, low-risk business.
10 Even if prevailing interest rates were to approach such unprecedented levels, the increased value of the bond-related component of a diversified alternative investment would more than offset the value of the specified annuitization rate. 11 The following section is based on American Equity’s Form 10-K filings with the Securities and Exchange Commission and its transcribed conference calls with analysts.
18
American Equity pays big commissions to motivate aggressive sales practices.
The assets gathered – largely from unsophisticated senior citizens – are invested in bond
portfolios and a small amount is set aside and invested in stock index options. Whatever
happens to the bond portfolio and whatever happens in the stock market American Equity
is protected because the full risks on the stock and bond market are passed on to the
unsophisticated investors who buy equity-indexed annuities. Even if American Equity
gets the risk transfer wrong they are only going to be slightly wrong and only for a short
time. With investors locked into long surrender periods, American Equity can use its
virtually unfettered discretion to retroactively impose whatever small interest rate or
stock market-based loss it might otherwise have borne onto investors.
American Equity refers to the fraction of investor’s purchase payments it will take
for itself to recoup the commissions it has paid, cover its other costs and achieve its
desired profits as its “investment spread.” American Equity subtracts this investment
spread from the expected return on its bond portfolio to determine the returns it will
credit to investors. American Equity refers to the returns it intends to credit to investor as
the “cost of money.” For example, if the expected return on the bond portfolio is 6.5%
and American Equity decides to take a 3% investment spread to recoup commissions,
cover its costs and generate profits, it will credited 3.5% on average to investors.
If an investor chooses the fixed option within an equity-indexed annuity,
American Equity credits the investor the 3.5% cost-of-money in our previous example as
an interest rate fixed for one year. American Equity resets the fixed rate offered from
time to time in response to changes in the expected yield on the bond portfolio so that,
whatever the yield on the bond portfolio, American Equity will get the pricing spread
3.0% in our example to cover its costs and make a virtually riskless profit.
If an investor chooses an indexed option, American Equity will credit the investor
with the payoffs from options that can be purchased with the 3.5% cost-of-money which
would otherwise have been credited as a fixed interest rate. That is, American Equity
determines how much it is willing to spend on options and then adjusts the participation
19
rates, caps and asset fees to align the credits it might have to give investors under the
index options with the payoffs from the options which can be purchased with the interest
that it would otherwise credit to the fixed account. On average and over time, the credits
to investors who chose the index option will be less than the cost of the options and
therefore less than the fixed interest credited to investors who choose the fixed rate
option.
The expected return on portfolios of corporate bonds varies a little but the bond
portfolio American Equity invests customer premium dollars in had an average net
annual investment return of 6.34% from the beginning of 2002 through the end of 2007.
American Equity has passed this 6.34% per year return on to purchasers of its equity-
indexed annuities after deducting an average annual pricing spread of 2.81% to cover the
commissions it pays agents and cover its other costs and to generate profits. See Table 2.
Thus investors in American Equity’s equity-indexed annuities over time are
certain to receive the return on a bond portfolio less a pricing spread of 2.6% to 3.0%.
American Equity provides this information to sophisticated Wall Street analysts but
refuses to provide this simple, revealing truth to unsophisticated investors.
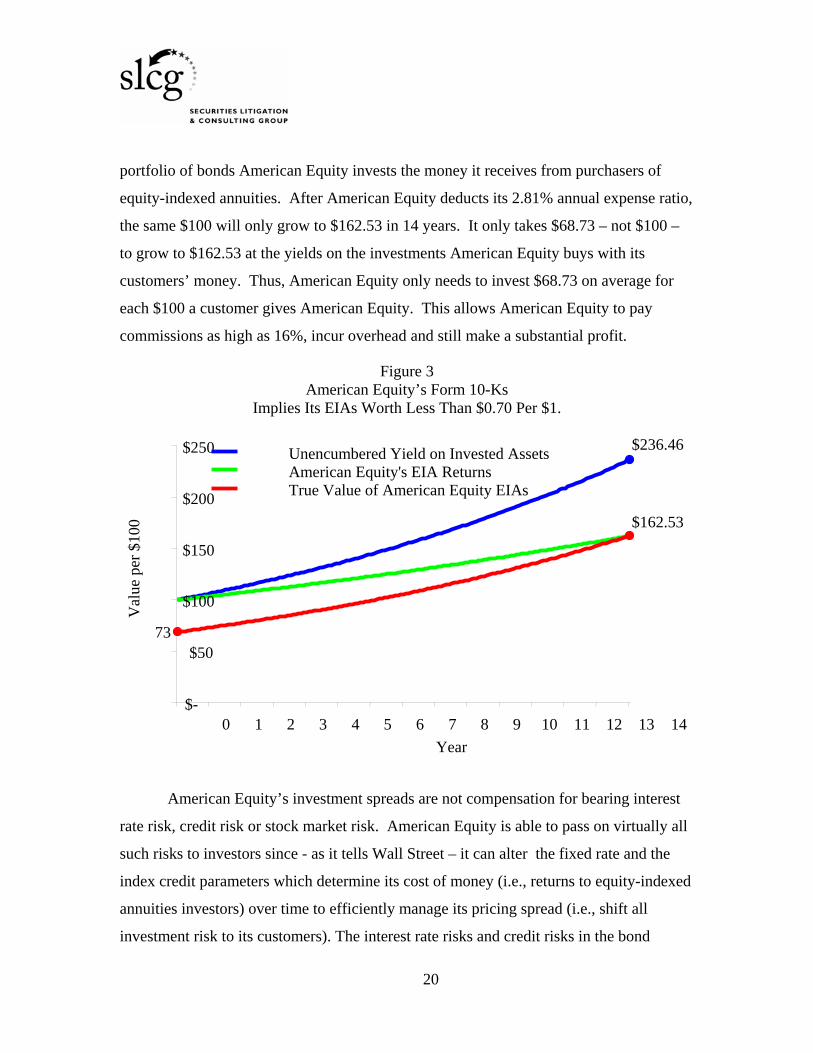
Figure 3 illustrates the impact of American Equity’s costly equity-indexed
annuities. $100 will grow to $236.46 in 14 years at the 6.34% average yield to the
Table 2 American Equity Charges Expense Ratios
Between 2.6% and 2.9% on Equity-Indexed Annuities 2002 2003 2004 2005 2006 2007
portfolio of bonds American Equity invests the money it receives from purchasers of
equity-indexed annuities. After American Equity deducts its 2.81% annual expense ratio,
the same $100 will only grow to $162.53 in 14 years. It only takes $68.73 – not $100 –
to grow to $162.53 at the yields on the investments American Equity buys with its
customers’ money. Thus, American Equity only needs to invest $68.73 on average for
each $100 a customer gives American Equity. This allows American Equity to pay
commissions as high as 16%, incur overhead and still make a substantial profit.
Figure 3 American Equity’s Form 10-Ks
Implies Its EIAs Worth Less Than $0.70 Per $1.
American Equity’s investment spreads are not compensation for bearing interest
rate risk, credit risk or stock market risk. American Equity is able to pass on virtually all
such risks to investors since - as it tells Wall Street – it can alter the fixed rate and the
index credit parameters which determine its cost of money (i.e., returns to equity-indexed
annuities investors) over time to efficiently manage its pricing spread (i.e., shift all
investment risk to its customers). The interest rate risks and credit risks in the bond
$236.46
$68.73
$162.53
$-
$50
$100
$150
$200
$250
0 1 2 3 4 5 6 7 8 9 10 11 12 13 14Year
Unencumbered Yield on Invested AssetsAmerican Equity's EIA ReturnsTrue Value of American Equity EIAs
Val
ue p
er $
100
21
portfolio are borne by purchasers of American Equity’s equity-indexed annuities whether
they choose the fixed rate option or the indexed option. Stock market risk is borne by
purchasers who choose indexed options since the stock market risk in American Equity’s
promised payments is funded by the options purchased with the returns investors would
otherwise earn if they had chosen the fixed account option.
American Equity “investment spreads” are annual expense ratios as that term is
used in the investment management industry. Just like the annual expense ratios in a
mutual fund levied by fund companies, the investment spread is a charge levied by
American Equity to pay for commissions, overhead and profit.
Fundamentally, on a risk-adjusted basis, American Equity over the past six years
has been investing the proceeds from the sales of its equity-indexed annuities into a bond
portfolio and then deducting a 2.81% annual expense ratio before passing the returns on
to investors. This process is not meaningfully different from what mutual fund
companies do with the proceeds from the sale of mutual fund units except that American
Equity and the other equity-indexed annuities issuers deduct ten times as much from the
gross returns of the investment portfolio before passing the returns on to retail investors.
Table 3 summarizes the disclosures American Equity makes to Wall Street in its Form
10-K about what it charges retail investors but which it will not make to the
unsophisticated investors its highly-incentivized sales force targets.
Broad bond market portfolios that provide investors with the same gross returns
as American Equity earns on its bond portfolio are widely available to investors. These
Table 3 American Equity Average Expense Ratio is 2.81%
Average’02-’07
Yield on Invested Assets (Gross Returns) 6.34% Investment Spread (Expense Ratio) 2.81% Cost of Money (Net Returns) 3.53%
22
funds are highly liquid, completely transparent and provide investors the same downside
protection at less than 1/10th of the cost of American Equity’s equity-indexed annuities.
For instance, Vanguard’s Total Bond Market Fund has gross returns which are similar to
American Equity’s bond portfolio, but passes its returns to investors with only about
0.20% in annual charges rather than the 2.81% American Equity charges investors.12
B. The net effect of equity-indexed annuities’ gimmicks is to provide returns below those of Treasury securities while exposing investors to stock market risk The complex crediting methods, participation rates, caps, and spreads presented to
potential purchasers mask simple underlying economics. The spurious nature of equity-
indexed annuities’ complex crediting methods can be illustrated with the Bonus Select
equity-indexed annuity issued by American Investors Life.
The Bonus Select has at least four superficially different crediting methods. The
1-year Point-to-Point (“1YP2P”) method credits investors’ account values with the
percentage increase in the S&P 500 index on each contract anniversary subject to a 6.5%
annual cap. The 2-year Point-to-Point (“2YP2P”) method credits investors’ account
values with the percentage increase in the S&P 500 index at every second contract
anniversary subject to a 13.0% bi-annual cap on the two-year credit. The 1-year Monthly
Cap crediting method adds up the 12 monthly changes in the S&P 500 index during a
contract year, subject to a 2.35% monthly cap. The 1-year Average S&P Index Up
Strategy credits a fraction of the percentage difference in the average of the 12 monthly
anniversary S&P 500 index levels and the index level at the start of the year less an index
margin or spread.
I summarize the results of these four superficially quite different crediting
methods in Table 4. The four methods each reduce the 12.1% average stock market
returns to within a very narrow range, i.e. from 4.6% to 4.9%.
12 See for example, Vanguard’s 2003 prospectus for its Total Bond Market Fund at www.sec.gov/Archives/edgar/data/794105/000093247104000512/bondindex485b.txt.
23
Table 4 Bonus Select 1
Annualized Returns from 1990 to the Present Crediting Method Average
Annual Return Accumulation of $100 for 10
Years
Simple Securities S&P 500 with dividends 12.1% $313.37
One Year, Point to Point 4.9% $161.34 Two Year, Point to Point 4.9% $161.34
Monthly Cap 4.7% $158.29 S&P Index UP (monthly averaging) 4.6% $156.79
$100 invested for 10 years at the average return on the S&P 500 since 1990 would
grow to $313.37. Even excluding dividends, $100 invested in the S&P 500 for 10 years
would grow to $254.70. In fact, despite the fact that purchasers of American Investors
Life’s equity-indexed annuities are exposed to substantial market risk, the likely returns
are less than what would be earned on a portfolio of truly riskless Treasury securities.
Since January 1, 1990 the average yield on 10-year treasury securities was 5.7% and so
on average during this same period $100 invested in truly risk-free US treasury securities
would have grown to $174.08. In contrast, the illiquid, complex, opaque Bonus Select
would have grown to between $156.79 and $161.34 depending on which of the
superficially different but in reality virtual identical crediting methods were chosen. Thus
the equity-indexed annuities produce lower returns than US Treasury securities despite
being illiquid and exposing investors to stock and bond market risk.
This is a recurring theme in equity-indexed annuities. There is an enormous
amount of complexity designed into the product but ultimately the complexity is a smoke
screen designed and managed to provide investors with substantially the same miniscule
24
returns regardless of which index option is chosen. The resulting investor returns equal
the returns on a bond portfolio less a 2.5% - 3.0% annual expense ratio.
C. Issuers’ Discretion to Change Contract Parameters Significantly Further Reduces Their Annuities’ Value Issuers retain discretion to lower participation rates, caps and credited interest
rates and to increase index margins in such a way as to significantly reduce the value of
contracts ex post, limited only by relatively insubstantial contractual guarantees. This
discretion has significant value to the issuers because it gives them the flexibility to set
initial parameters without concern for long run profitability while guaranteeing that they
will earn its desired profits in the aggregate. The issuers’ extraordinary discretion
imposes significant uncertainty and costs on investors.
The issuers’ ability to change parameters is similar to - but much more extreme
than - the ability an issuer of callable bonds has to reset the interest rate it pays to
investors. If an issuer issued an 8% coupon bond when the current yield on its 10-year
debt was 6%, the bond would sell for approximately $115. If the issuer could, at its
discretion, redeem or call the 8% coupon bond after 1 year and thereafter pay 6% on
newly issued debt, the 8% coupon bond would only be worth about $102. If investors
had purchased the bond for $115 they would stand to lose more than 10% of their
investment value upon exercise of that discretion to call the 8% bond. If the issuer could
reduce the coupon rate on the 8% bond described above to 3% after the first year without
having to redeem the bond for $100, the issuer could reduce the value of the bond
investors paid $115 for at issuance to only $83. Issuers are able to accomplish exactly
this sort of expropriation as a result of its discretion to alter contract parameters and the
profits received.
As these examples illustrate, issuers of equity-indexed annuities have the ability
to dramatically expropriate an investor’s wealth after the investor is committed to a long-
term, high-cost investment. I am not aware of any other product sold with this
extraordinary feature for the obvious reason that no one would buy such a product except
25
at a substantial discount which adequately reflected the risk of future discretionary
adjustments undermining the value of the asset.
Even these examples don’t capture the cost to investors of issuer’s virtually
unfettered discretion to change the parameters determining the value of the investor’s
asset. An investor in a callable $100 face value bond will typically receive more than
$100 for a called bond. Unlike investors in callable bonds, investors in equity-indexed
annuities cannot liquidate their annuities for face value or more in response to a change in
the parameters which would substantially reduce the value of the annuity. Instead,
investors must pay significant surrender charges to get out of poor investments made
worse by issuers’ extraordinary discretion.
The cost to investors of the issuers’ ability to alter contract parameters is directly
related to the difference between: (1) the value of contracts when issued if issuers had no
such discretion; and (2) the value issuers will pay investors in order to achieve their profit
goals. Thus, the more facially attractive an equity-indexed annuity appears at issuance in
relation to market conditions or other investments without the discretionary adjustment
options, the more costly is an issuers’ ability to alter contract parameters thereby reducing
that apparent value.13
VI. Valuations and Comparisons Equity-indexed annuities can be valued using standard, scientific methodologies.
Issuers have sophisticated internal models to control the liabilities they incur to investors
to ensure the issuers a virtually risk free profit. These issuers know precisely the
effective annual cost to investors of their equity-indexed annuities offerings. American
Equity is the only issuer I am aware of that comes close to disclosing the annual costs but
does so only in conference calls with Wall Street analysts and buried in the fine print of
its Form 10-K and Form 10-Q filings with the SEC.
13 This is directly analogous to the cost of the embedded call option in a callable bond. The greater the difference between the callable bond’s coupon rate and the market yield on similar debt, the more costly the embedded option.
26
American Equity’s SEC filings show that it sets the parameters used to determine
investor’s returns to achieve an investment spread (“investment spread” to American
Equity, “expense ratio” to investors) of approximately 2.8% per year. Assuming
American Equity’s investments are efficient, a 2.80% spread per year over a 7-year term
would imply a value at issuance of $0.82 per dollar paid by investors (irrespective of the
other excessive internal costs), over a 10-year term would imply a value at issuance of
$0.75 per dollar paid by investors and over a 14-year term would imply a value of $0.67
per dollar paid by investors.14
A balanced assessment of the costs and benefits of any equity-indexed annuity
requires a comparison of the annuity’s likely returns on alternative investments under
reasonable assumptions. Consider, as an example of such a comparison, an S&P 500
index annuity with point-to-point option with an index margin of 4% for the first year, a
premium bonus of 11%, a minimum guaranteed interest of 2%, and a surrender period of
14 years purchased on September 29, 2004. I created a comparison of this annuity to a
portfolio of Treasury bonds and a stock mutual fund. This would be a typical comparison
a financial expert giving un-conflicted, objective investment advice would have created.
The comparison portfolio consists of $7,000 (70% of the $10,000 assumed investment)
invested in 14-year, zero-coupon Treasury bonds maturing on September 29, 2018 and
$3,000 invested in a low cost S&P 500 Index fund.
The S&P 500 Index closed on September 29, 2004 at 1,114.80. On September
29, 2018 the $10,000 investment in the annuity will return the greater of $13,195 (i.e.
100% of $10,000 accumulated at 2% interest rate for 14 years) or an Accumulation Value
calculated using the annual point-to-point method. The Accumulation Value depends not
14 To accurately value any individual equity-indexed annuity at any point in time, one would need to apply an appropriate discount for the issuers’ discretion, incentives and demonstrated behavior. Any such discount should reflect the valuation implied by issuers’ managed average gross margins. Given American Equity’s discretion, incentives and demonstrated behavior the true value of its products is undoubtedly considerably less than these values.
27
only on the level of the S&P 500 on September 29, 2018 but also on the path of annual
index levels on the way to September 29, 2018. Our simulation results below take this
path dependency into account.
On September 29, 2004, $7,000 would have purchased 14-year, zero-coupon
Treasury bonds with a face value of approximately $13,326. The $7,000 Treasuries
investment will therefore be worth approximately $13,326 on September 29, 2018
regardless of the level of the S&P500.15 The remaining $3,000, from the $10,000 total
initial investment, invested in the S&P 500 Index mutual fund will be worth more or less
than $3,000 depending on the total return on the fund. I assume that the expected total
annual return on the S&P 500 Index of companies is 12.5%. I assume that the stocks in
the S&P 500 index have an average dividend yield of 2.5% and the fund has an annual
expense ratio of 0.25%.
I performed a Monte Carlo simulation to generate likely future values of the
annuity and of the Treasury bonds and stock mutual fund based on reasonable
assumptions. Except in extremely rare cases, the annuity pays investors much less than a
simple portfolio of risk-free Treasury bonds and large-cap stocks. In fact, 99.8% of the
time the investor would be better off with the Treasury securities and stocks than with the
equity-indexed annuity if we assume the 4% monthly cap during the first year was not
increased during the rest of the term. That is, investors who were sold the annuity would
be worse off 99.8% of the time, even if they held the annuity for 14 years and it
performed exactly as designed.
Moreover the benefit from having bought the annuity in the extremely unlikely
event that the market suffers catastrophic losses over a 14-year period is tiny compared to
the cost of having bought the equity-indexed annuity the vast majority of the time. After
14 years, the expected value of the $10,000 invested in Treasury bonds and stocks on
15 The yield to maturity on 14-year zero-coupon Treasury bonds on September 29, 2004 was 4.65%.
28
September 29, 2018 is $28,442 and the expected value of the equity-indexed annuity is
only $19,735. The $8,707 equity-index annuity shortfall can be broken down into a
$8,725 expected cost for when the Treasuries and stock would have been worth more
than the EIA (99.8% of the time)versus a $459 expected benefit when the annuity would
have been better (0.2% of the time). The expected cost/benefit ratio is thus a staggering
9,485 to 1. That is, the investor pays $9,485 in costs for every $1 in benefit from the
downside protection relative to the Treasuries and stock portfolio.
There is currently no disclosure of the effective cost of owning an equity-indexed
annuity analogous to the annual expense ratio in a mutual fund or the annual expenses of
a variable annuity. Such a disclosure is necessary for investors and salespeople to
evaluate the financial ramifications of an investment in equity-indexed annuities and to
understand the serious risks, limitations and expenses in the product.
According to the Investment Company Institute, in 2004 the average annual
expense for stock mutual funds was 1.19%, for bond funds was 0.92% and for money
market funds was 0.42%. In contrast, the expense ratios implied by the structure of
equity-indexed annuities is between 2.7% and 3.0%. This cost is not disclosed in any
materials I have reviewed (except American Equity’s 10-Ks); I was only able to
determine it after extensive analysis of the product including computer modeling.
VII. Specific Comments on the Proposed Rule
A. Should the proposed rule apply to other products?16
The proposed rule would provide federal investor protections to purchasers of
equity-indexed annuities that expose investors to stock market risk. Equity-indexed
universal life (EUIL) contracts are growing in popularity and should be covered by the
rule also. These contracts have the same relationship to equity-indexed annuities that
variable universal life contracts have to variable annuities. In fact, the structure on a
16 SEC Rule Proposal, page 29.
29
EUIL is virtually identical to that of an equity-indexed annuity. EUILs expose investors
to stock market risk in exactly the same way equity-indexed annuities expose investors to
stock market risk. Federal investor protections should be extended to purchasers of
EUILs.
B. Should the proposed "more likely than not" test be modified?17
The proposed rule would exclude any equity-indexed annuity whose payoffs were
“more likely than not” to exceed the minimum amounts guaranteed in the contracts from
the annuities contracts. In our previous work, I determined that for all practical purposes
the minimum guarantees in current equity-indexed annuities would never be binding.
That is, despite their featured prominence in marketing and efforts to forestall effective
regulation, issuers set minimum guarantees so low that the amounts paid at the end of
surrender periods would exceed the minimum guarantees more than 99% of the time. As
such most any threshold other than the “more likely than not” for the likelihood that the
payouts would exceed the minimum guaranteed amounts would also be triggered.18
C. Should the issuers’ determination be conclusive? and Should the testing procedures be mandated?19 The Commission proposes to allow issuers to determine whether a particular
contract’s payouts are “more likely than not” to exceed the minimum guarantees.
Essentially 100% of the time, the payouts to current equity-indexed annuities will exceed
the truly trivial minimum guaranteed amounts. Issuers routinely assess the likelihood
that they will have to pay out the minimum guaranteed amounts using well established
finance and actuarial models. Consistent with our findings, the issuers have determined
that the probability that the minimum guarantees will be paid is 0%. Issuers will not be
17 SEC Rule Proposal, page 34. 18 The only way to design an equity-indexed annuity that would not trigger such a test would be to increase the minimum guarantees dramatically or reduce the already dismal expected returns. 19 SEC Rule Proposal, page 41.
30
able to excuse themselves from coverage of this rule in good faith. The only way issuers
could determine that their equity-indexed annuities are not covered would be to adopt
non-standard methodologies purely for the purpose of continuing to game the regulatory
system.
VIII. Summary Equity-indexed annuities are products which survive in the market place only
because of the lack of effective investor protection regulation.
To summarize:
• Existing equity-indexed annuities are too complex for the industry’s sales force and its target investors to understand the investment.
• This complexity is designed into what is actually a quite simple investment product to allow the true cost of the product to be completely hidden.
• The high hidden costs in equity-indexed annuities are sufficient to pay extraordinary commissions to a sales force that is not disciplined by sales practice abuse deterrents found in the market for regulated securities.
• Unsophisticated investors will continue to be victimized by issuers of equity-indexed annuities until truthful disclosure and the absence of sales practice abuses is assured.