67
An Economic Analysis of Shifting Cultivation and Bush-Fallow in Lowland Sumatra Bustanul Arifin and Agus Hudoyo Southeast Asia Policy Research Working Paper, No. 1
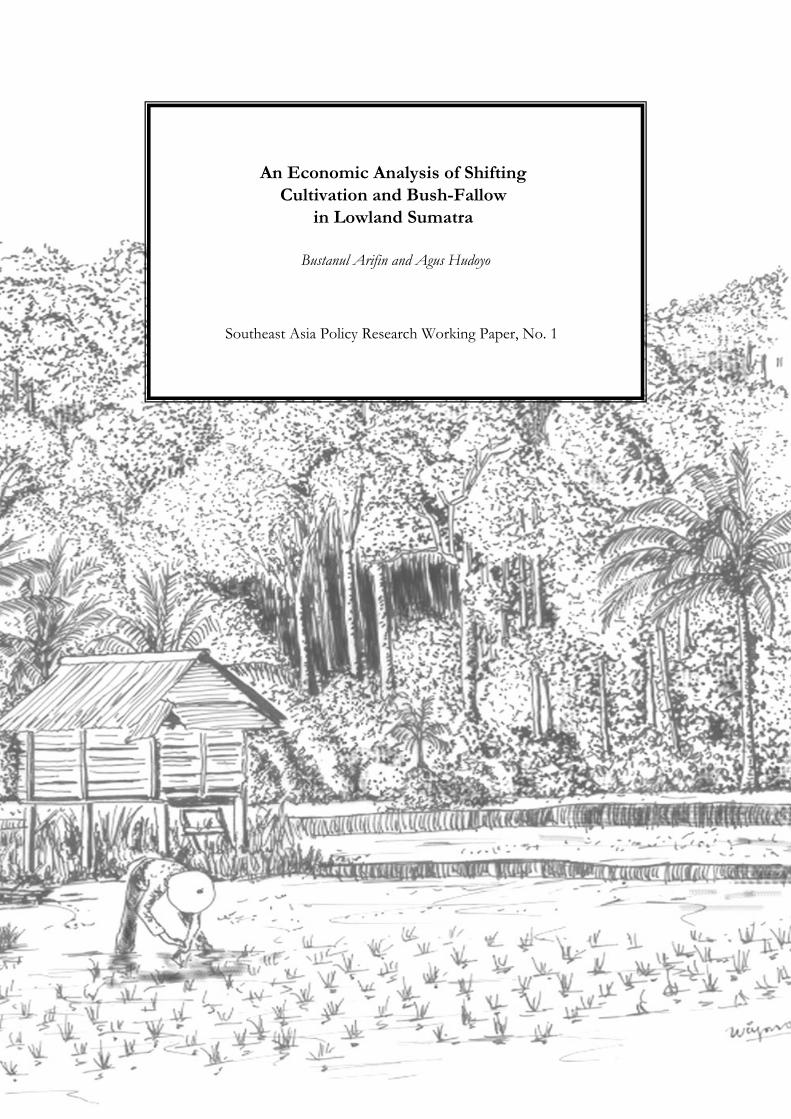
An Economic Analysis of Shifting Cultivation and Bush-Fallow
in Lowland Sumatra
Bustanul Arifin and Agus Hudoyo
Southeast Asia Policy Research Working Paper, No. 1

Acknowledgement This report is part of the ASB Project in Indonesia. The Asian Development Bank, under RETA 5711, financially supported this specific work.

© Copyright ICRAF Southeast Asia Further information please contact: ICRAF SE-Asia Southeast Asian Regional Research Programme PO Box 161 Bogor 16001 Indonesia Tel: 62 251 625415, fax: 62 251 625416 Email: [email protected] ICRAF Southeast Asia website: http://www.icraf.cgiar.org/sea Cover design: Dwiati N. Rini Illustration design: Wiyono Declaimer This text is a ‘working paper’ reflecting research results obtained in the framework of ICRAF Southeast Asia project. Full responsibility for the contents remains with the authors.
Research Report submitted to Alternatives to Slash-and-Burn Indonesia Consortium
AN ECONOMIC ANALYSIS OF SHIFTING CULTIVATION AND BUSH-FALLOW IN LOWLAND SUMATRA
by
Bustanul Arifin and Agus Hudoyo
Department of Agricultural Economics and Social Sciences, University of Lampung (UNILA)
Jl. Sumantri Brojonegoro No. 1, Bandar Lampung 35145, Indonesia Phone: +62-721-781-821, Fax: +62-721-702-767
E-mail: [email protected]
February 15, 1998

Table of Contents
Page 1. INTRODUCTION . . . . . . . . . . . . . . . . . . . . . . . . . . . . . . . . . . . . . . . . . . . . . . . . . 1 (a) Scientific and Policy Relevance . . . . . . . . . . . . . . . . . . . . . . . . . . . . . . . 1 (b) Objectives . . . . . . . . . . . . . . . . . . . . . . . . . . . . . . . . . . . . . . . . . . . . . . . . . . 3 (c) Significant Contribution . . . . . . . . . . . . . . . . . . . . . . . . . . . . . . . . . . . . . 3 2. THEORETICAL FRAMEWORK . . . . . . . . . . . . . . . . . . . . . . . . . . . . . . . . . . . . 4 (a) Loss of Forest Cover . . . . . . . . . . . . . . . . . . . . . . . . . . . . . . . . . . . . . . . . . 4 (b) Shifting Cultivation . . . . . . . . . . . . . . . . . . . . . . . . . . . . . . . . . . . . . . . . . 6 (c) Land-Rent-Capture . . . . . . . . . . . . . . . . . . . . . . . . . . . . . . . . . . . . . . . . . . 8 3. METHODOLOGY . . . . . . . . . . . . . . . . . . . . . . . . . . . . . . . . . . . . . . . . . . . . . . . . 9 (a) Data Collection . . . . . . . . . . . . . . . . . . . . . . . . . . . . . . . . . . . . . . . . . . . . . 9 (b) Analytical Framework . . . . . . . . . . . . . . . . . . . . . . . . . . . . . . . . . . . . . . . 9 (c) Variables and Measurements . . . . . . . . . . . . . . . . . . . . . . . . . . . . . . . . . 12 4. PRELIMINARY FINDINGS . . . . . . . . . . . . . . . . . . . . . . . . . . . . . . . . . . . . . . . . 14 (a) Features of Study Region . . . . . . . . . . . . . . . . . . . . . . . . . . . . . . . . . . . . . 14 (b) Land-Use System . . . . . . . . . . . . . . . . . . . . . . . . . . . . . . . . . . . . . . . . . . . . 16 (c) Crop and Labor Calendar . . . . . . . . . . . . . . . . . . . . . . . . . . . . . . . . . . . . . 23 5. POLICY ANALYSIS MATRIX . . . . . . . . . . . . . . . . . . . . . . . . . . . . . . . . . . . . . . . 26 (a) Privated Profitability . . . . . . . . . . . . . . . . . . . . . . . . . . . . . . . . . . . . . . . . 26 (b) Social Profitability . . . . . . . . . . . . . . . . . . . . . . . . . . . . . . . . . . . . . . . . . . . 27 (c) Effect of Divergence . . . . . . . . . . . . . . . . . . . . . . . . . . . . . . . . . . . . . . . . . . 28 (d) NPV-PAM and Sensitivity Analysis . . . . . . . . . . . . . . . . . . . . . . . . . . . 30 6. CONCLUDING REMARKS: POLICY REFORMS . . . . . . . . . . . . . . . . . . . . . . 32 References . . . . . . . . . . . . . . . . . . . . . . . . . . . . . . . . . . . . . . . . . . . . . . . . . . . . . . . . 33

1
1. INTRODUCTION
(a) Scientific and Policy Relevance
Shifting cultivation is often associated with forest clearing, leading to a decline
of forest area or deforestation. Negative consequences of deforestation are widely
known. Deforestation is one of the major factors of land degradation, loss of biological
diversity and endangered species, thereby contributing to global warming. In the
literature, shifting cultivation has played a central role in the debate of deforestation.
Most studies blame shifting cultivation practices as the main cause of deforestation, but
overlook policy-induced incentives that might drive that behavior (Gillis, 1988, Dick,
1991). Even the World Commission on Environment and Development (WCED, 1987)
suggests that deforestation and other environmental destruction especially in
developing countries is positively correlated with poverty and the presence of shifting
cultivators. According to the report, those who are poor and hungry will often destroy
their immediate environment in order to survive, they will cut down forests, they
overuse marginal land, etc.
This is clearly a case of "blaming the victim" since the smallholder seems to be
the only immediate responsible party for environmental degradation. This argument is
trapped in a simple-deterministic paradigm such as Neo-Malthusian or Neo-Marxian
paradigm. The Neo-Malthusian paradigm suggests that population growth causes
poverty inducing environmental degradation, while Neo-Marxian paradigm postulates
that poverty causes population growth resulting in environmental destruction. If
blame must be appointed, it is equally, if not more, appropriate to charge the rural land
tenure system that allows rich landlords to monopolize the best resources in the region
and often to use them wastefully (Arifin, 1993).
The extent of deforestation in developing countries is actually far beyond the
presence of shifting cultivators. A more holistic and interdisciplinary approach
suggests that deforestation or environmental degradation in general is not a simple
technical issue, but a more complex problems involving institutional and political
structures within the overall economic system. Several policies, both in the forestry and

2
non-forestry sectors, significantly contribute to forest destruction. These policies
include: the ban on log exports; fees and taxation in the forestry sector; the forest
concession policy; and timber-plantation industry (HTI) policy, and transmigration or
agricultural colonization (see Arifin, 1995)
Shifting cultivation actually differs from a simple forest clearing which normally
involves slash-and-burn, logging and other related timber-production activities.
Shifting cultivation could be considered as an early stage in the evolution of
agricultural systems. Initially, the system is based on cutting and burning vegetation in
the dry season. Declining soil productivity and increasing weed problems lead farmers
to abandon fields after few years. Other types of vegetation take over, and the field
eventually grows into secondary forest or bush-fallow, before the cycle is repeated.
The length of bush-fallow varies considerably, generally 5 - 20 years but sometimes not
even five years, and inversely correlates with population pressure and the level of
technology (Boserup, 1989). Shifting cultivation has low productivity in terms of
output per hectare, compared to most other "modern" agricultural systems, but
relatively high return to labor (Angelsen, 1995).
Whether or not the presence of shifting cultivators really cause deforestation still
depends on the type of forest. The Indonesian government has designated the 120
million hectares of government forest land into conservation forest, natural parks and
nature reserves (13%), watershed protection forest (21%), limited and regular
production forest (35%), and conversion forest (21%) (see Arifin, 1993). In addition,
there is a considerable zone of overlap (and conflict) between these "government forest
lands" and "village land" which is owned by villagers. It may be that shifting
cultivators or smallholders in general account for much of the conversion at the
margins of conservation and protection forests, where large-scale actors (at least
formally) are not supposed to operate. Conversion may also occurs because of
interaction between policy-induced activities or logging companies that build roads
and the smallholders occupying this land as spontaneous migrants; or the activities of
shifting cultivation really take place at the conversion forests.
However, one should note that "conversion forest" is government forest that has
been officially designated for conversion to other uses, usually involving agricultural
3
production, such as transmigration projects and large-scale plantation agriculture. To
large extent, the "conversion forest" policy problem rests with a greater problem of
market failure: lack of mechanisms to compensate resource users (including national
governments, companies, and smallholders) for supplying the (global) externalities.
The present study is, of course, not trying to address this global problem, rather is an
attempt to digest the complexity of shifting cultivation systems in relation to the loss of
forest cover, including the conversion forest.
Despite the great interest in this issue, there has been surprisingly little
empirical work about the economic mechanism of shifting cultivation system. Most of
the studies that have been published on this issue are case studies of particular
communities or regions that provide valuable insights, but do not provide a basis for
comparative analysis or statistical testing of hypothesis and policy formulation
regarding the alternatives to shifting cultivation in forest land. The present research,
using a more grounded survey in the field, is an attempt to address this gap in
empirical knowledge. The case of shifting cultivation in forest area in Rantau Pandan,
Bungo Tebo of Jambi Province provides an exemplary opportunity to devote an
economic and environmental policy analysis on the complexity of shifting cultivation,
and deforestation issues, under conditions typical of many Indonesian uplands and in
other developing world as well.
(b) Objectives
The overall objective of the research project is to acquire knowledge and
develop models on economic mechanism behind the application of shifting cultivation
practices in forest area, and on the economic adjustment process of how shifting
cultivators might adopt bush-fallow rotation system as a means to naturally improve
agricultural productivity or apply more intensive land-use systems as a response to
increasing real wages and growing market economy in the Lowland Sumatra,
Indonesia. More specifically, the research project intends to:
(1) empirically analyze the system of shifting cultivation practices in the Lowland
Sumatra, Indonesia;

4
(2) examine economic profitability of the following land-use systems: shifting
cultivation and bush-fallow, and permanent cultivation of lowland rice-paddy;
(3) perform sensitivity analysis of relevant policies affecting land-use system using
Policy Analysis Matrix (PAM) framework; and
(4) offer economic-policy reforms having short-run impacts on the sustainability of
agro-forestry system in Indonesia and other developing economies in general.
(c) Significant Contribution
The present study will contribute to a better understanding on the complexity of
shifting cultivation, deforestation mechanism, the length of bush-fallow period and
other related issues on alternatives to shifting cultivation in forest area. Moreover, this
study improve the analytical frameworks and policy implications of shifting
cultivation and deforestation literature in general, and strategy formulation towards
the dissemination of intensive land-use systems as alternatives to shifting cultivation.
A new thrust of approach in the present study includes consideration of economic
adjustment of the farming systems in response to increasing real wages and growing
market economy.
2. THEORETICAL FRAMEWORK
(a) Loss of Forest Cover
Classical literature on forest ecology suggests that human intervention threatens
the balance of nature of forest ecology. For example, Mikesell (1960) suggests that the
major causes of deforestation have been and continue to be: domestic and industrial
consumption of wood, burning to clear land for cultivation, and destruction of
palatable plants by livestock. Sauer (1967) suggests tropical rain forests are not
resistant to penetration and modification by agricultural practices, which are usually
preceded by the use of fire. Even in modern literature, major causes of deforestation
are believed to include population pressure inducing forest conversion into

5
agricultural land and the demand for fuelwood, development project, logging and
forest concession and fire loss (World Bank, 1990;World Resources Institute, 1991).
The generalization about population pressures and poverty being the root cause
of deforestation would distract the attention from other issues about which it is often
much more possible to do something in a relatively short time. Bromley (1990) argues
that simply blaming population growth would allows inept or corrupt governments to
shift the blame for either their behavior or their inaction, as the case may be - to
"promiscuous" peasants. It further allows governments to appear helpless in the face
of forces beyond their control. And, it allows them to attract international assistance
for projects to correct certain resource insults, the better to appear more beneficent to
their citizenry.
For the case of deforestation in Indonesia, there are essentially two extremes in
the on-going debate over the causes of deforestation. On the one hand, deforestation is
argued to have been driven by the growing number of shifting cultivation, smallholder
production activities (FAO, 1990; World Bank, 1990; Barbier, et al., 1993; and Fraser,
1996) such as in the classical ecology arguments. On the other hand, deforestation has
been driven by the government policies and its development, and particularly
misdirected policies in the timber sector industry, while also acknowledging the
important contribution of shifting cultivation in the forest-cover removal (Dick, 1991;
WALHI, 1992; Angelsen, 1995; and Arifin, 1996).
(b) Shifting Cultivation
Studies of shifting cultivation in relation to forest-pioneer continuum and to loss
of forest cover in Indonesia are not well documented. Weinstock and Sunito (1989)
even suggest a distinction between shifting cultivators and forest pioneers. Shifting
cultivators are defined as people who practice a form of rotational agriculture with a
fallow period, longer than the period of cultivation. Unless faced with population
pressure or other constraints, land is used only one to three years and fallowed for a
relatively long period. Forest pioneers are defined as people who may utilize slash-
and-burn of the existing vegetation but with the primary intention of establishing

6
permanent or semi-permanent agricultural production. They choose primarily cash
crops (mostly perennial), although they grow food crops for subsistence purposes.
The growing debate on a continuum of farming systems in Indonesia in terms of
policy implication results in two extremes as well. One extreme refers to traditional
shifting cultivation’s which involve very long fallows and long-term conservation of
forest land, as has been practiced by traditional people of Semendoe and Ogan in
Jambi, Dayak in Kalimantan, etc. The other extreme refers to forest pioneer cultivation
which involve long-term degradation and deforestation. This extreme often associated
with spontaneous transmigration which may also correlates with government policies
to boost regional development in some remote areas. The government position
condemns forest pioneer cultivation as environmentally destructive, even it does not
differentiate it from traditional shifting cultivation. While the non-governmental
organization (NGO) activists insist that if the government is serious about forest
conservation, then it must support those traditional farming systems that are consistent
with the aim of long-term forest conservation (see Sunderlin and Resosudarmo, 1996).
Empirical estimates show a significant variation in the share of shifting
cultivation in deforestation in Indonesia, primarily because of the definition differences
of shifting cultivation and the specific (political) purposes of a particular study
regarding shifting cultivation practices. The World Bank (1990) estimates that the
shifting cultivation for three provinces in 1990 was 14 million hectare in Sumatra, 11
million hectare in Kalimantan and 2 million hectare in Irian Jaya. The total area of 27
million hectare expands at the annual rate of 2 percent, implying deforestation of
roughly 500 thousand hectare per year, by far the largest cause of deforestation.
Dick (1991) criticizes the World Bank estimates and suggests that traditional
shifting cultivators account for 21 percent of total deforestation, rather than the largest
share. The main reason is that many forests being cleared are part of long-standing
rotation on clan-lands (tanah marga), and the traditional cultivators lack the tools
necessary to convert all but the most open primary forest. Then, at the latest report, the
World Bank (1994) acknowledges that shifting cultivation may be less damaging than
previously thought. A thorough observation on shifting cultivation in Kecamatan
Siberida of Riau Province, Sumatra by Angelsen (1995) suggests that simply increasing
7
population is not necessarily the main cause of deforestation. Changing proportion of
households practicing swidden accounts for 7 percent of the total forest clearing; the
total population of households account for 23 percent of the total; and the average size
of swiddens accounts for 7 percent of the total forest clearing.
For Indonesia as a whole, the area of shifting cultivation increases at a rate of 2.9
percent per year in the last decade. The increase occurred primarily because of a vast
increase in the area of rice and secondary food crops (palawija) in the upland land.
Sumatra and Kalimantan experienced a rapid increase, 9.1 and 4.4 percent per year and
upland rice and secondary food crops are extensively grown in these islands. A similar
increase is also found in Sulawesi, Bali-Nusa Tenggara and Java which experienced a
change in upland cultivation of 1.1, 0.8 and 0.1 percent per year respectively (CBS,
various issues). However, these data should be interpreted with cautions. The term
shifting cultivation used by the Central Bureau of Statistics (CBS) for the Statistical
Yearbook of Indonesia refers to either simply upland cultivation (ladang) which might
be as a permanent basis or actual shifting cultivation (huma). It is very unfortunate that
the CBS data available do not provide enough information to distinguish between
these categories. Consequently, the term "shifting cultivation" by itself cannot be used
specifically to examine the environmental consequences of agricultural operations that
shift the land base or use forest fallow to restore fertility. One can assume that in Java,
Bali and part of Sumatra, the term "shifting cultivation" will refer to ladang but outside
these areas it refers to huma or the actual shifting cultivation (see Arifin, 1995).
(c) Land-Rent-Capture
The approach of land-rent-capture developed by Angelsen (1995, p: 1716-1717)
is relevant to explain the mechanism of shifting cultivation and deforestation under an
open economy argument. Land rent is defined as the surplus or profit to the owner of
the land, that is the gross value of production minus all costs of production, except for
land. In this case, the costs related to the location of the land (von Thunen hypothesis)
such as transport of output, walking distance back and forth, as the main factors, rather
than the costs associated with the quality of the land (Ricardo hypothesis) which are

8
difficult to quantify. The land rent increase with land accessibility, primarily because
the location or distance costs are directly correlated with the distance form the village
center. The land rent can be formally defined as follows:
r = pX - wL - qD
where r is land rent per hectare; p price per unit of output; X output per hectare
(reflecting the technological level, soil fertility, etc.); w opportunity cost per unit of
labor (wage in alternative employment); L labor input per hectare; q costs per hectare
and per kilometer distance or location of field; and D distance in kilometer from the
village center to the field.
Therefore, the land rent declines as distance increases, and eventually reaches
zero. The distance at which land rent is zero declines the agricultural frontier or
margin of cultivation. Given that people are free to move and open new land, the basic
premise is that all forest land with a positive land rent will be cleared and transformed
to agricultural production. The policy implication of this approach can be formulated
as follows: any changes in the variables which increase the profitability of frontier
agriculture will augment deforestation. This includes higher output price (p);
technological progress (X up and/or L down); lower opportunity cost of labor (w),
including self employment, wage labor and income of farming; and lower transport
cost (q), also influenced by the availability of roads and other infrastructures.
Further implication of the land-rent-capture into the property rights issues
could be incorporated. As clearing gives property rights, farmers not only look at the
immediate benefits, but also at the future surplus from production. In economic terms,
this future surplus is formulated in the net present value (NPV). The expected NPV, at
a particular time k, of an infinite stream of expected rents rte , discounted at a rate i, can
be written as follows:
∞ NPVke = ∫ (1+i)-t rte t=k
As a result, competition among farmers for new land will ensure that all forest
with a positive NPV is cleared. Forest is cleared even if it has a negative rent the first

9
years. This loss will be outweighed through a positive land rent some time in the
future. Early clearing is necessary to establish property rights; otherwise the land
would be taken by others.
Even though the land-rent capture approach is useful in explaining the
economic mechanism of shifting cultivation system of particular communities or
regions, the concept does not provide a basis for comparative analysis of the
profitability of the system compared to other land uses. The comparative analysis
becomes so important that the policy formulation could be directed towards searching
the alternatives to a more sustainable land-use and forest management. Given that
the previous studies on shifting cultivation were generally based on the absence of
trade and international markets and other types of close economy argument, the
present study is relaxing the close-economy assumption and viewing the changes in
land-use system as the economy is more opened to international markets and even to
government-policies. The policy formulation on land-use alternatives would be more
comprehensive once the policy options are more thoroughly examined, and the
sensitivity of scenarios are carefully analyzed.
Therefore, the hypotheses to be tested in the present study are:
(1) Shifting cultivation followed by bush-fallow system performs as a means to
naturally restore vegetation and improve land productivity, but the system does
not provide an optimal economic return to land resources.
(2) An agro-forestry system in forest area combined with intensive land-use system
in a more sedentary land is farmers’ rational response to increasing real wages
and growing market economy.
10
3. METHODOLOGY
(a) Data Collection
This study employs a field survey to collect primary data and to verify
secondary data collected a wide range of sources. The field survey has been
undertaken in July of 1997 and focused on collecting information on shifting cultivation
activities in the forest area of Bungo Tebo District of Jambi Province for the 1996-1997
crop season. These data include cropping patterns and activities in crop production, i.e.
the use of land, labor, capital and the yield, amount of works and labor calendar spent
on on-farm and off-farm, type of off-farm activities, and other physical and socio-
economic information.
In addition, the historical aspects of shifting cultivation systems were
investigated carefully, such as where and how long the farmers cultivate the previous
farms before the current site, the length and types of bush fallow, factors affecting the
farmers' choice in the previous cropping patterns and the next choice to cultivate, etc.
The study interviewed directly both shifting cultivators and permanent farmers living
in the piedmont area of conservation forest of Kerinci Seblat National Park which is
administered by Kecamatan Rantau Pandan, Kabupaten Bungo Tebo, Jambi Province.
Secondary and supporting data were collected from a wide range of secondary
sources such as Central Bureau and Regional Offices of Statistics, Department of
Agriculture, of Forestry, of Public Works, the World Bank, ICRAF, CIFOR and related
agencies and organizations, and from previous studies of shifting cultivation and
deforestation. Time series data on population and labor force participation in the
region will come from the Central Bureau of Statistics; yield and cultivated area of
particular crops will be obtained from the Department of Agriculture. Information on
the performance of forest-cover loss will be obtained from the Department of Forestry
and Agency for Environmental Impact Assessment.
(b) Analytical Framework
11
The data collected and other related information were analyzed thoroughly
using both quantitative and qualitative frameworks. The standard method of land rent
calculation for shifting cultivation system will be employed to obtain the economic
returns on output after taking into account all costs and related expenses, and in light
of the travel cost from the field to village center. Qualitative information such as
property rights regimes and institutional factors relating to "the working rules of going
concerns" on shifting cultivation practices and social arrangements of labor force were
evaluated using previous studies and available information. Additional interviews
with key informants were conducted with at the village level, district level and the
provincial level.
For policy analysis on the economic profitability of respective land-use system
will be analyzed under the framework of Policy Analysis Matrix (PAM) developed by
Monke and Pearson (1989). The purpose of PAM approach is to measure the impact of
government policy on the private profitability of agricultural systems and on efficiency
of resource use. In the case of shifting cultivation - as a principal agricultural system --
and other land-use system in the study area, the PAM approach is useful to construct
accounting matrices of revenues, costs and profits. The PAM is also very useful to
investigate further the impact of policy on competitiveness and farm-level profits, the
influence of investment policy on economic efficiency and comparative advantage, and
the effects of agricultural and research policy on changing technology.
Therefore, the determination of profit received by farmers also implies which
farmers are currently competitive and how their profits might change if price policies
were changed. Also, investment policy to allocate capital budgets could be formulated
to increase efficiency and speed the growth of national income. Here, the concept of
social profits as a measure of economic efficiency is introduced in the analysis, which is
simply the difference between revenues and costs for a system, valued in social prices.
Finally, the approach could answer questions on how best to determine the most
fruitful directions for the alternatives to raise crop yields and reduce social costs,
thereby increasing social profits of the overall land-use systems.
The basic structure of PAM is presented in Table 1. Profits are shown on the
right-hand column and could be calculated by subtracting revenue in the left-hand

12
column with two middle columns of cost. Each PAM normally consists of two cost
columns, one for tradable inputs and the other for domestic factors. Intermediate
inputs such as fertilizer, pesticide, purchased seed, compound feeds, electricity,
transportation and fuels are divided into their tradable input and domestic factor
components. The private profitability refers to the observed revenue and costs
reflecting actual market prices received or paid by farmers or processors in
agricultural system. As mentioned previously, the social profits measure the
comparative advantage or the efficiency in the agricultural systems.

13
Table 1. Basic Structure of Policy Analysis Matrix
Costs Revenues Tradable
Inputs Domestic
Factors Profits
Private Prices A B C D Social Prices E F G H Effects of divergences and efficient policy
I J K L
Notes: Private profits : D=A-B-C Input transfer: J=B-F Social profits : H=E-F-G Factor transfer: K=C-G Output transfer : I = A-E Net transfer: L=D-H The second identity in the matrix concerns the differences between private and
social valuations of revenues, costs and profits. Recall that social prices correct for the
effects of distorting policies, which lead to an inefficient use of resources. However, one
needs to distinguish distorting policies which cause loss of potential income, from
efficient policies, which offset the effects of market failures and thus create greater
income. Because efficient policies correct divergences, they reduce the differences
between private and social valuations (see Monke and Pearson, 1989, p:23). Therefore,
an expanded version of the PAM to include additional three rows of the effect of
divergences can be seen in the following Table 2.
Table 2. Expanded Version of Policy Analysis Matrix
Costs Revenues Tradable
Inputs Domestic
Factors Profits
Private Prices A B C D Social Prices E F G H Effects of divergences and efficient policy
I J K L
Effects of market failures M N O P Effects of distorting policies Q R S T

14
Effects of efficient policies U V W X Notes: Output transfer: I=A-E, or I=M+Q+U Input transfer: J=B-F, or J=N+R+V Factor transfer: K=C-G, or K =O+S+W Net transfer: L=D-H, or L=P+T+X A dynamic comparative advantage, inherent within the Policy Analysis Matrix
(PAM) approach employed in the present study, could lead to policy formulation on
the ability of a land-use system to compete without distorting government policies.
This could be strengthened or eroded by changes in economic conditions, because the
competitiveness of a land-use system that occurs over time is influenced by three
important economic factors: long-run world prices of tradable outputs and inputs,
social opportunity costs of domestic factor of production (labor, capital and labor), and
production technologies being used. In addition, the provision of modern inputs,
rural infrastructure, and non-farm employment in rural areas are important in
formulating the alternatives to slash-and-burn in forest area. The use of PAM would
tackle these issues and simulate in such a way in accordance with a more opened to
international markets of agricultural commodities. The policy formulation on
alternatives to shifting cultivation is more comprehensive since the policy options are
more thoroughly examined and the sensitivity of scenarios are carefully analyzed.
(c) Variables and Measurements
Several variables and their measurements for the present study are defined and
explained as follows:
• Shifting cultivation is a land-use system involving a form of rotational agriculture
with a bush-fallow period, longer than the period of cultivation. The land is used
for growing food crop, particularly upland rice for only one to a maximum of three
years and fallowed for a relatively long period.
• Forest-pioneer cultivation is a system involving slash-and-burn of the existing
forest vegetation but with the primary intention of establishing permanent or semi-
permanent agricultural production, primarily cash crops. Forest pioneer cultivation
usually involves long-term deforestation and land degradation.

15
• Deforestation is a process leading to a decline in forest area and destruction of
forest ecosystem which cause the forest to loss its function ecologically and
economically.
• Intensive land-use system is a cultivation system with more agricultural input and
labor per unit of land, and other non-extensive activities of using land resources.
• Agro-forestry is a land-use system which combine a food crop activities and tree
crop and wood production at the immediate land.
• Land rent is the surplus or profit to the owner of the land, that is the gross value of
production minus all costs of production, except for land, measured in Rupiah.
• Output is an amount of production from particular food and cash crops, reflecting
the technological level, soil fertility, measured in kilogram equivalent.
• Farm-gate price is the current or yearly actual price of agricultural production at the
farmers’ level, measured in Rupiah per Kilogram.
• Agricultural input is the total of non-labor inputs employed in the production
process, consisting mainly of traditional and modern inputs, both bio-chemical
(seed, fertilizer, pesticide, herbicide, etc.) and mechanical inputs (hand-tractor, etc.),
measured normally in the respected input units (kilogram, liter, units, etc.)
• Input price is the farm-gate price of all agricultural inputs, measure in Rupiah.
• Labor input is the total working days spent by both family and hired labor in
agricultural production, measured in man-day equivalent.
• Wage rate is the level of actual wages, measured in Rupiah per man-day. In the
case of gender segregation in wage rate, necessary adjustment will be made.
• Distance is the duration of travel time from the village center to the field, measured
in kilometers and/or walking hours.

16
4. IMPORTANT RESEARCH FINDINGS
(a) Features of the Study Region
The study region is located in the subdistrict (Kecamatan) of Rantau Pandan, the
district of Bungo Tebo at Jambi Province of Sumatra. The distance from city center of
Muara Bungo, the Capital of Bungo Tebo, is about 31 km, and from Jambi City is about
267 km by a very good quality state road. The study location was selected for a
number of reasons. It provides a good example of shifting cultivation in different
length of fallow system, of changing forest area to dryland agriculture with rapidly
increasing population, and adaptation of more permanent agriculture along with fast
improvements in the living standards of the people in the last decades or so. In
addition, the district of Bungo Tebo is a primary study region of the project of
Alternatives-to Slash-and-Burn (ASB) where ICRAF Indonesia takes a major lead.
Based on the information available currently, Kecamatan Rantau Pandan
consists of 21 villages. The total population of this subdistrict (Kecamatan) in 1995 are
22,884 (11,084 men and 11,800 women) and the total households are 5,238, most of
which are involved in agricultural activities. The area of the whole subdistrict is about
1,278,140 square kilometer, implying that population density of Rantau Pandan is only
about 18 per square kilometer (Bungo Tebo Regional Office of Statistics, 1997), which is
quite common for an outside-Java standard.
Population growth in Rantau Pandan has increased tremendously in the last
decade. Based on the data of national census, the population growth in the period of
1980-1990 was 1.42 percent per year. This amount is actually far below the national
average of growth, which was 1.97 percent per year. In the period of 1990-1995, the
population growth in Rantau Pandan has risen to 1.70 percent per year or about similar
to the 1.69 percent growth of national average. This increase could affect the cropping
pattern and the length of bush-fallow in the shifting cultivation practices.
Kecamatan Rantau Pandan is located in the piedmont zone, ranging from 100 to
500 meters above sea level (asl). Soils of the area are composed of latosol-litosol
complex with fine texture. During the last decade, annual rainfall varied from 1,656 to
17
2,868 mm where December and January are the wettest and June and July are the driest
(van Nordwijk, et al. 1995). Typical for this type of soil, the largest part of the area is
dominated by secondary or logged-over forest where large-scale (and notably illegal)
logging practices have taken place for years. However, most of the forest area in the
southern part or upper portion of Rantau Pandan were claimed as a part of Kerinci
Seblat National Park (KNSP). In fact, local people have grown rubber in that forest
area long before the government declared the area as a conservation forest. In
addition, given the ecological function of rubber, cinnamon and other tree crops
around the National Park, the watershed protection functions of the Park may be
adequately covered.
Major food crops in Rantau Pandan are upland and lowland rice, corn and
soybean. The productivity of these crops is about the average of which in other regions
of Sumatra. According to the Official Statistics, the productivity of upland rice in
Rantau Pandan is only 1.2 ton/ha, and that of lowland rice and corn is about 4.2
ton/ha and 3.2 ton/ha respectively. While the productivity figure of upland rice is
about comparable with that of observed figure in the present study, the official
productivity of lowland rice is overestimated by about three degrees of magnitude.
Even though the productivity is only 0.8 ton/ha, soybean is becoming more popular
among farmers in Rantau Pandan recently and could be prospective in the future.
Major cash crops in Rantau Pandan are rubber, coffee, cassiavera and tall
coconut. The area of these crops spread over the subdistrict, reaching more than 14
thousands hectare of rubber, more than 900 hectare of coffee and about 230 and 160
hectare of cassiavera and tall coconut, respectively. As explained above, local people
have been accustomed to planting the rubber with local varieties since many years
within the forest, particularly for property right purposes. In addition, market
information and other pressing factors have caused local farmers in Rantau Pandan to
become more alert and allocate their lands to a more prospective cash crops such as
cassiavera (cinnamon).
Field observation for this study has focused on two villages in the subdistrict:
Muarabuat and Senamat Hulu and some additional information along the road in the
village of Laman Panjang. Muarabuat and Senamat Hulu has been known for typical

18
ladang land use of Sumatra using a shifting cultivation for upland rice, with bush-
fallow system, where more than 60 and 90 percent, respectively of the households in
these two villages are involved. The village center of Muarabuat is located in the main
road of the subdistrict, adjacent to the village of Rantau Pandan, the main village or the
capital of the subdistrict. The land-use observed in study sites for economic analysis of
shifting cultivation system in the lowland Sumatra can be summarized in the following
Table 3.
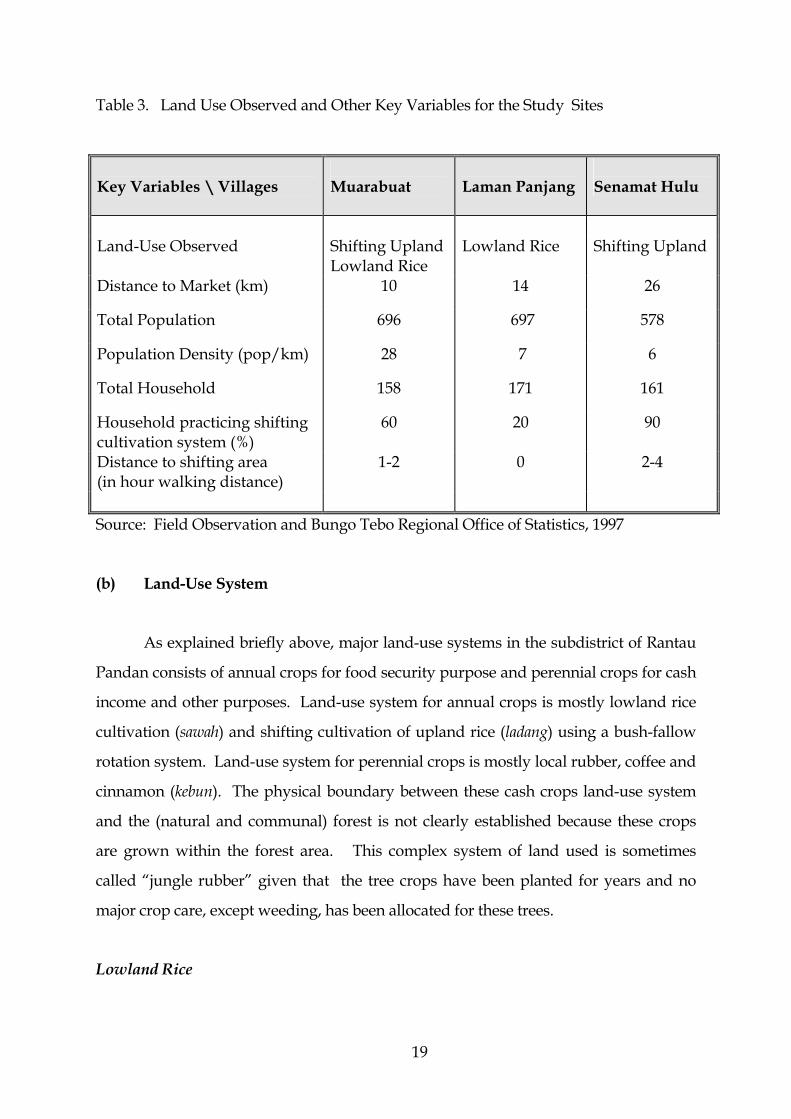
19
Table 3. Land Use Observed and Other Key Variables for the Study Sites
Key Variables \ Villages
Muarabuat
Laman Panjang
Senamat Hulu
Land-Use Observed Shifting Upland
Lowland Rice Lowland Rice Shifting Upland
Distance to Market (km) 10 14 26
Total Population 696 697 578
Population Density (pop/km) 28 7 6
Total Household 158 171 161
Household practicing shifting cultivation system (%)
60 20 90
Distance to shifting area (in hour walking distance)
1-2 0 2-4
Source: Field Observation and Bungo Tebo Regional Office of Statistics, 1997
(b) Land-Use System
As explained briefly above, major land-use systems in the subdistrict of Rantau
Pandan consists of annual crops for food security purpose and perennial crops for cash
income and other purposes. Land-use system for annual crops is mostly lowland rice
cultivation (sawah) and shifting cultivation of upland rice (ladang) using a bush-fallow
rotation system. Land-use system for perennial crops is mostly local rubber, coffee and
cinnamon (kebun). The physical boundary between these cash crops land-use system
and the (natural and communal) forest is not clearly established because these crops
are grown within the forest area. This complex system of land used is sometimes
called “jungle rubber” given that the tree crops have been planted for years and no
major crop care, except weeding, has been allocated for these trees.
Lowland Rice

20
Lowland rice fields could represent the most “modern” land-use system in
Rantau Pandan, and notably in most places in Sumatra. Even though the majority of
farmers do not have certificate for their land in a formal manner, rice fields could be
traded freely in land market, especially those located along the main road. The market
price for land ranges between Rp 450,000 to Rp 500,000 per hectare, and tends to
increase gradually depending on the market forces. However, the land market for
lowland rice field does not take place “normally” since the majority of the land could
fall in to “conservation forest status” boundary under the National Park.
As commonly found in the matrilineal system such as in the majority of Minang
ethnic in West Sumatra, the lowland rice field is normally inherited by women. Other
forms of land transfer include a gift or charity (tanah wakaf) for religious purposes, and
regular selling and purchasing involving the outsiders. Significant influence of
“modernization” has changed the attitude of people of Jambi regarding the rice field.
Ten years ago or so, selling the land was considered against the rules of adat law
because the land was deliberately considered as “harta berat”, normally controlled by
the communal land system. It implies that the food security of the society was in
danger and the sustainability of agricultural system and of the livelihood in the area
was in trouble. The complete institutional mechanism of the communal system in
land-use allocation is probably an interesting subject for future research in this area.
Average lowland rice farmers in Rantau Pandan normally use local variety of
rice (padi panjang), under the reason of easier to manage and better in taste. Some
farmers have applied modern technology such as fertilizer (Urea) and some new high-
yielding variety of rice such as IR-64 and IR-50 (padi Bimas). Other modern inputs such
as pesticide and herbicide have been known by the farmers in Rantau Pandan, but
most farmers do not use them in the 1996/1997 planting season because of
unavailability in the surrounding area. The growing period of local variety of lowland
rice is about six months, therefore farmers are only able to cultivate their field once a
year. Some farmers have grown corn and other secondary food crops at the same field
such as soybean.
The average area of rice-field holding in the subdistrict ranges from 0.4 to 2.0
hectares, using mostly their-own family labor. The average yield of rice field in Rantau
21
Pandan is only 1.5 ton/ha, or about one-third lower than the official statistics reported
by the local government. This productivity is also about or below the subsistence level
of the society in the subdistrict, while the rate of rice consumption increases steadily
due to population growth and increasing income in other sectors of the economy. The
“modern” notion of lowland-rice farmers is also shown by the fact that the majority of
farmers in fulfill their food need by buying the rice in local market around the sites
such as in July and August when the field observation for this study took place.
During regular harvest season, the price of milled rice is about Rp 1,000 per kilogram,
while during planting season or long-drought such as at the present time, the price of
rice could reach as high as Rp 1,400 per kilogram or may be more.
Shifting Cultivation
The term shifting cultivation used in this study refer to the standard definition
developed by the Alternative to Slash-and-Burn (ASB) Indonesia consortium. Shifting
cultivation is a land-use system involving a form of rotational agriculture with a bush-
fallow period, longer than the period of cultivation. The land, locally known as ladang,
is used for growing food crop, particularly upland rice, for only one to a maximum of
three years and fallowed for a relatively long period. The particular argument for the
above definition is that the length of fallow period becomes shorter as population
pressures continue.
In the study sites of subdistrict Rantau Pandan, there are is a large amount of
communal forest land, more precisely it is shrub land, or locally called sesap. These
lands have been designated for shifting cultivation, particularly for upland rice, and
some presently are left fallow and covered by small trees and bush/shrub. It is not
clear whether or not the area of communal forest land, overlap with the state-owned
forest land under concession of forest plantation (HTI) or the conservation forest of the
Kerinci Seblat National Park, or even with newly developed for oil-palm plantation.
According to the rural standard, this land is relatively fertile, located nearby the
village, about 1-2 hour walking distance from the village center. Local people believe
that the lands located further from the village center, or about 4-6 hour walking

22
distance, thus it is a natural forest, are more fertile than their present land. In the
village of Muarabuat, tenurial security is strongly enforced, in order to maintain the
existing ladang system and the availability of rice production, as a part of food security
strategy in rural area. About 1,000 hectares of communal forest land have been
“preserved” for upland rice field under shifting cultivation practices. No tree crops
are allowed in this particular communal land, and shifting cultivation system is
managed by the community. Members within the community are free to use it, but
those who do not have inherited land get priority. Outsiders have to get permission
from the customary leader to use it.
The mechanism of shifting cultivation system, followed by a bush-fallow
rotation in the communal forest land could be summarized in the following Figure 1.
Village Center
1-2 hour walking distance Communal Forest Land 1st year plot upland rice 2nd year plot n-th year plot upland rice upland rice 3rd year plot upland rice 7th year plot upland rice 4th year plot upland rice 6th year plot

23
upland rice 5th year plot upland rice
Figure 1. Shifting Cultivation System in Communal Forest Land in Sumatra: Upland Rice followed by Bush-Fallow
Generally, one household is able to cultivate about 1-2 hectares of upland rice
per year by shifting cultivation system in the communal land. Bush-fallow rotation
ranges between 5-10 years or could be short, medium and long depending on the labor
allocation decision among household and on the land availability to support the
shifting cultivation system. At present, it is very difficult to employ a long fallow of 20
years or more such as it was commonly found in the last ten or twenty years.
Agricultural or rural sector in general has experienced a serious labor shortage since
the opportunity cost of labor has increased tremendously in the last decades.
Meanwhile, in the village of Senamat Hulu communal property of forest land
under the shifting cultivation system is not strongly enforced. The community can
freely buy and sell their land, such it has happened in the last decade or so. Probably,
in addition to the communal land, this village has a number of private plots of bush
land belong to clans or families. The owners usually plant upland rice for 1-2 seasons
and then move to another plot within the bush land. However, there has been some
changes in land-use patterns in the last decades after the second rotation of shifting
cultivation. The choice of not adapting the bush-fallow system is more open, meaning
that farmers could replace the land allocated for shifting cultivation into a more
attractive land use system. If the land is suitable for planting rubber or cassiavera,
these tree crops are interplanted in the first or second year of cropping.
Most likely, the land-use change from rotational system into a more permanent
land-use system takes place in the private and family lands, rather than in the
communal forest lands. Once the land-use changes, the land becomes more tradable
and the market price for land increase significantly. The market price for the land

24
ranges from about Rp 420,000 per hectare for sesap or for upland ladang under shifting
cultivation and about Rp 2 million per hectare for tree crops such as rubber, cassiavera
and probably for oil-palm plantation. However, interpretation for the land-use change
phenomena should be made with caution, given that the present study does not
attempt to identify factors affecting the change in a comprehensive way. This should
be a leading priority in the future research about land-use change.
The mechanism of shifting cultivation system in the private and family land,
which is likely to be transformed the system to a more permanent cash-crop practices
after second rotation, could be summarized in the following Figure 2.
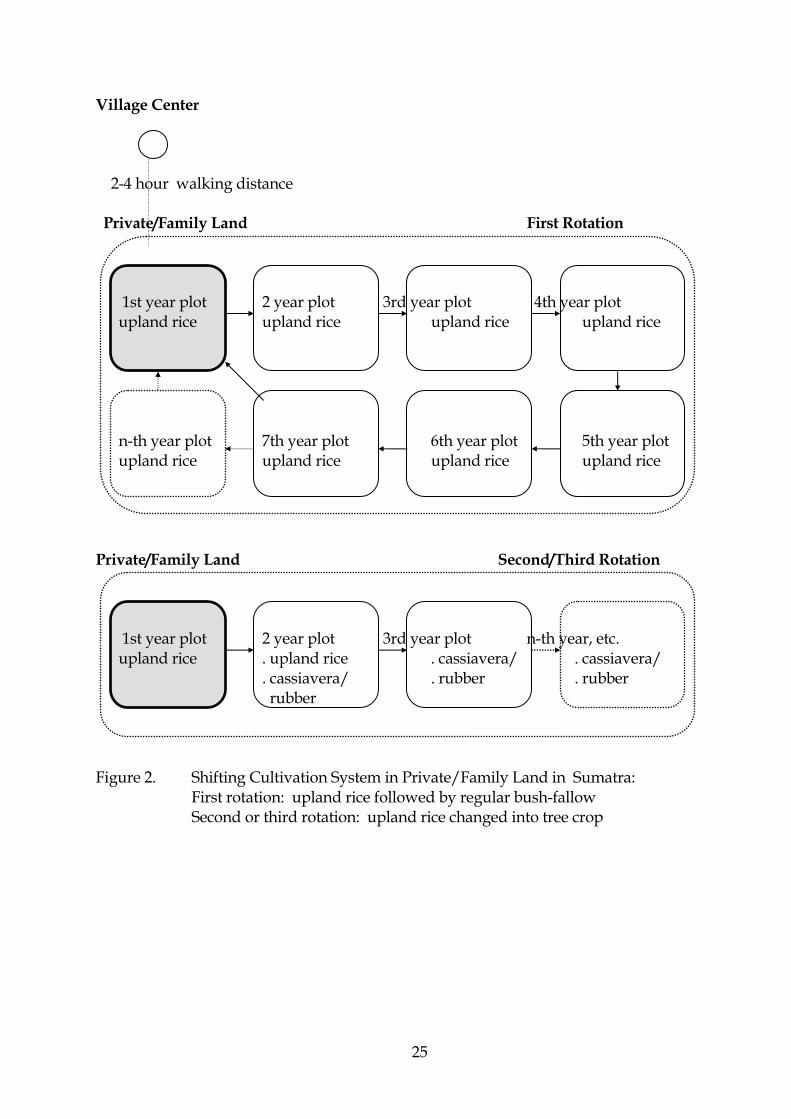
25
Village Center
2-4 hour walking distance Private/Family Land First Rotation 1st year plot 2 year plot 3rd year plot 4th year plot upland rice upland rice upland rice upland rice n-th year plot 7th year plot 6th year plot 5th year plot upland rice upland rice upland rice upland rice Private/Family Land Second/Third Rotation 1st year plot 2 year plot 3rd year plot n-th year, etc. upland rice . upland rice . cassiavera/ . cassiavera/ . cassiavera/ . rubber . rubber rubber Figure 2. Shifting Cultivation System in Private/Family Land in Sumatra: First rotation: upland rice followed by regular bush-fallow Second or third rotation: upland rice changed into tree crop
26
Figure 2 above is probably a typical case of land-use change from a traditional
shifting cultivation system into more permanent agricultural practices in response of a
growing market economy and other external economic forces. In the system where
markets exist and all prices, including the wage rate are parametrically given, the
decision to increase the area of cultivation and to change to existing land use system
are primarily determined by the relative profitability of expected farming practices,
including those in the frontier with the expense of natural forest. Also, if labor can be
sold or hired at a constant wage, the land-use change and production decisions by a
rational and utility-maximizing household can be analyzed by a typical profit-
maximizing production behavior. A higher relative price of rubber and cinnamon than
that of rice, a better road and transportation infrastructure, and an open-access like
tenurial land rights are among important factors contributing to the change.
The recent tendency is an increased tension between the tenurial system of
communal forest land or related customary (adat) rights on land and a more uniform or
centralized “modern” legal system on forest land. According to the Basic Forestry Act
of 1967, all forest in Indonesia is state property, while the customary law on land gives
usufruct rights to forested land planted with perennials crops after clearance. In the
absence of clear boundary between state forest and communal forest land, and due to
weak management of communal forest , a large portion of Indonesian forest could fall
into an open-access like tenurial land rights. Consequently, the attractiveness of
economic profitability of tree crops combined with a property-rights security purpose
on forested land have also lead to land-use change into a more permanent cash crop
practices in the last decade or so.
The average yield of upland rice in Rantau Pandan is about 1.3 ton/ha, or
similar to the official statistics published by the local government. In this study, the
following category was used to classification the length of bush-fallow period. A five-
year fallow or less is considered a short fallow; 5-10 year is medium, and more than ten
year is classified as long-bush fallow system. As expected, the yield of long fallow is
higher than that of medium and short fallow. Therefore under existing condition of
input use and market price for input and output, the shifting cultivation under long-
bush fallow is the most promising for food security purposes. The question is then “is it

27
still possible to adopt the long-fallow system of shifting cultivation given the land is
not unlimited anymore and a more permanent land use system is more attractive for
the household and has been adapted by some household in the village?” Table 4
shows the performance of shifting cultivation system under different length of fallow.

28
Table 4. Performance of Shifting Cultivation under Different Length of Fallow System
Shifting Cultivation Important Characteristics Short Fallow Medium Fallow Long Fallow Input use: Seed (kg/ha) 25 25 25 Labor (man-day/ha) 152 167 167 Working Capital (Rp/ha) 140,600 153,600 171,600 Yield (kg/ha) 1,200 1,333 1,800 Profit excluding land (Rp/ha) 596,400 678,000 1,130,400
Source: Field observation and authors’ calculation
One should note that a detailed information on long fallow system is difficult to
obtaine because most of current plots are under a short-fallow system. A seven-year
bush-fallow could be a maximum possibility that could be materialized by farmers in
Rantau Pandan, given the availability of land and other production factors. In the
present study, respondents were asked a historical-type of question -- but somewhat
hypothetical -- such as how much the yield were obtained by their parents at the very
same land, and what the yield of upland rice would be if the current cultivation in the
bush (sesap) land took place 15 or 20 years ago, etc. In the future research, a more
comprehensive methodology, involving an extensive exploration of available data and
documents on particular plots should be employed in order to draw more complete
and reliable information on estimated yield of shifting cultivation system.
(c) Crop and Labor Calendar
In this section, crop and labor calendar is analyzed, emphasizing on the labor
allocation by household on particular crops and activities. As commonly found in
traditional agricultural practices, crop watching from the pig and from the bird, and
forest/bush clearing or land preparation take time the most. In the study sites, the
normal average working hour is between 7-8 hour, starting at 7:30 and ending at 4.00
pm with one hour break for day-time praying and lunch between 11:30 and 1:00 pm.

29
This schedule is normally imposed for non-family labor force; while the schedule for
family labor could be far more intensive, though not necessarily more flexible.
One should note, however, that the standard working hour explained above is
for arithmetic calculation only and for the purpose of economic analysis. It does not
imply a rigid formal schedule such as in the office or factory working hour. Villagers
hardly put a monetary value on their own labor, even though their labor allocation
decisions are driven by rational economic principles of allocation. Some activities in
the shifting cultivation system such as crop watching from the pig could continue, even
more intensively during night times. The villagers might think that both upland rice
under shifting cultivation and permanent lowland rice cultivation have taken their
labor the most. Heavy duty of crop care, and labor shortage in rural areas, combined
with rice availability for consumption in the local market due to tremendous
development of road and transportation infrastructure could be among the reasons of
land-use change into a more permanent tree crop types of activities.
Average wage rate for forest clearing, land preparation and other man-job in
Rantau Pandan is about Rp 5,000 per man-day, including lunch, coffee and cigarette.
This wage rate is actually a lot higher compared to that two-three years ago, averaging
only Rp 3,500 - Rp 4,000 per man-day. In the subdistrict, wage differentials are
imposed according to particular types of job, meaning no gender segregation in wage
rate. If a man does a woman’s job such as weeding, planting/replanting, he would
receive a wage rate as high Rp 4,000 as what was received by a woman.
Table 5 summarizes the crop and labor calendar of a household in the study
sites of Rantau Pandan subdistrict in Jambi Province. A full month shade in the table
does not imply that the labor is spent for the whole month, rather it represents the
period of activities or labor allocation. The detailed amount of man-day could be
found in the Input-Output Table (I-O Table) of the policy analysis matrix in the Table
Appendix A-1. In any of these months, farmers in Rantau Pandan could have spare
times for weeding in their rubber or cassiavera field, rubber tapping, and harvesting
the wood of cassiavera for cash income, collecting non-timber forest product, working
in someone’s less field or in off-farm employment, or simply migrating temporarily to
the nearby town of Muarabungo as laborers in other sectors of the economy.

30
Table 5. Crop and Labor Calendar of Farmers’ Household in Rantau Pandan
Labor allocation jan feb mar apr may jun jul aug sep oct nop dec
Lowland Rice Land Preparation Seedbed Preparation Planting/Replanting Weeding Crop care/fertilizing Crop watching (pig) Crop watching (bird) Harvesting Drying Upland Rice Shifting Land Clear/Preparation
Planting/Replanting Weeding Crop watching (pig) Crop watching (bird) Harvesting Drying
Notes: The figure for upland rice shifting cultivation is for short and medium bush fallow. Labor calendar for long fallow system is about the same, except that land clearing and preparation takes more time and weeding takes less time than that in short and medium fallow.
31
5. POLICY ANALYSIS MATRIX
(a) Private Profitability
Under the system of shifting cultivation, farmers adopting a short and medium
bush fallow receive only Rp 1.4 and 1.6 million gross revenue respectively for one-
hectare land. This amount is much less than that received by those adopting a long-
fallow system who could obtained at Rp 2.2 million and those under wetland rice. The
cost structure among upland shifting cultivation and lowland rice land-use does not
differ very much, except for long-fallow shifting cultivation. The cost structure for land
preparation differs as much as RP 60,000 because wetland rice system requires a
seedbed preparation.
Weeding activities in upland rice take a cost of Rp 100,000 in average, or a Rp
40,000 higher than that in wetland rice. In addition to weed problem, the degree of
sensitivity of pest attacks in upland rice shifting cultivation is also higher than that in
lowland rice field. Labor allocation for applying the fertilizer does not contribute
significantly to the farm cost structure. In the study sites, fertilizer is only used in the
lowland rice. It is applied at 15 days after planting/replanting and few days before
the period of generative growth or before the rice grain is ready to fill up. Of course
this crop-production management is far below the standard or recommended best
management practices in rice production. Normally, during the phase of generative
growth, NPK fertilizer application is necessary to ensure the growth of grain and to
increase the yield.
The cost of other crop care activities, in general, are lower in a more permanent
lowland rice cultivation. Crop watching from the pig and the bird is less extensive in
the rice field close to housing compound than those located 1-2 hour away from human
settlement. Therefore the total cost of farm-production activities in lowland rice field
is about Rp 810 thousand, which is lower than all types of different length bush-fallow
system. The total cost of short-fallow system is about Rp 844 thousand per hectare,
while the cost of medium and long fallow system is Rp 922 and 1,030 thousands
respectively .

32
The private profitability of different land-use system can be summarized as
follows. The profit, excluding land, for lowland rice cultivation is the higher than that
in shifting cultivation, except for long bush-fallow. This is mostly because the yield in
lowland rice is 1.5 ton/ha, which is higher than 1.2 ton/ha and 1.3 ton/ha, the yield of
short fallow and medium fallow, respectively. However, these yield measurements
are lower than the yield of long-bush fallow which is 1.8 ton/ha. Therefore, the profit
excluding land of lowland rice is Rp 990 thousand, which is also higher than that of
short and medium fallow which are Rp 596 thousand, Rp 678 thousand respectively;
but lower than the profit of the long bush fallow system which is Rp 1.1 million.
Table 6. Private Profitability of Lowland Rice and Shifting Cultivation (Rupiah)
Lowland Shifting Cultivation Items Rice Short Fallow Medium Fallow Long Fallow Total Revenue 1,800,000 1,440,000 1,599,600 2,160,000 Total Cost 809,880 843,600 921,600 1,029,600 Land Price 470,000 450,000 420,000 400,000 Profit, excl. land 990,120 596,400 678,000 1,130,400 Net Profit 520,120 146,400 258,000 730,400 Source: Authors’ calculation
(b) Social Profitability
The concept of social profitability is necessary to compare the profitability of
particular land-use with its competitive situation. As explained in the analytical
framework in Chapter 3, one way of comparing them is by considering the parity
prices at the international markets of input and output and other components affecting
farm-production process. This mechanism was performed primarily under an
assumption that the world market is the most competitive market or where no single
country can significantly affect the market behavior.
Three important factors affecting the calculation of social budgets are the world
price of commodities imported by Indonesia, i.e. rice and the seed; and the world price

33
of urea, which is exported by Indonesia. The data for this calculation were the average
annual data of 1997 from January to July; which were obtained from the World Bank
Commodity Price Data (Pink Sheet of July 1997). After some adjustment with freight
and insurance, exchange rate and handling/processing costs, the social price of rice
used in this calculation is Rp 570/kg; seed is Rp 943/kg and fertilizer is Rp 457/kg.
The social price for labor was set at Rp 5,000/man-day, as this amount could
represent an opportunity cost of labor in the study area of giving up an agricultural
activities to obtain different types of job, either on-farm, off-farm or outside the
agricultural sector. Under similar circumstances with the situation in the private
profitability analysis, the total revenue could be achieved by lowland rice farmers is Rp
836 thousands, which is higher than Rp 684 and Rp 760 thousand, the amount achieved
by short and medium fallow shifting cultivators, respectively. This amount is also
lower than the revenue from long-fallow system of shifting cultivation, which is
slightly above Rp 1 million.
Given that the social cost structure is about the same across four-different of
land use system, the positive profit then could be achieved by the lowland rice and
long bush-fallow under shifting cultivation system. For complete information, please
refer to the following Table 7.
Table 7. Social Profitability of Lowland Rice and Shifting Cultivation (Rupiah)
Lowland Shifting Cultivation Items Rice Short Fallow Medium Fallow Long Fallow Total Revenue 855,588 684,470 760,332 1,026,705 Total Cost 836,533 889,028 973,778 987,278 Land Price 0 0 0 0 Profit, excl. land 19,054 -204,558 -213,446 39,427 Net Profit 19,054 -204,558 -213,446 39,427 Source: Authors’ calculation
(c) Effect of Divergence
34
In the concept of policy analysis matrix, effect of divergence refers to the policy
effects and market failures in all components of production process. In this study,
policy effects of tradable outputs and tradable inputs of each land-use system are
positive, shown by a higher private value than social value. The positive divergence in
tradable output indicate that farmers in Rantau Pandan are receiving more than the
social value for their crop. There is a subsidy on the production process of rice as
much as Rp 944 thousand for lowland rice, which is lower than the subsidy for long-
fallow shifting cultivation amounting at Rp 1.13 million. The amount of subsidy is still
higher than the subsidy for short fallow and medium fallow, respectively of Rp 755
and Rp 839 thousands.
The positive divergence on tradable inputs reflects a taxing effect to farmers for
the use of seed and fertilizer. Farmers in Rantau Pandan pay more than the social
value of inputs; and this divergence should represent an income to the government.
Given that only farmers in the lowland rice land-use system use the fertilizer, the
amount of taxing effect on tradable input in lowland rice is Rp 9,227, which is higher
than that in upland rice shifting cultivation. An amount of Rp 6,422 tax in upland rice
shifting cultivation in all types of bush fallow system is primarily due to the use of
paddy seed. Farmers would have received a better value if the government allocate
the budget for establishing a seed-multiplication center around the study area.
The higher social cost of labor also reflects the low wage rate in agriculture.
Farmers in Rantau Pandan would have received a higher return on labor if they are
working outside agricultural sector. The gender issue of labor does not significantly
affect the labor-cost structure in the field, because there is no gender segregation in
wage rate. Even, the man labor is paid less than the standard if he is performing a
woman-job such as weeding, planting, etc. This high social labor cost also causes the
negative profits in social value of short-fallow and medium fallow upland shifting
cultivation system, reaching as high as Rp 205 and Rp 213 thousands respectively.
Therefore, the patterns of net effects are also the same with the other patterns of
production activities, where lowland rice has a higher value than the short and
medium fallow, but lower than the long-bush fallow system. A complete version of the
tables of Policy Analysis Matrix (PAM) could be in the Table A-6 Appendix. The

35
following Table 8 will present the ratio tables of protection and efficiency for lowland
rice and upland shifting cultivation.
Table 8. Ratios of Protection for Lowland Rice and Shifting Cultivation
Land Use System NPC Output Input EPC DRC Lowland Rice 2.10 1.29 2.14 0.98 Short Bush-Fallow 2.10 1.27 2.13 1.31 Medium Bush-Fallow 2.10 1.27 2.13 1.29 Long Bush-Fallow 2.10 1.27 2.12 0.96 Notes: NPC is Nominal Protection Coefficient EPC is Effective Protection Coefficient DRC is Domestic Resource Cost Coefficient

36
As can be inferred from previous explanation, the extent of commodity and
factor market divergence in the production process of different land-use system could
reveal the nominal protection coefficient (NPC). In other words, the comparison
between private commodity prices and social commodity prices and the impact of
government policy or of market failures that are not corrected by efficient policies. The
NPC values both for output and for input are greater than one, respectively 2.10 and
1.29 for lowland rice; and respectively 2.10 and 1.27 for each different length of fallow
system of upland rice shifting cultivation. These reflect that market price for the
output exceeds the social price, meaning that farmers in Rantau Pandan receive an
implicit output subsidy from policies affecting crop prices. However, farmers also
being taxed by a very high market prices for inputs, primarily fertilizer and seed.
The positive effect of rice subsidy is also shown by the value of Effective
Protection Coefficient (EPC) for all land-use system which are higher than two. As the
EPC indicates the combined effects of policies in the tradable commodities markets the
floor-price policy on rice could affect the decision made by farmers in the study sites. In
this case, the taxing effect of fertilizer and seed could be offset by the output subsidy.
This is interesting because Indonesia that has been known for a very protective policy
on fertilizer subsidy, in fact, does not employ the subsidy anymore.
Finally, the efficient or the comparative advantage of rice production in four
different land-use system is shown by the value of domestic resource cost coefficient
(DRC). Shifting cultivation system under short and medium bush-fallow have a DRC
value 1.31 and 1.29 respectively. This indicates that the domestic resources used to
produce the rice exceed its value added in social prices. It also implies that rice
production activities in these two land-use systems do not represent an efficient use of
the resource endowments available in the study sites. The lowland rice and long
fallow shifting cultivation of upland rice have a DRC of 0.98 and 0.96, respectively. This
implies that both systems have a comparative advantage or an efficient use of resources
in rice production process.
(d) NPV-PAM and Sensitivity Analysis
37
This section is a complementary for the previous analysis on a single-year policy
analysis matrix (PAM) on lowland rice and shifting cultivation system. A net present
value (NPV) PAM was established in order to examine the profitability and efficiency
of particular land-use system within the 25-year cycle. A 20 percent discount rate was
set up -- comparable to market interest rate due to economic uncertainty since July of
1997 -- to calculate the present value of revenue, cost and profit of each land use
system.
About similar to the structure of private and social profitability in a single year
PAM, lowland rice is more profitable than the short and medium fallow, but less
profitable than the long fallow of shifting cultivation. Based on the ratios of efficiency
the in the 25 year cycle, lowland rice system is at the point of domestic comparative
advantage; while the long fallow is relatively efficient in using the available resources.
A detailed result of the NPV-PAM could be seen in Table Appendix B-9.
Sensitivity analysis of some components in the rice production process results in
different policy implication. An increase of exchange rate up to Rp 3,400 for one US
dollar results in different characteristics of each land-use system. All four land-use
show an efficient domestic resource uses, shown by a DRC lower than one. The
increase in exchange rate has sensitively changed all values of NPC for input to be
lower than one, implying that the market price for inputs fall below the prices that
would result in the absence of policy. The subsidy of tradable inputs for farmers also
represents the cost to the government, because of the exchange rate increase.
The impact is also very significant when the exchange rate reach the value of Rp
5,000 for every US dollar. All the components of social value would exceed the those
of private value, implying that distorting polices (and notably uncorrected market
failures) and in appropriate exchange rate exist in the Indonesian economy. For an
open economy model, exchange rate is very sensitive and affecting almost all of the
economic activities in the country.

38
6. CONCLUDING REMARKS: POLICY REFORMS?
The study shows the profitability of a more permanent lowland rice, compared
to a short and medium fallow system of shifting cultivation. A long fallow system is
also profitable and an indication of domestic resource use efficiency, but probably not a
wise choice given the pressure on land have increased over time. Under an open
economy argument, farmers are trying to adopt a more permanent and more intensive
land-use practices in accordance with the increasing pressure and the existence of
market forces and the growing market economy in rural area.
Since the bush-fallow system is hardly found in the lowland Sumatra at present
time, the policy challenge is then how well-prepared the supporting systems such as
transportation infrastructure, irrigation, provision of modern inputs, etc. that could
maintain the efficiency and profitability of lowland rice cultivation system? Or this
preliminary finding could be another assured indication that farmers adopting an
upland shifting cultivation under “normal length” of bush fallow (short and medium)
is a pre-requisite to establish the property rights on land under a tree crop or cash crop
system such as rubber and cassiavera.
Unfortunately, the present study does not focus on the profitability and
efficiency of the smallholder rubber (or jungle rubber) and cassiavera land-use system,
including those of more modern cultivation system of such cash crops. Another
intriguing issue is that shifting cultivation system, continued by cash crops system
could represent the “real” agroforestry system which is economically productive and
ecologically viable for the formerly forest land.

39
References
Angelsen, Arild. 1995. "Shifting Cultivation and "Deforestation": A Study from Sumatra, Indonesia". World Development Vol. 23 (10). pp: 1713-1729. Arifin, Bustanul. 1993. "A Closer Look at Deforestation in Indonesia". Paper presented at "The Fourth Global Warming International Conference", April 17 -21 1993, Chicago USA. Arifin, Bustanul. 1995. The Economics of Land Degradation: A Case Study of Indonesian Upland. Ph.D. Dissertation. The University of Wisconsin- Madison (USA). Arifin, Bustanul. 1996. "Misconception about Environmental Degradation: Lesson from Deforestation in Indonesia". Paper presented at the Sixth International Conference on Society and Natural Resource Management at the Pennsylvania State University, May 18-23, 1996. Boserup, Ester. 1989. "Agricultural Growth and Population Change", in J. Eatwell, M. Milgate, P. Newman (eds.), Economic Development: The New Palgrave. New York: W.W. Norton, 1989, pp: 21-34. Barbier, Edward B., N. Bockstael, J.C. Burgess and I. Strand. 1993. "The Timber Trade and Tropical Deforestation in Indonesia". LEEC Paper DP 93-01. London Environmental Economics Center. Bromley, Daniel W. 1990. "Arresting Renewable Resource Degradation in the Third World: Discussion" in Duane Chapmen (ed.) Arresting Renewable Resource Degradation in the Third World. Environment Working Paper No. 44. Washington, D.C.: The World Bank. Central Bureau of Statistics (CBS). various issues. Statistical Yearbook of Indonesia. Jakarta: Central Bureau of Statistics. Dick, John. 1991. "Forest Land Use, Forest Zonation and Deforestation in Indonesia: A Summary of Existing Information". Background paper to the UNCED Conference, prepared for the Ministry of Population and the Environment, Jakarta, Indonesia. Food and Agricultural Organization (FAO). 1990. Situational and Outlook of the Forestry Sector in Indonesia, Technical Report of Forestry Studies, Food and Agricultural Organization and Ministry of Forestry, Government of Indonesia, Jakarta. Fraser, A.I. 1996. Social, Economic, Political Aspects of Forest Clearance and Land-Use Planning in Indonesia. Unpublished manuscript.

40
Gillis, Malcolm. 1988. "Indonesia: public policies, resource management, and tropical forest", in Repetto, R. and M. Gillis (eds.) Public Polices and the Misuse of Forest Resources. Washington, D.C.: World Resources Institute, pp:10-23. Mikesell, Mike W. 1960. "Deforestation in Northern Morocco", Science 132 (1960), pp:441-445. Monke, Eric and Scott Pearson. 1989. The Policy Analysis Matrix for Agricultural Development. Ithaca: Cornell University Press. Sauer, Carl. 1967. "Man in the Ecology of Tropical America". In: J. Leighly (ed.) Land and Life. Berkeley: University of California-Berkeley, 1967, pp. 43-52. Sunderlin, William and Ida Aju Pradnja Resosudarmo. 1996. "Rates and Causes of Deforestation in Indonesia: Towards a Resolution of the Ambiguities". Bogor: CIFOR Occasional Paper No. Van Noordwijk, et al. 1995. Alternatives to Slash-and-Burn in Indonesia. Summary Report of Phase 1. Bogor: ICRAF Indonesia. Weinstock, J.A. and Satyawan Sunito. 1989. Review of Shifting Cultivation in Indonesia. Jakarta: Directorate General of Forest Utilization, Ministry of Forestry and FAO of the United Nations. World Commission on Environment and Development (WECD). 1987. Our Common Future. Oxford and New York: Oxford University Press. World Bank. 1990. Indonesia: Sustainable Development of Forests, Land and Water. Washington, D.C.: The World Bank. World Bank. 1992. "Development and the Environment", World Development Report 1992, Washington, D.C.: The World Bank. World Bank. 1994. Indonesia. Environment and Development: Challenges for the Future. Washington, D.C.: The World Bank. World Resources Institute. 1991. World Resources 1990-1991. New York: Oxford University Press.
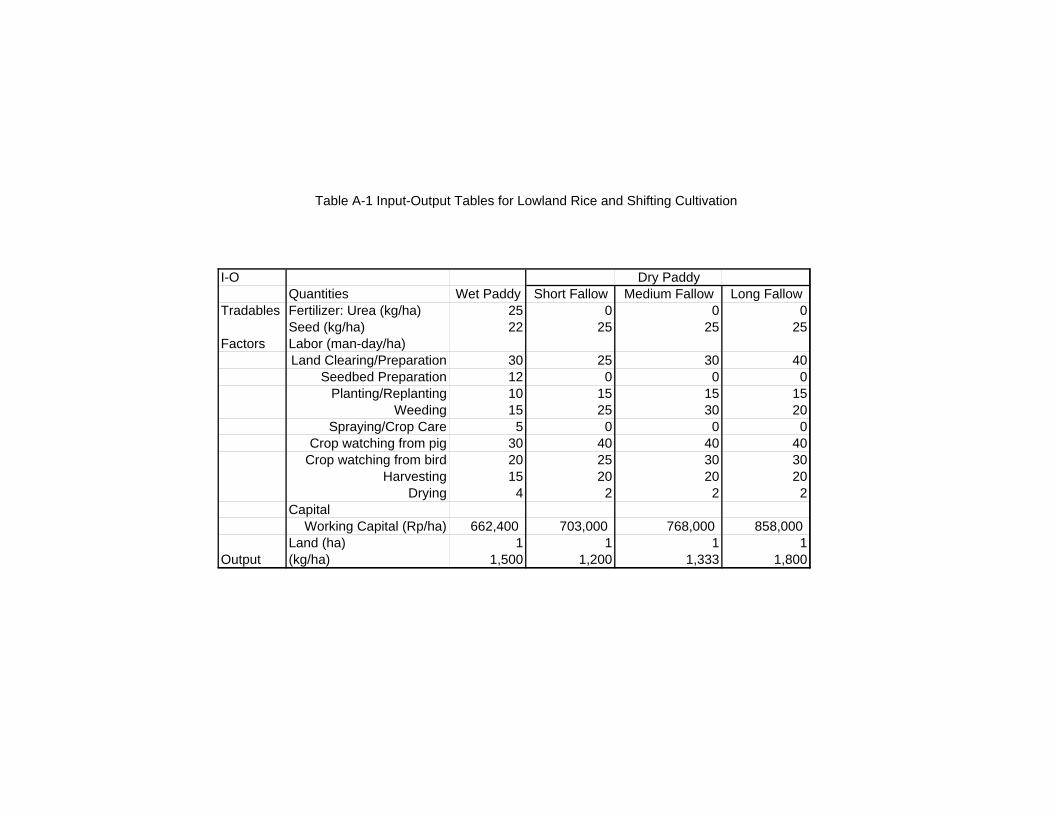
Table A-1 Input-Output Tables for Lowland Rice and Shifting Cultivation
I-O Dry PaddyQuantities Wet Paddy Short Fallow Medium Fallow Long Fallow
Tradables Fertilizer: Urea (kg/ha) 25 0 0 0Seed (kg/ha) 22 25 25 25
Factors Labor (man-day/ha)Land Clearing/Preparation 30 25 30 40
Seedbed Preparation 12 0 0 0Planting/Replanting 10 15 15 15
Weeding 15 25 30 20Spraying/Crop Care 5 0 0 0
Crop watching from pig 30 40 40 40Crop watching from bird 20 25 30 30
Harvesting 15 20 20 20Drying 4 2 2 2
Capital Working Capital (Rp/ha) 662,400 703,000 768,000 858,000
Land (ha) 1 1 1 1Output (kg/ha) 1,500 1,200 1,333 1,800

Table A-2. Private Prices Tables for Lowland Rice and Shifting Cultivation
P-Prices Dry PaddyQuantities Wet Paddy Short Fallow Medium Fallow Long Fallow
Tradables Fertilizer: Urea (kg/ha) 600 600 600 600Seed (kg/ha) 1,200 1,200 1,200 1,200
Factors Labor (man-day/ha)Land Clearing/Preparation 5,000 5,000 5,000 7,000
Seedbed Preparation 5,000 5,000 5,000 5,000Planting/Replanting 4,000 4,000 4,000 4,000
Weeding 4,000 4,000 4,000 4,000Spraying/Crop Care 4,000 4,000 4,000 4,000
Crop watching from pig 5,000 5,000 5,000 5,000Crop watching from bird 4,000 4,000 4,000 4,000
Harvesting 4,000 4,000 4,000 4,000Drying 4,000 4,000 4,000 4,000
Capital Working Capital (Rp/ha) 0 0 0 0
Land (Rp/ha) 470,000 450,000 420,000 400,000Output (Rp/kg) 1,200 1,200 1,200 1,200

Table A-3. Private Budget Tables for Lowland Rice and Shifting Cultivation
P-Budget Dry PaddyQuantities Wet Paddy Short Fallow Medium Fallow Long Fallow
Tradables Fertilizer:Urea (kg/ha) 15,000 0 0 0Seed (kg/ha) 26,400 30,000 30,000 30,000
Factors Labor (man-day/ha)Land-Clearing 150,000 125,000 150,000 280,000Seedbed Prep 60,000 0 0 0
Planting/Replanting 40,000 60,000 60,000 60,000Weeding 60,000 100,000 120,000 80,000
Spraying/Crop Care 20,000 0 0 0Crop watching from pig 150,000 200,000 200,000 200,000
Crop watching from bird 80,000 100,000 120,000 120,000Harvesting 60,000 80,000 80,000 80,000
Drying 16,000 8,000 8,000 8,000Capital
Working Capital (Rp/ha) 132,480 140,600 153,600 171,600Land (Rp/ha) 470,000 450,000 420,000 400,000
Output Total Revenue (Rp/ha) 1,800,000 1,440,000 1,599,600 2,160,000Total Costs (excluding land) (Rp/ha) 809,880 843,600 921,600 1,029,600Profit (excluding land) (Rp/ha) 990,120 596,400 678,000 1,130,400Net Profit (including land) (Rp/ha) 520,120 146,400 258,000 730,400

Table A-4. Social Price Tables for Lowland Rice and Shifting Cultivation
S-Prices Dry PaddyQuantities Wet Paddy Short Fallow Medium Fallow Long Fallow
Tradables Fertilizer: Urea (kg/ha) 457 457 457 457Seed (kg/ha) 943 943 943 943
Factors Labor (man-day/ha)Land Clearing/Preparation 5,000 5,000 5,000 5,000
Seedbed Preparation 5,000 5,000 5,000 5,000Planting/Replanting 5,000 5,000 5,000 5,000
Weeding 5,000 5,000 5,000 5,000Spraying/Crop Care 5,000 5,000 5,000 5,000
Crop watching from pig 5,000 5,000 5,000 5,000Crop watching from bird 5,000 5,000 5,000 5,000
Harvesting 5,000 5,000 5,000 5,000Drying 5,000 5,000 5,000 5,000
Capital Working Capital (Rp/ha) 0 0 0 0
Land (Rp/ha) 0 0 0 0Output (Rp/kg) 570 570 570 570

Table A-5. Social Budget Tables for Lowland Rice and Shifting Cultivation
S-Budget Dry PaddyQuantities Wet Paddy Short Fallow Medium Fallow Long Fallow
Tradables Fertilizer (kg/ha) 11,425 0 0 0Seed (kg/ha) 20,748 23,578 23,578 23,578
Factors Labor (man-day/ha) 0 0 0 0Land-Clearing 150,000 125,000 150,000 200,000Seedbed Prep 60,000 0 0 0
Planting/Replanting 50,000 75,000 75,000 75,000Weeding 75,000 125,000 150,000 100,000
Spraying/Crop Care 25,000 0 0 0Crop watching from pig 150,000 200,000 200,000 200,000
Crop watching from bird 100,000 125,000 150,000 150,000Harvesting 75,000 100,000 100,000 100,000
Drying 20,000 10,000 10,000 10,000Capital
Working Capital (Rp/ha) 99,360 105,450 115,200 128,700Land (Rp/ha) 0 0 0 0
Output Total Revenue (Rp/ha) 855,588 684,470 760,332 1,026,705Total Costs (excluding land) (Rp/ha) 836,533 889,028 973,778 987,278Profit (excluding land) (Rp/ha) 19,054 -204,558 -213,446 39,427Net Profit (including land) (Rp/ha) 19,054 -204,558 -213,446 39,427

Table A-6. Policy Analysis Matrices and Ratios of Protection and Efficiency for Lowland Rice and Shifting Cultivation
Policy Analysis Matrix: Wet PaddyTradables Domestic Resources
Output Inputs Labor Capital ProfitsPrivate 1,800,000 41,400 636,000 132,480 990,120 Social 855,588 32,173 705,000 99,360 19,054 Divergences 944,412 9,227 (69,000) 33,120 971,066
Policy Analysis Matrix: Short Fallow - Dry PaddyTradables Domestic Resources
Output Inputs Labor Capital ProfitsPrivate 1,440,000 30,000 673,000 140,600 596,400 Social 684,470 23,578 760,000 105,450 (204,558) Divergences 755,530 6,422 (87,000) 35,150 800,958
Policy Analysis Matrix: Medium Fallow - Dry PaddyTradables Domestic Resources
Output Inputs Labor Capital ProfitsPrivate 1,599,600 30,000 738,000 153,600 678,000 Social 760,332 23,578 835,000 115,200 (213,446) Divergences 839,268 6,422 (97,000) 38,400 891,446
Policy Analysis Matrix: Long Fallow - Dry PaddyTradables Domestic Resources
Output Inputs Labor Capital ProfitsPrivate 2,160,000 30,000 828,000 171,600 1,130,400 Social 1,026,705 23,578 835,000 128,700 39,427 Divergences 1,133,295 6,422 (7,000) 42,900 1,090,973
Ratios of Protection and Efficiency for Wet Paddy and Shifting CultivationNPC EPC DRC
Outputs InputsWet Paddy - AYV 2.10 1.29 2.14 0.98Short Fallow - Dry Paddy 2.10 1.27 2.13 1.31Medium Fallow - Dry Paddy 2.10 1.27 2.13 1.29Long Fallow - Dry Paddy 2.10 1.27 2.12 0.96

Table A-7. Ratios of Protection and Efficiency for Wet Paddy and Shifting Cultivation
Ratios of Protection and EfficiencyNPC EPC DRC
Outputs InputsWet Paddy - AYV 2.10 1.29 2.14 0.98Short Fallow - Dry Paddy 2.10 1.27 2.13 1.31Medium Fallow - Dry Paddy 2.10 1.27 2.13 1.29Long Fallow - Dry Paddy 2.10 1.27 2.12 0.96

Table A-x. Social Import Parity Price for Rice and Seed and Social Export Parity Price for Urea
Output InputSocial Import Parity Prices Rice PaddySeedF.o.b. ($/ton) 329.8 329.8Freight & Insurance ($/ton) 21 21C.i.f. price at Indonesian port ($/ton) 350.8 350.8Exchange rate (Rp/$) 2400 2400Exchange rate premium (%) 10% 10%Equilibrium exchange rate (Rp/$) 2640 2640C.i.f. in domestic currency (Rp/ton) 926112 926112Weight conversion factor (kg/ton) 1000 1000C.i.f. in dom. currency and weight units (Rp/kg) 926 926Transportation costs (Rp/kg) 5 5Handling costs (Rp/kg) 7 7Value before processing (Rp/kg) 938 938Processing conversion factor (%) 0.64 1Import parity value at wholesale (Rp/kg) 600 938Processing costs (Rp/kg) 25 0Distribution costs to farm (Rp/kg) 5 5Import parity value at farm gate (Rp/kg) 570 943
Social Export Parity Prices UreaC.i.f. ($/ton) 205Freight & Insurance ($/ton) 30F.o.b. price at Indonesian port ($/ton) 175Exchange rate (Rp/$) 2400Exchange rate premium (%) 10%Equilibrium exchange rate (Rp/$) 2640F.o.b. in domestic currency (Rp/ton) 462000Weight conversion factor (kg/ton) 1000F.o.b. in dom. currency and weight units (Rp/kg) 462Transportation costs (Rp/kg) 7Handling costs (Rp/kg) 8Value before processing (Rp/kg) 447Processing conversion factor (%) 1Export parity value at wholesale (Rp/kg) 447Processing costs (Rp/kg) 0Distribution costs to farm (Rp/kg) 10Export parity value at farm gate (Rp/kg) 457

Private Export Parity Prices UreaC.i.f. ($/ton) 280Freight & Insurance ($/ton) 30F.o.b. price at Indonesian port ($/ton) 250Exchange rate (Rp/$) 2400Depreciation 42%Post-Depreciation Exchange rate (Rp/$) 3408F.o.b. in domestic currency (Rp/ton) 852000Weight conversion factor (kg/ton) 1000F.o.b. in dom. currency and weight units (Rp/kg) 852Net Trade Tax (%) 5%Domestic Subsidy (%) 30%Domestic Tax (%) 0%Domestic Price (Rp/kg) 1,065 Transportation costs (Rp/kg) 7Handling costs (Rp/kg) 8Value before processing (Rp/kg) 1050Processing conversion factor (%) 1Export parity value at wholesale (Rp/kg) 1050Processing costs (Rp/kg) 0Distribution costs to farm (Rp/kg) 10Export parity value at farm gate (Rp/kg) 1060

ASSUMPTIONS
Assumptions Table RateMacro-Economic Assumptions
Nominal interest rate (%) 20%Social interest rate (%) 15%Official exchange rate (Rp/$) 2,400 Exchange premium (%) 10%Percent depreciation (%) 42%
Commodity PoliciesRice tariff (%) 0%Urea export tax (%) 5%
Page 1

NPV WET-RICE
P-Budget NPV for Wet RiceYear 0 1 2 3 4 5 6 7 8 9 10 11 12 13 14 15 16 17 18
Discount rate 20.00%Tradables Fertilizer:Urea (kg/ha) 15,000 15,000 15,000 15,000 15,000 15,000 15,000 15,000 15,000 15,000 15,000 15,000 15,000 15,000 15,000 15,000 15,000 15,000 15,000
Seed (kg/ha) 26,400 26,400 26,400 26,400 26,400 26,400 26,400 26,400 26,400 26,400 26,400 26,400 26,400 26,400 26,400 26,400 26,400 26,400 26,400Factors Labor (man-day/ha)
Land-Clearing 150,000 150,000 150,000 150,000 150,000 150,000 150,000 150,000 150,000 150,000 150,000 150,000 150,000 150,000 150,000 150,000 150,000 150,000 150,000Seedbed Prep 60,000 60,000 60,000 60,000 60,000 60,000 60,000 60,000 60,000 60,000 60,000 60,000 60,000 60,000 60,000 60,000 60,000 60,000 60,000
Planting/Replanting 40,000 40,000 40,000 40,000 40,000 40,000 40,000 40,000 40,000 40,000 40,000 40,000 40,000 40,000 40,000 40,000 40,000 40,000 40,000Weeding 60,000 60,000 60,000 60,000 60,000 60,000 60,000 60,000 60,000 60,000 60,000 60,000 60,000 60,000 60,000 60,000 60,000 60,000 60,000
Spraying/Crop Care 20,000 20,000 20,000 20,000 20,000 20,000 20,000 20,000 20,000 20,000 20,000 20,000 20,000 20,000 20,000 20,000 20,000 20,000 20,000Crop watching from pig 150,000 150,000 150,000 150,000 150,000 150,000 150,000 150,000 150,000 150,000 150,000 150,000 150,000 150,000 150,000 150,000 150,000 150,000 150,000
Crop watching from bird 80,000 80,000 80,000 80,000 80,000 80,000 80,000 80,000 80,000 80,000 80,000 80,000 80,000 80,000 80,000 80,000 80,000 80,000 80,000Harvesting 60,000 60,000 60,000 60,000 60,000 60,000 60,000 60,000 60,000 60,000 60,000 60,000 60,000 60,000 60,000 60,000 60,000 60,000 60,000
Drying 16,000 16,000 16,000 16,000 16,000 16,000 16,000 16,000 16,000 16,000 16,000 16,000 16,000 16,000 16,000 16,000 16,000 16,000 16,000Capital
Working Capital (Rp/ha) 132,480 132,480 132,480 132,480 132,480 132,480 132,480 132,480 132,480 132,480 132,480 132,480 132,480 132,480 132,480 132,480 132,480 132,480 132,480Land (Rp/ha) 470,000 470,000 470,000 470,000 470,000 470,000 470,000 470,000 470,000 470,000 470,000 470,000 470,000 470,000 470,000 470,000 470,000 470,000 470,000
Output Output 1,500 1,500 1,500 1,500 1,500 1,500 1,500 1,500 1,500 1,500 1,500 1,500 1,500 1,500 1,500 1,500 1,500 1,500 1,500Total Revenue 1,800,000 1,800,000 1,800,000 1,800,000 1,800,000 1,800,000 1,800,000 1,800,000 1,800,000 1,800,000 1,800,000 1,800,000 1,800,000 1,800,000 1,800,000 1,800,000 1,800,000 1,800,000 1,800,000PV Total Revenue 1,800,000 1,500,000 1,250,000 1,041,667 868,056 723,380 602,816 502,347 418,622 348,852 290,710 242,258 201,882 168,235 140,196 116,830 97,358 81,132 67,610Total PV of Total Revenue 10,705,657
Input Cost 41,400 41,400 41,400 41,400 41,400 41,400 41,400 41,400 41,400 41,400 41,400 41,400 41,400 41,400 41,400 41,400 41,400 41,400 41,400PV Input Cost 41,400 34,500 28,750 23,958 19,965 16,638 13,865 11,554 9,628 8,024 6,686 5,572 4,643 3,869 3,225 2,687 2,239 1,866 1,555Total PV of Input Cost 246,230
Labour Cost 636,000 636,000 636,000 636,000 636,000 636,000 636,000 636,000 636,000 636,000 636,000 636,000 636,000 636,000 636,000 636,000 636,000 636,000 636,000PV Labour Cost 636,000 530,000 441,667 368,056 306,713 255,594 212,995 177,496 147,913 123,261 102,718 85,598 71,332 59,443 49,536 41,280 34,400 28,667 23,889Total PV of Labour Cost 3,782,665
Capital Cost 132,480 132,480 132,480 132,480 132,480 132,480 132,480 132,480 132,480 132,480 132,480 132,480 132,480 132,480 132,480 132,480 132,480 132,480 132,480PV Capital Cost 132,480 110,400 92,000 76,667 63,889 53,241 44,367 36,973 30,811 25,676 21,396 17,830 14,859 12,382 10,318 8,599 7,166 5,971 4,976Total PV of Capital Cost 787,936
Land Cost 470,000 470,000 470,000 470,000 470,000 470,000 470,000 470,000 470,000 470,000 470,000 470,000 470,000 470,000 470,000 470,000 470,000 470,000 470,000PV Land Cost 470,000 391,667 326,389 271,991 226,659 188,882 157,402 131,168 109,307 91,089 75,908 63,256 52,714 43,928 36,607 30,506 25,421 21,184 17,654Total PV of Land Cost 2,795,366
Total Costs (exc. land) 809,880 809,880 809,880 809,880 809,880 809,880 809,880 809,880 809,880 809,880 809,880 809,880 809,880 809,880 809,880 809,880 809,880 809,880 809,880PV Total Costs 809,880 674,900 562,417 468,681 390,567 325,473 271,227 226,023 188,352 156,960 130,800 109,000 90,833 75,695 63,079 52,566 43,805 36,504 30,420Total PV of Total Costs 4,816,832
Page 1

Table B-1. Present Value of Private Budget Tables for Lowland Rice
Private-Budget NPV for Wet RiceYear 0 1 2 3 4 5 6 7 8 9 10 11 12 13 14 15 16 17 18 19 20 21 22 23 24 25
Discount rate 20.00%Tradables Fertilizer:Urea 15,000 15,000 15,000 15,000 15,000 15,000 15,000 15,000 15,000 15,000 15,000 15,000 15,000 15,000 15,000 15,000 15,000 15,000 15,000 15,000 15,000 15,000 15,000 15,000 15,000 15,000
Seed 26,400 26,400 26,400 26,400 26,400 26,400 26,400 26,400 26,400 26,400 26,400 26,400 26,400 26,400 26,400 26,400 26,400 26,400 26,400 26,400 26,400 26,400 26,400 26,400 26,400 26,400Factors Labor
Land-Clearing 150,000 150,000 150,000 150,000 150,000 150,000 150,000 150,000 150,000 150,000 150,000 150,000 150,000 150,000 150,000 150,000 150,000 150,000 150,000 150,000 150,000 150,000 150,000 150,000 150,000 150,000Seedbed Prep 60,000 60,000 60,000 60,000 60,000 60,000 60,000 60,000 60,000 60,000 60,000 60,000 60,000 60,000 60,000 60,000 60,000 60,000 60,000 60,000 60,000 60,000 60,000 60,000 60,000 60,000
Planting/Replanting 40,000 40,000 40,000 40,000 40,000 40,000 40,000 40,000 40,000 40,000 40,000 40,000 40,000 40,000 40,000 40,000 40,000 40,000 40,000 40,000 40,000 40,000 40,000 40,000 40,000 40,000Weeding 60,000 60,000 60,000 60,000 60,000 60,000 60,000 60,000 60,000 60,000 60,000 60,000 60,000 60,000 60,000 60,000 60,000 60,000 60,000 60,000 60,000 60,000 60,000 60,000 60,000 60,000
Spraying/Crop Care 20,000 20,000 20,000 20,000 20,000 20,000 20,000 20,000 20,000 20,000 20,000 20,000 20,000 20,000 20,000 20,000 20,000 20,000 20,000 20,000 20,000 20,000 20,000 20,000 20,000 20,000Crop watching from pig 150,000 150,000 150,000 150,000 150,000 150,000 150,000 150,000 150,000 150,000 150,000 150,000 150,000 150,000 150,000 150,000 150,000 150,000 150,000 150,000 150,000 150,000 150,000 150,000 150,000 150,000
Crop watching from bird 80,000 80,000 80,000 80,000 80,000 80,000 80,000 80,000 80,000 80,000 80,000 80,000 80,000 80,000 80,000 80,000 80,000 80,000 80,000 80,000 80,000 80,000 80,000 80,000 80,000 80,000Harvesting 60,000 60,000 60,000 60,000 60,000 60,000 60,000 60,000 60,000 60,000 60,000 60,000 60,000 60,000 60,000 60,000 60,000 60,000 60,000 60,000 60,000 60,000 60,000 60,000 60,000 60,000
Drying 16,000 16,000 16,000 16,000 16,000 16,000 16,000 16,000 16,000 16,000 16,000 16,000 16,000 16,000 16,000 16,000 16,000 16,000 16,000 16,000 16,000 16,000 16,000 16,000 16,000 16,000Capital
Working Capital (Rp/ha) 132,480 132,480 132,480 132,480 132,480 132,480 132,480 132,480 132,480 132,480 132,480 132,480 132,480 132,480 132,480 132,480 132,480 132,480 132,480 132,480 132,480 132,480 132,480 132,480 132,480 132,480Land (Rp/ha) 470,000 470,000 470,000 470,000 470,000 470,000 470,000 470,000 470,000 470,000 470,000 470,000 470,000 470,000 470,000 470,000 470,000 470,000 470,000 470,000 470,000 470,000 470,000 470,000 470,000 470,000
Output Output (kg/ha) 1,500 1,500 1,500 1,500 1,500 1,500 1,500 1,500 1,500 1,500 1,500 1,500 1,500 1,500 1,500 1,500 1,500 1,500 1,500 1,500 1,500 1,500 1,500 1,500 1,500 1,500Total Revenue 1,800,000 1,800,000 1,800,000 1,800,000 1,800,000 1,800,000 1,800,000 1,800,000 1,800,000 1,800,000 1,800,000 1,800,000 1,800,000 1,800,000 1,800,000 1,800,000 1,800,000 1,800,000 1,800,000 1,800,000 1,800,000 1,800,000 1,800,000 1,800,000 1,800,000 1,800,000PV Total Revenue 1,800,000 1,500,000 1,250,000 1,041,667 868,056 723,380 602,816 502,347 418,622 348,852 290,710 242,258 201,882 168,235 140,196 116,830 97,358 81,132 67,610 56,342 46,951 39,126 32,605 27,171 22,642 18,869Total PV of Total Revenue10,705,657
Input Cost 41,400 41,400 41,400 41,400 41,400 41,400 41,400 41,400 41,400 41,400 41,400 41,400 41,400 41,400 41,400 41,400 41,400 41,400 41,400 41,400 41,400 41,400 41,400 41,400 41,400 41,400PV Input Cost 41,400 34,500 28,750 23,958 19,965 16,638 13,865 11,554 9,628 8,024 6,686 5,572 4,643 3,869 3,225 2,687 2,239 1,866 1,555 1,296 1,080 900 750 625 521 434Total PV of Input Cost 246,230
Labour Cost 636,000 636,000 636,000 636,000 636,000 636,000 636,000 636,000 636,000 636,000 636,000 636,000 636,000 636,000 636,000 636,000 636,000 636,000 636,000 636,000 636,000 636,000 636,000 636,000 636,000 636,000PV Labour Cost 636,000 530,000 441,667 368,056 306,713 255,594 212,995 177,496 147,913 123,261 102,718 85,598 71,332 59,443 49,536 41,280 34,400 28,667 23,889 19,907 16,589 13,825 11,520 9,600 8,000 6,667Total PV of Labour Cost 3,782,665
Capital Cost 132,480 132,480 132,480 132,480 132,480 132,480 132,480 132,480 132,480 132,480 132,480 132,480 132,480 132,480 132,480 132,480 132,480 132,480 132,480 132,480 132,480 132,480 132,480 132,480 132,480 132,480PV Capital Cost 132,480 110,400 92,000 76,667 63,889 53,241 44,367 36,973 30,811 25,676 21,396 17,830 14,859 12,382 10,318 8,599 7,166 5,971 4,976 4,147 3,456 2,880 2,400 2,000 1,666 1,389Total PV of Capital Cost 787,936
Land Cost 470,000 470,000 470,000 470,000 470,000 470,000 470,000 470,000 470,000 470,000 470,000 470,000 470,000 470,000 470,000 470,000 470,000 470,000 470,000 470,000 470,000 470,000 470,000 470,000 470,000 470,000PV Land Cost 470,000 391,667 326,389 271,991 226,659 188,882 157,402 131,168 109,307 91,089 75,908 63,256 52,714 43,928 36,607 30,506 25,421 21,184 17,654 14,711 12,260 10,216 8,514 7,095 5,912 4,927Total PV of Land Cost 2,795,366
Total Costs (exc. land) 809,880 809,880 809,880 809,880 809,880 809,880 809,880 809,880 809,880 809,880 809,880 809,880 809,880 809,880 809,880 809,880 809,880 809,880 809,880 809,880 809,880 809,880 809,880 809,880 809,880 809,880PV Total Costs 809,880 674,900 562,417 468,681 390,567 325,473 271,227 226,023 188,352 156,960 130,800 109,000 90,833 75,695 63,079 52,566 43,805 36,504 30,420 25,350 21,125 17,604 14,670 12,225 10,188 8,490Total PV of Total Costs 4,816,832
Profit (excluding land) 990,120 990,120 990,120 990,120 990,120 990,120 990,120 990,120 990,120 990,120 990,120 990,120 990,120 990,120 990,120 990,120 990,120 990,120 990,120 990,120 990,120 990,120 990,120 990,120 990,120 990,120NPV Profit (exc. land) 990,120 825,100 687,583 572,986 477,488 397,907 331,589 276,324 230,270 191,892 159,910 133,258 111,049 92,540 77,117 64,264 53,554 44,628 37,190 30,992 25,826 21,522 17,935 14,946 12,455 10,379Total NPV of Profit 5,888,825
Net Profit (including land) 520,120 520,120 520,120 520,120 520,120 520,120 520,120 520,120 520,120 520,120 520,120 520,120 520,120 520,120 520,120 520,120 520,120 520,120 520,120 520,120 520,120 520,120 520,120 520,120 520,120 520,120NPV Net Profit (including 520,120 433,433 361,194 300,995 250,829 209,025 174,187 145,156 120,963 100,803 84,002 70,002 58,335 48,612 40,510 33,759 28,132 23,443 19,536 16,280 13,567 11,306 9,421 7,851 6,543 5,452Total NPV of Net Profit 3,093,459

Table B-2. Present Value of Private Budget Tables for Short-Fallow Shifting Cultivation of Upland Rice
Private-Budget NPV for Short-Fallow Dry RiceYear 0 1 2 3 4 5 6 7 8 9 10 11 12 13 14 15 16 17 18 19 20 21 22 23 24 25
Discount rate 20.00%Tradables Fertilizer:Urea 0 0 0 0 0 0 0 0 0 0 0 0 0 0 0 0 0 0 0 0 0 0 0 0 0 0
Seed 30,000 30,000 30,000 30,000 30,000 30,000 30,000 30,000 30,000 30,000 30,000 30,000 30,000 30,000 30,000 30,000 30,000 30,000 30,000 30,000 30,000 30,000 30,000 30,000 30,000 30,000Factors Labor
Land-Clearing 125,000 125,000 125,000 125,000 125,000 125,000 125,000 125,000 125,000 125,000 125,000 125,000 125,000 125,000 125,000 125,000 125,000 125,000 125,000 125,000 125,000 125,000 125,000 125,000 125,000 125,000Seedbed Prep 0 0 0 0 0 0 0 0 0 0 0 0 0 0 0 0 0 0 0 0 0 0 0 0 0 0
Planting/Replanting 60,000 60,000 60,000 60,000 60,000 60,000 60,000 60,000 60,000 60,000 60,000 60,000 60,000 60,000 60,000 60,000 60,000 60,000 60,000 60,000 60,000 60,000 60,000 60,000 60,000 60,000Weeding 100,000 100,000 100,000 100,000 100,000 100,000 100,000 100,000 100,000 100,000 100,000 100,000 100,000 100,000 100,000 100,000 100,000 100,000 100,000 100,000 100,000 100,000 100,000 100,000 100,000 100,000
Spraying/Crop Care 0 0 0 0 0 0 0 0 0 0 0 0 0 0 0 0 0 0 0 0 0 0 0 0 0 0Crop watching from pig 200,000 200,000 200,000 200,000 200,000 200,000 200,000 200,000 200,000 200,000 200,000 200,000 200,000 200,000 200,000 200,000 200,000 200,000 200,000 200,000 200,000 200,000 200,000 200,000 200,000 200,000
Crop watching from bird 100,000 100,000 100,000 100,000 100,000 100,000 100,000 100,000 100,000 100,000 100,000 100,000 100,000 100,000 100,000 100,000 100,000 100,000 100,000 100,000 100,000 100,000 100,000 100,000 100,000 100,000Harvesting 80,000 80,000 80,000 80,000 80,000 80,000 80,000 80,000 80,000 80,000 80,000 80,000 80,000 80,000 80,000 80,000 80,000 80,000 80,000 80,000 80,000 80,000 80,000 80,000 80,000 80,000
Drying 8,000 8,000 8,000 8,000 8,000 8,000 8,000 8,000 8,000 8,000 8,000 8,000 8,000 8,000 8,000 8,000 8,000 8,000 8,000 8,000 8,000 8,000 8,000 8,000 8,000 8,000Capital
Working Capital (Rp/ha) 140,600 140,600 140,600 140,600 140,600 140,600 140,600 140,600 140,600 140,600 140,600 140,600 140,600 140,600 140,600 140,600 140,600 140,600 140,600 140,600 140,600 140,600 140,600 140,600 140,600 140,600Land (Rp/ha) 450,000 450,000 450,000 450,000 450,000 450,000 450,000 450,000 450,000 450,000 450,000 450,000 450,000 450,000 450,000 450,000 450,000 450,000 450,000 450,000 450,000 450,000 450,000 450,000 450,000 450,000
Output Output (kg/ha) 1,200 1,200 1,200 1,200 1,200 1,200 1,200 1,200 1,200 1,200 1,200 1,200 1,200 1,200 1,200 1,200 1,200 1,200 1,200 1,200 1,200 1,200 1,200 1,200 1,200 1,200Total Revenue 1,440,000 1,440,000 1,440,000 1,440,000 1,440,000 1,440,000 1,440,000 1,440,000 1,440,000 1,440,000 1,440,000 1,440,000 1,440,000 1,440,000 1,440,000 1,440,000 1,440,000 1,440,000 1,440,000 1,440,000 1,440,000 1,440,000 1,440,000 1,440,000 1,440,000 1,440,000PV Total Revenue 1,440,000 1,200,000 1,000,000 833,333 694,444 578,704 482,253 401,878 334,898 279,082 232,568 193,807 161,506 134,588 112,157 93,464 77,887 64,905 54,088 45,073 37,561 31,301 26,084 21,737 18,114 15,095Total PV of Total Revenue 14,324,525
Input Cost 30,000 30,000 30,000 30,000 30,000 30,000 30,000 30,000 30,000 30,000 30,000 30,000 30,000 30,000 30,000 30,000 30,000 30,000 30,000 30,000 30,000 30,000 30,000 30,000 30,000 30,000PV Input Cost 30,000 25,000 20,833 17,361 14,468 12,056 10,047 8,372 6,977 5,814 4,845 4,038 3,365 2,804 2,337 1,947 1,623 1,352 1,127 939 783 652 543 453 377 314Total PV of Input Cost 298,428
Labour Cost 673,000 673,000 673,000 673,000 673,000 673,000 673,000 673,000 673,000 673,000 673,000 673,000 673,000 673,000 673,000 673,000 673,000 673,000 673,000 673,000 673,000 673,000 673,000 673,000 673,000 673,000PV Labour Cost 673,000 560,833 467,361 389,468 324,556 270,464 225,386 187,822 156,518 130,432 108,693 90,578 75,481 62,901 52,418 43,681 36,401 30,334 25,279 21,065 17,555 14,629 12,191 10,159 8,466 7,055Total PV of Labour Cost 6,694,726
Capital Cost 140,600 140,600 140,600 140,600 140,600 140,600 140,600 140,600 140,600 140,600 140,600 140,600 140,600 140,600 140,600 140,600 140,600 140,600 140,600 140,600 140,600 140,600 140,600 140,600 140,600 140,600PV Capital Cost 140,600 117,167 97,639 81,366 67,805 56,504 47,087 39,239 32,699 27,249 22,708 18,923 15,769 13,141 10,951 9,126 7,605 6,337 5,281 4,401 3,667 3,056 2,547 2,122 1,769 1,474Total PV of Capital Cost 1,398,631
Land Cost 450,000 450,000 450,000 450,000 450,000 450,000 450,000 450,000 450,000 450,000 450,000 450,000 450,000 450,000 450,000 450,000 450,000 450,000 450,000 450,000 450,000 450,000 450,000 450,000 450,000 450,000PV Land Cost 450,000 375,000 312,500 260,417 217,014 180,845 150,704 125,587 104,656 87,213 72,678 60,565 50,470 42,059 35,049 29,207 24,340 20,283 16,902 14,085 11,738 9,782 8,151 6,793 5,661 4,717Total PV of Land Cost 4,476,414
Total Costs (exc. land) 843,600 843,600 843,600 843,600 843,600 843,600 843,600 843,600 843,600 843,600 843,600 843,600 843,600 843,600 843,600 843,600 843,600 843,600 843,600 843,600 843,600 843,600 843,600 843,600 843,600 843,600PV Total Costs 843,600 703,000 585,833 488,194 406,829 339,024 282,520 235,433 196,194 163,495 136,246 113,538 94,615 78,846 65,705 54,754 45,629 38,024 31,686 26,405 22,005 18,337 15,281 12,734 10,612 8,843Total PV of Total Costs 8,391,784
Profit (excluding land) 596,400 596,400 596,400 596,400 596,400 596,400 596,400 596,400 596,400 596,400 596,400 596,400 596,400 596,400 596,400 596,400 596,400 596,400 596,400 596,400 596,400 596,400 596,400 596,400 596,400 596,400NPV Profit (exc. land) 596,400 497,000 414,167 345,139 287,616 239,680 199,733 166,444 138,704 115,586 96,322 80,268 66,890 55,742 46,452 38,710 32,258 26,882 22,401 18,668 15,557 12,964 10,803 9,003 7,502 6,252Total NPV of Profit 5,932,741
Net Profit (including land) 146,400 146,400 146,400 146,400 146,400 146,400 146,400 146,400 146,400 146,400 146,400 146,400 146,400 146,400 146,400 146,400 146,400 146,400 146,400 146,400 146,400 146,400 146,400 146,400 146,400 146,400NPV Net Profit (including land) 146,400 122,000 101,667 84,722 70,602 58,835 49,029 40,858 34,048 28,373 23,644 19,704 16,420 13,683 11,403 9,502 7,918 6,599 5,499 4,582 3,819 3,182 2,652 2,210 1,842 1,535Total NPV of Net Profit 1,456,327

Table B-3. Present Value of Private Budget Tables for Medium-Fallow of Shifting Cultivation of Upland Rice
Private Budget NPV for Medium-Fallow Dry RiceYear 0 1 2 3 4 5 6 7 8 9 10 11 12 13 14 15 16 17 18 19 20 21 22 23 24 25
Discount rate 20.00%Tradables Fertilizer:Urea (kg/ha) 0 0 0 0 0 0 0 0 0 0 0 0 0 0 0 0 0 0 0 0 0 0 0 0 0 0
Seed (kg/ha) 30,000 30,000 30,000 30,000 30,000 30,000 30,000 30,000 30,000 30,000 30,000 30,000 30,000 30,000 30,000 30,000 30,000 30,000 30,000 30,000 30,000 30,000 30,000 30,000 30,000 30,000Factors Labor (man-day/ha)
Land-Clearing 150,000 150,000 150,000 150,000 150,000 150,000 150,000 150,000 150,000 150,000 150,000 150,000 150,000 150,000 150,000 150,000 150,000 150,000 150,000 150,000 150,000 150,000 150,000 150,000 150,000 150,000Seedbed Prep 0 0 0 0 0 0 0 0 0 0 0 0 0 0 0 0 0 0 0 0 0 0 0 0 0 0
Planting/Replanting 60,000 60,000 60,000 60,000 60,000 60,000 60,000 60,000 60,000 60,000 60,000 60,000 60,000 60,000 60,000 60,000 60,000 60,000 60,000 60,000 60,000 60,000 60,000 60,000 60,000 60,000Weeding 120,000 120,000 120,000 120,000 120,000 120,000 120,000 120,000 120,000 120,000 120,000 120,000 120,000 120,000 120,000 120,000 120,000 120,000 120,000 120,000 120,000 120,000 120,000 120,000 120,000 120,000
Crop Care 0 0 0 0 0 0 0 0 0 0 0 0 0 0 0 0 0 0 0 0 0 0 0 0 0 0Crop watching from pig 200,000 200,000 200,000 200,000 200,000 200,000 200,000 200,000 200,000 200,000 200,000 200,000 200,000 200,000 200,000 200,000 200,000 200,000 200,000 200,000 200,000 200,000 200,000 200,000 200,000 200,000
Crop watching from bird 120,000 120,000 120,000 120,000 120,000 120,000 120,000 120,000 120,000 120,000 120,000 120,000 120,000 120,000 120,000 120,000 120,000 120,000 120,000 120,000 120,000 120,000 120,000 120,000 120,000 120,000Harvesting 80,000 80,000 80,000 80,000 80,000 80,000 80,000 80,000 80,000 80,000 80,000 80,000 80,000 80,000 80,000 80,000 80,000 80,000 80,000 80,000 80,000 80,000 80,000 80,000 80,000 80,000
Drying 8,000 8,000 8,000 8,000 8,000 8,000 8,000 8,000 8,000 8,000 8,000 8,000 8,000 8,000 8,000 8,000 8,000 8,000 8,000 8,000 8,000 8,000 8,000 8,000 8,000 8,000Capital
Working Capital (Rp/ha) 153,600 153,600 153,600 153,600 153,600 153,600 153,600 153,600 153,600 153,600 153,600 153,600 153,600 153,600 153,600 153,600 153,600 153,600 153,600 153,600 153,600 153,600 153,600 153,600 153,600 153,600Land (Rp/ha) 420,000 420,000 420,000 420,000 420,000 420,000 420,000 420,000 420,000 420,000 420,000 420,000 420,000 420,000 420,000 420,000 420,000 420,000 420,000 420,000 420,000 420,000 420,000 420,000 420,000 420,000
Output Output 1,333 1,333 1,333 1,333 1,333 1,333 1,333 1,333 1,333 1,333 1,333 1,333 1,333 1,333 1,333 1,333 1,333 1,333 1,333 1,333 1,333 1,333 1,333 1,333 1,333 1,333Total Revenue 1,599,600 1,599,600 1,599,600 1,599,600 1,599,600 1,599,600 1,599,600 1,599,600 1,599,600 1,599,600 1,599,600 1,599,600 1,599,600 1,599,600 1,599,600 1,599,600 1,599,600 1,599,600 1,599,600 1,599,600 1,599,600 1,599,600 1,599,600 1,599,600 1,599,600 1,599,600PV Total Revenue 1,599,600 1,333,000 1,110,833 925,694 771,412 642,843 535,703 446,419 372,016 310,013 258,344 215,287 179,406 149,505 124,587 103,823 86,519 72,099 60,083 50,069 41,724 34,770 28,975 24,146 20,122 16,768Total PV of Total Revenue 15,912,160
Input Cost 30,000 30,000 30,000 30,000 30,000 30,000 30,000 30,000 30,000 30,000 30,000 30,000 30,000 30,000 30,000 30,000 30,000 30,000 30,000 30,000 30,000 30,000 30,000 30,000 30,000 30,000PV Input Cost 30,000 25,000 20,833 17,361 14,468 12,056 10,047 8,372 6,977 5,814 4,845 4,038 3,365 2,804 2,337 1,947 1,623 1,352 1,127 939 783 652 543 453 377 314Total PV of Input Cost 298,428
Labor Cost 738,000 738,000 738,000 738,000 738,000 738,000 738,000 738,000 738,000 738,000 738,000 738,000 738,000 738,000 738,000 738,000 738,000 738,000 738,000 738,000 738,000 738,000 738,000 738,000 738,000 738,000PV Labor Cost 738,000 615,000 512,500 427,083 355,903 296,586 247,155 205,962 171,635 143,029 119,191 99,326 82,772 68,976 57,480 47,900 39,917 33,264 27,720 23,100 19,250 16,042 13,368 11,140 9,283 7,736Total PV of Labor Cost 7,341,319
Capital Cost 153,600 153,600 153,600 153,600 153,600 153,600 153,600 153,600 153,600 153,600 153,600 153,600 153,600 153,600 153,600 153,600 153,600 153,600 153,600 153,600 153,600 153,600 153,600 153,600 153,600 153,600PV Capital Cost 153,600 128,000 106,667 88,889 74,074 61,728 51,440 42,867 35,722 29,769 24,807 20,673 17,227 14,356 11,963 9,969 8,308 6,923 5,769 4,808 4,007 3,339 2,782 2,319 1,932 1,610Total PV of Capital Cost 1,527,949
Land Cost 420,000 420,000 420,000 420,000 420,000 420,000 420,000 420,000 420,000 420,000 420,000 420,000 420,000 420,000 420,000 420,000 420,000 420,000 420,000 420,000 420,000 420,000 420,000 420,000 420,000 420,000PV Land Cost 420,000 350,000 291,667 243,056 202,546 168,789 140,657 117,214 97,679 81,399 67,832 56,527 47,106 39,255 32,712 27,260 22,717 18,931 15,776 13,146 10,955 9,129 7,608 6,340 5,283 4,403Total PV of Land Cost 4,177,987
Total Costs (exc. land) 921,600 921,600 921,600 921,600 921,600 921,600 921,600 921,600 921,600 921,600 921,600 921,600 921,600 921,600 921,600 921,600 921,600 921,600 921,600 921,600 921,600 921,600 921,600 921,600 921,600 921,600PV Total Costs 921,600 768,000 640,000 533,333 444,444 370,370 308,642 257,202 214,335 178,612 148,844 124,036 103,364 86,136 71,780 59,817 49,847 41,540 34,616 28,847 24,039 20,033 16,694 13,911 11,593 9,661Total PV of Total Costs 9,167,696
Profit (excluding land) 678,000 678,000 678,000 678,000 678,000 678,000 678,000 678,000 678,000 678,000 678,000 678,000 678,000 678,000 678,000 678,000 678,000 678,000 678,000 678,000 678,000 678,000 678,000 678,000 678,000 678,000NPV Profit (exc. land) 678,000 565,000 470,833 392,361 326,968 272,473 227,061 189,217 157,681 131,401 109,501 91,251 76,042 63,369 52,807 44,006 36,672 30,560 25,466 21,222 17,685 14,737 12,281 10,234 8,529 7,107Total NPV of Profit 6,744,464
Net Profit (including land) 258,000 258,000 258,000 258,000 258,000 258,000 258,000 258,000 258,000 258,000 258,000 258,000 258,000 258,000 258,000 258,000 258,000 258,000 258,000 258,000 258,000 258,000 258,000 258,000 258,000 258,000NPV Net Profit (including land) 258,000 215,000 179,167 149,306 124,421 103,684 86,404 72,003 60,003 50,002 41,668 34,724 28,936 24,114 20,095 16,746 13,955 11,629 9,691 8,076 6,730 5,608 4,673 3,894 3,245 2,705Total NPV of Net Profit 2,566,477
Page 1
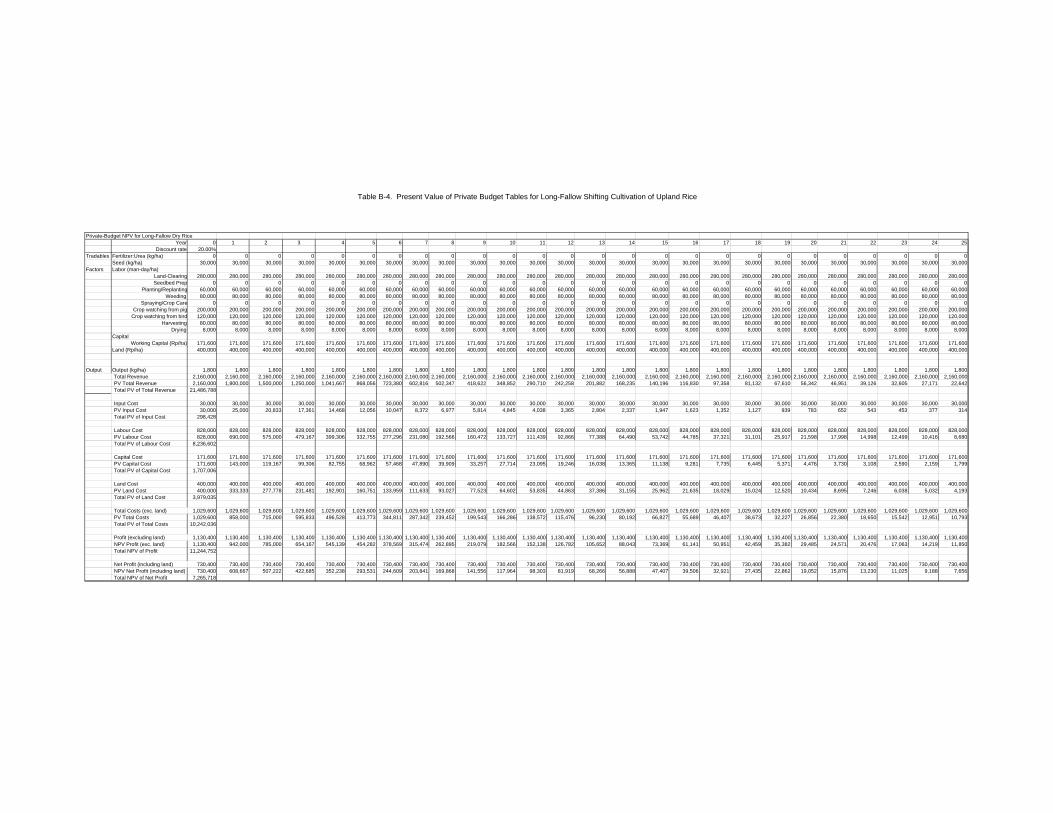
Table B-4. Present Value of Private Budget Tables for Long-Fallow Shifting Cultivation of Upland Rice
Private-Budget NPV for Long-Fallow Dry RiceYear 0 1 2 3 4 5 6 7 8 9 10 11 12 13 14 15 16 17 18 19 20 21 22 23 24 25
Discount rate 20.00%Tradables Fertilizer:Urea (kg/ha) 0 0 0 0 0 0 0 0 0 0 0 0 0 0 0 0 0 0 0 0 0 0 0 0 0 0
Seed (kg/ha) 30,000 30,000 30,000 30,000 30,000 30,000 30,000 30,000 30,000 30,000 30,000 30,000 30,000 30,000 30,000 30,000 30,000 30,000 30,000 30,000 30,000 30,000 30,000 30,000 30,000 30,000Factors Labor (man-day/ha)
Land-Clearing 280,000 280,000 280,000 280,000 280,000 280,000 280,000 280,000 280,000 280,000 280,000 280,000 280,000 280,000 280,000 280,000 280,000 280,000 280,000 280,000 280,000 280,000 280,000 280,000 280,000 280,000Seedbed Prep 0 0 0 0 0 0 0 0 0 0 0 0 0 0 0 0 0 0 0 0 0 0 0 0 0 0
Planting/Replanting 60,000 60,000 60,000 60,000 60,000 60,000 60,000 60,000 60,000 60,000 60,000 60,000 60,000 60,000 60,000 60,000 60,000 60,000 60,000 60,000 60,000 60,000 60,000 60,000 60,000 60,000Weeding 80,000 80,000 80,000 80,000 80,000 80,000 80,000 80,000 80,000 80,000 80,000 80,000 80,000 80,000 80,000 80,000 80,000 80,000 80,000 80,000 80,000 80,000 80,000 80,000 80,000 80,000
Spraying/Crop Care 0 0 0 0 0 0 0 0 0 0 0 0 0 0 0 0 0 0 0 0 0 0 0 0 0 0Crop watching from pig 200,000 200,000 200,000 200,000 200,000 200,000 200,000 200,000 200,000 200,000 200,000 200,000 200,000 200,000 200,000 200,000 200,000 200,000 200,000 200,000 200,000 200,000 200,000 200,000 200,000 200,000
Crop watching from bird 120,000 120,000 120,000 120,000 120,000 120,000 120,000 120,000 120,000 120,000 120,000 120,000 120,000 120,000 120,000 120,000 120,000 120,000 120,000 120,000 120,000 120,000 120,000 120,000 120,000 120,000Harvesting 80,000 80,000 80,000 80,000 80,000 80,000 80,000 80,000 80,000 80,000 80,000 80,000 80,000 80,000 80,000 80,000 80,000 80,000 80,000 80,000 80,000 80,000 80,000 80,000 80,000 80,000
Drying 8,000 8,000 8,000 8,000 8,000 8,000 8,000 8,000 8,000 8,000 8,000 8,000 8,000 8,000 8,000 8,000 8,000 8,000 8,000 8,000 8,000 8,000 8,000 8,000 8,000 8,000Capital
Working Capital (Rp/ha) 171,600 171,600 171,600 171,600 171,600 171,600 171,600 171,600 171,600 171,600 171,600 171,600 171,600 171,600 171,600 171,600 171,600 171,600 171,600 171,600 171,600 171,600 171,600 171,600 171,600 171,600Land (Rp/ha) 400,000 400,000 400,000 400,000 400,000 400,000 400,000 400,000 400,000 400,000 400,000 400,000 400,000 400,000 400,000 400,000 400,000 400,000 400,000 400,000 400,000 400,000 400,000 400,000 400,000 400,000
Output Output (kg/ha) 1,800 1,800 1,800 1,800 1,800 1,800 1,800 1,800 1,800 1,800 1,800 1,800 1,800 1,800 1,800 1,800 1,800 1,800 1,800 1,800 1,800 1,800 1,800 1,800 1,800 1,800Total Revenue 2,160,000 2,160,000 2,160,000 2,160,000 2,160,000 2,160,000 2,160,000 2,160,000 2,160,000 2,160,000 2,160,000 2,160,000 2,160,000 2,160,000 2,160,000 2,160,000 2,160,000 2,160,000 2,160,000 2,160,000 2,160,000 2,160,000 2,160,000 2,160,000 2,160,000 2,160,000PV Total Revenue 2,160,000 1,800,000 1,500,000 1,250,000 1,041,667 868,056 723,380 602,816 502,347 418,622 348,852 290,710 242,258 201,882 168,235 140,196 116,830 97,358 81,132 67,610 56,342 46,951 39,126 32,605 27,171 22,642Total PV of Total Revenue 21,486,788
Input Cost 30,000 30,000 30,000 30,000 30,000 30,000 30,000 30,000 30,000 30,000 30,000 30,000 30,000 30,000 30,000 30,000 30,000 30,000 30,000 30,000 30,000 30,000 30,000 30,000 30,000 30,000PV Input Cost 30,000 25,000 20,833 17,361 14,468 12,056 10,047 8,372 6,977 5,814 4,845 4,038 3,365 2,804 2,337 1,947 1,623 1,352 1,127 939 783 652 543 453 377 314Total PV of Input Cost 298,428
Labour Cost 828,000 828,000 828,000 828,000 828,000 828,000 828,000 828,000 828,000 828,000 828,000 828,000 828,000 828,000 828,000 828,000 828,000 828,000 828,000 828,000 828,000 828,000 828,000 828,000 828,000 828,000PV Labour Cost 828,000 690,000 575,000 479,167 399,306 332,755 277,296 231,080 192,566 160,472 133,727 111,439 92,866 77,388 64,490 53,742 44,785 37,321 31,101 25,917 21,598 17,998 14,998 12,499 10,416 8,680Total PV of Labour Cost 8,236,602
Capital Cost 171,600 171,600 171,600 171,600 171,600 171,600 171,600 171,600 171,600 171,600 171,600 171,600 171,600 171,600 171,600 171,600 171,600 171,600 171,600 171,600 171,600 171,600 171,600 171,600 171,600 171,600PV Capital Cost 171,600 143,000 119,167 99,306 82,755 68,962 57,468 47,890 39,909 33,257 27,714 23,095 19,246 16,038 13,365 11,138 9,281 7,735 6,445 5,371 4,476 3,730 3,108 2,590 2,159 1,799Total PV of Capital Cost 1,707,006
Land Cost 400,000 400,000 400,000 400,000 400,000 400,000 400,000 400,000 400,000 400,000 400,000 400,000 400,000 400,000 400,000 400,000 400,000 400,000 400,000 400,000 400,000 400,000 400,000 400,000 400,000 400,000PV Land Cost 400,000 333,333 277,778 231,481 192,901 160,751 133,959 111,633 93,027 77,523 64,602 53,835 44,863 37,386 31,155 25,962 21,635 18,029 15,024 12,520 10,434 8,695 7,246 6,038 5,032 4,193Total PV of Land Cost 3,979,035
Total Costs (exc. land) 1,029,600 1,029,600 1,029,600 1,029,600 1,029,600 1,029,600 1,029,600 1,029,600 1,029,600 1,029,600 1,029,600 1,029,600 1,029,600 1,029,600 1,029,600 1,029,600 1,029,600 1,029,600 1,029,600 1,029,600 1,029,600 1,029,600 1,029,600 1,029,600 1,029,600 1,029,600PV Total Costs 1,029,600 858,000 715,000 595,833 496,528 413,773 344,811 287,342 239,452 199,543 166,286 138,572 115,476 96,230 80,192 66,827 55,689 46,407 38,673 32,227 26,856 22,380 18,650 15,542 12,951 10,793Total PV of Total Costs 10,242,036
Profit (excluding land) 1,130,400 1,130,400 1,130,400 1,130,400 1,130,400 1,130,400 1,130,400 1,130,400 1,130,400 1,130,400 1,130,400 1,130,400 1,130,400 1,130,400 1,130,400 1,130,400 1,130,400 1,130,400 1,130,400 1,130,400 1,130,400 1,130,400 1,130,400 1,130,400 1,130,400 1,130,400NPV Profit (exc. land) 1,130,400 942,000 785,000 654,167 545,139 454,282 378,569 315,474 262,895 219,079 182,566 152,138 126,782 105,652 88,043 73,369 61,141 50,951 42,459 35,382 29,485 24,571 20,476 17,063 14,219 11,850Total NPV of Profit 11,244,752
Net Profit (including land) 730,400 730,400 730,400 730,400 730,400 730,400 730,400 730,400 730,400 730,400 730,400 730,400 730,400 730,400 730,400 730,400 730,400 730,400 730,400 730,400 730,400 730,400 730,400 730,400 730,400 730,400NPV Net Profit (including land) 730,400 608,667 507,222 422,685 352,238 293,531 244,609 203,841 169,868 141,556 117,964 98,303 81,919 68,266 56,888 47,407 39,506 32,921 27,435 22,862 19,052 15,876 13,230 11,025 9,188 7,656Total NPV of Net Profit 7,265,718
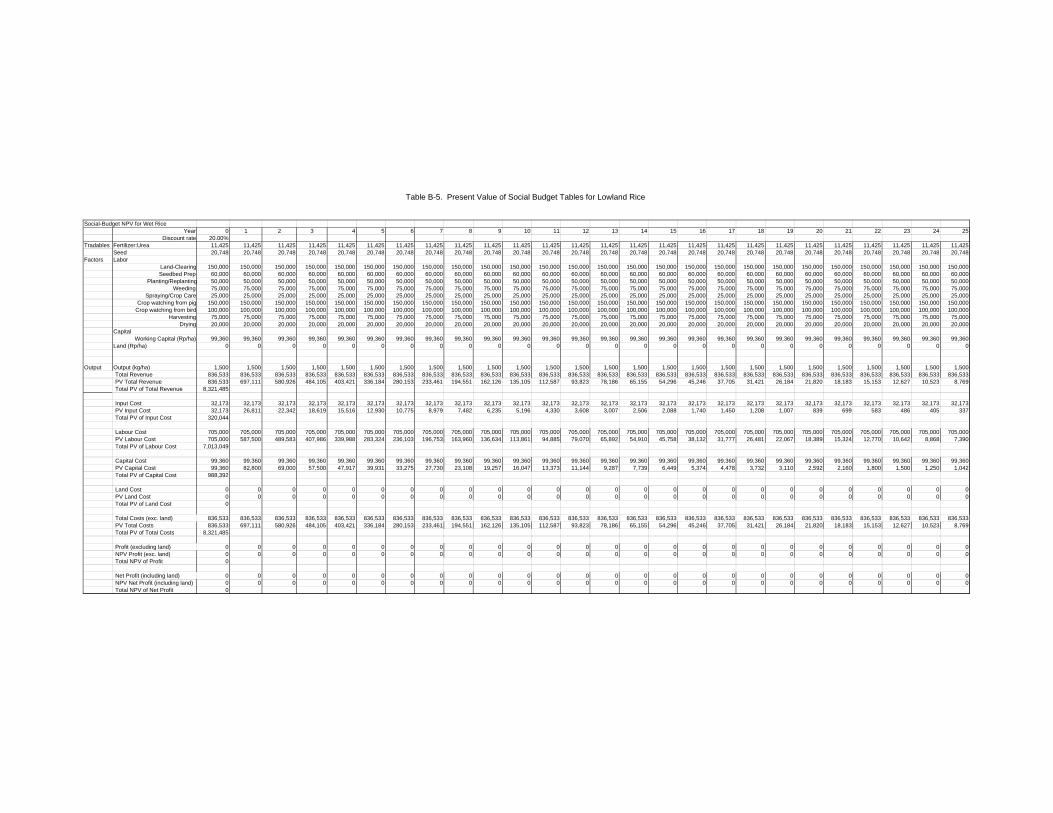
Table B-5. Present Value of Social Budget Tables for Lowland Rice
Social-Budget NPV for Wet RiceYear 0 1 2 3 4 5 6 7 8 9 10 11 12 13 14 15 16 17 18 19 20 21 22 23 24 25
Discount rate 20.00%Tradables Fertilizer:Urea 11,425 11,425 11,425 11,425 11,425 11,425 11,425 11,425 11,425 11,425 11,425 11,425 11,425 11,425 11,425 11,425 11,425 11,425 11,425 11,425 11,425 11,425 11,425 11,425 11,425 11,425
Seed 20,748 20,748 20,748 20,748 20,748 20,748 20,748 20,748 20,748 20,748 20,748 20,748 20,748 20,748 20,748 20,748 20,748 20,748 20,748 20,748 20,748 20,748 20,748 20,748 20,748 20,748Factors Labor
Land-Clearing 150,000 150,000 150,000 150,000 150,000 150,000 150,000 150,000 150,000 150,000 150,000 150,000 150,000 150,000 150,000 150,000 150,000 150,000 150,000 150,000 150,000 150,000 150,000 150,000 150,000 150,000Seedbed Prep 60,000 60,000 60,000 60,000 60,000 60,000 60,000 60,000 60,000 60,000 60,000 60,000 60,000 60,000 60,000 60,000 60,000 60,000 60,000 60,000 60,000 60,000 60,000 60,000 60,000 60,000
Planting/Replanting 50,000 50,000 50,000 50,000 50,000 50,000 50,000 50,000 50,000 50,000 50,000 50,000 50,000 50,000 50,000 50,000 50,000 50,000 50,000 50,000 50,000 50,000 50,000 50,000 50,000 50,000Weeding 75,000 75,000 75,000 75,000 75,000 75,000 75,000 75,000 75,000 75,000 75,000 75,000 75,000 75,000 75,000 75,000 75,000 75,000 75,000 75,000 75,000 75,000 75,000 75,000 75,000 75,000
Spraying/Crop Care 25,000 25,000 25,000 25,000 25,000 25,000 25,000 25,000 25,000 25,000 25,000 25,000 25,000 25,000 25,000 25,000 25,000 25,000 25,000 25,000 25,000 25,000 25,000 25,000 25,000 25,000Crop watching from pig 150,000 150,000 150,000 150,000 150,000 150,000 150,000 150,000 150,000 150,000 150,000 150,000 150,000 150,000 150,000 150,000 150,000 150,000 150,000 150,000 150,000 150,000 150,000 150,000 150,000 150,000
Crop watching from bird 100,000 100,000 100,000 100,000 100,000 100,000 100,000 100,000 100,000 100,000 100,000 100,000 100,000 100,000 100,000 100,000 100,000 100,000 100,000 100,000 100,000 100,000 100,000 100,000 100,000 100,000Harvesting 75,000 75,000 75,000 75,000 75,000 75,000 75,000 75,000 75,000 75,000 75,000 75,000 75,000 75,000 75,000 75,000 75,000 75,000 75,000 75,000 75,000 75,000 75,000 75,000 75,000 75,000
Drying 20,000 20,000 20,000 20,000 20,000 20,000 20,000 20,000 20,000 20,000 20,000 20,000 20,000 20,000 20,000 20,000 20,000 20,000 20,000 20,000 20,000 20,000 20,000 20,000 20,000 20,000Capital
Working Capital (Rp/ha) 99,360 99,360 99,360 99,360 99,360 99,360 99,360 99,360 99,360 99,360 99,360 99,360 99,360 99,360 99,360 99,360 99,360 99,360 99,360 99,360 99,360 99,360 99,360 99,360 99,360 99,360Land (Rp/ha) 0 0 0 0 0 0 0 0 0 0 0 0 0 0 0 0 0 0 0 0 0 0 0 0 0 0
Output Output (kg/ha) 1,500 1,500 1,500 1,500 1,500 1,500 1,500 1,500 1,500 1,500 1,500 1,500 1,500 1,500 1,500 1,500 1,500 1,500 1,500 1,500 1,500 1,500 1,500 1,500 1,500 1,500Total Revenue 836,533 836,533 836,533 836,533 836,533 836,533 836,533 836,533 836,533 836,533 836,533 836,533 836,533 836,533 836,533 836,533 836,533 836,533 836,533 836,533 836,533 836,533 836,533 836,533 836,533 836,533PV Total Revenue 836,533 697,111 580,926 484,105 403,421 336,184 280,153 233,461 194,551 162,126 135,105 112,587 93,823 78,186 65,155 54,296 45,246 37,705 31,421 26,184 21,820 18,183 15,153 12,627 10,523 8,769Total PV of Total Revenue 8,321,485
Input Cost 32,173 32,173 32,173 32,173 32,173 32,173 32,173 32,173 32,173 32,173 32,173 32,173 32,173 32,173 32,173 32,173 32,173 32,173 32,173 32,173 32,173 32,173 32,173 32,173 32,173 32,173PV Input Cost 32,173 26,811 22,342 18,619 15,516 12,930 10,775 8,979 7,482 6,235 5,196 4,330 3,608 3,007 2,506 2,088 1,740 1,450 1,208 1,007 839 699 583 486 405 337Total PV of Input Cost 320,044
Labour Cost 705,000 705,000 705,000 705,000 705,000 705,000 705,000 705,000 705,000 705,000 705,000 705,000 705,000 705,000 705,000 705,000 705,000 705,000 705,000 705,000 705,000 705,000 705,000 705,000 705,000 705,000PV Labour Cost 705,000 587,500 489,583 407,986 339,988 283,324 236,103 196,753 163,960 136,634 113,861 94,885 79,070 65,892 54,910 45,758 38,132 31,777 26,481 22,067 18,389 15,324 12,770 10,642 8,868 7,390Total PV of Labour Cost 7,013,049
Capital Cost 99,360 99,360 99,360 99,360 99,360 99,360 99,360 99,360 99,360 99,360 99,360 99,360 99,360 99,360 99,360 99,360 99,360 99,360 99,360 99,360 99,360 99,360 99,360 99,360 99,360 99,360PV Capital Cost 99,360 82,800 69,000 57,500 47,917 39,931 33,275 27,730 23,108 19,257 16,047 13,373 11,144 9,287 7,739 6,449 5,374 4,478 3,732 3,110 2,592 2,160 1,800 1,500 1,250 1,042Total PV of Capital Cost 988,392
Land Cost 0 0 0 0 0 0 0 0 0 0 0 0 0 0 0 0 0 0 0 0 0 0 0 0 0 0PV Land Cost 0 0 0 0 0 0 0 0 0 0 0 0 0 0 0 0 0 0 0 0 0 0 0 0 0 0Total PV of Land Cost 0
Total Costs (exc. land) 836,533 836,533 836,533 836,533 836,533 836,533 836,533 836,533 836,533 836,533 836,533 836,533 836,533 836,533 836,533 836,533 836,533 836,533 836,533 836,533 836,533 836,533 836,533 836,533 836,533 836,533PV Total Costs 836,533 697,111 580,926 484,105 403,421 336,184 280,153 233,461 194,551 162,126 135,105 112,587 93,823 78,186 65,155 54,296 45,246 37,705 31,421 26,184 21,820 18,183 15,153 12,627 10,523 8,769Total PV of Total Costs 8,321,485
Profit (excluding land) 0 0 0 0 0 0 0 0 0 0 0 0 0 0 0 0 0 0 0 0 0 0 0 0 0 0NPV Profit (exc. land) 0 0 0 0 0 0 0 0 0 0 0 0 0 0 0 0 0 0 0 0 0 0 0 0 0 0Total NPV of Profit 0
Net Profit (including land) 0 0 0 0 0 0 0 0 0 0 0 0 0 0 0 0 0 0 0 0 0 0 0 0 0 0NPV Net Profit (including land) 0 0 0 0 0 0 0 0 0 0 0 0 0 0 0 0 0 0 0 0 0 0 0 0 0 0Total NPV of Net Profit 0

Table B-6. Present Value of Social Budget Tables for Short-Fallow Shifting Cultivation of Upland Rice
Social-Budget NPV for Short-Fallow Dry RiceYear 0 1 2 3 4 5 6 7 8 9 10 11 12 13 14 15 16 17 18 19 20 21 22 23 24 25
Discount rate 20.00%Tradables Fertilizer:Urea 0 0 0 0 0 0 0 0 0 0 0 0 0 0 0 0 0 0 0 0 0 0 0 0 0 0
Seed 23,578 23,578 23,578 23,578 23,578 23,578 23,578 23,578 23,578 23,578 23,578 23,578 23,578 23,578 23,578 23,578 23,578 23,578 23,578 23,578 23,578 23,578 23,578 23,578 23,578 23,578Factors Labor
Land-Clearing 125,000 125,000 125,000 125,000 125,000 125,000 125,000 125,000 125,000 125,000 125,000 125,000 125,000 125,000 125,000 125,000 125,000 125,000 125,000 125,000 125,000 125,000 125,000 125,000 125,000 125,000Seedbed Prep 0 0 0 0 0 0 0 0 0 0 0 0 0 0 0 0 0 0 0 0 0 0 0 0 0 0
Planting/Replanting 75,000 75,000 75,000 75,000 75,000 75,000 75,000 75,000 75,000 75,000 75,000 75,000 75,000 75,000 75,000 75,000 75,000 75,000 75,000 75,000 75,000 75,000 75,000 75,000 75,000 75,000Weeding 125,000 125,000 125,000 125,000 125,000 125,000 125,000 125,000 125,000 125,000 125,000 125,000 125,000 125,000 125,000 125,000 125,000 125,000 125,000 125,000 125,000 125,000 125,000 125,000 125,000 125,000
Spraying/Crop Care 0 0 0 0 0 0 0 0 0 0 0 0 0 0 0 0 0 0 0 0 0 0 0 0 0 0Crop watching from pig 200,000 200,000 200,000 200,000 200,000 200,000 200,000 200,000 200,000 200,000 200,000 200,000 200,000 200,000 200,000 200,000 200,000 200,000 200,000 200,000 200,000 200,000 200,000 200,000 200,000 200,000
Crop watching from bird 125,000 125,000 125,000 125,000 125,000 125,000 125,000 125,000 125,000 125,000 125,000 125,000 125,000 125,000 125,000 125,000 125,000 125,000 125,000 125,000 125,000 125,000 125,000 125,000 125,000 125,000Harvesting 100,000 100,000 100,000 100,000 100,000 100,000 100,000 100,000 100,000 100,000 100,000 100,000 100,000 100,000 100,000 100,000 100,000 100,000 100,000 100,000 100,000 100,000 100,000 100,000 100,000 100,000
Drying 10,000 10,000 10,000 10,000 10,000 10,000 10,000 10,000 10,000 10,000 10,000 10,000 10,000 10,000 10,000 10,000 10,000 10,000 10,000 10,000 10,000 10,000 10,000 10,000 10,000 10,000Capital
Working Capital (Rp/ha) 105,450 105,450 105,450 105,450 105,450 105,450 105,450 105,450 105,450 105,450 105,450 105,450 105,450 105,450 105,450 105,450 105,450 105,450 105,450 105,450 105,450 105,450 105,450 105,450 105,450 105,450Land (Rp/ha) 0 0 0 0 0 0 0 0 0 0 0 0 0 0 0 0 0 0 0 0 0 0 0 0 0 0
Output Output (kg/ha) 1,200 1,200 1,200 1,200 1,200 1,200 1,200 1,200 1,200 1,200 1,200 1,200 1,200 1,200 1,200 1,200 1,200 1,200 1,200 1,200 1,200 1,200 1,200 1,200 1,200 1,200Total Revenue 684,470 684,470 684,470 684,470 684,470 684,470 684,470 684,470 684,470 684,470 684,470 684,470 684,470 684,470 684,470 684,470 684,470 684,470 684,470 684,470 684,470 684,470 684,470 684,470 684,470 684,470PV Total Revenue 684,470 570,392 475,326 396,105 330,088 275,073 229,228 191,023 159,186 132,655 110,546 92,121 76,768 63,973 53,311 44,426 37,022 30,851 25,709 21,425 17,854 14,878 12,398 10,332 8,610 7,175Total PV of Total Revenue 6,808,825
Input Cost 23,578 23,578 23,578 23,578 23,578 23,578 23,578 23,578 23,578 23,578 23,578 23,578 23,578 23,578 23,578 23,578 23,578 23,578 23,578 23,578 23,578 23,578 23,578 23,578 23,578 23,578PV Input Cost 23,578 19,648 16,374 13,645 11,371 9,475 7,896 6,580 5,483 4,570 3,808 3,173 2,644 2,204 1,836 1,530 1,275 1,063 886 738 615 513 427 356 297 247Total PV of Input Cost 234,544
Labour Cost 760,000 760,000 760,000 760,000 760,000 760,000 760,000 760,000 760,000 760,000 760,000 760,000 760,000 760,000 760,000 760,000 760,000 760,000 760,000 760,000 760,000 760,000 760,000 760,000 760,000 760,000PV Labour Cost 760,000 633,333 527,778 439,815 366,512 305,427 254,522 212,102 176,752 147,293 122,744 102,287 85,239 71,033 59,194 49,328 41,107 34,256 28,546 23,789 19,824 16,520 13,767 11,472 9,560 7,967Total PV of Labour Cost 7,560,166
Capital Cost 105,450 105,450 105,450 105,450 105,450 105,450 105,450 105,450 105,450 105,450 105,450 105,450 105,450 105,450 105,450 105,450 105,450 105,450 105,450 105,450 105,450 105,450 105,450 105,450 105,450 105,450PV Capital Cost 105,450 87,875 73,229 61,024 50,854 42,378 35,315 29,429 24,524 20,437 17,031 14,192 11,827 9,856 8,213 6,844 5,704 4,753 3,961 3,301 2,751 2,292 1,910 1,592 1,326 1,105Total PV of Capital Cost 1,048,973
Land Cost 0 0 0 0 0 0 0 0 0 0 0 0 0 0 0 0 0 0 0 0 0 0 0 0 0 0PV Land Cost 0 0 0 0 0 0 0 0 0 0 0 0 0 0 0 0 0 0 0 0 0 0 0 0 0 0Total PV of Land Cost 0
Total Costs (exc. land) 889,028 889,028 889,028 889,028 889,028 889,028 889,028 889,028 889,028 889,028 889,028 889,028 889,028 889,028 889,028 889,028 889,028 889,028 889,028 889,028 889,028 889,028 889,028 889,028 889,028 889,028PV Total Costs 889,028 740,857 617,381 514,484 428,736 357,280 297,734 248,111 206,759 172,300 143,583 119,652 99,710 83,092 69,243 57,703 48,086 40,071 33,393 27,827 23,189 19,325 16,104 13,420 11,183 9,319Total PV of Total Costs 8,843,683
Profit (excluding land) -204,558 -204,558 -204,558 -204,558 -204,558 -204,558 -204,558 -204,558 -204,558 -204,558 -204,558 -204,558 -204,558 -204,558 -204,558 -204,558 -204,558 -204,558 -204,558 -204,558 -204,558 -204,558 -204,558 -204,558 -204,558 -204,558NPV Profit (exc. land) -204,558 -170,465 -142,054 -118,378 -98,649 -82,207 -68,506 -57,088 -47,574 -39,645 -33,037 -27,531 -22,943 -19,119 -15,932 -13,277 -11,064 -9,220 -7,683 -6,403 -5,336 -4,446 -3,705 -3,088 -2,573 -2,144Total NPV of Profit -2,034,859
Net Profit (including land) -204,558 -204,558 -204,558 -204,558 -204,558 -204,558 -204,558 -204,558 -204,558 -204,558 -204,558 -204,558 -204,558 -204,558 -204,558 -204,558 -204,558 -204,558 -204,558 -204,558 -204,558 -204,558 -204,558 -204,558 -204,558 -204,558NPV Net Profit (including land) -204,558 -170,465 -142,054 -118,378 -98,649 -82,207 -68,506 -57,088 -47,574 -39,645 -33,037 -27,531 -22,943 -19,119 -15,932 -13,277 -11,064 -9,220 -7,683 -6,403 -5,336 -4,446 -3,705 -3,088 -2,573 -2,144Total NPV of Net Profit -2,034,859
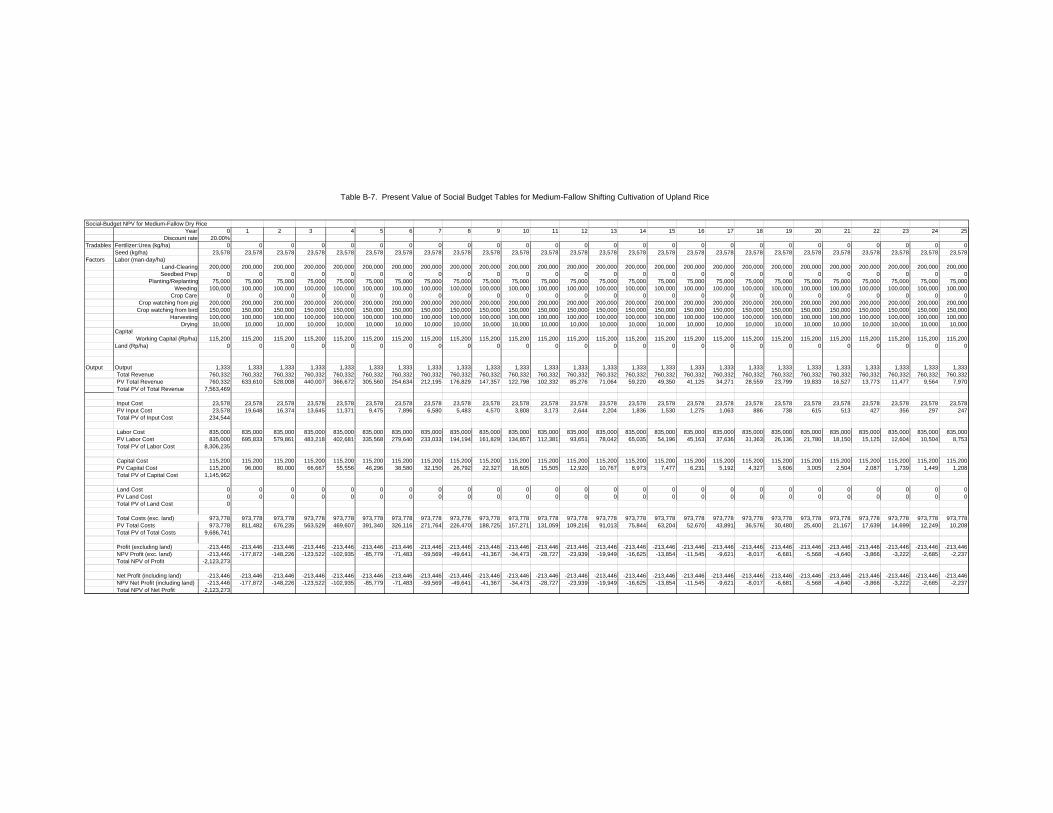
Table B-7. Present Value of Social Budget Tables for Medium-Fallow Shifting Cultivation of Upland Rice
Social-Budget NPV for Medium-Fallow Dry RiceYear 0 1 2 3 4 5 6 7 8 9 10 11 12 13 14 15 16 17 18 19 20 21 22 23 24 25
Discount rate 20.00%Tradables Fertilizer:Urea (kg/ha) 0 0 0 0 0 0 0 0 0 0 0 0 0 0 0 0 0 0 0 0 0 0 0 0 0 0
Seed (kg/ha) 23,578 23,578 23,578 23,578 23,578 23,578 23,578 23,578 23,578 23,578 23,578 23,578 23,578 23,578 23,578 23,578 23,578 23,578 23,578 23,578 23,578 23,578 23,578 23,578 23,578 23,578Factors Labor (man-day/ha)
Land-Clearing 200,000 200,000 200,000 200,000 200,000 200,000 200,000 200,000 200,000 200,000 200,000 200,000 200,000 200,000 200,000 200,000 200,000 200,000 200,000 200,000 200,000 200,000 200,000 200,000 200,000 200,000Seedbed Prep 0 0 0 0 0 0 0 0 0 0 0 0 0 0 0 0 0 0 0 0 0 0 0 0 0 0
Planting/Replanting 75,000 75,000 75,000 75,000 75,000 75,000 75,000 75,000 75,000 75,000 75,000 75,000 75,000 75,000 75,000 75,000 75,000 75,000 75,000 75,000 75,000 75,000 75,000 75,000 75,000 75,000Weeding 100,000 100,000 100,000 100,000 100,000 100,000 100,000 100,000 100,000 100,000 100,000 100,000 100,000 100,000 100,000 100,000 100,000 100,000 100,000 100,000 100,000 100,000 100,000 100,000 100,000 100,000
Crop Care 0 0 0 0 0 0 0 0 0 0 0 0 0 0 0 0 0 0 0 0 0 0 0 0 0 0Crop watching from pig 200,000 200,000 200,000 200,000 200,000 200,000 200,000 200,000 200,000 200,000 200,000 200,000 200,000 200,000 200,000 200,000 200,000 200,000 200,000 200,000 200,000 200,000 200,000 200,000 200,000 200,000
Crop watching from bird 150,000 150,000 150,000 150,000 150,000 150,000 150,000 150,000 150,000 150,000 150,000 150,000 150,000 150,000 150,000 150,000 150,000 150,000 150,000 150,000 150,000 150,000 150,000 150,000 150,000 150,000Harvesting 100,000 100,000 100,000 100,000 100,000 100,000 100,000 100,000 100,000 100,000 100,000 100,000 100,000 100,000 100,000 100,000 100,000 100,000 100,000 100,000 100,000 100,000 100,000 100,000 100,000 100,000
Drying 10,000 10,000 10,000 10,000 10,000 10,000 10,000 10,000 10,000 10,000 10,000 10,000 10,000 10,000 10,000 10,000 10,000 10,000 10,000 10,000 10,000 10,000 10,000 10,000 10,000 10,000Capital
Working Capital (Rp/ha) 115,200 115,200 115,200 115,200 115,200 115,200 115,200 115,200 115,200 115,200 115,200 115,200 115,200 115,200 115,200 115,200 115,200 115,200 115,200 115,200 115,200 115,200 115,200 115,200 115,200 115,200Land (Rp/ha) 0 0 0 0 0 0 0 0 0 0 0 0 0 0 0 0 0 0 0 0 0 0 0 0 0 0
Output Output 1,333 1,333 1,333 1,333 1,333 1,333 1,333 1,333 1,333 1,333 1,333 1,333 1,333 1,333 1,333 1,333 1,333 1,333 1,333 1,333 1,333 1,333 1,333 1,333 1,333 1,333Total Revenue 760,332 760,332 760,332 760,332 760,332 760,332 760,332 760,332 760,332 760,332 760,332 760,332 760,332 760,332 760,332 760,332 760,332 760,332 760,332 760,332 760,332 760,332 760,332 760,332 760,332 760,332PV Total Revenue 760,332 633,610 528,008 440,007 366,672 305,560 254,634 212,195 176,829 147,357 122,798 102,332 85,276 71,064 59,220 49,350 41,125 34,271 28,559 23,799 19,833 16,527 13,773 11,477 9,564 7,970Total PV of Total Revenue 7,563,469
Input Cost 23,578 23,578 23,578 23,578 23,578 23,578 23,578 23,578 23,578 23,578 23,578 23,578 23,578 23,578 23,578 23,578 23,578 23,578 23,578 23,578 23,578 23,578 23,578 23,578 23,578 23,578PV Input Cost 23,578 19,648 16,374 13,645 11,371 9,475 7,896 6,580 5,483 4,570 3,808 3,173 2,644 2,204 1,836 1,530 1,275 1,063 886 738 615 513 427 356 297 247Total PV of Input Cost 234,544
Labor Cost 835,000 835,000 835,000 835,000 835,000 835,000 835,000 835,000 835,000 835,000 835,000 835,000 835,000 835,000 835,000 835,000 835,000 835,000 835,000 835,000 835,000 835,000 835,000 835,000 835,000 835,000PV Labor Cost 835,000 695,833 579,861 483,218 402,681 335,568 279,640 233,033 194,194 161,829 134,857 112,381 93,651 78,042 65,035 54,196 45,163 37,636 31,363 26,136 21,780 18,150 15,125 12,604 10,504 8,753Total PV of Labor Cost 8,306,235
Capital Cost 115,200 115,200 115,200 115,200 115,200 115,200 115,200 115,200 115,200 115,200 115,200 115,200 115,200 115,200 115,200 115,200 115,200 115,200 115,200 115,200 115,200 115,200 115,200 115,200 115,200 115,200PV Capital Cost 115,200 96,000 80,000 66,667 55,556 46,296 38,580 32,150 26,792 22,327 18,605 15,505 12,920 10,767 8,973 7,477 6,231 5,192 4,327 3,606 3,005 2,504 2,087 1,739 1,449 1,208Total PV of Capital Cost 1,145,962
Land Cost 0 0 0 0 0 0 0 0 0 0 0 0 0 0 0 0 0 0 0 0 0 0 0 0 0 0PV Land Cost 0 0 0 0 0 0 0 0 0 0 0 0 0 0 0 0 0 0 0 0 0 0 0 0 0 0Total PV of Land Cost 0
Total Costs (exc. land) 973,778 973,778 973,778 973,778 973,778 973,778 973,778 973,778 973,778 973,778 973,778 973,778 973,778 973,778 973,778 973,778 973,778 973,778 973,778 973,778 973,778 973,778 973,778 973,778 973,778 973,778PV Total Costs 973,778 811,482 676,235 563,529 469,607 391,340 326,116 271,764 226,470 188,725 157,271 131,059 109,216 91,013 75,844 63,204 52,670 43,891 36,576 30,480 25,400 21,167 17,639 14,699 12,249 10,208Total PV of Total Costs 9,686,741
Profit (excluding land) -213,446 -213,446 -213,446 -213,446 -213,446 -213,446 -213,446 -213,446 -213,446 -213,446 -213,446 -213,446 -213,446 -213,446 -213,446 -213,446 -213,446 -213,446 -213,446 -213,446 -213,446 -213,446 -213,446 -213,446 -213,446 -213,446NPV Profit (exc. land) -213,446 -177,872 -148,226 -123,522 -102,935 -85,779 -71,483 -59,569 -49,641 -41,367 -34,473 -28,727 -23,939 -19,949 -16,625 -13,854 -11,545 -9,621 -8,017 -6,681 -5,568 -4,640 -3,866 -3,222 -2,685 -2,237Total NPV of Profit -2,123,273
Net Profit (including land) -213,446 -213,446 -213,446 -213,446 -213,446 -213,446 -213,446 -213,446 -213,446 -213,446 -213,446 -213,446 -213,446 -213,446 -213,446 -213,446 -213,446 -213,446 -213,446 -213,446 -213,446 -213,446 -213,446 -213,446 -213,446 -213,446NPV Net Profit (including land) -213,446 -177,872 -148,226 -123,522 -102,935 -85,779 -71,483 -59,569 -49,641 -41,367 -34,473 -28,727 -23,939 -19,949 -16,625 -13,854 -11,545 -9,621 -8,017 -6,681 -5,568 -4,640 -3,866 -3,222 -2,685 -2,237Total NPV of Net Profit -2,123,273

Table B-8. Present Value of Social Budget Tables for Long-Fallow Shifting Cultivation of Upland Rice
Social Budget NPV for Long-Fallow Dry RiceYear 0 1 2 3 4 5 6 7 8 9 10 11 12 13 14 15 16 17 18 19 20 21 22 23 24 25
Discount rate 20.00%Tradables Fertilizer:Urea (kg/ha) 0 0 0 0 0 0 0 0 0 0 0 0 0 0 0 0 0 0 0 0 0 0 0 0 0 0
Seed (kg/ha) 23,578 23,578 23,578 23,578 23,578 23,578 23,578 23,578 23,578 23,578 23,578 23,578 23,578 23,578 23,578 23,578 23,578 23,578 23,578 23,578 23,578 23,578 23,578 23,578 23,578 23,578Factors Labor (man-day/ha)
Land-Clearing 200,000 200,000 200,000 200,000 200,000 200,000 200,000 200,000 200,000 200,000 200,000 200,000 200,000 200,000 200,000 200,000 200,000 200,000 200,000 200,000 200,000 200,000 200,000 200,000 200,000 200,000Seedbed Prep 0 0 0 0 0 0 0 0 0 0 0 0 0 0 0 0 0 0 0 0 0 0 0 0 0 0
Planting/Replanting 75,000 75,000 75,000 75,000 75,000 75,000 75,000 75,000 75,000 75,000 75,000 75,000 75,000 75,000 75,000 75,000 75,000 75,000 75,000 75,000 75,000 75,000 75,000 75,000 75,000 75,000Weeding 100,000 100,000 100,000 100,000 100,000 100,000 100,000 100,000 100,000 100,000 100,000 100,000 100,000 100,000 100,000 100,000 100,000 100,000 100,000 100,000 100,000 100,000 100,000 100,000 100,000 100,000
Spraying/Crop Care 0 0 0 0 0 0 0 0 0 0 0 0 0 0 0 0 0 0 0 0 0 0 0 0 0 0Crop watching from pig 200,000 200,000 200,000 200,000 200,000 200,000 200,000 200,000 200,000 200,000 200,000 200,000 200,000 200,000 200,000 200,000 200,000 200,000 200,000 200,000 200,000 200,000 200,000 200,000 200,000 200,000
Crop watching from bird 150,000 150,000 150,000 150,000 150,000 150,000 150,000 150,000 150,000 150,000 150,000 150,000 150,000 150,000 150,000 150,000 150,000 150,000 150,000 150,000 150,000 150,000 150,000 150,000 150,000 150,000Harvesting 100,000 100,000 100,000 100,000 100,000 100,000 100,000 100,000 100,000 100,000 100,000 100,000 100,000 100,000 100,000 100,000 100,000 100,000 100,000 100,000 100,000 100,000 100,000 100,000 100,000 100,000
Drying 10,000 10,000 10,000 10,000 10,000 10,000 10,000 10,000 10,000 10,000 10,000 10,000 10,000 10,000 10,000 10,000 10,000 10,000 10,000 10,000 10,000 10,000 10,000 10,000 10,000 10,000Capital
Working Capital (Rp/ha) 128,700 128,700 128,700 128,700 128,700 128,700 128,700 128,700 128,700 128,700 128,700 128,700 128,700 128,700 128,700 128,700 128,700 128,700 128,700 128,700 128,700 128,700 128,700 128,700 128,700 128,700Land (Rp/ha) 0 0 0 0 0 0 0 0 0 0 0 0 0 0 0 0 0 0 0 0 0 0 0 0 0 0
Output Output (kg/ha) 1,800 1,800 1,800 1,800 1,800 1,800 1,800 1,800 1,800 1,800 1,800 1,800 1,800 1,800 1,800 1,800 1,800 1,800 1,800 1,800 1,800 1,800 1,800 1,800 1,800 1,800Total Revenue 1,026,705 1,026,705 1,026,705 1,026,705 1,026,705 1,026,705 1,026,705 1,026,705 1,026,705 1,026,705 1,026,705 1,026,705 1,026,705 1,026,705 1,026,705 1,026,705 1,026,705 1,026,705 1,026,705 1,026,705 1,026,705 1,026,705 1,026,705 1,026,705 1,026,705 1,026,705PV Total Revenue 1,026,705 855,588 712,990 594,158 495,132 412,610 343,841 286,535 238,779 198,982 165,819 138,182 115,152 95,960 79,967 66,639 55,532 46,277 38,564 32,137 26,781 22,317 18,598 15,498 12,915 10,763Total PV of Total Revenue 10,213,237
Input Cost 23,578 23,578 23,578 23,578 23,578 23,578 23,578 23,578 23,578 23,578 23,578 23,578 23,578 23,578 23,578 23,578 23,578 23,578 23,578 23,578 23,578 23,578 23,578 23,578 23,578 23,578PV Input Cost 23,578 19,648 16,374 13,645 11,371 9,475 7,896 6,580 5,483 4,570 3,808 3,173 2,644 2,204 1,836 1,530 1,275 1,063 886 738 615 513 427 356 297 247Total PV of Input Cost 234,544
Labour Cost 835,000 835,000 835,000 835,000 835,000 835,000 835,000 835,000 835,000 835,000 835,000 835,000 835,000 835,000 835,000 835,000 835,000 835,000 835,000 835,000 835,000 835,000 835,000 835,000 835,000 835,000PV Labour Cost 835,000 695,833 579,861 483,218 402,681 335,568 279,640 233,033 194,194 161,829 134,857 112,381 93,651 78,042 65,035 54,196 45,163 37,636 31,363 26,136 21,780 18,150 15,125 12,604 10,504 8,753Total PV of Labour Cost 8,306,235
Capital Cost 128,700 128,700 128,700 128,700 128,700 128,700 128,700 128,700 128,700 128,700 128,700 128,700 128,700 128,700 128,700 128,700 128,700 128,700 128,700 128,700 128,700 128,700 128,700 128,700 128,700 128,700PV Capital Cost 128,700 107,250 89,375 74,479 62,066 51,722 43,101 35,918 29,932 24,943 20,786 17,321 14,435 12,029 10,024 8,353 6,961 5,801 4,834 4,028 3,357 2,798 2,331 1,943 1,619 1,349Total PV of Capital Cost 1,280,254
Land Cost 0 0 0 0 0 0 0 0 0 0 0 0 0 0 0 0 0 0 0 0 0 0 0 0 0 0PV Land Cost 0 0 0 0 0 0 0 0 0 0 0 0 0 0 0 0 0 0 0 0 0 0 0 0 0 0Total PV of Land Cost 0
Total Costs (exc. land) 987,278 987,278 987,278 987,278 987,278 987,278 987,278 987,278 987,278 987,278 987,278 987,278 987,278 987,278 987,278 987,278 987,278 987,278 987,278 987,278 987,278 987,278 987,278 987,278 987,278 987,278PV Total Costs 987,278 822,732 685,610 571,341 476,118 396,765 330,637 275,531 229,609 191,341 159,451 132,876 110,730 92,275 76,896 64,080 53,400 44,500 37,083 30,903 25,752 21,460 17,883 14,903 12,419 10,349Total PV of Total Costs 9,821,034
Profit (excluding land) 39,427 39,427 39,427 39,427 39,427 39,427 39,427 39,427 39,427 39,427 39,427 39,427 39,427 39,427 39,427 39,427 39,427 39,427 39,427 39,427 39,427 39,427 39,427 39,427 39,427 39,427NPV Profit (exc. land) 39,427 32,856 27,380 22,817 19,014 15,845 13,204 11,003 9,169 7,641 6,368 5,306 4,422 3,685 3,071 2,559 2,133 1,777 1,481 1,234 1,028 857 714 595 496 413Total NPV of Profit 392,204
Net Profit (including land) 39,427 39,427 39,427 39,427 39,427 39,427 39,427 39,427 39,427 39,427 39,427 39,427 39,427 39,427 39,427 39,427 39,427 39,427 39,427 39,427 39,427 39,427 39,427 39,427 39,427 39,427NPV Net Profit (including land) 39,427 32,856 27,380 22,817 19,014 15,845 13,204 11,003 9,169 7,641 6,368 5,306 4,422 3,685 3,071 2,559 2,133 1,777 1,481 1,234 1,028 857 714 595 496 413Total NPV of Net Profit 392,204

Table B-9. NPV-PAM for Lowland Rice and Shifting Cultivation, under a 25-year Planning Cycle
Net Present Value of Policy Analysis Matrix: NPV-PAM Wet PaddyTradables Domestic Resources
Output Inputs Labor Capital ProfitsPrivate 10,705,657 246,230 3,782,665 787,936 5,888,825 Social 8,321,485 320,044 7,013,049 988,392 (0) Divergences 2,384,172 (73,814) (3,230,384) (200,456) 5,888,825
Net Present Value Policy Analysis Matrix: NPV-PAM Short Fallow - Dry PaddyTradables Domestic Resources
Output Inputs Labor Capital ProfitsPrivate 14,324,525 298,428 6,694,726 1,398,631 5,932,741 Social 6,808,825 234,544 7,560,166 1,048,973 (2,034,859) Divergences 7,515,700 63,883 (865,440) 349,658 7,967,599
Net Present Value Policy Analysis Matrix: NPV-PAM Medium Fallow - Dry PaddyTradables Domestic Resources
Output Inputs Labor Capital ProfitsPrivate 15,912,160 298,428 7,341,319 1,527,949 6,744,464 Social 7,563,469 234,544 8,306,235 1,145,962 (2,123,273) Divergences 8,348,691 63,883 (964,916) 381,987 8,867,737
Net Present Value Policy Analysis Matrix: NPV-PAM Long Fallow - Dry PaddyTradables Domestic Resources
Output Inputs Labor Capital ProfitsPrivate 21,486,788 298,428 8,236,602 1,707,006 11,244,752 Social 10,213,237 234,544 8,306,235 1,280,254 392,204 Divergences 11,273,551 63,883 (69,633) 426,751 10,852,549
NPV Ratios of Protection and Efficiency for Wet Paddy and Shifting CultivationNPC EPC DRC
Outputs InputsWet Paddy - AYV 1.29 0.77 1.31 1.00Short Fallow - Dry Paddy 2.10 1.27 2.13 1.31Medium Fallow - Dry Paddy 2.10 1.27 2.13 1.29Long Fallow - Dry Paddy 2.10 1.27 2.12 0.96

W O R L D A G R O F O R E S T R Y C E N T R E ( I C R A F )
S O U T H E A S T A S I A R E G I O N A L O F F I C E W O R K I N G P A P E R S
Funded by theAsian Development Bank
RETA 5711


