With the continued growth and proliferation of Web services and Web based information systems, the volumes of user data have reached astronomical proportions. Analyzing such data using Web Usage Mining can help to determine the visiting interests or needs of the web user. As web log is incremental in nature, it becomes a crucial issue to predict exactly the ways how users browse websites. It is necessary for web miners to use predictive mining techniques to filter the unwanted categories for reducing the operational scope. The first-order Markov model has low accuracy in achieving right predictions, which is why extensions to higher order models are necessary. All higher order Markov model holds the promise of achieving higher prediction accuracies, improved coverage than any single-order Markov model but holds high state space complexity. Hence a Hybrid Markov Model is required to improve the operation performance and prediction accuracy significantly. The present paper introduces An Efficient Hybrid Successive Markov Prediction Model, HSMP. The HSMP model is initially predicts the possible wanted categories using Relevance factor, which can be used to infer the users’ browsing behavior between web categories. Then predict the pages in predicted categories using techniques for intelligently combining different order Markov models so that the resulting model has low state complexity, improved prediction accuracy and retains the coverage of the all higher order Markov model. These techniques eliminates low support states, evaluates the probability distribution and estimates the error associated with each state without affecting the overall accuracy as well as protection of the resulting model. To validate the proposed prediction model, several experiments were conducted and results proven this are claimed in this paper.
20
Prof. V.V.R.Maheswara Rao & Dr. V. Valli Kumari International Journal of Data Engineering (IJDE) Volume (1): Issue (5) 43 An Efficient Hybrid Successive Markov Model for Predicting Web User Usage Behavior using Web Usage Mining V.V.R.Maheswara Rao [email protected]Professor, Department of Computer Applications, Shri Vishnu Engineering College for Women, Bhimavaram, Andhra Pradesh, India. Dr. V. Valli Kumari [email protected]Professor, Department of CS&SE, AU College of Engineering, Visakhapatnam, Andhra Pradesh, India Abstract With the continued growth and proliferation of Web services and Web based information systems, the volumes of user data have reached astronomical proportions. Analyzing such data using Web Usage Mining can help to determine the visiting interests or needs of the web user. As web log is incremental in nature, it becomes a crucial issue to predict exactly the ways how users browse websites. It is necessary for web miners to use predictive mining techniques to filter the unwanted categories for reducing the operational scope. The first-order Markov model has low accuracy in achieving right predictions, which is why extensions to higher order models are necessary. All higher order Markov model holds the promise of achieving higher prediction accuracies, improved coverage than any single-order Markov model but holds high state space complexity. Hence a Hybrid Markov Model is required to improve the operation performance and prediction accuracy significantly. The present paper introduces An Efficient Hybrid Successive Markov Prediction Model, HSMP. The HSMP model is initially predicts the possible wanted categories using Relevance factor, which can be used to infer the users’ browsing behavior between web categories. Then predict the pages in predicted categories using techniques for intelligently combining different order Markov models so that the resulting model has low state complexity, improved prediction accuracy and retains the coverage of the all higher order Markov model. These techniques eliminates low support states, evaluates the probability distribution and estimates the error associated with each state without affecting the overall accuracy as well as protection of the resulting model. To validate the proposed prediction model, several experiments were conducted and results proven this are claimed in this paper. Keywords: Web Usage Mining, Prediction Model, Navigation Behavior, Higher order Markov Model, Web log data, Browsing Patterns, Pre-Processing.
Transcript
Prof. V.V.R.Maheswara Rao & Dr. V. Valli Kumari
International Journal of Data Engineering (IJDE) Volume (1): Issue (5) 43
An Efficient Hybrid Successive Markov Model for Predicting Web User Usage Behavior using Web Usage Mining
V.V.R.Maheswara Rao [email protected] Professor, Department of Computer Applications, Shri Vishnu Engineering College for Women, Bhimavaram, Andhra Pradesh, India. Dr. V. Valli Kumari [email protected] Professor, Department of CS&SE, AU College of Engineering, Visakhapatnam, Andhra Pradesh, India
Abstract
With the continued growth and proliferation of Web services and Web based information systems, the volumes of user data have reached astronomical proportions. Analyzing such data using Web Usage Mining can help to determine the visiting interests or needs of the web user. As web log is incremental in nature, it becomes a crucial issue to predict exactly the ways how users browse websites. It is necessary for web miners to use predictive mining techniques to filter the unwanted categories for reducing the operational scope. The first-order Markov model has low accuracy in achieving right predictions, which is why extensions to higher order models are necessary. All higher order Markov model holds the promise of achieving higher prediction accuracies, improved coverage than any single-order Markov model but holds high state space complexity. Hence a Hybrid Markov Model is required to improve the operation performance and prediction accuracy significantly. The present paper introduces An Efficient Hybrid Successive Markov Prediction Model, HSMP. The HSMP model is initially predicts the possible wanted categories using Relevance factor, which can be used to infer the users’ browsing behavior between web categories. Then predict the pages in predicted categories using techniques for intelligently combining different order Markov models so that the resulting model has low state complexity, improved prediction accuracy and retains the coverage of the all higher order Markov model. These techniques eliminates low support states, evaluates the probability distribution and estimates the error associated with each state without affecting the overall accuracy as well as protection of the resulting model. To validate the proposed prediction model, several experiments were conducted and results proven this are claimed in this paper. Keywords: Web Usage Mining, Prediction Model, Navigation Behavior, Higher order Markov Model, Web log data, Browsing Patterns, Pre-Processing.
Prof. V.V.R.Maheswara Rao & Dr. V. Valli Kumari
International Journal of Data Engineering (IJDE) Volume (1): Issue (5) 44
1. INTRODUCTION
The web has become the world’s largest knowledge repository. The popularity of WWW is rapidly developing and is a golden mount with a lot of valuable information. Extracting the knowledge from the web efficiently and effectively is becoming a tedious process. Towards this, web mining has been defined as the research field focused on studying the application of data mining techniques to web data. More specifically, the field of research focused on developing techniques to model and study user web usage data has been called web usage mining. When user visits web pages, data representing their navigational experience is recorded in web log. The web log consists of an unordered, semi structured and complex of web page requests from which it is possible to accurately infer user navigational sessions, usually defined as sequence of web pages. Web Usage Mining techniques have been proposed for mining user navigation pattern from usage data. The analysis of such patterns helps to understand the user behavior when visiting web pages. The general process of web mining process includes (I) Pre-processing: It is very important task in any mining applications is the creation of suitable target data set to which mining algorithms can be applied. The primary data preparation tasks are Data Cleansing, Page View Identification, user Identification, Sessionization, Path Completion and Data Integration. (II) Pattern discovery: The goal of pattern discovery is the task of learning some general concepts from a given set of documents. In this phase, Pattern recognition and machine learning techniques, like classification, clustering and association rule mining, are usually used on the extracted information. (IV) Pattern analysis: The goal of pattern analysis is the task of understanding, visualizing, and interpreting the patterns once they are discovered in the Pattern Discovery phase as shown in Fig.1.
FIGURE 1: Web Mining Processes
The most recent research field focused on developing techniques to model and study users’ Web navigation data. The web navigational data, which resides in weblog, consist of many more categories. In general, any web user closely associated with one or two categories. But the previous mining techniques are taking the input of all categories. This reduces operational performance of mining techniques. Markov model have been used for studying and understanding stochastic processes, and well suited for modeling and predicting a user’s browsing behavior on a web. In general, the input for these problems is the sequence of web pages that are accessed by a user and the goal is built Markov model that can be used to predict the web user usage behavior. The state space of the Markov model depends on the number of previous actions used in predicting the next action. The simplest Markov model predicts the next action by only looking at the last action performed by the user. In this model, also known as the first order Markov model, each action that can be performed by a user corresponds to a state in the model. A somewhat more complicated model computes the prediction by looking at the last two actions performed by the user. This is called the second order Markov model, and its states correspond to all possible pairs of action that can be performed in sequence. This approach is generalized to the n
th order Markov model, which
computes the prediction by looking at the last N actions performed by the user, leading to a state space that contains all possible sequences of N actions as shown in Fig. 2.
Prof. V.V.R.Maheswara Rao & Dr. V. Valli Kumari
International Journal of Data Engineering (IJDE) Volume (1): Issue (5) 45
FIGURE 2: Prediction of Categories
In most of the applications, the first-order Markov model has low accuracy in achieving right predictions, which is why extensions to higher order models are necessary. All higher order Markov model holds the promise of achieving higher prediction accuracies and improved coverage than any single-order Markov model, at the expense of a dramatic increase in the state-space complexity. Hence, the authors proposes techniques for intelligently combining different order Markov models so that the resulting model has low state complexity, improved prediction accuracy and retains the coverage of the all higher order Markov model. This paper introduces an Efficient Hybrid Successive Markov Prediction Model, HSMP. The HSMP model is initially predicts the possible required web categories using Relevance Factor, which can be determined from Similarity, Transition and Relevance Matrices to infer the users’ browsing behavior between web categories. Then predict the pages in predicted categories using intelligently combining Support, Confidence and Error pruned techniques, for different order Markov models so that the resulting model has low state complexity, improved prediction accuracy and retains the coverage of the all higher order Markov model. Support-Pruned Markov model eliminates low support states without affecting the overall accuracy as well as coverage of the resulting model. Confidence-Pruned Markov Model evaluates the probability distribution of the outgoing actions before making its pruning decisions. Error pruned Markov model estimate the error associated with each state. The rest of this paper is organized as follows: Section 2 is the related work. The Hybrid Successive Predictive Model is proposed in Section 3. Section 4 is the experimental analysis. Finally in section 5 conclusions and future work are mentioned.
2. RELATED WORK
Many of the previous authors are expressing the criticality and importance of identifying the user’s browsing behavior available visiting data available in web log. Most of the works in the literature concentrates on single order Markov Model to identify the browsing behavior of the user. Several models in the literatures proposed for identifying the association between the pages without considering the category. Myra Spiliopoulou [1] suggests applying Web usage mining to website evaluation to determine needed modifications, primarily to the site’s design of page content and link structure between pages. Eirinaki et al. [2] propose a method that incorporates link analysis, such as the page rank measure, into a Markov model in order to provide Web path recommendations. Schechter et al. [3] utilized a tree-based data structure that represents the collection of paths inferred from the log data to predict the next page access. Chen and Zhang [4] utilized a Prediction by Partial Match forest that restricts the roots to popular nodes; assuming that most user sessions start in popular pages, the branches having a Non popular page as their root are pruned. R. Walpole, R. Myers and S. Myers [5] proposed Bayesian theorem can be used to predict the most possible users’ next request. There has been previous research on evaluating the ability of a Markov model to predict the next link choice of a user [14], [15]; however, there is a lack of publications on evaluating the ability of
Prof. V.V.R.Maheswara Rao & Dr. V. Valli Kumari
International Journal of Data Engineering (IJDE) Volume (1): Issue (5) 46
a Markov model to represent user sessions up to a given history length. Moreover, as far as we know, the relationship between summarization ability and prediction power has not been studied before in the context of Web mining. To extract useful browsing patterns one has to follow an approach of pre processing and discovery of the hidden patterns from possible server logs which are non scalable and impractical. Hence to reduce the operation scope there is a need of Hybrid model, which can identify the category and then the finding the association between the pages.
3. PROPOSED WORK
Because of voluminous data of web pages in Web log, the mining techniques were proved to be in efficient with respect to operation performance. To improve the operational performance of mining techniques, it is necessary to reduce the state space complexity. Towards this goal, Markov models are well suited, since they are compact, expressive and simple to understand and well established on mathematical theory. So that the resulting models has low state complexity. In the present paper the authors proposes a Hybrid Successive Markov Prediction Model HSMP using high order Markov, which can filter the unwanted categories and further it can predict the required Web pages with high prediction accuracy. Initially, the raw web log has to be preprocessed, to get formatted, integrated and actual data, which is more suitable to mining techniques as shown in Fig. 3.
FIGURE 3: Web Usage mining Process
3.1. IMPROVED PRE-PROCESSING SYSTEM - IPS IPS is the first stage of proposed model, which filters raw weblog data and extracts formatted, integrated and actual data which is more suitable to mining techniques. IPS is further divided into different steps which include Data Cleansing, User Identification, Session Identification, Path Completion and Data Integration. The functionality of each step explained in detail as below: Data Cleansing
Prof. V.V.R.Maheswara Rao & Dr. V. Valli Kumari
International Journal of Data Engineering (IJDE) Volume (1): Issue (5) 47
The first step of pre processing is data cleansing. It is usually site-specific, and involves tasks such as, removing extraneous references to embedded objects that may not be important for the purpose of analysis, including references to style files, graphics, or sound files as shown in Table 1. The cleansing process also may involve the removal of at least some of the data fields (e.g. number of bytes transferred or version of protocol used, etc.) that may not provide useful information in the analysis or data mining tasks.
TABLE1: Example of web log with different extensions
User Identification The task of User Identification is, to identify who access web site and which pages are accessed. The analysis of Web usage does not require knowledge about a user’s identity. However, it is necessary to distinguish among different users. Since a user may visit a site more than once, the server logs record multiple sessions for each user. The user activity record is used to refer to the sequence of logged activities belonging to the same user.
FIGURE 4: Example of User Identification
Consider, for instance, the example of Fig 4. On the left, depicts a portion of a partly pre processed log file. Using a combination of IP and URL fields in the log file, one can partition the log into activity records for three separate users (depicted on the right). Session Ordering Sessionization is the process of segmenting the user activity record of each user into sessions, each representing a single visit to the site. Web sites without the benefit of additional
Prof. V.V.R.Maheswara Rao & Dr. V. Valli Kumari
International Journal of Data Engineering (IJDE) Volume (1): Issue (5) 48
authentication information from users and without mechanisms such as embedded session ids must rely on heuristic methods for sessionization. The goal of a sessionization heuristic is to re-construct, from the click stream data, the actual sequence of actions performed by one user during one visit to the site. Generally, sessionization heuristics fall into two basic categories: time-oriented or structure-oriented. As an example, time-oriented heuristic, h1: Total session duration may not exceed a threshold θ. Given t0, the timestamp for the first request in a constructed session S, the request with a timestamp t is assigned to S, iff t − t0 ≤ θ. In Fig 5, the heuristic h1, described above, with θ = 30 minutes has been used to partition a user activity record (from the example of Fig 3) into two separate sessions.
FIGURE 5: Example of Sessionization
Path Completion Another potentially important pre-processing task which is usually performed after sessionization is path completion. Path completion is a process of adding the page accesses that are not in the web log but those which is actually occurred. Client or proxy-side caching can often result in missing access references to those pages or objects that have been cached. For instance, if a user returns to a page A during the same session, the second access to A will likely result in viewing the previously downloaded version of A that was cached on the client-side, and therefore, no request is made to the server. This results in the second reference to A not being recorded on the server logs. Missing references due to caching can be heuristically inferred through path completion which relies on the knowledge of site structure and referrer information from server logs. In the case of dynamically generated pages, form-based applications using the HTTP POST method result in all or part of the user input parameter not being appended to the URL accessed by the user. A simple example of missing references is given in Fig 6.
FIGURE 6: Identifying missing references in path completion
Data Integration The above pre-processing tasks ultimately result in a set of user sessions each corresponding to a delimited sequence of pageviews. However, in order to provide the most effective framework for pattern discovery, data from a variety of other sources must be integrated with the preprocessed
Prof. V.V.R.Maheswara Rao & Dr. V. Valli Kumari
International Journal of Data Engineering (IJDE) Volume (1): Issue (5) 49
clickstream data. This is particularly the case in e-commerce applications where the integration of both user data (e.g., demographics, ratings, and purchase histories) and product attributes and categories from operational databases is critical. Such data, used in conjunction with usage data, in the mining process can allow for the discovery of important business intelligence metrics such as customer conversion ratios and lifetime values. In addition to user and product data, e-commerce data includes various product-oriented events such as shopping cart changes, order and shipping information, impressions (when the user visits a page containing an item of interest), click through (when the user actually clicks on an item of interest in the current page), and other basic metrics primarily used for data analysis. The successful integration of these types of data requires the creation of a site-specific “event model” based on which subsets of a user’s clickstream are aggregated and mapped to specific events such as the addition of a product to the shopping cart. Generally, the integrated e-commerce data is stored in the final transaction database. To enable full-featured Web analytics applications, this
data is usually stored in a data warehouse called an e-commerce data mart. The e-commerce
data mart is a multi-dimensional database integrating data from various sources, and at different levels of aggregation. It can provide pre-computed e-metrics along multiple dimensions, and is used as the primary data source for OLAP (Online Analytical Processing), for data visualization, and in data selection for a variety of data mining tasks 3.2. HYBRID SUCCESSIVE MARKOV PREDICTION MODEL USING HIGHER ORDER - HSMP The Hybrid Successive Markov Predictive Model HSMP has been used for investigation and understanding stochastic process and it was to be well suited for modeling and predicting users browsing behavior in the Web log Scenario. In most of the applications, the first-order Markov model has low accuracy in achieving right predictions, which is why extensions to higher order models are necessary. All higher order Markov model holds the promise of achieving higher prediction accuracies and improved coverage than any single-order Markov model, at the expense of a dramatic increase in the state-space complexity. Hence, the authors proposes techniques for intelligently combining different order Markov models so that the resulting model has low state space complexity, improved prediction accuracy and retains the coverage of the all higher order Markov model. The input for Hybrid Successive Markov Predictive Model HSMP is preprocessed web log, it is designed and implemented in stages, namely (A) Prediction of categories and (B) Prediction of pages in the predicted categories. 3.2. A. PREDICTION OF CATEGORIES The steps in prediction of categories are described as follows. At first, the Similarity Matrix S of category is established. The approach of establishing similarity matrix is to gather statistics and to analyze the users’ browsing behavior which can be acquired from web log data. In step two, it is to establish the first-order transition matrix P and second-order transition matrix P
2 and n-order of
higher order Markov model. Secondly, the Transition Matrix of Markov is established by the same approach, statistical method, from web log. Finally, the Relevance Matrix R is computed from first-order and second-order (or n-order) transition matrix of Markov model and similarity matrix. In the proposed method, the relevance is an important factor of prediction. Relevance can be used to infer the users’ browsing behavior between web categories. It is assumed that D denotes a web log data, which contains m users’ usage record. It means that the users’ session is recorded and D = {session1, session2 ,...,sessionm} is obtained. Each user’s session can also be recorded as a sequential pattern of n web pages which is browsed by time order, and session
p = {page1, page2,…., pagen}, where page i represents the user’s visiting page
at time j, is obtained. If a web site has k categories, then the user’s session can be reorganized by session
c={c1,c2,…., ck}, where ci = 0. After giving the definitions, more details for the prediction
model are described in the following sections.
Prof. V.V.R.Maheswara Rao & Dr. V. Valli Kumari
International Journal of Data Engineering (IJDE) Volume (1): Issue (5) 50
Concept of Similarity Matrix of web categories Step one of proposed prediction of categories model is to create the similarity matrix from web log file. At first, the situation of categories in each user’s session has to be understood. The vectori = <v1,i,…,vh,i,…,vm,i> for each category i is gather the i
th element of session c from all m user
sessions, vh,i = 1 means user h visited web page of category i otherwise vh,i = 0 . Two categories can be calculated the Set similarity and Euclidean distance, respectively. Euclidean distance is further normalized. The results are computed by similarity and Euclidean distance. They are combined into a weight total similarity equation.
Euclidean distance:
Normalization:
Weight total similarity:
Where
After the similarity is calculated, the similarity matrix S is a k x k matrix of categories similarity, where Sij is the similarity between Ci and Cj that is established by above steps.
Design of Similarity Matrix of web categories The web log pre-processing results in a set of n pageviews, P = {p1, p2, ···, pn}, and a set of m user transactions, T = {t1,t2,···,tm}, where each ti in T is a subset of P. Pageviews are semantically meaningful entities to which mining tasks are applied. Each transaction t can be conceptually viewed as an l-length sequence of ordered pairs
where each for some j in {1, 2, ···, n}, and is the weight associated with pageviews in
transaction t, representing its significance. In web usage mining tasks the weights are, either binary representing the existence or non-existence of a pageview in the transaction or they can be a function of the duration of the pageview in the user’s session. In the case of time durations, it should be noted that usually the time spent by a user on the last pageview in the session is not
Prof. V.V.R.Maheswara Rao & Dr. V. Valli Kumari
International Journal of Data Engineering (IJDE) Volume (1): Issue (5) 51
available. Hence for the proposed frame work weights are associated based on binary representation.
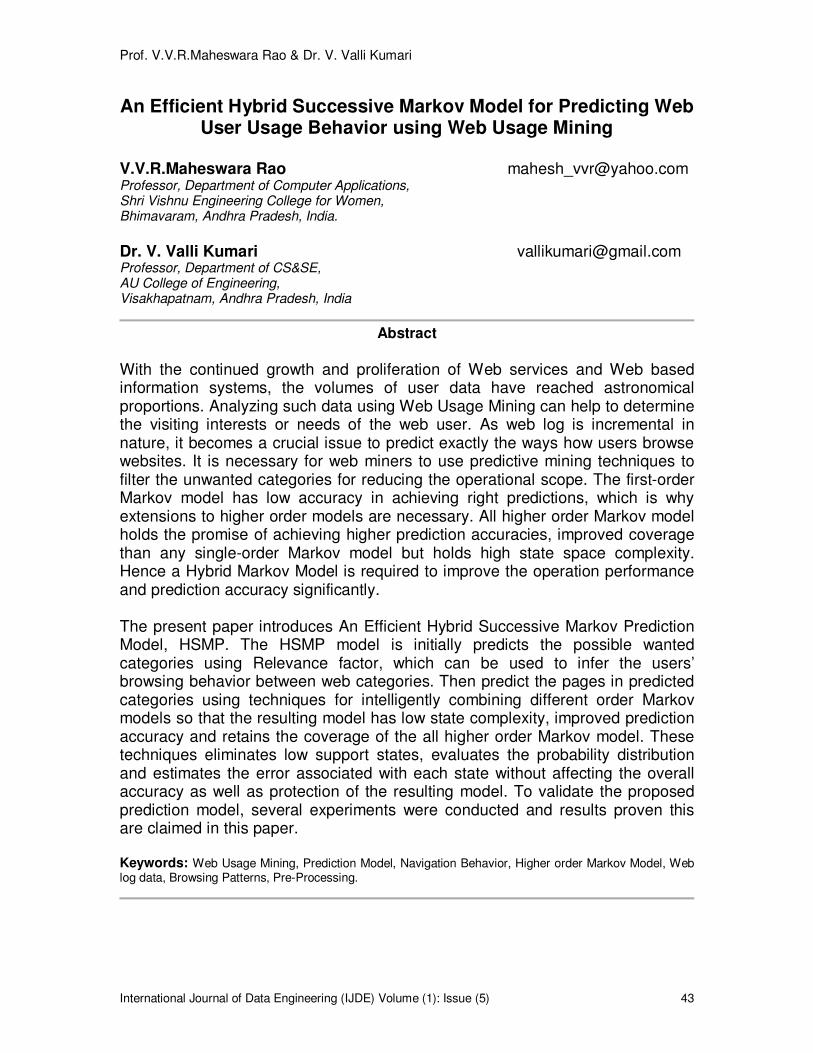
FIGURE 7: An example of a Hypothetical UPVM For association rule mining the ordering of pageviews in a transaction is not relevant, one can represent each user transaction as a vector over the n-dimensional space of pageviews. Given the transaction vector t (bold face lower case letter represents a vector) as:
where each ) for some j in {1, 2, ···, n}, if appears in the transaction t, and
otherwise. Thus, conceptually, the set of all user transactions can be viewed as an m×n
User-PageView Matrix, denoted by UPVM. An example of a hypothetical user-pageview matrix is depicted in Fig. 7. In this example, the weights for each pageview is the amount of time (e.g., in seconds) that a particular user spent on the pageview. An association or sequential pattern mining techniques can be applied on UPVM as described in example to obtain patterns and in turn these patterns are used to find important relationships among pages based on the navigational patterns of users in the site. As noted earlier, it is also possible to integrate other sources of knowledge, such as semantic information from the content of web pages with the web usage mining process. Generally, the characteristic from the content of web pages reflects behavior of web user. Each pageview p can be represented as an r-dimensional characteristics vector, where r is the total number of extracted characteristics from the site in a global dictionary. The vector, denoted by p, can be given by:
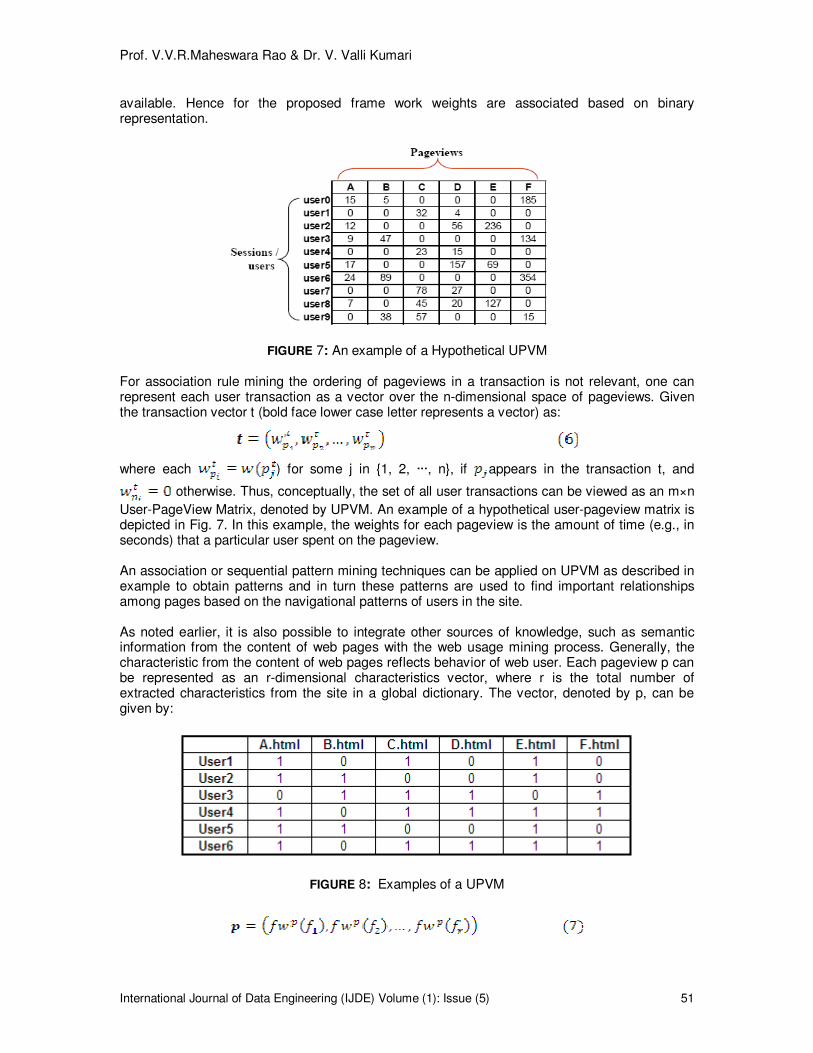
FIGURE 8: Examples of a UPVM
Prof. V.V.R.Maheswara Rao & Dr. V. Valli Kumari
International Journal of Data Engineering (IJDE) Volume (1): Issue (5) 52
Where is the weight of the jth characteristic in pageview p, for 1 ≤ j ≤ r. For the whole
collection of pageviews in the site, one can represent an n×r PageView - Characteristic Matrix
.
Concept of Transition Matrix of web categories: Step two of proposed prediction of categories model is to create the transition matrix of Markov model P, which is based on web log file as well as similarity matrix. The P matrix is first-order transition matrix of Markov model and it is presented as follows:
Each element in the P matrix presents a transition probability between any two categories. Pij presents a transition probability, which is calculated between category i and category j. The numerator is the number of transition times between category i and category j, and the denominator is the total number of transition times between category i and every category k. Design of Transition Matrix of web categories The integration process, involve the transformation of user transactions in UPVM into “content-enhanced” transactions containing the semantic characteristics of the pageviews. The goal of such a transformation is to represent each user session as a vector of characteristics rather than as a vector over pageviews. In this way, a user’s session reflects not only the pages visited, but also the significance of various characteristics that are relevant to the user’s interaction. While, in practice, there are several ways to accomplish this transformation, the most direct approach involves mapping each pageview in a transaction to one or more content characteristics. The range of this mapping can be representing the set of characteristics. Conceptually, the transformation can be viewed as the multiplication of UPVM with PVCM. The result is a new
matrix , where each ti is a r-dimensional vector over the set of
characteristics. Thus, a user transaction can be represented as a content characteristics vector, reflecting the user’s interests. As an example of content-enhanced transactions consider Fig.9 which shows a hypothetical matrix of user sessions (UPVM) as well as an index for the corresponding Web site conceptually represented as a term-pageview matrix (TPVM). Note that the transpose of this TPVM is the pageview-characteristic matrix (PVCM). The UPVM simply reflects the pages visited by users in various sessions. On the other hand, the TPVM represents the concepts that appear in each page. For simplicity the weights are assumed with binary values. The corresponding Characteristics-Enhanced Transaction Matrix CETM (derived by multiplying the UPVM and the transpose of the TPVM) is depicted in Fig. 10.
Prof. V.V.R.Maheswara Rao & Dr. V. Valli Kumari
International Journal of Data Engineering (IJDE) Volume (1): Issue (5) 53
FIGURE 9: Examples of TPVM
FIGURE 10: The Characteristics-Enhanced Transaction Matrix from matrices of Fig. 9 Concept of Relevance Matrix of web categories Step three of proposed prediction of categories model is to create the Relevance Matrix. The element Rij of relevance matrix is equal to product of Sij and Pij , which are acquired from similarity matrix and transition matrix of Markov model respectively. In this paper, the relevance is an important factor of prediction between any two categories. The relevance can be used to infer the users’ browsing behavior between categories. The relevance matrix is presented as follows:
Where
, presents a relevance, which is calculated, between category i at time t − n and category j at
time t. More high the value of means more relevance between category i and category j.
Design of Relevance Matrix of Web Categories: The above Transition Matrix shows, the significance of various characteristics that are relevant to the users interaction. If the content features include relevance attributes associated with categories on the Web, then the discovered patterns may reveal user interests at the deeper semantic level reflected in the underlying properties of the categories that are accessed by the users on the Web. For example, that users 4 and 6 are more interested in concepts related to DBMS material and Information Retrieval notes, while user 2 is more interested in Education category. Therefore, the integration of
Prof. V.V.R.Maheswara Rao & Dr. V. Valli Kumari
International Journal of Data Engineering (IJDE) Volume (1): Issue (5) 54
semantic content with Web usage mining can potentially provide a better understanding of the underlying relationships among categories.
FIGURE 11: Relevance Matrix 3.2. B. PREDICTION OF PAGES IN THE PREDICTED CATEGORIES A user navigation session within predicted category can be represented by the sequence of pages requested by the user. First-order Markov models have been widely used to model a collection of user sessions. In such context, each Web page in the category corresponds to a state in the model, and each pair of pages viewed in sequence corresponds to a state transition in the model. A transition probability is estimated by the ratio of the number of times the transition was traversed to the number of times the first state in the pair was visited. Usually, artificial states are appended to every navigation session to denote the start and finish of the session. A first-order Markov model is a compact way of representing a collection of sessions, but in most cases, its accuracy is low, which is why extensions to higher order models are necessary. In a higher order Markov model, a state corresponds to a fixed sequence of pages, and a transition between states represents a higher order conditional probability. For example, in a second-order model, each state corresponds to a sequence of two page views. The serious drawback of higher order Markov models is their exponentially large state space compared to lower order models. A Hybrid Successive Markov Prediction Model, HSMP is a model extension that allows variable length history to be captured. By the refined analysis on web page content of HSMP, it is possible to predict the association among the pages, and it can able to summarize web user usage behavior accurately. For example, each state definition can include a vector of keywords representing the contents of the corresponding Web page. As a result, it would be possible to identify high probability trails that are composed of pages that are relevant to a given topic. The proposed model illustrates sequence of increasing order Markov models with an example as below.
FIGURE 12: a. Sessions b. First-Order Model
Prof. V.V.R.Maheswara Rao & Dr. V. Valli Kumari
International Journal of Data Engineering (IJDE) Volume (1): Issue (5) 55
First-Order HSMP Model Construction Fig. 12.a shows an example of a collection of navigation sessions in category. The session start and finish at an artificial state; freq. denotes the number of times the corresponding sequence of pages was visited. Fig. 12.b presents the first-order model for these sessions. There is a state corresponding to each Web page and a link connecting every two pages viewed in sequence. For each state that corresponds to a Web page, give the page identifier and the number of times the page was viewed divided by the total number of page views. This ratio is a probability estimate for a user choosing the corresponding page from the set of all pages in the category. For example, page 4 has 22 page views from a total of 101 page views. For each link, indicates the proportion of times it was followed after viewing the anchor page. For example, page 5 was viewed 14 times, five of which were at the beginning of a navigation session. After viewing page 5, the user moved to page 6 in 7 of the 14 times and terminated the session seven times. The probability estimate of a trail is given by the product of the probability of the first state in the trail (that is, the initial probability) and the probabilities of the traversed links (that is, the transition probabilities). For example, the probability estimate for trail (3,4) is 21/101 * 10/21 = 0.099, and for trail (1, 3, 5), it is 11/101 * 9/12 * 9/21 = 0.035. Higher Order HSMP Model Construction The first-order model does not accurately represent all second-order conditional probabilities. For example, according to the input data, the sequence (1, 3) was followed nine times, that is, #(1, 3) = 9, and sequence (1, 3, 4) was followed twice, that is, #(1, 3, 4) = 2. Therefore, the probability estimate for viewing page 4 after viewing 1 and 3 in sequence is p(4|1,3) = #(1, 3, 4) / #(1, 3) = 9. The error of a first-order model in representing second-order probabilities can be measured by the absolute difference between the corresponding first and second-order probabilities. For example, for state 3, |p(4|1,3) – p(4|3)| = |2/9 – 10/21 | = 0.254 and |p(4|2,3) – p(4|3)| = |8/12 – 10/21| = 0.190. Thus, state 3 is not accurately representing second-order conditional probabilities. The accuracy of transition probabilities from a state can be increased by separating the in-paths to it that correspond to different conditional probabilities. To increase the accuracy in the example by cloning state 3 (that is, creating a duplicate state 3
1) and redirecting the link (2, 3)
to state 31. The weights of the out-links from states 3 and 3
1 are updated according to the number
of times the sequence of three states was followed. For example, since #(1, 3, 4) = 2 and #(1, 3, 5) = 7 in the second-order model, the weight of the link (3, 4) is 2 and the weight of (3, 5) is 7. The same method is applied to update the out-links from the clone state 3
1. Fig. 13 shows the resulting second-order model after cloning four states
in order to accurately represent all second-order conditional probabilities. In the extended model given in Fig. 13, all the out-links represent accurate second-order probability estimates. The probability estimate of the trail (1, 3, 5) is now 11/101 * 9/11 * 7/9 = 0.069. The probability estimate for trail (3, 4) is (9/101 * 2/9) + (12/101 * 8/12) = 0.099, which is equal to the first-order estimate. Therefore, the second-order model accurately models the conditional second-order probability estimates while keeping the correct first-order probability estimates. In order to provide control over the number of additional states created by the method, use of a parameter β that sets the highest admissible difference between a first-order and the corresponding second-order probability estimate. In a first-order model, a state is cloned if there is a second-order probability whose difference from the corresponding first-order probability is greater than β. Alternatively, to interpret β as a threshold for the average difference between the first-order and the corresponding second-order probabilities for a given state. In the later, the state is cloned if the average difference between the first and second-order conditional probabilities surpasses β. Moreover, if to set β > 0 and the state has three or more in-links, use of the Associations rules to identify in-links inducing identical conditional probabilities. When β is measuring the maximum probability of divergence, denote it by βm, and when it is measuring the average probability divergence, denote it by βa.
Prof. V.V.R.Maheswara Rao & Dr. V. Valli Kumari
International Journal of Data Engineering (IJDE) Volume (1): Issue (5) 56
FIGURE 13: Second-Order Model
The method to extend a model to higher orders is identical. N-order conditional probability estimates are compared to the corresponding lower order estimates, and cloning is applied to states that are not accurate in order to separate their n-state length in-paths. Experimental results showing that the running time is approximately linear with respect to the order of the model. The above two example shows that construction of first-order and second-order Markov model, one can construct the higher Markov model in the similar way at the expense of dramatic increase in state space complexity. To overcome this problem pruning models are introduced as below. 3.2. C. PRUNED MARKOV MODELS As discussed in the previous section, all high order Markov model holds the promise of achieving higher prediction accuracies and improved coverage than any single-order Markov model, at the expense of a dramatic increase in the state-space complexity. To overcome, develop techniques for intelligently combining different order Markov models so that the resulting model has low state complexity, improved prediction accuracy and retains the coverage of the all high order Markov model. Based on this observation, to start from the all high order Markov model and eliminate many of its states that are expected to have low prediction accuracy. This will allow reducing the overall state complexity without affecting the performance. The goals of this pruning step are primarily to reduce the state complexity and secondarily improve the prediction accuracy of the resulting model. Here the authors present three different schemes with an increasing level of complexity. The first scheme simply eliminates the states that have very low support. The second scheme uses statistical techniques to identify states for which the transition probabilities to the two most prominent actions are not statistically significant. Finally, the third scheme uses an error-based pruning approach to eliminate states with low prediction accuracy. Support-Pruned Markov Model The Support-Pruned Markov Model (SPMM) is based on the observation that states that have low support and low prediction accuracies. Consequently, these low support states can be eliminated without affecting the overall accuracy as well as coverage of the resulting model. The amount of pruning in the SPMM scheme is controlled by the parameter Ф referred to as the frequency threshold. In particular, SPMM eliminates all the states of the different order Markov models that are supported by fewer than Ф instances. First, the same frequency threshold is used for all the models regardless of their order. Second, this pruning policy is more likely to prune higher-order states as higher order states have less support; thus dramatically reducing the state-space complexity of the resulting scheme. Third, the
Prof. V.V.R.Maheswara Rao & Dr. V. Valli Kumari
International Journal of Data Engineering (IJDE) Volume (1): Issue (5) 57
frequency threshold parameter Ф specifies the actual number of instances that must be supported by each state and not the fraction of instances as it is often done in the context of association rule discovery. This is done primarily for the following two reasons: (i) the trust-worthiness of the estimated transition probabilities of a particular state depend on the actual number of instances and not on the relative number; (ii) the total number of instances is in general exponential on the order of the Markov model, thus the same fractional pruning threshold will have a completely different meaning for the different order Markov models. Confidence-Pruned Markov Model One of the limitations of the SPMM scheme is that it does not capture all the parameters that influence the accuracy of the state. In particular the probability distribution of outgoing actions from a state is completely ignored. For example, consider a Markov state which has two outgoing actions/branches, such that one of them is substantially more probable than the other. Even if the overall support of this state is somewhat low, the predictions computed by this state will be quite reliable because of the clear difference in the outgoing probabilities. On the other hand, if the outgoing probabilities in the above example are very close to each other, then in order for that difference to be reliable, they must be based on a large number of instances. Ideally, the pruning scheme not only considers the support of the state but also weigh the probability distribution of the outgoing actions before making its pruning decisions. This observation is to develop the confidence-pruned Markov model (CPMM) scheme. CPMM uses statistical techniques to determine for each state, if the probability of the most frequently taken action is significantly different from the probabilities of the other actions that can be performed from this state. If the probability differences are not significant, then this state is unlikely to give high accuracy and it is pruned. In contrast, if the probability differences are significant the state is retained. The CPMM scheme determines if the most probable action is significantly different than the second most probable action by computing the 100(1-α) percent confidence interval around the most probable action and checking if the probability of the second action falls within that interval. If this is true, then the state is pruned, otherwise it is retained. If is the probability of the most
probable action, then its 100(1- α ) percent confidence interval is given by
− α/2 ≤ ≤ + α/2
where zα/2 = 2 is the upper α/2 percentage point of the standard normal distribution and n is the frequency of the Markov State. The degree of pruning in CPMM is controlled by α (confidence coefficient). As the value of α decrease the size of the confidence interval increases, resulting in more pruning. Also note that if a state has a large number of examples associated with it, then Equation 9 will compute a tighter confidence interval. As a result, even if the difference in the probabilities between the two most probable actions is relatively small, the state will most likely be retained. Error-Pruned Markov Model In the previous schemes either the support of a state or the probability distribution of its outgoing branches to gauge the potential error associated with it. However, the error of each state can be also automatically estimated and used to decide whether or not to prune a particular state. A widely used approach to estimate the error associated with each state is to perform a validation step. During the validation step, the entire model is tested using validation set that was not used during the model building phase. Since the actual actions performed by the sequences in the validation set, can easily determine the error-rates and use them for pruning. To develop the Error Pruned Markov Model (EPMM) scheme, two different error-based pruning strategies that use a different definition as to what constitutes the error-rate of a Markov state. To refer these schemes as overall error pruning and individual error pruning.
Prof. V.V.R.Maheswara Rao & Dr. V. Valli Kumari
International Journal of Data Engineering (IJDE) Volume (1): Issue (5) 58
First, for each sequence in the validation set use each one of the single-order Markov models to make a prediction. Record each prediction whether that is correct or not. Once all the sequences in the validation set have been predicted, use these prediction statistics to calculate the error-rate of each state. Next for each state of the highest-order Markov model, identify the set of states in the lower-order models that are its proper subsets. For example, if the higher-order state corresponds to the action-sequence {a5, a3, a6, a7}, then the lower-order states that are identified are {a3, a6, a7} (third-order), {a6, a7} (second-order) and {a7} (first-order). Now if the error-rate of the higher-order state is higher than any of its subset lower-order sates, it is pruned. The same procedure of identifying the subset sates and comparing their error-rates is repeated for all the states in the lower-order Markov models as well, except the first-order Markov model. The states form the first-order Markov model is never pruned so as not to reduce the coverage of the resulting model. In the second scheme, at first iterate over all the higher-order states, and for each of them find its subset states (as described in the previous scheme). Then, identify all the examples in the validation set that can be predicted using the higher-order state (i.e., the validation examples which have a sequence of actions corresponding to the higher-order state). This set of examples is then predicted by the higher-order state and its subset states and the error-rates on these examples for each one of the states are computed. If the error-rate of the higher-order state is greater than any of its subset states, the higher-order Markov state is pruned. The same procedure is repeated for all the lower-order Markov models except the first-order Markov model. Though both schemes follow a similar procedure of locating subset states and pruning the ones having high error rates, they differ on how the error-rates for each state are computed. In the first scheme, every lower-order Markov state has a single error-rate value that is computed over the entire validation set. In the second scheme, each of the lower-order Markov states will have many error-rate values as it will be validated against a different set of examples for each one of its superset higher-order states. These techniques introduced by the authors, combining intelligently different order Markov models reduce state complexity and improves prediction accuracy. As a result HSMP have the high operational performance towards predicting the web user usage behavior.
4. EXPERIMENTAL ANALYSIS
The server side web log data is experimented over a period of six months under standard execution environment. In the preprocessing stage erroneous and image requests were eliminated, set a session length limit of requests and therefore very long sessions were split in to two or more shorter session. The total size of 238 requests made by a single user is 2.14 MB. Out of that the size of requests like .gif, .jpg, .css, .dll and so on is 1.3 MB (61%). Hence cleansing is an important phase in the process of pre processing and reduces the human user accesses web log by 60% approximately. From the collection of sessions, a first-order model was inferred. This model was then evaluated for second and higher order conditional probabilities and, if needed, a state was cloned to separate the in-paths due to differences in the conditional probabilities. As described above, the β parameter sets the tolerance allowed on representing the conditional probabilities. In addition, there is a parameter that specifies the minimum number of times a page has to be requested in order to be considered for cloning. In these experiments, we set num visits ≥ 30. Fig. 14 shows the variation of the model number of states when the order of the model increases while having the accuracy threshold set to β = 0.
Prof. V.V.R.Maheswara Rao & Dr. V. Valli Kumari
International Journal of Data Engineering (IJDE) Volume (1): Issue (5) 59
FIGURE 14: Performance comparison of Different order Markov Models w.r.t. No. of States
A) The HSMP model compared with the 1st, 2
nd, 3
rd and 4
th order Markov Models with respective
number of states. The experimental results indicate that the higher order Markov Models, the number of states increases at a slower rate, which is an indication of gain in accuracy as shown in Fig 14.
FIGURE 15: . Performance comparison of Different order Markov Models w.r.t. Overlap
B) The HSMP model compared with the 1
st, 2
nd, 3
rd and 4
th order Markov Models with respective
overlap. The experimental results indicate closed to linear decrease as length of trails increases. as shown in Fig 15.
Prof. V.V.R.Maheswara Rao & Dr. V. Valli Kumari
International Journal of Data Engineering (IJDE) Volume (1): Issue (5) 60
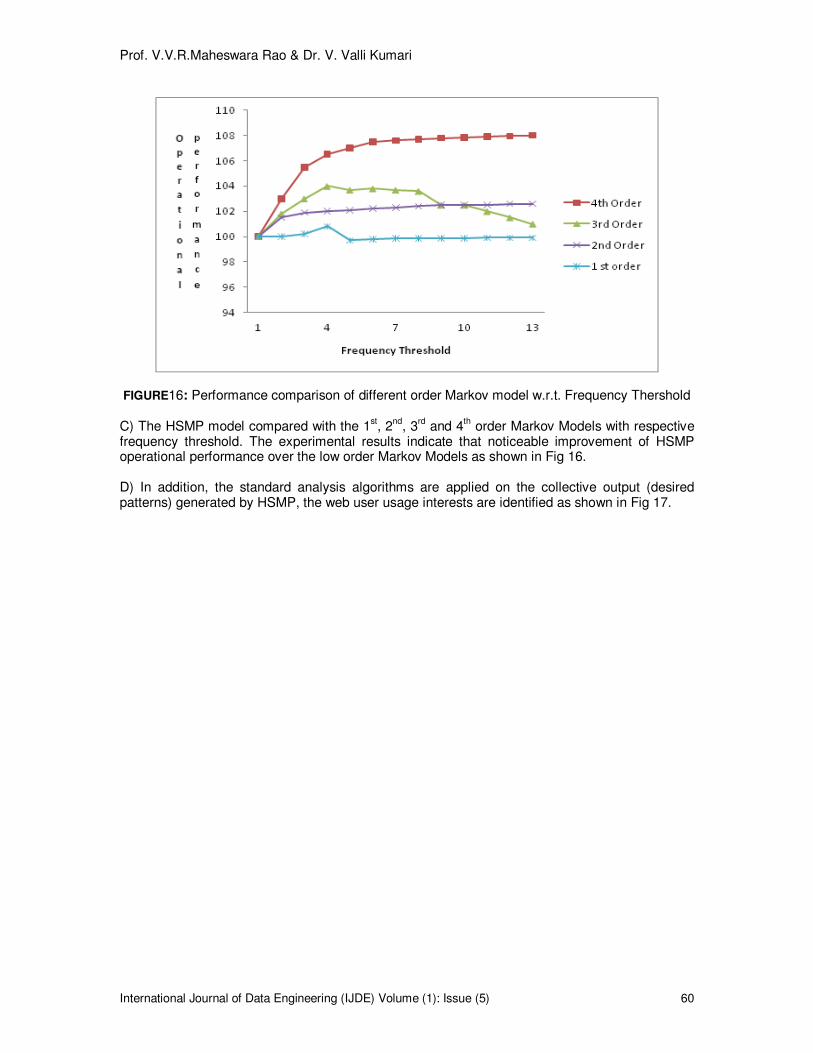
FIGURE16: Performance comparison of different order Markov model w.r.t. Frequency Thershold C) The HSMP model compared with the 1
st, 2
nd, 3
rd and 4
th order Markov Models with respective
frequency threshold. The experimental results indicate that noticeable improvement of HSMP operational performance over the low order Markov Models as shown in Fig 16.
D) In addition, the standard analysis algorithms are applied on the collective output (desired patterns) generated by HSMP, the web user usage interests are identified as shown in Fig 17.
Prof. V.V.R.Maheswara Rao & Dr. V. Valli Kumari
International Journal of Data Engineering (IJDE) Volume (1): Issue (5) 61
0 200 400 600 800 1000 1200 1400 1600
Windows XP
Genetic Algorithms
Microsoft Active Directory
Security Notes
Foot ball Players
Testing Methodologies
Information Retrieval Notes
DBMS Meterial
Intelligence
Oracle Applications
Education
Marketing
Business
Data Mining
Web Mining
Time Interval
Co
nte
nt
Typ
e
Web user interests
Total Bytes
FIGURE 17: Web User Usage interests
5. CONSLUSION & FUTURE WORK
Because of the huge quantity of data of web pages on many portal sites, for convenience, are to assemble the web page based on category. In this paper, users’ browsing behavior will be predicted at two levels to meet the nature of the navigation. One is category stage and the other is web page stage. In stage one is to predict category. The unnecessary categories can be excluded. The scope of calculation is massively reduced. Next, using pruned Markov models using higher order in the level two to predict the users’ browsing page is more effectively and high operational performance. The results of experiment prove the low state complexity and predictive power is well in both stages. Even though these techniques are developed in the context of web usage data, we have successfully used these techniques for prediction in different applications, as well.
6. REFERENCES
1. M. Spiliopoulou, “Web Usage Mining for Site Evaluation,” Comm. ACM, vol. 43, no. 8, 2000, pp. 127–134.
2. M. Eirinaki, M. Vazirgiannis, and D. Kapogiannis, “Web Path Recommendations Based on Page Ranking and Markov Models,” Proc. Seventh Ann. ACM Int’l Workshop Web Information and Data Management (WIDM ’05), pp. 2-9, 2005.
3. S. Schechter, M. Krishnan, and M. Smith, Using Path Profiles to Predict HTTP Requests,” Computer Networks and ISDN Systems, vol. 30, pp. 457-467, 1998.
4. X. Chen and X. Zhang, “A Popularity-Based reduction Model for Web Pre fetching,” Computer, pp. 63-70, 2003.
Prof. V.V.R.Maheswara Rao & Dr. V. Valli Kumari
International Journal of Data Engineering (IJDE) Volume (1): Issue (5) 62
5. R. Walpole, R. Myers, S. Myers and K. Ye, “Probability and Statistics for Engineers and Scientists,” in Paperback, 7 ed., Pearson Education, 2002, pp.82-87.
6. R. M. Suresh and R. Padmajavalli,” An Overview of Data Preprocessing in Data and Web Usage Mining,” Digital Information Management IEEE, pp. 193-198, 2006.
7. Yan Wang,Web Mining and Knowledge Discovery of Usage Patterns, February, 2000.
8. R. Cooley, B. Mobasher, and J. Srivastava. Web mining: Information and pattern discovery on the World Wide Web. In Proceedings of the 9th IEEE International Conference on Tools with Artificial Intelligence (ICTAI’97), 1997.
9. M.-S. Chen, J.S. Park, and P.S. Yu., “Efficient Data Mining for Path Traversal Patterns,” IEEE Trans. Knowledge and Data Eng., vol. 10, no. 2, 1998.
10. M. S. Chen, J. S. Park and P. S. Yu, “Efficient Data Mining for Path Traversal Patterns in a Web Environment”, IEEE Transaction on Knowledge and Data Engineering, 1998.
11. Wang Shachi, Zhao Chengmou. Study on Enterprise Competitive Intelligence System.[J]. Science Technology and Industrial, 2005.
12. Tsuyoshi, M and Saito, K. Extracting User’s Interest for Web Log Data. Proceeding of IEEE/ACM/WIC International Conference on Web Intelligence (WI’06), 2006.
13. UCI KDD archive, http://kdd.ics.uci.edu/.
14. M. Deshpande and G. Karypis, “Selective Markov Models for Predicting Web Page Accesses,” ACM Trans. Internet Technology, vol. 4, pp. 163-184, May 2004.
15. J. Borges and M. Levene, “Testing the Predictive Power of Variable History Web Usage,” J. Soft Computing, special issue on Web intelligence, 2006.
16. Proceedings of the IEEE International Conference on Tools with Artificial Intelligence, 1999.
17. M. S. Chen, J. S. Park and P. S. Yu, “Efficient Data Mining for Path Traversal Patterns in a Web Environment”, IEEE Transaction on Knowledge and Data Engineering, 1998.
18. M. Craven, S. Slattery and K. Nigam, “First-Order Learning for Web Mining”, In Proceedings of the 10th European Conference on Machine Learning, Chemnitz, 1998.
19. Tsuyoshi, M and Saito, K. Extracting User’s Interest for Web Log Data. Proceeding of IEEE/ACM/WIC International Conference on Web Intelligence (WI’06), 2006.


![A Successive Lumping Procedure for a Class of …mnk/papers/2011_ssl.pdfA Successive Lumping Procedure for a Class of Markov Chains ... Frostig [3], Hooghiemstra and Koole [4] as well](https://static.documents.pub/doc/80x56/5b39d22c7f8b9a40428ef0c9/a-successive-lumping-procedure-for-a-class-of-mnkpapers2011sslpdfa-successive.jpg)


