48
An Efficient Multicast Protocol for Content-Based Publish-Subscribe Systems João Nogueira Tecnologias de Middleware DI - FCUL - Dez 2006

An Efficient Multicast Protocol for Content-Based Publish-Subscribe Systems
João Nogueira
Tecnologias de Middleware
DI - FCUL - Dez 2006

Agenda
• Motivation
• Key Issues
• The Matching Algorithm
• The Link Matching Algorithm
• Implementation and Performance

Motivation
• Earliest publish-subscribe systems were subject-based:
• Each unit of information (an event) is classified as belonging to one of a fixed set of subjects (groups, channels or topics)
• An emerging alternative is content-based subscription:
• Subscribers have the added flexibility of of choosing filtering criteria along multiple dimensions, they are not limited to a set of subjects and the pre-definition of that set is not required
• This reduces the overhead of defining and maintaining a large number of groups, thereby making the system easier to manage
• It is more general than the subject-based approach and can be used to implement it
• Implementations of such systems have previously not been developed

Key Issues
• In order to implement a content-based publish-subscribe system, two key problems must be solved:
• The problem of efficiently matching en event against a large number of subscribers on a single event broker
• The problem of efficiently multicasting events within a network of event brokers. This problem becomes crucial in two settings:
• When the pub/sub system is geographically distributed and event brokers are connected via a relatively low-speed WAN
• When the pub/sub system has the scale to support a large number of publishers, subscribers and events.
• In both cases, it becomes crucial to limit the distribution of a published event to only those brokers that have subscribers interested in that event

Key Issues (2)
• There are two straightforward approaches to solving the multicasting problem for content-based systems:
• The match-first approach, where the event is first matched against all subscriptions, thus generating a destination list and the event is then routed to all entries on this list
• The flooding approach, where the event is broadcast, or flooded, to all destinations using standard multicast and unwanted events are then filtered out at these destinations
• Both approaches may work well in small systems but can be inefficient in large ones:
• The contribution of this work is a new distributed algorithm - link matching - introducing an efficient solution to the multicast problem.
• The intuition is that each broker should perform just enough of the matching work to determine which neighbouring brokers should receive the event
The Matching Algorithm
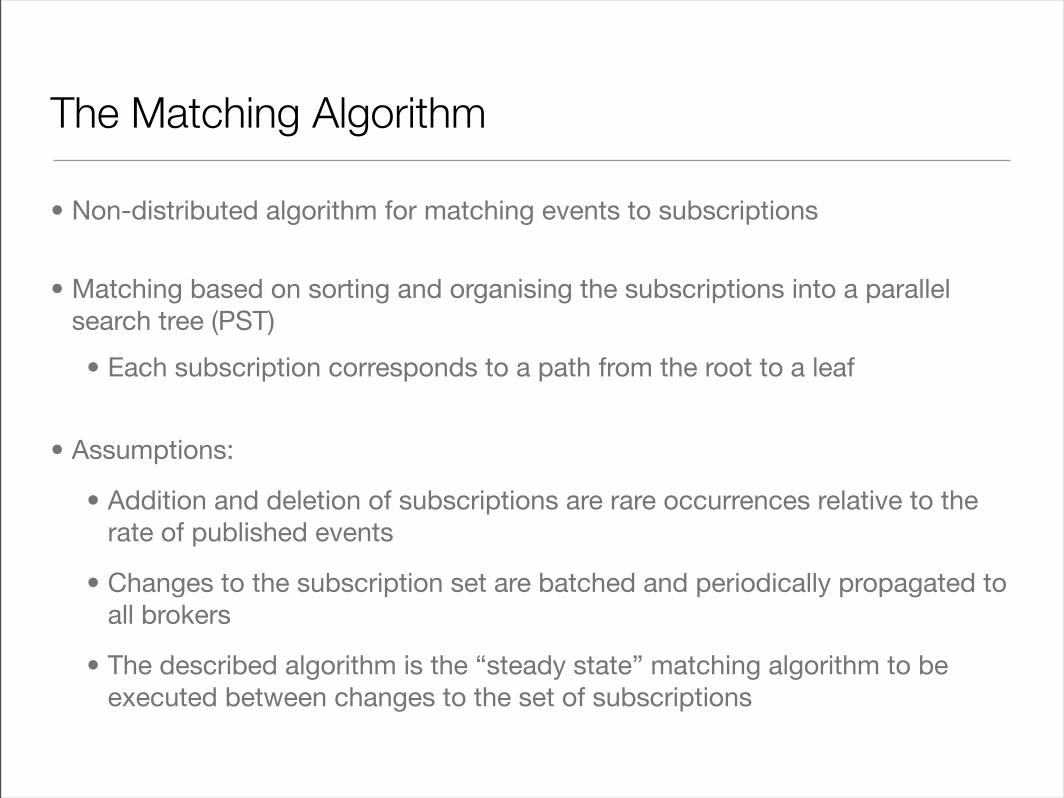
• Non-distributed algorithm for matching events to subscriptions
• Matching based on sorting and organising the subscriptions into a parallel search tree (PST)
• Each subscription corresponds to a path from the root to a leaf
• Assumptions:
• Addition and deletion of subscriptions are rare occurrences relative to the rate of published events
• Changes to the subscription set are batched and periodically propagated to all brokers
• The described algorithm is the “steady state” matching algorithm to be executed between changes to the set of subscriptions

The Matching AlgorithmHow it works
• Given a parallel search tree (PST), the matching algorithm proceeds as follows:
• It starts at the root of the PST with attribute a1
• At any non-leaf node of the tree, we find value vj of the current attribute aj
• We then transverse any of the following edges that apply:
• The edge labelled vj if there’s one, and
• The edge labelled * if there’s one
• This may lead to either 0, 1 or 2 successor nodes (or more if the tests are not strict equalities)
• We then initiate parallel sub-searches at each successor node
• When one search reaches a leaf, all the subscriptions in that leaf are added to the list of matching subscriptions
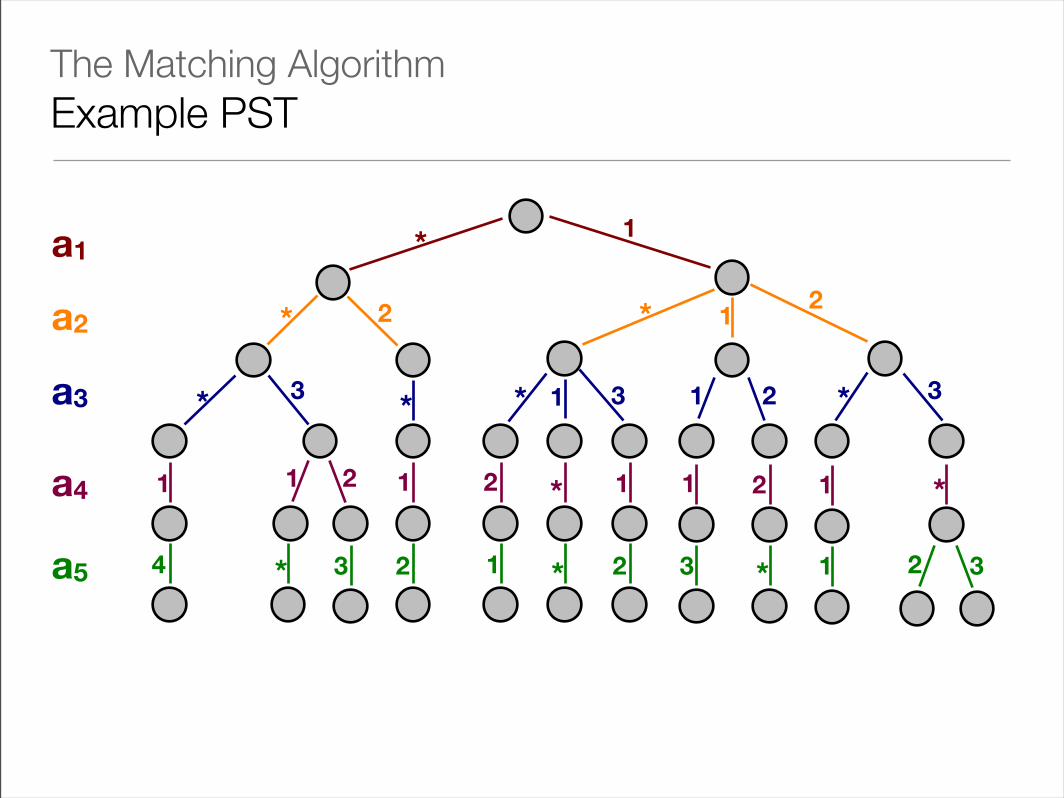
The Matching AlgorithmExample PST
*
*
*
*
* *
*
*
*
**
*
1
1
1
1 1
1
1
1
11 1
2 2
2
2
2
2
2
2
3 3 3
33 1 3 2
4
a1
a2
a3
a4
a5

The Matching AlgorithmExample PST
*
*
*
*
* *
*
*
*
**
*
1
1
1
1 1
1
1
1
11 1
2 2
2
2
2
2
2
2
3 3 3
33 1 3 2
4
a1
a2
a3
a4
a5
(a1=1 && a2=2 && a3=3 && a5=3)

The Matching AlgorithmExample PST
*
*
*
*
* *
*
*
*
**
*
1
1
1
1 1
1
1
1
11 1
2 2
2
2
2
2
2
2
3 3 3
33 1 3 2
4
a1
a2
a3
a4
a5

The Matching AlgorithmExample PST
*
*
*
*
* *
*
*
*
**
*
1
1
1
1 1
1
1
1
11 1
2 2
2
2
2
2
2
2
3 3 3
33 1 3 2
4
a1
a2
a3
a4
a5
a = <1, 2, 3, 1, 2>

The Matching AlgorithmConsiderations
• Other types of tests (besides equality) are also possible
• The way in which attributes are ordered from root to leaf in the PST can be arbitrary
• The implemented system performs better if the attributes near the root are chosen to have the fewest number of subscriptions labelled with a *
• The cost of the matching algorithm increases less than linearly with the number of subscriptions
The Matching AlgorithmOptimisations
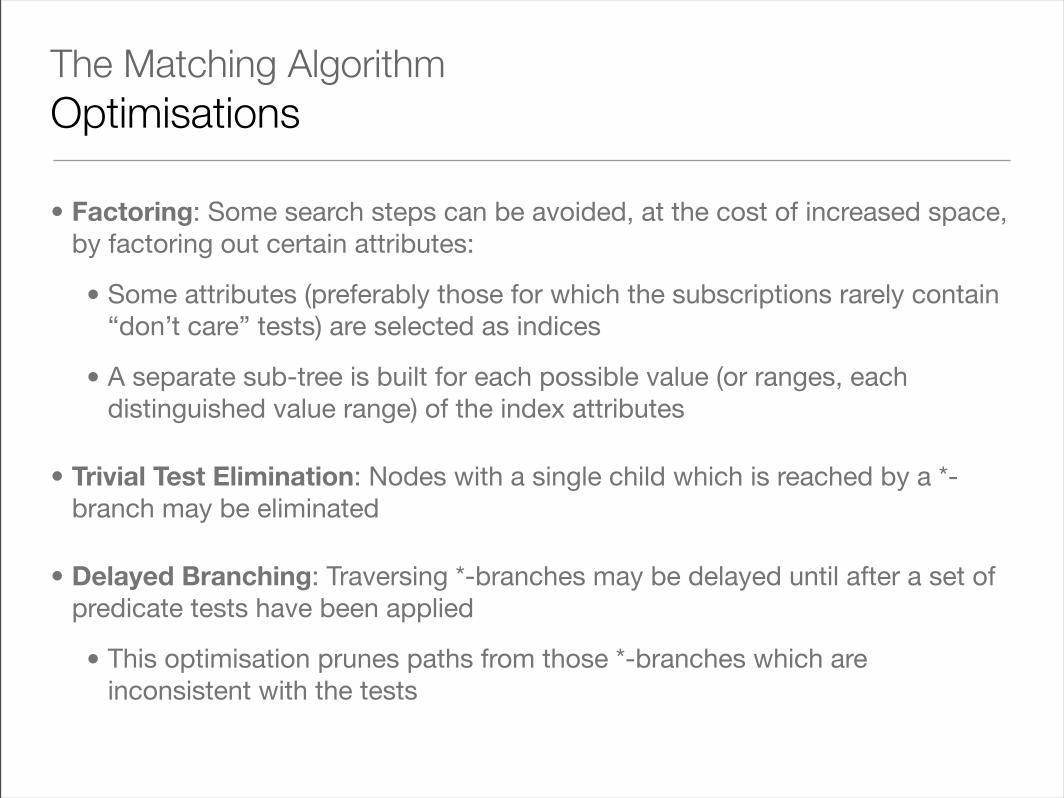
• Factoring: Some search steps can be avoided, at the cost of increased space, by factoring out certain attributes:
• Some attributes (preferably those for which the subscriptions rarely contain “don’t care” tests) are selected as indices
• A separate sub-tree is built for each possible value (or ranges, each distinguished value range) of the index attributes
• Trivial Test Elimination: Nodes with a single child which is reached by a *-branch may be eliminated
• Delayed Branching: Traversing *-branches may be delayed until after a set of predicate tests have been applied
• This optimisation prunes paths from those *-branches which are inconsistent with the tests

The Link-Matching Algorithm
• Distributed matching algorithm for a network of brokers and publishing and subscribing clients
• After receiving an event, each broker performs just enough matching steps to determine which of its neighbours should receive it
• A broker is connected to its neighbours (brokers or clients) through links
• Therefore, rather than determining which subset of all subscribers is to receive the event, computes the subset of its neighbours that is to receive the event instead
• i.e. determines those links along which it should transmit the event
The Link-Matching AlgorithmHow it works
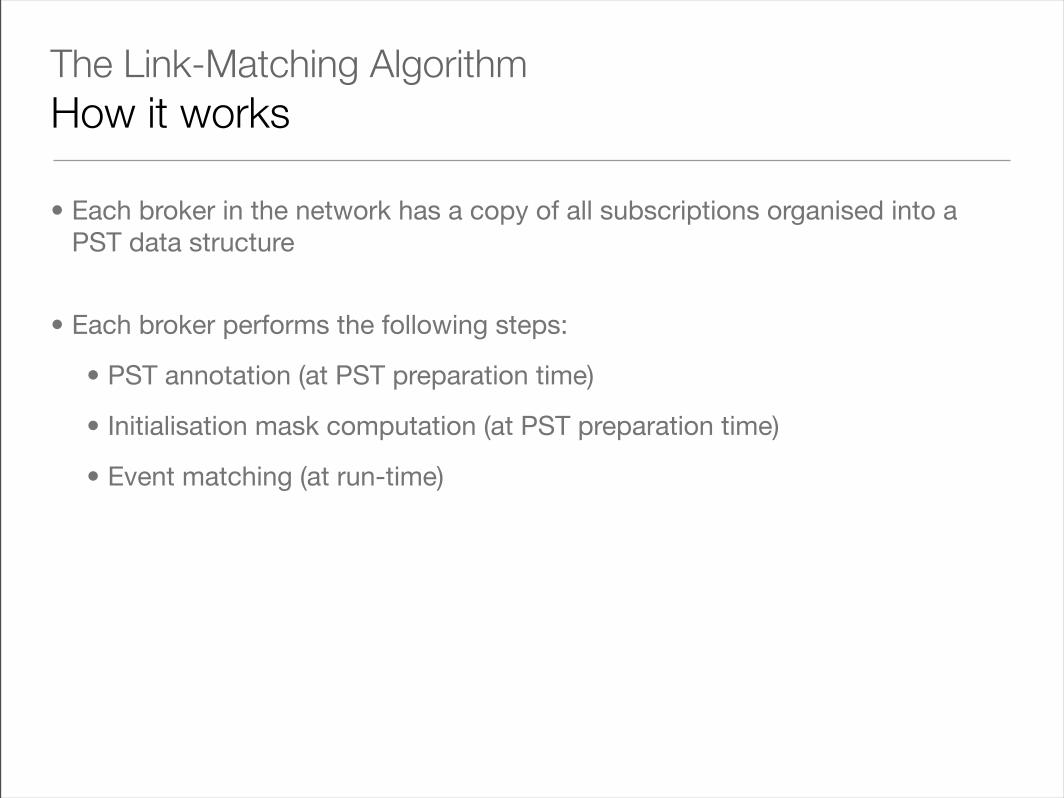
• Each broker in the network has a copy of all subscriptions organised into a PST data structure
• Each broker performs the following steps:
• PST annotation (at PST preparation time)
• Initialisation mask computation (at PST preparation time)
• Event matching (at run-time)
The Link-Matching AlgorithmPST Annotation
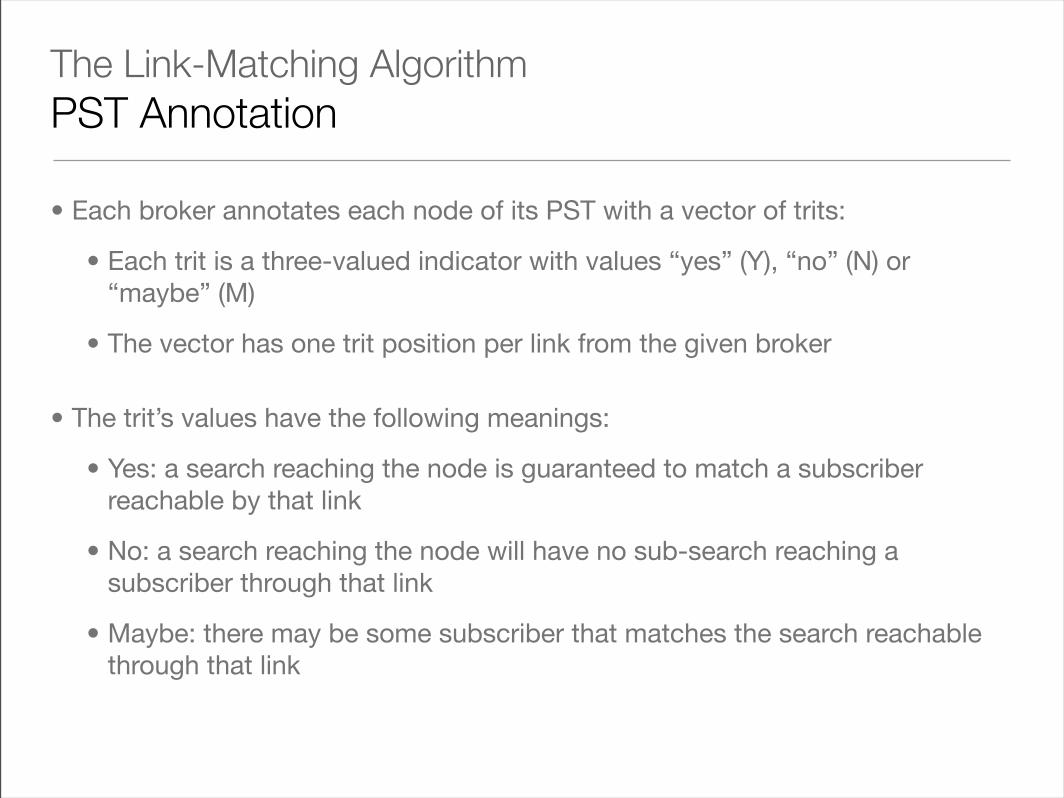
• Each broker annotates each node of its PST with a vector of trits:
• Each trit is a three-valued indicator with values “yes” (Y), “no” (N) or “maybe” (M)
• The vector has one trit position per link from the given broker
• The trit’s values have the following meanings:
• Yes: a search reaching the node is guaranteed to match a subscriber reachable by that link
• No: a search reaching the node will have no sub-search reaching a subscriber through that link
• Maybe: there may be some subscriber that matches the search reachable through that link
The Link-Matching AlgorithmPST Annotation (2)
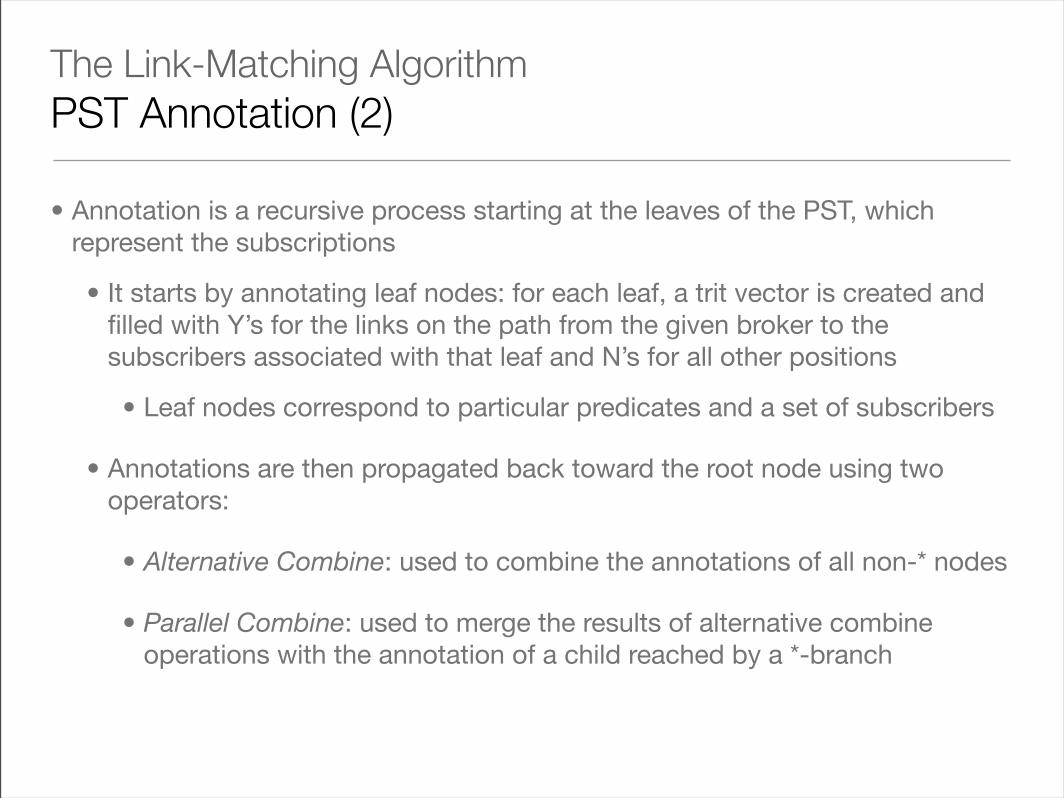
• Annotation is a recursive process starting at the leaves of the PST, which represent the subscriptions
• It starts by annotating leaf nodes: for each leaf, a trit vector is created and filled with Y’s for the links on the path from the given broker to the subscribers associated with that leaf and N’s for all other positions
• Leaf nodes correspond to particular predicates and a set of subscribers
• Annotations are then propagated back toward the root node using two operators:
• Alternative Combine: used to combine the annotations of all non-* nodes
• Parallel Combine: used to merge the results of alternative combine operations with the annotation of a child reached by a *-branch
The Link-Matching AlgorithmPST Annotation (3)
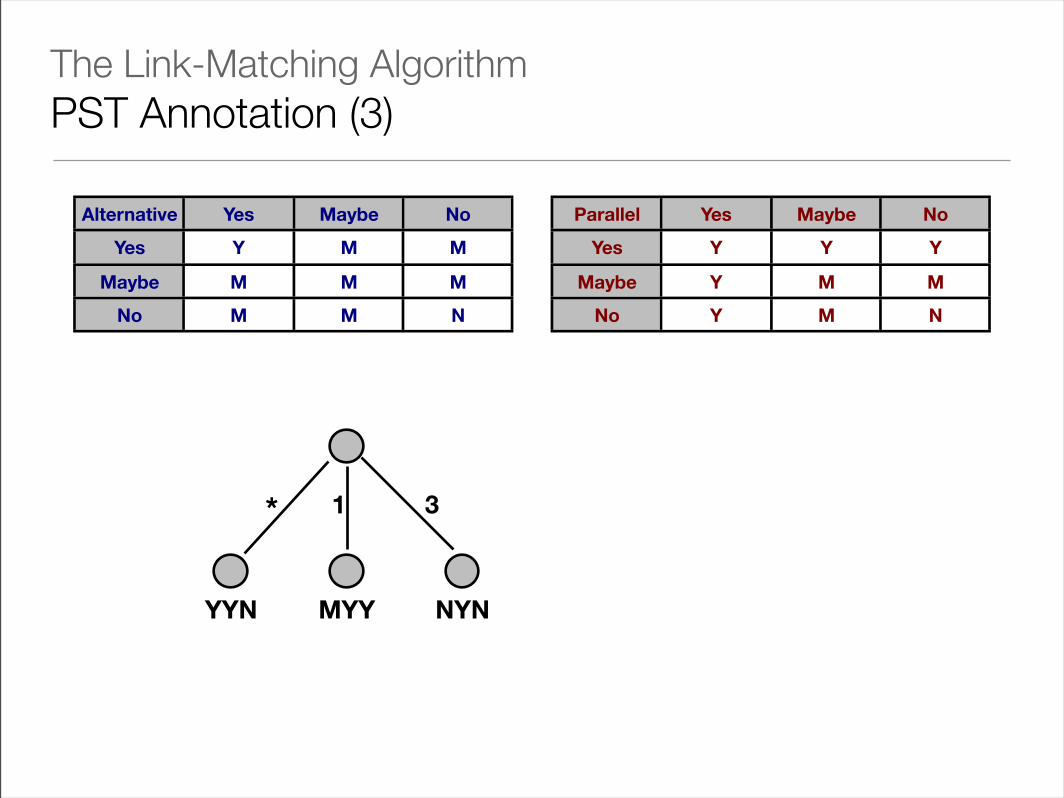
Alternative Yes Maybe No
Yes Y M M
Maybe M M M
No M M N
Parallel Yes Maybe No
Yes Y Y Y
Maybe Y M M
No Y M N
* 1 3
MYY NYNYYN

The Link-Matching AlgorithmPST Annotation (3)
Alternative Yes Maybe No
Yes Y M M
Maybe M M M
No M M N
Parallel Yes Maybe No
Yes Y Y Y
Maybe Y M M
No Y M N
* 1 3
MYY NYNYYN
MYY A NYN = MYM

The Link-Matching AlgorithmPST Annotation (3)
Alternative Yes Maybe No
Yes Y M M
Maybe M M M
No M M N
Parallel Yes Maybe No
Yes Y Y Y
Maybe Y M M
No Y M N
* 1 3
MYY NYNYYN
YYM
MYY A NYN = MYM
MYM P YYN = YYM

The Link-Matching AlgorithmPST Annotation (4)
YYM
YYMYYM
MYM
NYN
YYN
MYM
YYN
YNN NYN YYN
MMM
YYN NNY
YYM
NYN YYM
YYN NYN
YYN
YYN YNN NYN YYN
YNN NYN YYN
YYN NNY
YYN NNY
NYN
NYN
YYM
YYN YYYYYN NYN YYN
NYN
NYN
*
*
*
*
* *
*
*
*
**
*
1
1
1
1 1
1
1
1
11 1
22
2
2
2
2
2
2
3 3 3
33 1 3 2
4

The Link-Matching AlgorithmInitialisation Mask Computation
• Assumptions
• Each broker knows the topology of the broker network as well as the best paths between each broker and each destination (i.e. subscriber)
• From this topology, each broker constructs a routing table mapping each possible destination to the link which is the next hop along the best path to the destination
• The broker knows the set of spanning trees, only one of which will ever be used for each publisher
• At most, there will be one spanning tree for each broker that has publisher neighbours

The Link-Matching AlgorithmInitialisation Mask Computation (2)
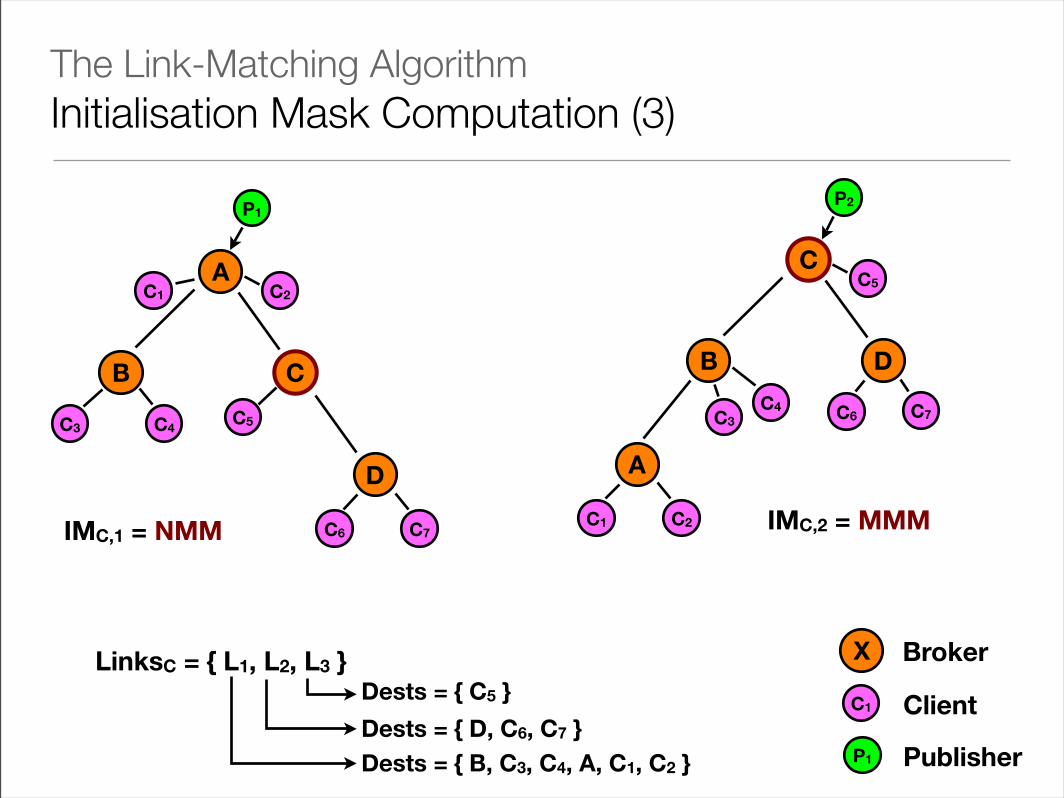
• Using these best paths and spanning trees, each broker computes the downstream destinations for each spanning tree
• A destination is downstream from a broker when it is a descendant of the broker on the spanning tree
• Each broker then associates each spanning tree with an initialisation mask: one trit per link
• The trit for link l has value M if at least one of the destinations routable via l is a descendant of the broker in the spanning tree, or N otherwise
• The significance of the mask is that an event arriving at a broker should only be propagated along those links leading away from the publisher
• These will begin with a mask of M
The Link-Matching AlgorithmInitialisation Mask Computation (3)
A
C
D
B
X
C2C1
C3 C4C5
C6 C7
C
D
A
B
C5
C6C3C4 C7
C1 C2
P1
C1
P1
Broker
Client
Publisher
P2
LinksC = { L1, L2, L3 }
Dests = { B, C3, C4, A, C1, C2 }Dests = { D, C6, C7 }
Dests = { C5 }
IMC,1 = NMM IMC,2 = MMM
The Link-Matching AlgorithmMatching Events
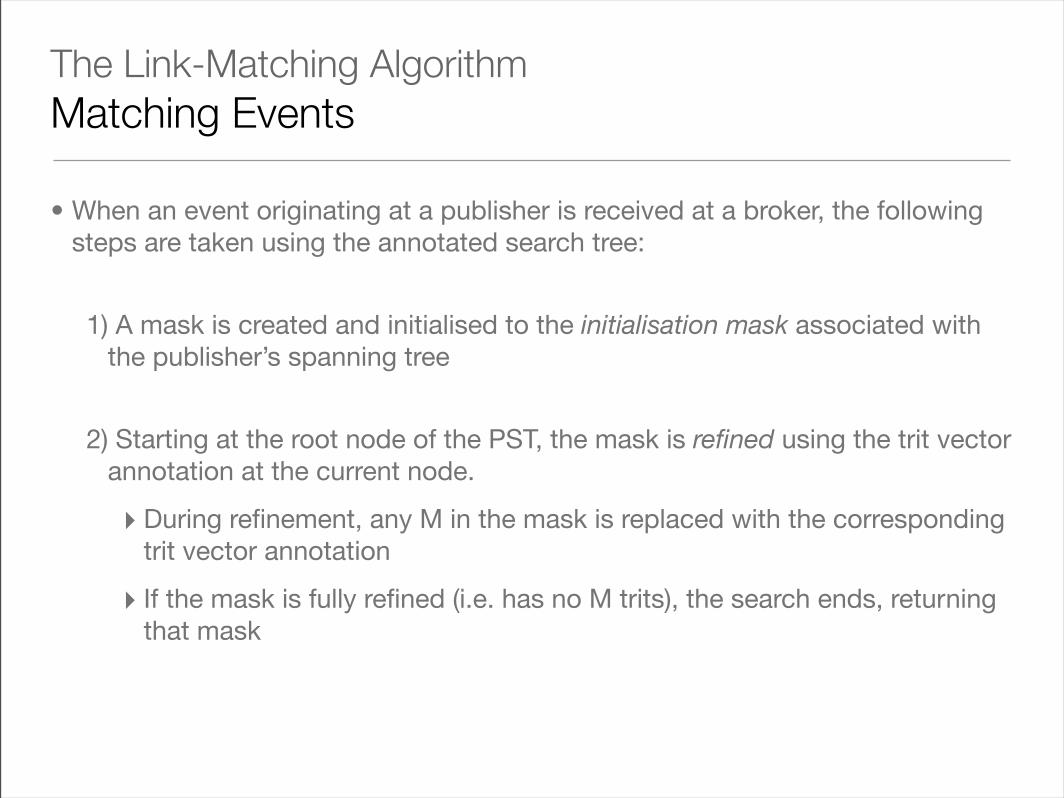
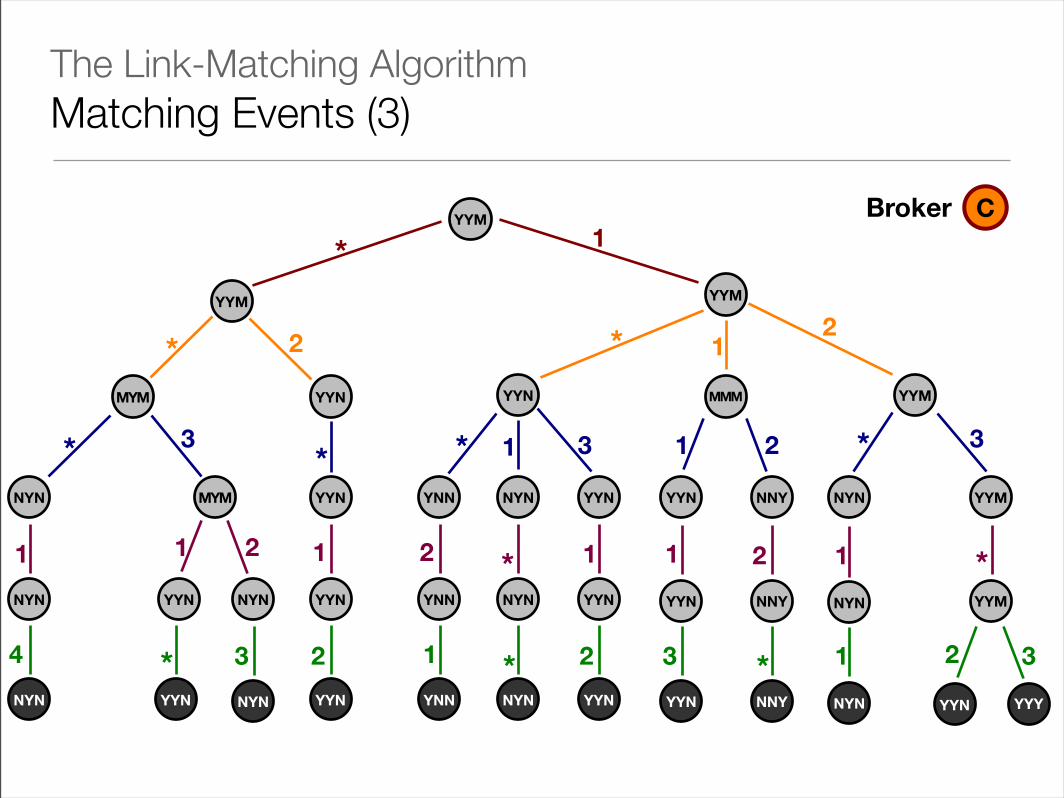
• When an event originating at a publisher is received at a broker, the following steps are taken using the annotated search tree:
1) A mask is created and initialised to the initialisation mask associated with the publisher’s spanning tree
2) Starting at the root node of the PST, the mask is refined using the trit vector annotation at the current node.
‣ During refinement, any M in the mask is replaced with the corresponding trit vector annotation
‣ If the mask is fully refined (i.e. has no M trits), the search ends, returning that mask

The Link-Matching AlgorithmMatching Events (2)
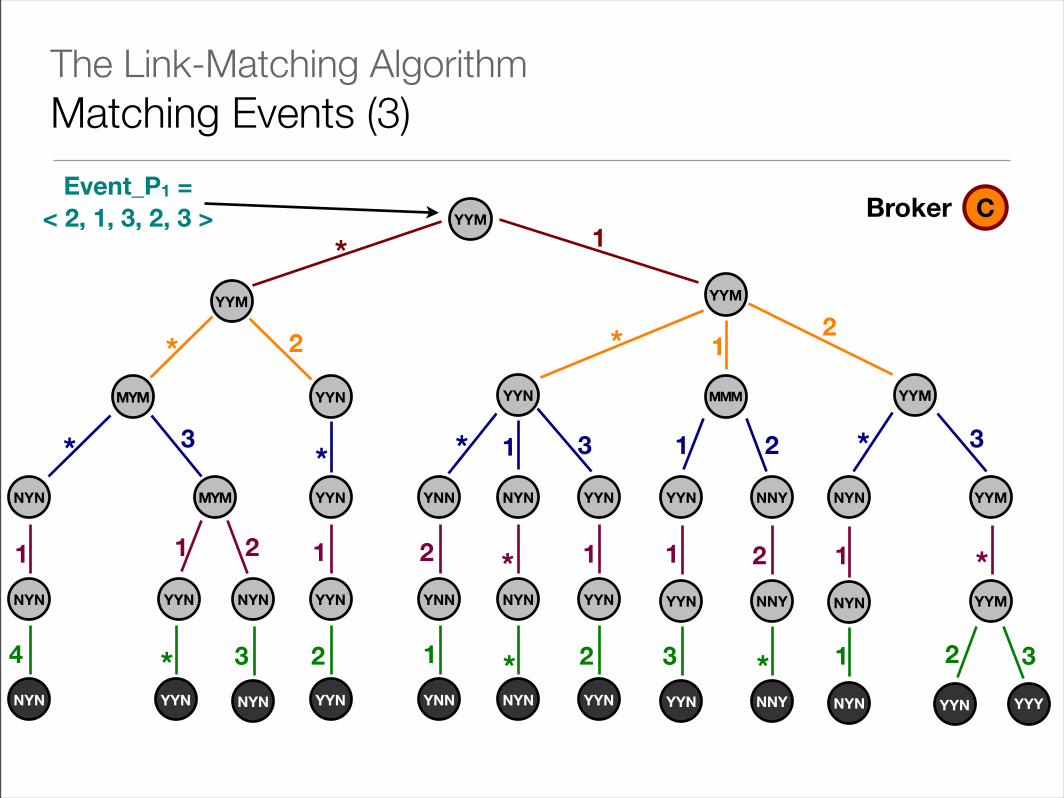
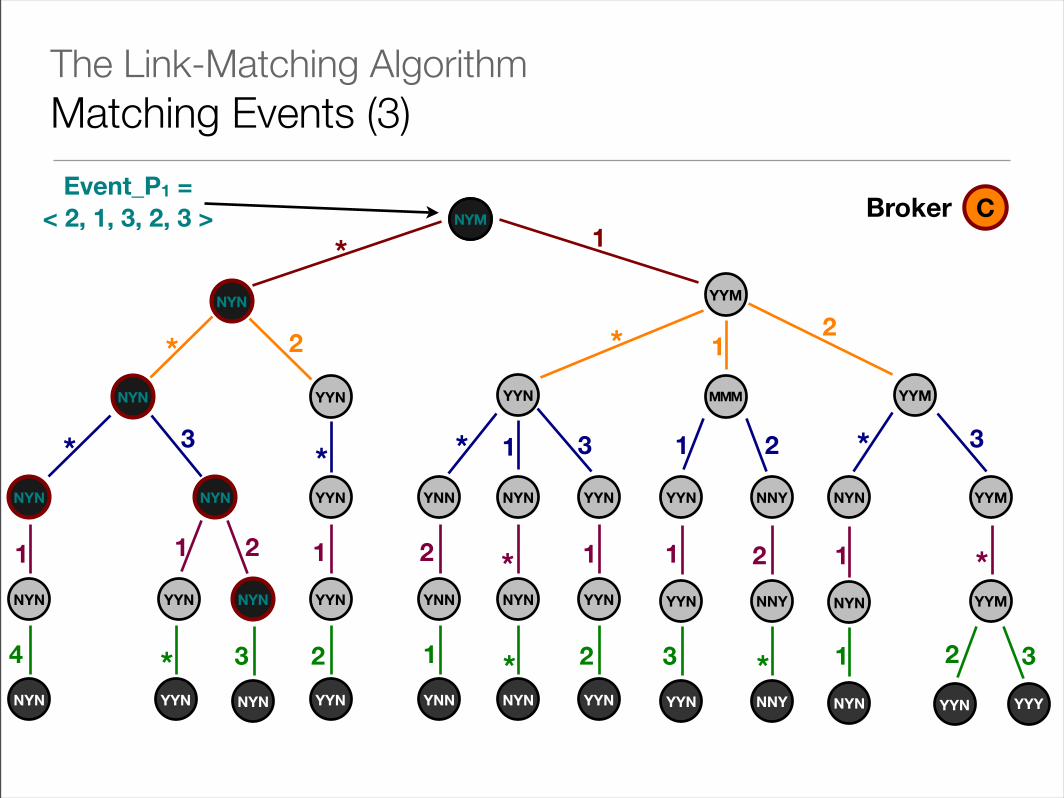
3) The designated test is performed on the PST and 0, 1 or 2 children are found for continuing the search according to the matching algorithm
‣ A sub-search is executed at each such child using a copy of the current mask
‣On the return of each sub-search, all M trits in the current mask for which there’s an Y trit in the sub-search mask
‣ After all the children have been searched, the remaining M trits are made N trits and the resulting mask is returned
4) The top-level search terminates and sends a copy of the event to all links corresponding to Y trits in the returned mask
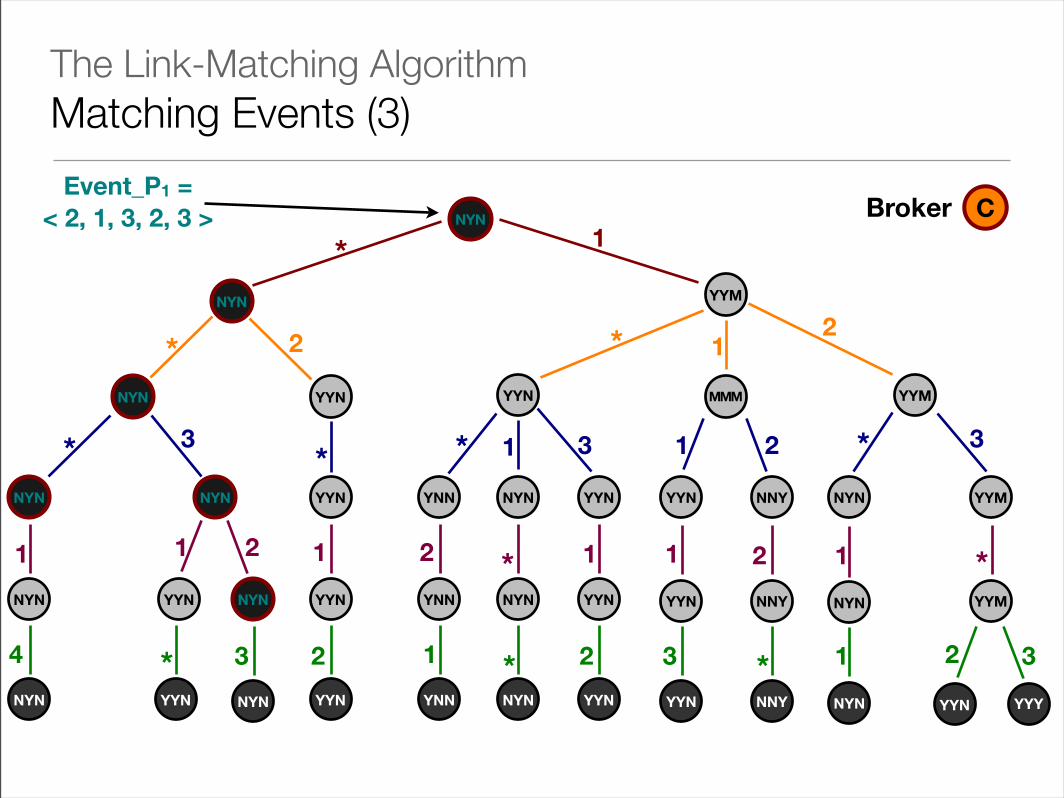
The Link-Matching AlgorithmMatching Events (3)
YYM
YYMYYM
MYM
NYN
YYN
MYM
YYN
YNN NYN YYN
MMM
YYN NNY
YYM
NYN YYM
YYN NYN
YYN
YYN YNN NYN YYN
YNN NYN YYN
YYN NNY
YYN NNY
NYN
NYN
YYM
YYN YYYYYN NYN YYN
NYN
NYN
*
*
*
*
* *
*
*
*
**
*
1
1
1
1 1
1
1
1
11 1
22
2
2
2
2
2
2
3 3 3
33 1 3 2
4
CBroker
The Link-Matching AlgorithmMatching Events (3)
YYM
YYMYYM
MYM
NYN
YYN
MYM
YYN
YNN NYN YYN
MMM
YYN NNY
YYM
NYN YYM
YYN NYN
YYN
YYN YNN NYN YYN
YNN NYN YYN
YYN NNY
YYN NNY
NYN
NYN
YYM
YYN YYYYYN NYN YYN
NYN
NYN
*
*
*
*
* *
*
*
*
**
*
1
1
1
1 1
1
1
1
11 1
22
2
2
2
2
2
2
3 3 3
33 1 3 2
4
Event_P1 = < 2, 1, 3, 2, 3 > CBroker

The Link-Matching AlgorithmMatching Events (3)
YYM
YYMYYM
MYM
NYN
YYN
MYM
YYN
YNN NYN YYN
MMM
YYN NNY
YYM
NYN YYM
YYN NYN
YYN
YYN YNN NYN YYN
YNN NYN YYN
YYN NNY
YYN NNY
NYN
NYN
YYM
YYN YYYYYN NYN YYN
NYN
NYN
*
*
*
*
* *
*
*
*
**
*
1
1
1
1 1
1
1
1
11 1
22
2
2
2
2
2
2
3 3 3
33 1 3 2
4
IMC,1 = NMMEvent_P1 = < 2, 1, 3, 2, 3 > CBroker

The Link-Matching AlgorithmMatching Events (3)
YYM
YYMYYM
MYM
NYN
YYN
MYM
YYN
YNN NYN YYN
MMM
YYN NNY
YYM
NYN YYM
YYN NYN
YYN
YYN YNN NYN YYN
YNN NYN YYN
YYN NNY
YYN NNY
NYN
NYN
YYM
YYN YYYYYN NYN YYN
NYN
NYN
*
*
*
*
* *
*
*
*
**
*
1
1
1
1 1
1
1
1
11 1
22
2
2
2
2
2
2
3 3 3
33 1 3 2
4
Event_P1 = < 2, 1, 3, 2, 3 > CBrokerNYM
NYM
NYM
NYMNYN

The Link-Matching AlgorithmMatching Events (3)
YYM
YYMYYM
MYM
NYN
YYN
MYM
YYN
YNN NYN YYN
MMM
YYN NNY
YYM
NYN YYM
YYN NYN
YYN
YYN YNN NYN YYN
YNN NYN YYN
YYN NNY
YYN NNY
NYN
NYN
YYM
YYN YYYYYN NYN YYN
NYN
NYN
*
*
*
*
* *
*
*
*
**
*
1
1
1
1 1
1
1
1
11 1
22
2
2
2
2
2
2
3 3 3
33 1 3 2
4
Event_P1 = < 2, 1, 3, 2, 3 > CBrokerNYM
NYM
NYM
NYM
NYN
NYN

The Link-Matching AlgorithmMatching Events (3)
YYM
YYMYYM
MYM
NYN
YYN
MYM
YYN
YNN NYN YYN
MMM
YYN NNY
YYM
NYN YYM
YYN NYN
YYN
YYN YNN NYN YYN
YNN NYN YYN
YYN NNY
YYN NNY
NYN
NYN
YYM
YYN YYYYYN NYN YYN
NYN
NYN
*
*
*
*
* *
*
*
*
**
*
1
1
1
1 1
1
1
1
11 1
22
2
2
2
2
2
2
3 3 3
33 1 3 2
4
Event_P1 = < 2, 1, 3, 2, 3 > CBrokerNYM
NYM
NYM
NYM
NYN
NYN NYN
NYN
NYN
NYN

The Link-Matching AlgorithmMatching Events (3)
YYM
YYMYYM
MYM
NYN
YYN
MYM
YYN
YNN NYN YYN
MMM
YYN NNY
YYM
NYN YYM
YYN NYN
YYN
YYN YNN NYN YYN
YNN NYN YYN
YYN NNY
YYN NNY
NYN
NYN
YYM
YYN YYYYYN NYN YYN
NYN
NYN
*
*
*
*
* *
*
*
*
**
*
1
1
1
1 1
1
1
1
11 1
22
2
2
2
2
2
2
3 3 3
33 1 3 2
4
Event_P1 = < 2, 1, 3, 2, 3 > CBrokerNYM
NYM
NYM
NYM
NYN
NYN NYN
NYN
NYN
NYNNYN

The Link-Matching AlgorithmMatching Events (4)
A
C
D
B
C2C1
C3 C4C5
C6 C7
P1
mask = NYN
Event_P1 = < 2, 1, 3, 2, 3 >
CBroker
LinksC = { L1, L2, L3 }
Dests = { B, C3, C4, A, C1, C2 }Dests = { D, C6, C7 }
Dests = { C5 }
Implementation and Performance
• The link-matching algorithm was implemented and tested on a simulated network topology as well as on a real LAN
• Simulation goals:
• To measure the network loading characteristics of the link matching protocol and compare it to that of the flooding protocol
• To measure the processing time taken by the link matching algorithm at individual broker nodes and compare it to that of centralised matching (non-trit)

Implementation and PerformanceSimulated Network
• The simulated broker network is composed by:
• 39 brokers and 10 subscribing clients per broker
• Each client with potentially multiple subscriptions
• The 39 brokers form three regional sub-trees of 13 brokers each
• The roots of the sub-trees are interconnected
• Top-level brokers have one-hop delays of 50ms, 65ms and 75ms
• Next-level-hop delays are 25ms, 10ms and 1ms for 1st, 2nd and 3rd levels
• Lateral links have delays of 50ms
P3
P2P1

Implementation and PerformanceSimulation Characteristics
• Subscriptions are generated randomly using a given probability according to a Zipf distribution
• Events are also generated randomly at the publishers according to a Poisson distribution with values that follow a Zipf distribution
• Values preferred by subscribers in a region are also the values most frequently published by publishers in that region
• The simulation models:
• The passage of virtual time due to link traversal (hop delay)
• Queue delay, CPU consumption and software latency at each broker
Implementation and PerformanceNetwork Loading Results
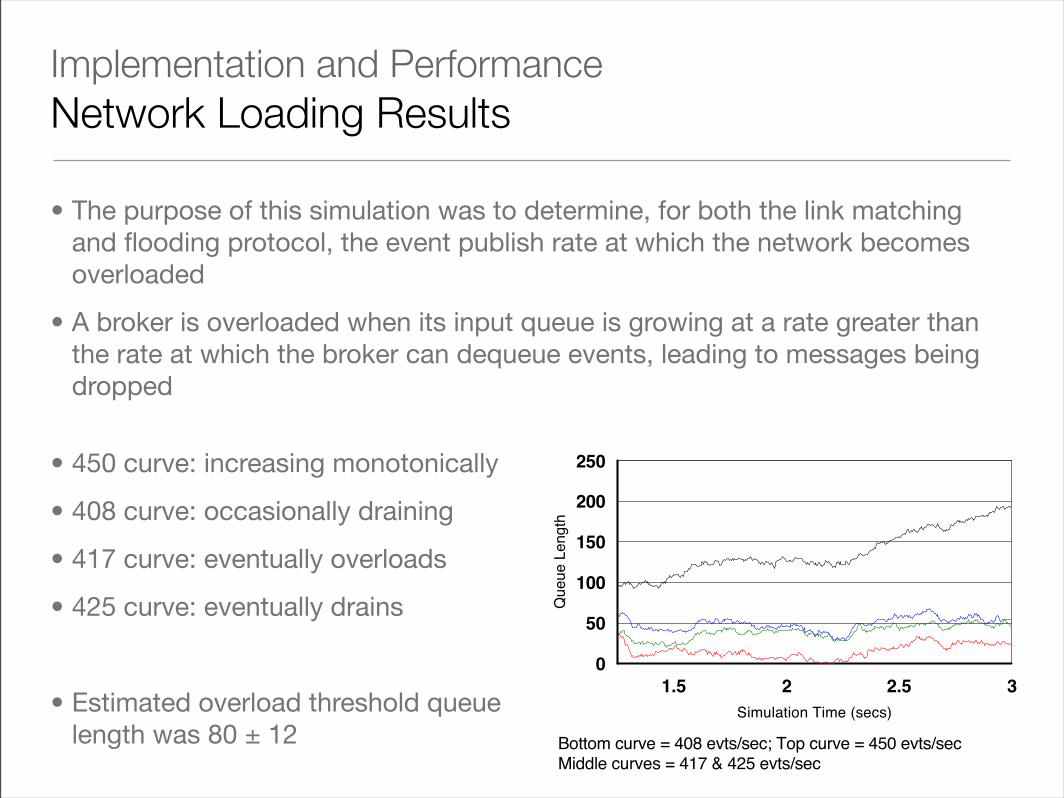
• The purpose of this simulation was to determine, for both the link matching and flooding protocol, the event publish rate at which the network becomes overloaded
• A broker is overloaded when its input queue is growing at a rate greater than the rate at which the broker can dequeue events, leading to messages being dropped
The simulated broker network implements a
publish/subscribe system using the algorithms of the
previous section. Simulation parameters control:
the number of attributes in the event schema,
the number of values per attribute,
the number of factoring levels (i.e., the “preferred”
attributes of Section 2.1),
the number of subscriptions,
the mean arrival rate of published events,
the probabilities that a given subscription “cares
about” a given attribute (i.e. does not have a
wildcard). The most popular attribute has a “care”
probability of P; each successive attribute has a lower
“care” probability determined by a degradation factor
D.
Subscriptions are generated randomly using the given
probabilities. For non-* attributes, the values are generated
according to a Zipf distribution. In addition, we simulate
“locality of interest” in subscriptions by having subscribers
within each regional subtree of the broker topology have
similar distributions of interested values whereas
subscriptions across from the other two subtrees have
different distributions.
Events are also generated randomly, with attribute
values in a Zipf distribution. The order of the favored
values is similarly biased according to the region in which
the event was published. That is, values preferred by
subscribers in a region are also the values most frequently
published by publishers in that region. Events are
generated at the publishing brokers according to a Poisson
distribution.
The simulation models passage of virtual time due to
link traversal (“hop delay”), and at each broker, the queue
delay at the incoming queue, the CPU consumption for
executing the link matching algorithm, and the software
latency for traversing the communication stack.
Network Loading Results.
As mentioned earlier, the purpose of this simulation
run was to determine, for the link matching and the
flooding protocols, the event publish rate at which the
broker network becomes “overloaded” (or congested). A
broker is overloaded when its input event queue is growing
at a rate greater than the rate at which the broker can
dequeue events, ultimately resulting in dropped messages.
Chart 1 illustrates this phenomenon in a 1.5 second
snapshot of the simulation. In this chart, the length of the
queue at a particular broker is plotted for varying message
publish rates (408, 417, 425, and 450 events per second
per publisher), with all other parameters fixed. The graph
shows that the curve for 450 events/sec is monotonically
increasing, whereas the curve for 408 events/sec is
occasionally draining all the events in its queue. The two
curves in the middle are similar, but look ambiguous in
this snapshot. In fact, one of them overloads when the
simulation run is lengthened by a factor of 10, and the
other drains its queue. Based on several long runs, we
arrived at an overload threshold queue length of 80 (with
intercontinent
interstate
P1 P2
P3
Figure 5: Simulated broker network topology
1.5 2 2.5 3
Simulation Time (secs)
0
50
100
150
200
250
Queue L
ength
Bottom curve = 408 evts/sec; Top curve = 450 evts/secMiddle curves = 417 & 425 evts/sec
Chart 1: Broker Overloading
• 450 curve: increasing monotonically
• 408 curve: occasionally draining
• 417 curve: eventually overloads
• 425 curve: eventually drains
• Estimated overload threshold queue length was 80 ± 12

Implementation and PerformanceNetwork Loading Results (2)
• Event schema with 15 attributes, 3 values per attribute
• The broker network is considered overloaded when any one broker overloads
• The confidence interval for these runs is ± 5 events/sec
• The flooding protocol overloads at the same publish rate regardless of the number of subscriptions
an error bound of 12) for the length of simulation runs
we perform. This means that with high probability, a
short simulation run which reaches a queue length of 80
eventually reaches an unbounded queue length as the
length of the simulation run increases, and a short run
which never reaches a queue length of 80 eventually
drains the queue.
The actual simulation run was performed with the
following parameters. The event schema has 15 attributes
(with 1 attribute used for factoring), and each attribute has
3 values. The subscriptions are generated randomly in
such a way that the most popular attribute is non-* with
probability P = 0.98. We control the percentage of
matches by varying the degradation rate D. A smaller
value of D means more “don’t care” values in
subscriptions, and hence less selectivity and a greater
percentage of matches.
The results from the simulation run are shown in Chart
2, which shows the maximum publish rate at which the
broker network does not overload, at various matching
rates, for varying numbers of subscriptions. (The
confidence interval for these runs is 5 events/sec.) For
this run, the broker network is defined as overloaded when
any one broker in the network has overloaded. The chart
shows that the flooding protocol overloads at the same
publish rate regardless of the percentage of matches or the
number of subscriptions. On the other hand, the link
matching protocol is able to handle much higher publish
rates without overloading when each event is destined to a
small percentage of subscriptions, i.e., when subscriptions
are highly selective.. In the case where events are
distributed quite widely, the difference is not as great,
since most links will be used to distribute events in the
link matching protocol. We expect that this result will be
more pronounced when the broker network has a much
larger number of links at each broker than the one shown
in Figure 5.
This result illustrates that link matching is well-suited
to the type of selective multicast that is typical of pub/sub
systems deployed on a WAN.
Matching Time Results.
As mentioned earlier, the purpose of this simulation
run was to measure the cumulative processing time taken
by the link matching algorithm and the centralized
(non-trit) matching algorithm. The processing time taken
per event in the link matching algorithm is the sum of the
times for all the partial matches at intermediate brokers
along the way from publisher to subscriber.
This simulation run was performed with the following
parameters. The event schema has 10 attributes (with 3
attributes used for factoring), and each attribute has 3
values. The subscriptions are generated in such a way that
the first attribute is non-* with probability P = 0.98, and
this probability decreases at the rate of D = 82% as we go
from the first to the last attribute. Again, this means that
subscriptions are very selective -- on average, each event
matches only about 1.3% of subscriptions. The number of
events published is 1000.
The results from the simulation run are shown in Chart
3. For the link matching algorithm, six lines, “LM 1 hop”
through “LM 6 hops”, are shown -- these correspond to
the number of hops an event had to traverse on its way
from a publishing broker to a subscriber. On the Y axis,
the chart shows the number of “matching steps” performed
on average. A matching step is the visitation of a single
node in the matching tree. Our current implementation
has traded off time efficiency in favor of space efficiency
to perform a matching step in just over 100 microseconds
on a Pentium 150 MHz machine. However, we estimate
that a time efficient implementation can execute a
matching step in the order of ten microseconds.
The chart shows that, for 10000 subscriptions, the
cumulative matching steps for up to four hops using the
2000 4000 6000 8000 10000
Number of subscriptions
0
50
100
150
200
250
Matc
hin
g s
teps
LM 1 hop
LM 2 hops
LM 3 hops
LM 4 hops
LM 5 hops
LM 6 hops
Centralized
Chart 3: Matching time
0 0.5 1 1.5 2
Percent of subscriptions matching an event
50
100
150
200
250
300
350
Max p
ublis
h r
ate
per
publis
her
per
second
Link Matching (5070 subscriptions)Link Matching (9750 subscriptions)Link Matching (14820 subscriptions)Flooding
Chart 2: Maximum broker throughput
• The link matching protocol is able to handle much higher publish rates without overloading when each event is destined to a small percentage of subscriptions (i.e. when subscriptions are highly selective)
• The difference is not as great when events are distributed quite widely

Implementation and PerformanceMatching Time Results
• The purpose of this simulation is to measure the cumulative processing time taken by the link matching algorithm and the centralised matching algorithm
• The processing time taken per-event in the link matching algorithm is the sum of the times for all the partial matches at intermediary brokers along the way from the publisher to the subscriber
• The event schema has 10 attributes, each with 3 values
• A matching step is a visitation of a single node in the matching tree
• For 10.000 subscriptions, the cumulative matching steps for up to 4 hops using the link matching algorithm is not more than the number of matching steps taken by the centralised algorithm
• For more than 4 hops, the link matching protocol takes more matching steps than the centralised one
an error bound of 12) for the length of simulation runs
we perform. This means that with high probability, a
short simulation run which reaches a queue length of 80
eventually reaches an unbounded queue length as the
length of the simulation run increases, and a short run
which never reaches a queue length of 80 eventually
drains the queue.
The actual simulation run was performed with the
following parameters. The event schema has 15 attributes
(with 1 attribute used for factoring), and each attribute has
3 values. The subscriptions are generated randomly in
such a way that the most popular attribute is non-* with
probability P = 0.98. We control the percentage of
matches by varying the degradation rate D. A smaller
value of D means more “don’t care” values in
subscriptions, and hence less selectivity and a greater
percentage of matches.
The results from the simulation run are shown in Chart
2, which shows the maximum publish rate at which the
broker network does not overload, at various matching
rates, for varying numbers of subscriptions. (The
confidence interval for these runs is 5 events/sec.) For
this run, the broker network is defined as overloaded when
any one broker in the network has overloaded. The chart
shows that the flooding protocol overloads at the same
publish rate regardless of the percentage of matches or the
number of subscriptions. On the other hand, the link
matching protocol is able to handle much higher publish
rates without overloading when each event is destined to a
small percentage of subscriptions, i.e., when subscriptions
are highly selective.. In the case where events are
distributed quite widely, the difference is not as great,
since most links will be used to distribute events in the
link matching protocol. We expect that this result will be
more pronounced when the broker network has a much
larger number of links at each broker than the one shown
in Figure 5.
This result illustrates that link matching is well-suited
to the type of selective multicast that is typical of pub/sub
systems deployed on a WAN.
Matching Time Results.
As mentioned earlier, the purpose of this simulation
run was to measure the cumulative processing time taken
by the link matching algorithm and the centralized
(non-trit) matching algorithm. The processing time taken
per event in the link matching algorithm is the sum of the
times for all the partial matches at intermediate brokers
along the way from publisher to subscriber.
This simulation run was performed with the following
parameters. The event schema has 10 attributes (with 3
attributes used for factoring), and each attribute has 3
values. The subscriptions are generated in such a way that
the first attribute is non-* with probability P = 0.98, and
this probability decreases at the rate of D = 82% as we go
from the first to the last attribute. Again, this means that
subscriptions are very selective -- on average, each event
matches only about 1.3% of subscriptions. The number of
events published is 1000.
The results from the simulation run are shown in Chart
3. For the link matching algorithm, six lines, “LM 1 hop”
through “LM 6 hops”, are shown -- these correspond to
the number of hops an event had to traverse on its way
from a publishing broker to a subscriber. On the Y axis,
the chart shows the number of “matching steps” performed
on average. A matching step is the visitation of a single
node in the matching tree. Our current implementation
has traded off time efficiency in favor of space efficiency
to perform a matching step in just over 100 microseconds
on a Pentium 150 MHz machine. However, we estimate
that a time efficient implementation can execute a
matching step in the order of ten microseconds.
The chart shows that, for 10000 subscriptions, the
cumulative matching steps for up to four hops using the
2000 4000 6000 8000 10000
Number of subscriptions
0
50
100
150
200
250
Matc
hin
g s
teps
LM 1 hop
LM 2 hops
LM 3 hops
LM 4 hops
LM 5 hops
LM 6 hops
Centralized
Chart 3: Matching time
0 0.5 1 1.5 2
Percent of subscriptions matching an event
50
100
150
200
250
300
350
Max p
ublis
h r
ate
per
publis
her
per
second
Link Matching (5070 subscriptions)Link Matching (9750 subscriptions)Link Matching (14820 subscriptions)Flooding
Chart 2: Maximum broker throughput

Implementation and PerformanceMatching Time Results (2)
• The link matching protocol is a better choice over the centralised algorithm, event for more than four hops because:
1) The extra processing time for link matching (of the order much less than 1ms) is insignificant compared to the network latency
2) The improvement in latency from publishers to regional subscribers obtained by decentralising brokers is significant
3) For really large numbers of subscribers (i.e. much beyond 10.000), the slopes in the lines in the chart indicate that centralised matching may take more steps than link matching

References
• G. Banavar et al., “An efficient Multicast Protocol for Content-Based Publish-Subscribe Systems”, in Proceedings of the 19th IEEE International Conference on Distributed Systems, 1999
• M. Aguilera et al., “Matching Events in a Content-Based Subscription System”, in Proceedings of the 18th ACM Symposium on the Principles of Distributed Computing, May 1999


