+ All Categories
Home > Documents > An Effort toward of F16 SSMIS UPP Data in NCEP Global ...

An Effort toward of F16 SSMIS UPP Data in NCEP Global ...

Date post: 07-Feb-2022
Category:
Upload: others
View: 3 times
Download: 0 times
Share this document with a friend
30
An Effort toward An Effort toward Assimilation of F16 SSMIS of F16 SSMIS UPP Data in NCEP Global Forecast System UPP Data in NCEP Global Forecast System Banghua Yan 1,4 , Fuzhong Weng 2 , John Derber 3 1. Joint Center for Satellite Data Assimilation 2. NOAA/NESDIS/Center for Satellite Applications and Research 3. NOAA/NCEP/ Environment Modeling Center 4. Perot Inc. JCSDA 6 th Workshop, June 10-11, 2008, Linthicum, MD
Transcript

An Effort toward An Effort toward Assimilation of F16 SSMIS of F16 SSMIS UPP Data in NCEP Global Forecast SystemUPP Data in NCEP Global Forecast System

Banghua Yan1,4, Fuzhong Weng2, John Derber3

1. Joint Center for Satellite Data Assimilation2. NOAA/NESDIS/Center for Satellite Applications and Research

3. NOAA/NCEP/ Environment Modeling Center4. Perot Inc.

JCSDA 6th Workshop, June 10-11, 2008, Linthicum, MD

Four Major Considerations for Microwave Satellite Data Assimilation Impact Study

I. Bias and/orCalibration Anomaly

Corrections

II. Cloud Detection

III. Surface Emissivity

Information

IV. More QC-Passed Data from

More Channels and/or Surfaces

Global DataAssimilation

System

(Unbiased data)

(for accurate brightness temperature simulations)

(for selection of data under clear sky)

F16 SSMIS Key CharacteristicsF16 SSMIS Key Characteristics

• 24 Channels (19-183 GHz)• Conical Scan Geometry (45°)

♦ Relatively stable peak altitude of weight function

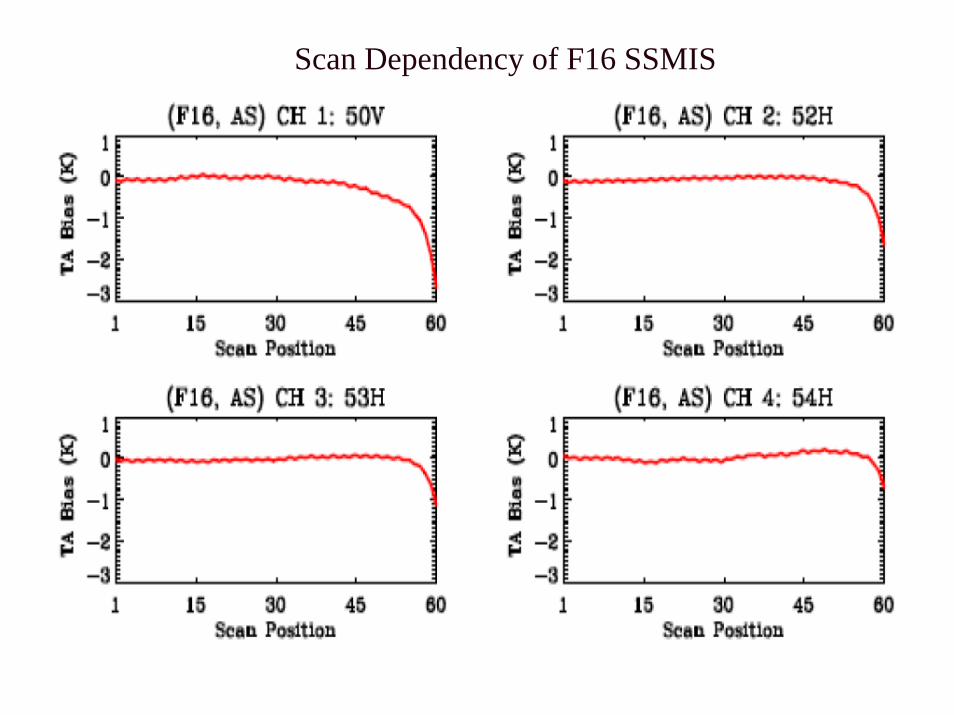
♦ Constant FOV along scan ♦ Scan position dependent bias

• Calibration Anomaly: solar intrusion and antenna emission

UAS

(Kunkee et al. 2008)

LAS

SSM/Ilike-CHs

H2O

Scan Dependency of F16 SSMIS

F16 SSMIS Anomaly Distribution

Shown is the difference between observed and simulated SSMIS at 54.4 GHz. The SSMIS is the first conical microwave sounding instrument, precursor of NPOESS MIS. The outstanding anomalies have been identified from three processes: 1) antenna emission after satellite out of the earth eclipse which contaminates the measurements in ascending node and small part in descending node, 2) solar heating to the warm calibration target and 3) solar reflection from canister tip, both of which affect most of parts of descending node.

No.1: Accurate calibration anomaly and scan-dependent bias corrections for F16 SSMIS data since forecast model uses unbiased data

F16 SSMIS Calibration Anomaly Correction• NRL/UK MetOffice SSMIS Unified Pre-Processor (UPP)

− Correct antenna emission for LAS− Removal of warm load anomaly− Doppler shift correction for UAS − Spatial averaging to reduce to the sub-Kelvin levels

• NESDIS SSMIS Pre-processor− Correct antenna emission for LAS− Removal of warm load anomaly− UAS bias removal using SABER (Sounding of the Atmosphere using

Broadband Emission Radiometry ) measurements simulated as truth − Spatial filter for noise reduction − Linear mapping of SSMIS imager to its predecessor (SSM/I) using the

F15 and F16 Simultaneous Conical Overpass observations− Inter-sensor calibration for SSMIS imager non-linearity (for climate

reprocessing)

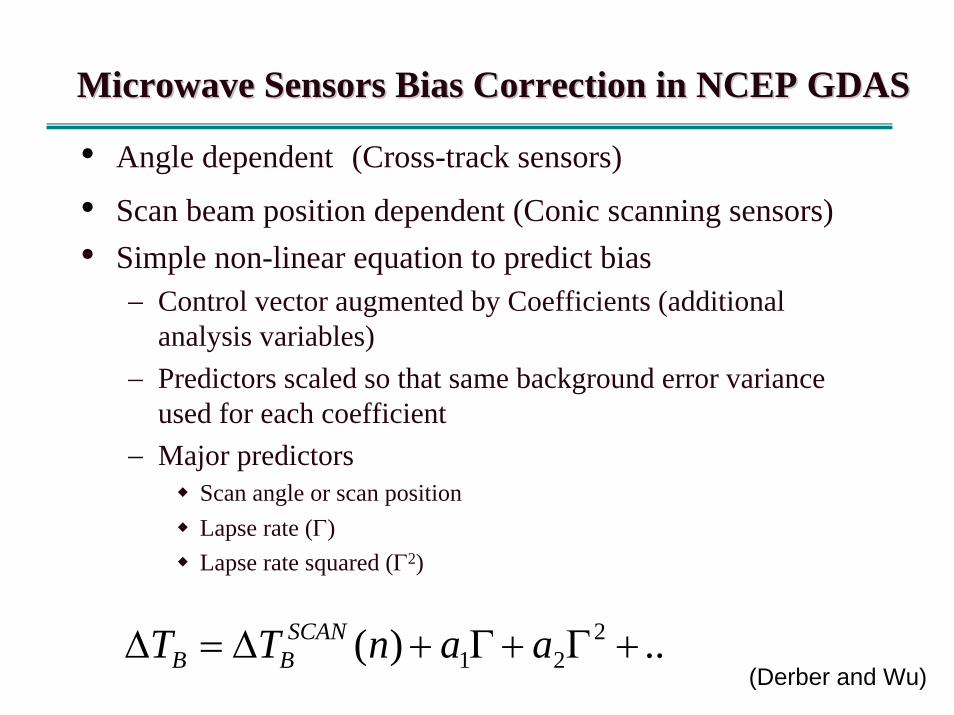
Microwave Sensors Bias Correction in NCEP GDASMicrowave Sensors Bias Correction in NCEP GDAS

• Angle dependent (Cross-track sensors)

• Scan beam position dependent (Conic scanning sensors)• Simple non-linear equation to predict bias

− Control vector augmented by Coefficients (additional analysis variables)

− Predictors scaled so that same background error variance used for each coefficient

− Major predictorsScan angle or scan positionLapse rate (Γ)Lapse rate squared (Γ2)

..)( 221 +Γ+Γ+Δ=Δ aanTT SCAN

BB(Derber and Wu)

CH. ΔTB(wobc) ΔTB(wbc) σ (wobc) σ (wbc)1 0.74 0.82 3.29 3.172 0.26 0.12 0.98 0.993 0.02 0.01 0.35 0.354 0.38 0.00 0.25 0.255 0.21 0.01 0.30 0.286 0.57 0.04 0.45 0.367 1.71 0.12 0.48 0.41

CH.1 CH.2 CH.3

CH.4 CH.6CH.5

CH.7

II

III

I

|δΔTB|>1K

Regionally dependent bias after bias correction

TB (Observation) – TB (Simulation) Differences (DTB) for F16 UPP at LAS Channels (WBC)

UPP DTB Distributions at LAS Channels (WOBC)

CH.2 CH.3

CH.4 CH.6

CH.7

II

III

I

|δΔTB|>1K

|δΔTB|>1K

There remainsome regional biases after calibration anomaly correction in SSMISUPP data.

CH.5

CH.1

UPP DTB Distributions at Water Vapor Channels (WBC)

183±7 GHz 183±3 GHz

183±1 GHz

f0 ΔTB σ183±7 0.26 2.17183±3 0.03 1.58183±1 -0.01 1.73

0

500

1000

1500

2000

-2.8 -1.8 -0.8 0.2 1.2 2.2 3.2

DTB (O-B) (57.9 GHz, CH 10)

Num

ber

0

500

1000

1500

2000

-2.8 -1.8 -0.8 0.2 1.2 2.2 3.2

DTB (O-B) (55.5 GHz)

Num

ber

0

500

1000

1500

2000

-2.8 -1.8 -0.8 0.2 1.2 2.2 3.2

DTB (O-B) (54.4 GHz)

Num

ber

0

200

400

600

800

1000

-2.8 -1.8 -0.8 0.2 1.2 2.2 3.2

DTB(O-B) (52.8 GHz)

Num

ber

METOP AMSUA

0

500

1000

1500

2000

-2.8 -1.8 -0.8 0.2 1.2 2.2 3.2

DTB (O-B) (57.3 GHz)

Num

ber

0

500

1000

1500

2000

-2.8 -1.8 -0.8 0.2 1.2 2.2 3.2

DTB (O-B) (55.5 GHz)

Num

ber

0

500

1000

1500

2000

-2.8 -1.8 -0.8 0.2 1.2 2.2 3.2

DTB (O-B) (54.4 GHz)

Num

ber

0

200

400

600

800

1000

-2.8 -1.8 -0.8 0.2 1.2 2.2 3.2

DTB(O-B) (52.8 GHz)

Num

ber

F16 SSMIS (UPP)F16 SSMIS (UPP)O – B Histograms for QC Passed Data over (Cloud-free) Oceans

0

500

1000

1500

2000

-2.8 -1.8 -0.8 0.2 1.2 2.2 3.2

DTB (O-B) (57.9 GHz, CH 10)

Num

ber

0

500

1000

1500

2000

-2.8 -1.8 -0.8 0.2 1.2 2.2 3.2

DTB (O-B) (55.5 GHz)

Num

ber

0

500

1000

1500

2000

-2.8 -1.8 -0.8 0.2 1.2 2.2 3.2

DTB (O-B) (54.4 GHz)

Num

ber

0

200

400

600

800

1000

-2.8 -1.8 -0.8 0.2 1.2 2.2 3.2

DTB(O-B) (52.8 GHz)

Num

ber

N18 AMSUAwobc wbc

No.2: A reliable cloud detection for selection of UPP data under clear sky

Cloud Detection Algorithm & Assimilation Impact

• Over oceans: SSM/I CLW heritage algorithm (Weng&Grody, 1994), where SSMIS TBs are remapped to SSM/I TB (Yan &Weng, TGRS, 2008)

• Over land: a newly developed cloud detection algorithm is used.

• SSMIS IWP algorithm is developed by Sun & Weng(2008, TGRS) based on the AMSU IWP heritage algorithm by Zhao & Weng(2002, JAM).

Wrong cloud detection

Correct clouddetection

No. 3: Reliable surface emissivity information for accurate SSMIS brightness temperature simulations

Data Assimilation SchemeSignificance? In satellite data assimilation scheme, the cost function is defined as

( ) ( ) [ ] [ ]oTobTbJ IxIFEIxIxxBxx −+−+−−= −− )()()(21

21 11

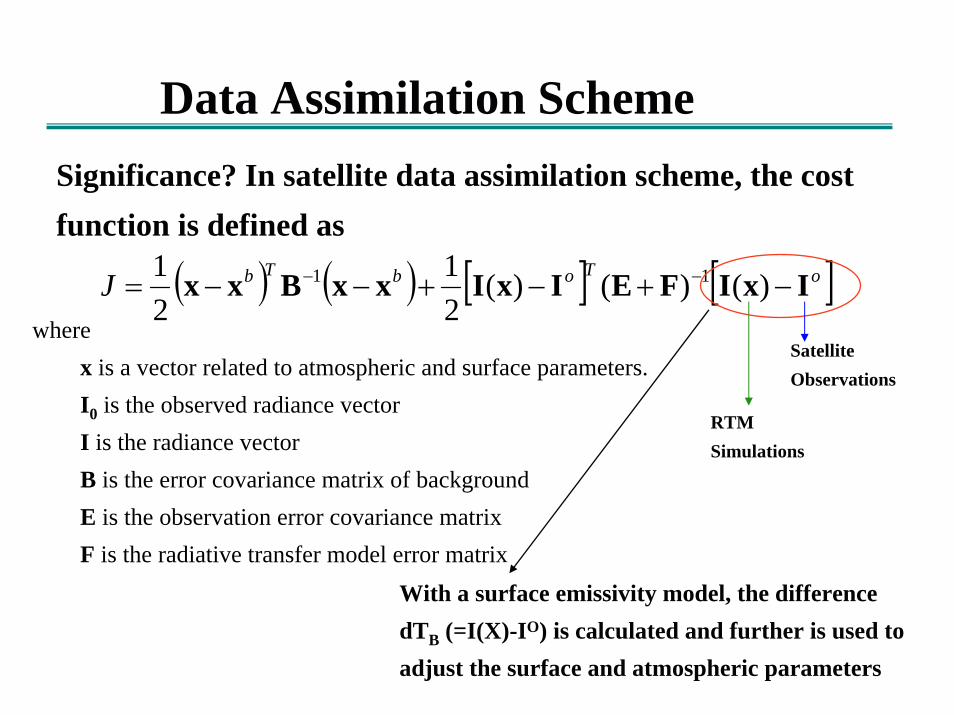
wherex is a vector related to atmospheric and surface parameters.I0 is the observed radiance vector I is the radiance vector B is the error covariance matrix of background E is the observation error covariance matrixF is the radiative transfer model error matrix

With a surface emissivity model, the difference dTB (=I(X)-IO) is calculated and further is used to adjust the surface and atmospheric parameters

SatelliteObservations

RTM Simulations

Atmospheric Transmittance at Four Sounding Channels(a) Atmospheric Transmittance at 52.8 GHz (b) Atmospheric Transmittance at 183±7 GHz

(c) Atmospheric Transmittance at 183±3 GHz (d) Atmospheric Transmittance at 183±1 GHz

Microwave Surface Emissivity Models

Five Surface Types

A microwave land emissivity model (LandEM)was developed by F. Weng, B. Yan, N. Grody(JGR, 2001)

Ocean Sea Ice Snow Canopy (bare soil) Desert

Empirical snow and sea ice emissivity algorithm using microwave satellite window channels of measurements (B. Yan and F. Weng, 2003; 2008)

(1) A fast microwave ocean emissivity model (English and Hewison, 1998)(2) Microwave ocean emissivity model (Weng and Yan)

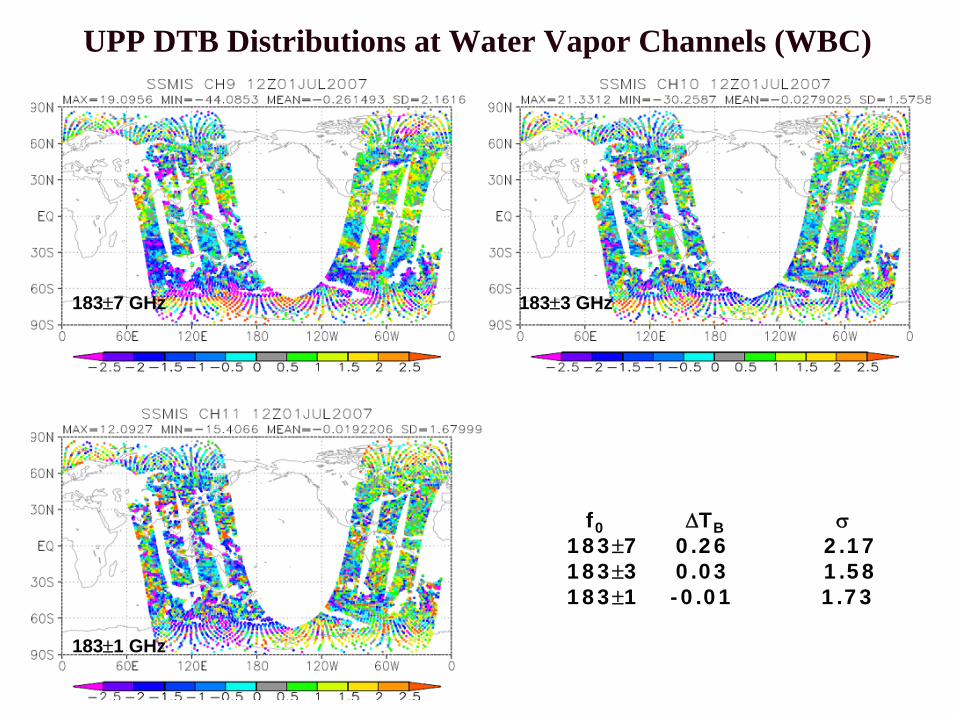
UPP DTB Distributions at Water Vapor ChannelsUsing Old Snow and Sea Ice Emissivity Simulations

183±7 GHz 183±3 GHz

183±1 GHzf0 ΔTB (K) σ (K)

183±7 1.86 6.49183±3 -0.29 4.16183±1 0.92 2.61

Lager DTB due to inaccurateemissivity simulations

UPP DTB Distributions at Water Vapor Channels (WOBC) Using Improved Snow and Sea Ice Emissivity Simulations

183±7 GHz 183±3 GHz

183±1 GHz

f0 ΔTB(Old) ΔTB(New) σ (Old) σ (New)183±7 1.86 0.30 6.49 2.17183±3 -0.29 0.44 4.16 1.58183±1 0.92 1.16 2.61 1.73

Impact of Improved Snow and Sea Ice Emissivity at SSMIS Channels on F16 UPP SSMIS Data Usage

NewSNOW&Ice EM

Old Snow&Ice EM

•Several SSMIS sounding channels are sensitive to highly variable emissivity especially over snow and sea ice conditions

•Only about 20% SSMIS data passed quality control in NCEP/GSI using the old models

•Around 50% SSMIS data passed quality control due to improved SSMIS snow and sea ice emissivity simulations

Assimilation Impact of Improved Snow & Sea Ice Emissivity Simulations on NCEP GFS

•SSMIS and MHS include several sounding channels sensitive to variable emissivity especially over snow and sea ice conditions

• Improved snow and sea ice emissivity models results in around 60% SSMIS and MHS sounding data passing QC

•The impact of the MHS data using the new emissivity model is positive

a positive impact

a positive impact

No.4: Assimilation impact of More QC-passed UPP data from LAS and water vapor sounding channels on forecast model

a positive impact

•Experiment: 07/01/08 ~ 07/10/08

•UPP water vapor sounding data is assimilated over oceans

•Around 60% of UPP water vapor sounding data over oceans passes quality control

•A positive impact of UPP water vapor sounding data is observed over Southern hemisphere

Assimilation impact of SSMIS UPP Water Vapor Sounding Data over Oceanson GFS

Assimilation Impacts of F16 SSMIS UPP Data on GFS Forecast Score

•Experiment: 07/01/08 ~ 07/14/08

•Contrl.: GFS operational data

•UPP ocean: Contrl.+UPP LAS and water vapor sounding data over oceans are assimilated into GDAS

•Around 50% of UPP data passed quality control depending surfaces

•Positive (neutral) impacts of UPP data for difference experiments are observed at 500 mb except for UPP Snow&Ice experiment over Southern Hemisphere

Summary

• Positive impacts of SSMIS UPP data can be obtained through improved cloud detection, surface snow and sea ice emissivity simulations

• A positive impact of SSMIS UPP data is anticipated by adding water vapor channels

• A positive or neutral assimilation impact on forecast model is seen by adding UPP data over land, snow and sea ice conditions

• The SSMIS UPP data displays some regional dependent biases at several sounding channels which would reduce their assimilation impact

Future Work

• Continue to investigate assimilation impacts of the SSMIS UPP data at LAS and water vapor sounding channels over oceans on GFS analysis fields.

• Investigate assimilation impact of the SSMIS UPP data at LAS and water vapor sounding channels over land, snow and sea ice conditions on GFS.

• Investigate the assimilation impact of SSMIS UPP data for the improved bias correction and quality control schemes on GFS

Acknowledgement

• NOAA/NESDIS/STAR/:Sungwook Hong, Ninghai Sun

• NOAA/NCEP/EMC: Greg Krasowski, Russ Treadon, Xuijian Su, Masahiro Kazumori

• Naval Research Laboratory: Dr. Nancy L. Baker, Steve Swadley

• United Kingdom Met Office: William Bell

TB Differences (OBS – BK) for N18 AMSU-A at LAS Channels by Applying the Current Bias Correction Scheme

CH.3 CH.4 CH.5

CH.6 CH.8CH.7

CH.9

f0 ΔTB(N18) ΔTB(UPP) σ (N18) σ (UPP)50.3 0.81 0.82 3.48 3.1752.8 0.07 0.12 1.04 0.9953.6 0.03 0.01 0.47 0.3554.4 0.01 0.00 0.17 0.2554.9 0.01 - 0.17 -55.5 0.00 0.01 0.19 0.2857.3 0.00 0.04 0.17 0.3659.4 - 0.12 - 0.41

N18 AMSUN18 AMSU--A data quality is better than UPP LAS data.A data quality is better than UPP LAS data.

TB Differences (OBS – BK) for N18 MHS by Applying the Current Bias Correction Scheme

183±1 GHz 183±3 GHz

190 GHz


Recommended