Biol. Cybern. 62, 1-15 (1989) Biological Cybernetics O Springer-Verlag 1989 An Electro-Diffusion Model for Computing Membrane Potentials and Ionic Concentrations in Branching Dendrites, Spines and Axons Ning Qian and T. J. Sejnowski Computational Neurobiology Laboratory, The Saik Institute, P.O. Box 85800, San Diego, CA 92138-9216, USA Abstract. The Nernst-Planck equation for electro- diffusion was applied to axons, dendrites and spines. For thick processes (1 Ixm) the results of computer simulation agreed accurately with the cable model for passive conduction and for propagating action poten- tials. For thin processes (0.1 ~tm) and spines, however, the cable model may fail during transient events such as synaptic potentials. First, ionic concentrations can rapidly change in small compartments, altering ionic equilibrium potentials and the driving forces for movement of ions across the membrane. Second, longitudinal diffusion may dominate over electrical forces when ionic concentration gradients become large. We compare predictions of the cable model and the electro-diffusion model for excitatory postsynaptic potentials on spines and show that there are significant discrepancies for large conductance changes. The electro-diffusion model also predicts that inhibition on small structures such as spines and thin processes is ineffective. We suggest a modified cable model that gives better agreement with the electro-diffusion model. 1 Introduction The cable model of electrical conduction is central to our understanding of information processing in neurons. The conduction of action potentials in axons has been modeled as a nonlinear excitable cable (Hodgkin and Huxley 1952) and the integration of postsynaptic signals in dendrites has been studied with analytic solutions to passive cables (Rail 1977). Re- cently, several groups have used the cable model to examine the possibility of more complex signal pro- cessing in dendrites with complex morphologies, mul- tiple synaptic inputs, and passive or excitable mem- branes (Shepherd et al. 1985; Koch and Poggio 1983; Koch et al. 1983; Rail and Segev 1987; Perkel and Perkel 1985; Wathey et al. 1989). The resting membrane potential is maintained by ionic concentration differences across the membrane. In the cable model, the equilibrium potential of each ion is represented by a battery whose electromotive force is given by the Nernst potential. Changes in the membrane permeability are modeled by changes to conductances in series with the batteries. The ionic concentrations are usually not significantly altered by these conductance changes, so the equilibrium poten- tials are not altered and the potentials of the batteries can be considered fixed. However, there are circum- stances when this is not a good assumption. If the intracellular volume is relatively small, as in dendritic spines, then ionic concentrations can change rapidly following a transient change in ionic conductances. Moreover, a sudden change in concentration at one location can lead to gradients of ionic concentration within a thin process, which violates another funda- mental assumption of the cable model. Under these circumstances, it is necessary to consider the funda- mental laws governing the movements of ions, as given by the Nernst-Planck equations for electro-diffusion (Jack et al. 1975). There is another motivation for carefully treating the ionic concentrations and the diffusion of ions within neurons. Many intracellular functions are regu- lated by concentrations of particular ions. For example, the release of neurotransmitter depends on the concentration of Ca 2§ inside presynaptic ter- minals, which can change by an order of magnitude in milliseconds (Stockbridge and Moore 1984; Fogelson and Zucker 1985; Simon and Llinas 1985). The inflow of Ca 2§ into postsynaptic dendrites precedes the induction long-term potentiation in hippocampal pyr- amidal cells (Malenka et al. 1988). Thus, it is important to predict accurately the concentration changes of
Transcript
Biol. Cybern. 62, 1-15 (1989) Biological Cybernetics O Springer-Verlag 1989
An Electro-Diffusion Model for Computing Membrane Potentials and Ionic Concentrations in Branching Dendrites, Spines and Axons
Ning Qian and T. J. Sejnowski Computational Neurobiology Laboratory, The Saik Institute, P.O. Box 85800, San Diego, CA 92138-9216, USA
Abstract. The Nernst-Planck equation for electro- diffusion was applied to axons, dendrites and spines. For thick processes (1 Ixm) the results of computer simulation agreed accurately with the cable model for passive conduction and for propagating action poten- tials. For thin processes (0.1 ~tm) and spines, however, the cable model may fail during transient events such as synaptic potentials. First, ionic concentrations can rapidly change in small compartments, altering ionic equilibrium potentials and the driving forces for movement of ions across the membrane. Second, longitudinal diffusion may dominate over electrical forces when ionic concentration gradients become large. We compare predictions of the cable model and the electro-diffusion model for excitatory postsynaptic potentials on spines and show that there are significant discrepancies for large conductance changes. The electro-diffusion model also predicts that inhibition on small structures such as spines and thin processes is ineffective. We suggest a modified cable model that gives better agreement with the electro-diffusion model.
1 Introduction
The cable model of electrical conduction is central to our understanding of information processing in neurons. The conduction of action potentials in axons has been modeled as a nonlinear excitable cable (Hodgkin and Huxley 1952) and the integration of postsynaptic signals in dendrites has been studied with analytic solutions to passive cables (Rail 1977). Re- cently, several groups have used the cable model to examine the possibility of more complex signal pro- cessing in dendrites with complex morphologies, mul- tiple synaptic inputs, and passive or excitable mem-
branes (Shepherd et al. 1985; Koch and Poggio 1983; Koch et al. 1983; Rail and Segev 1987; Perkel and Perkel 1985; Wathey et al. 1989).
The resting membrane potential is maintained by ionic concentration differences across the membrane. In the cable model, the equilibrium potential of each ion is represented by a battery whose electromotive force is given by the Nernst potential. Changes in the membrane permeability are modeled by changes to conductances in series with the batteries. The ionic concentrations are usually not significantly altered by these conductance changes, so the equilibrium poten- tials are not altered and the potentials of the batteries can be considered fixed. However, there are circum- stances when this is n o t a good assumption. If the intracellular volume is relatively small, as in dendritic spines, then ionic concentrations can change rapidly following a transient change in ionic conductances. Moreover, a sudden change in concentration at one location can lead to gradients of ionic concentration within a thin process, which violates another funda- mental assumption of the cable model. Under these circumstances, it is necessary to consider the funda- mental laws governing the movements of ions, as given by the Nernst-Planck equations for electro-diffusion (Jack et al. 1975).
There is another motivation for carefully treating the ionic concentrations and the diffusion of ions within neurons. Many intracellular functions are regu- lated by concentrations of particular ions. For example, the release of neurotransmitter depends on the concentration of Ca 2§ inside presynaptic ter- minals, which can change by an order of magnitude in milliseconds (Stockbridge and Moore 1984; Fogelson and Zucker 1985; Simon and Llinas 1985). The inflow of Ca 2§ into postsynaptic dendrites precedes the induction long-term potentiation in hippocampal pyr- amidal cells (Malenka et al. 1988). Thus, it is important to predict accurately the concentration changes of
0 O u t s i d e b Ou t s i de
. . . T [ _12- . . . . . . t • 1 6 2
R i R i Rt Ri
Ins ide Inside
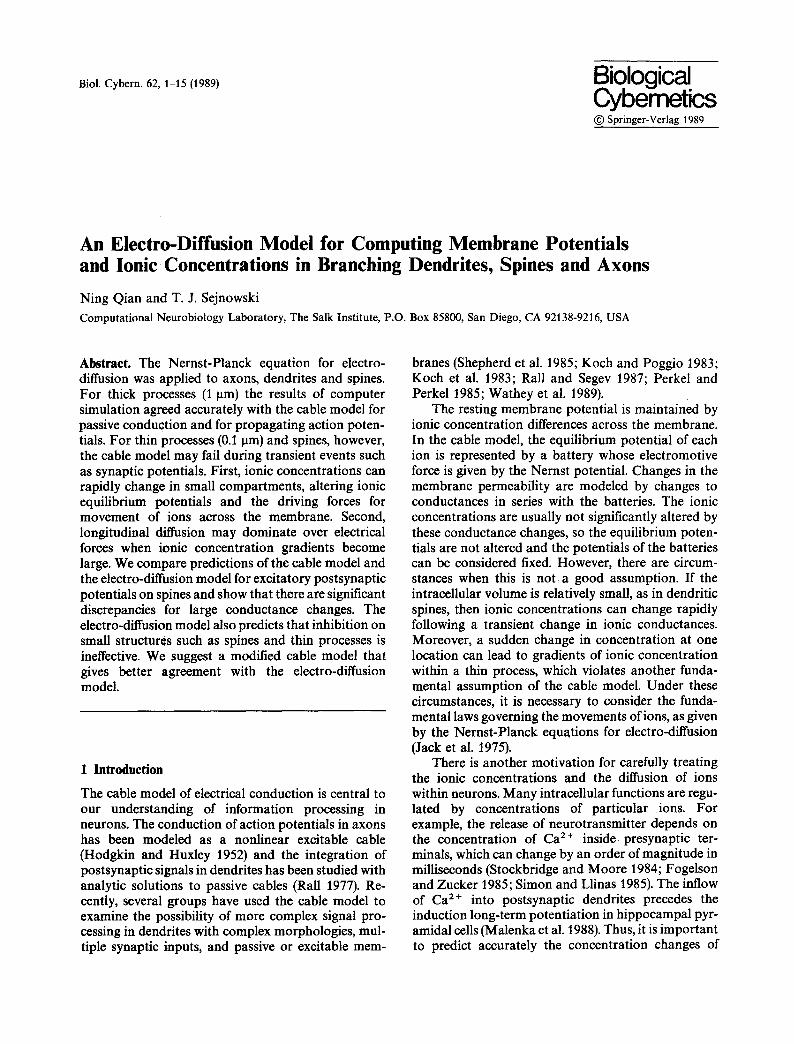
Fig. 1. a Electrical circuit for one compartment in cable model for a neuronal process and b an equivalent circuit. Only K + and Na § are considered in this model
Ca 2 + in small compartments such as synaptic boutons and dendritic spines.
In this paper we introduce an electro-diffusion model for small compartments and thin processes that is based on the Nernst-Planck equation. The electro- diffusion model provides a unified framework for the computation of both the membrane potentials and the intracellular ionic concentrations during synaptic ac- tivation. Some preliminary results for excitatory post- synaptic potentials have already been reported (Qian and Sejnowski 1988). We extend the model to in- hibitory postsynaptic potentials and show that inhi- bition is not effective on spines and thin dendrites (Qian and Sejnowski 1989).
2 Limitations of the Cable Model
In the cable model, the membrane potential, V(z, t), at distance z and time t along a cable obeys the equation (Jack et al. 1975):
d 02V OV 4R i Oz 2 = era --~- -F lot, (1)
where d is the diameter of the cable, R~ (f~ cm) is the total intracellular cytoplasmic resistivity, Cot (gF/cm 2) is the membrane capacitance per unit area, and lot (mA/cm 2) represents the total non-capacitative mem- brane current density which is the summation of all non-capacitative membrane current densities for each ionic species, lot.k. If we assume that the movement of ionic species k across the membrane can be described by a membrane resistance of unit area Rm.k (f~ cm 2) in series with a battery whose electromotive force E k is equal to the ionic equilibrium potential as shown schematically in Fig. 1 a, then
lot.k =(v-/~D/R. .k, (2)
and
Im= Z I,.,k =(V-- K=st)/Rot. (3) k
where the resting membrane potential, Vre~t, and the total membrane resistance, Rot, are given by:
V~t = g, , F. (Ek/Rot, k) k
1/R,, = E (1~Rot.k). k
Through these definitions, the electrical circuit in Fig. la can be reduced to the equivalent circuit shown in Fig. lb. The standard equation for the cable model is obtained by substituting (3) into (1), assuming that V is measured from the resting potential V~es, (Rall 1977):
22 c~2V c?V = zot ~ - + V, (4)
where the space and time constants are defined as
2=(dR,~4R~) 1/2 ,
zot = RotCot.
The electromotive forces of the membrane batteries (equilibrium potentials) in the cable model are usually obtained from the Nernst equation and are considered constants. This is a good approximation in the squid giant axon or other large neurons, but may introduce errors if the concentrations of some ions change significantly with time. This applies to Ca 2+ con- centrations in many situations and to synaptic events in small structures such as dendritic spines (Rail 1978; Koch and Poggio 1983). Restricted extracellular spaces may also result in significant extracellular ionic concentration changes (see Discussion).
A second limitation of the cable model is in the treatment of longitudinal spread of current within neurons. In the cable model, the gradient of the electrical potential in the cytoplasm is the driving force for the ionic current, but there is no provision for the driving forces due to concentration gradients. This is usually a good assumption, but it may not be valid for ions like Ca 2 + and for small structures like dendritic spines where the spatial concentration gradients can be very large.
Finally, different ions may have different concentration-dependent cytoplasmic resistivities [see (13)], but the cable model only incorporates the total cytoplasmic resistivity. This may not be a valid approximation when the concentrations of ions are changing differentially. In summary, one expects that the cable model may not be appropriate when spatial and/or temporal ionic concentrations changes are large and especially when ionic concentration changes need to be determined.
In the following sections we will first derive a set of equations that govern the electrodiffusion of ions in neuronal processes and discuss their relationship with the cable model. We will then present numerical
solutions to these equations for a propagating action potential in a long axon and for postsynaptic poten- tials in a dendritic spine. A modifield cable model is proposed which agrees well with the electrodiffusion model when the ionic concentration are not changing too quickly. Finally, we discuss the origin of the differences between the electro-diffusion model and the cable model and the effects of restricted extracellular space, ionic pumps and ionic exchangers in the membrane.
3 Electro-Diffusion Model
The movement of ions in neurons is governed by the Nernst-Planck equation (Jack et al. 1975):
Ji, = -- Dk( ff nk + (nk/~k) VV), (5)
where V is the potential, Jk is the flux of ionic species k (number of particles per unit area), D k is the diffusion constant, nk is the concentration, and the constant a k is defined as
tXk= R T/Fzk,
where z, is the valence of ionic species k, R is the gas constant, F is the Faraday constant, and T is the absolute temperature. The ionic concentrations and ionic currents must additionally satisfy the continuity equation:
ank V- Jk + -~- = 0. (6)
Consider a cylinder of diameter d and assume that the longitudinal current and ionic concentrations are uniform across the transverse cross-section of the cylinder. Assume also that transverse currents occur only at the surface of the cylinder and are independent of angle around the axis of the cylinder. These assump- tions reduce the problem of electro-diffusion to a one- dimensional problem along the axis of the cylinder. The equations can be written in cylindrical coordinates and reduced to a single equation for the concentration as a function of the distance along the z-axis of a cylinder:
On k 02nk Dk(~ ( O V ) 4 dt = Dk ~z 2 + Ot-k -~Z nk ~Z -- -d Jm.k, (7)
where Jm, k is the membrane flux of ionic species k, positive for outgoing flux (see the Appendix for details of the derivation). An expression for the membrane fluxes can be obtained by making the constant-field approximation for the O component of (5) (Goldman 1943):
where Pk is the permeability of the membrane and n~ u' is the concentration of ionic species k outside the membrane, which was considered constant for all simulations reported in this paper. The three terms on the right-hand side of this equation are, respectively, the contributions from pure diffusion, the potential gradient, and the membrane current. In applying (9) to some problems, the last term may be replaced by an experimentally-determined expression for the mem- brane current to eliminate the error introduced by the constant-field approximation.
Equation (2) has been found to be a good approx- imation for squid giant axons Hodgkin and Huxley 1952) while (8) better describes the membrane currents in the myelinated nerve fibers of Xenopus laevis (Frankenhaeuser and Huxley 1964). It is not clear whether (8) or (2) is a better approximation for dendritic spines, especially when changes in ionic concentrations are large. The expressions for the membrane currents of ionic species k in (2) and (8) cannot be made equivalent even when the ionic concentrations are almost constant. An additional requirement is that the membrane potential V should be very close to the equilibrium potential ofions, which obviously cannot be satisfied for all ions at the same time. The constant-field approximation in (8) was used in our model because it at least takes concentrations explicitly into account. In a later section we show that if the ionic concentrations change and the equilibrium Ek in (2) are updated according to the Nernst equation, then the modified cable model based on (2) gives results similar to the electro-diffusion model based on (8).
Equation (9) must be supplemented by an ad- ditional constraint between the membrane potential and the ionic concentrations. We adopt the same capacitative model of the membrane used in the cable model; that is, we assume that the potential change in a short segment of a process is equal to the change of the total charge in the segment divided by its membrane capacitance:
V(z,t)= V~cst +(Fd/4Cm) ~ [nk(z,t)--nk.rest]Zk, (10) k
where V~est is the initial potential and nk.re~t is the initial ionic concentration of species k.
Neuronal processes often branch and change their diameters. If branches are allowed, then these equa- tions must be solved on a tree rather than a line.
2 I O ~ dz
d m I AZ I z lC3~ .~
d3
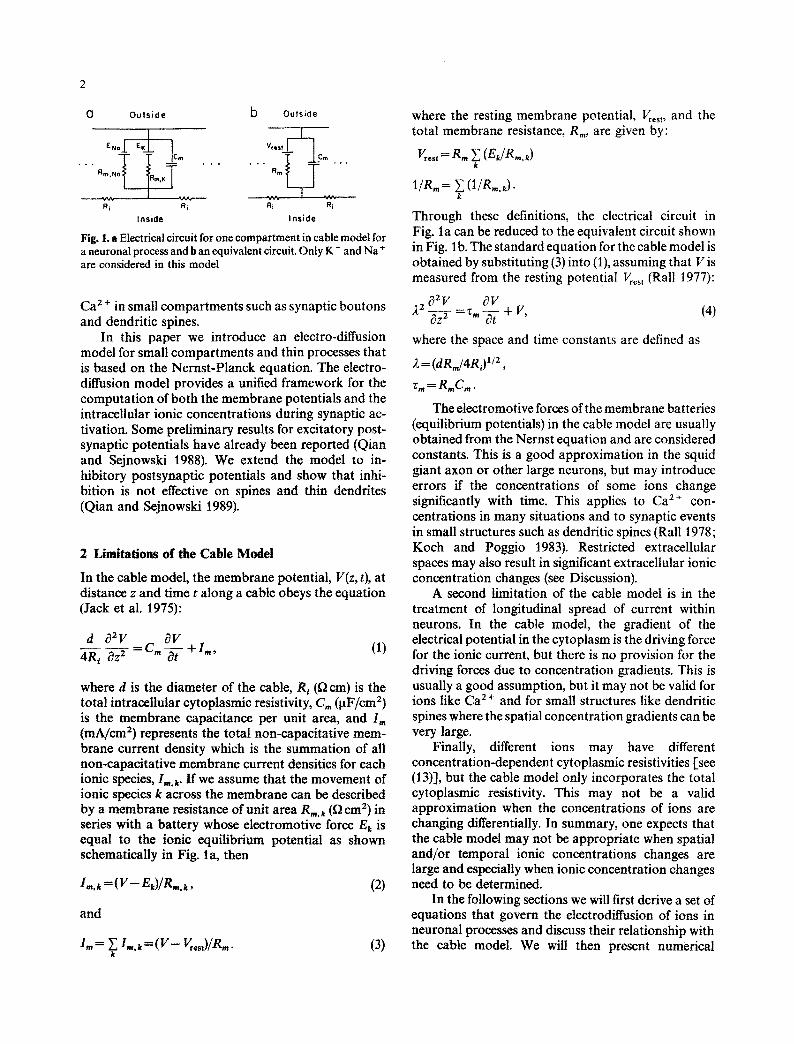
Fig. 2. A branch point of a neuronal process with diameter jumps. The three sample points are labeled 1, 2, and 3 around the branch point 0. The diameters for the three branches are dr, d2, and d~ respectively. Azt, /17,2, and /17,3 represent the spatial distances between point 0 and points 1, 2, and 3 respectively
Continuous diameter changes can be approximated by segments having piecewise constant diameters. At points where the diameter jumps and/or branches occur, the solutions can be matched using the continu- ity of flux at that point. The continuity constraint at a branch point can be derived from (5). For the geometry illustrated in Fig. 2 where both branching and diame- ter jumps occur, the continuity constraint at point 0 is:
Oz + "" [x =d2 Oz + ~k ~ Oz ,/12
\ Oz + - - (11) O[k 3"
The square of the diameter enters into this equation because the flux through the areas of each branch must be matched. There is an analytic solution of the cable model for branching dendrites having passive mem- branes if Rail's "3/2 power law" (Rail 1977) is satisfied. This law for an equivalent cylinder does not hold for our electro-diffusion model except in the limit when the concentration gradients go to zero and (2) rather than (8) is used to compute the membrane currents. A compartment approximation for the solution of (9) is inaccurate for large ionic fluxes if the continuity
constraint in (11) is not used to match solutions on the two sides of a diameter jump or at a branch point.
Note that (9) requires that both the potentials and the ionic concentrations be continuous with respect to z (otherwise the derivatives would become infinite). However, by (10) the potential is not continuous at a diameter jump if the ionic concentrations are con- tinuous. This is the artifact of assuming a sudden diameter change and can be resolved by setting the voltage at the jump to the average of the voltages on either side (see Appendix).
The differential equations in (9) coupled through (10) were converted to finite difference equations and were integrated by a first-order forward Euler approx- imation (Mascagni 1989). The solutions at diameter jumps and/or branching points were obtained by solving the coupled nonlinear algebraic equations derived from the matching conditions in (11). The details of these numerical methods are described in the Appendix.
4 Relationship Between the Electro-Diffusion Model and the Cable Model
In large neuronal processes the internal and external ionic concentrations are likely to remain approx- imately constant during a transient membrane conduc- tance change. If the concentration gradients are small, the contribution due to the diffusion of ions within the neuron becomes negligible and the longitudinal cur- rent is purely resistive. It can be shown (see Appendix) that (7) and (10) then reduce to the form in (1). Thus, the electro-diffusion model in the limiting case is identical to cable model in calculating the membrane potential V if the same membrane currents are used.
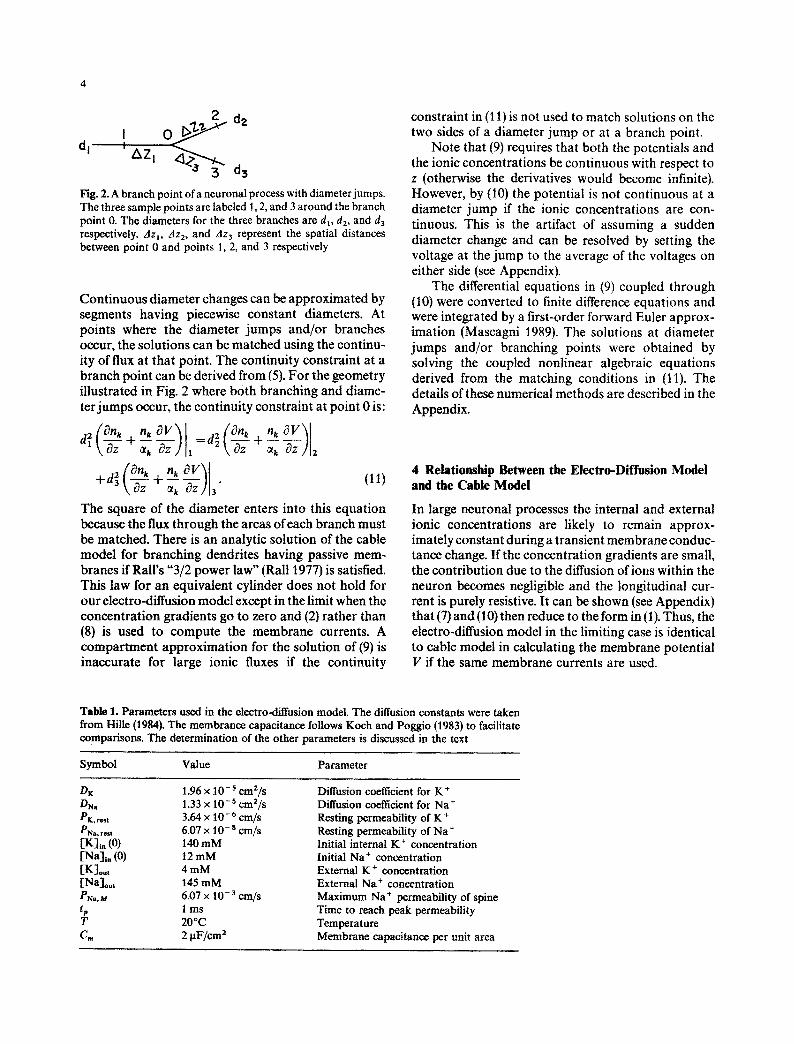
Table 1. Parameters used in the electro-diffusion model. The diffusion constants were taken from Hille (1984). The membrance capacitance follows Koch and Poggio (1983) to facilitate comparisons. The determination of the other parameters is discussed in the text
Symbol Value Parameter
Dg 1.96 x 10 -s cmZ/s Ds. 1.33 x 10 -5 cmZ/s PK, rest 3.64 • 10 -6 cm/s PNa, rest 6.07 x 10 -s cm/s [K]i. (0) 140 mM [Na]i,, (0) 12 mM [K]out 4 mM [Na]out 145 mM PNa. u 6.07 x 10- 3 cm/s tp 1 ms T 20 ~ C,. 2 pF/cm 2
Diffusion coefficient for K + Diffusion coefficient for Na + Resting permeability of K + Resting permeability of Na + Initial internal K + concentration Initial Na + concentration External K + concentration External Na + concentration Maximum Na + permeability of spine Time to reach peak permeability Temperature Membrane capacitance per unit area
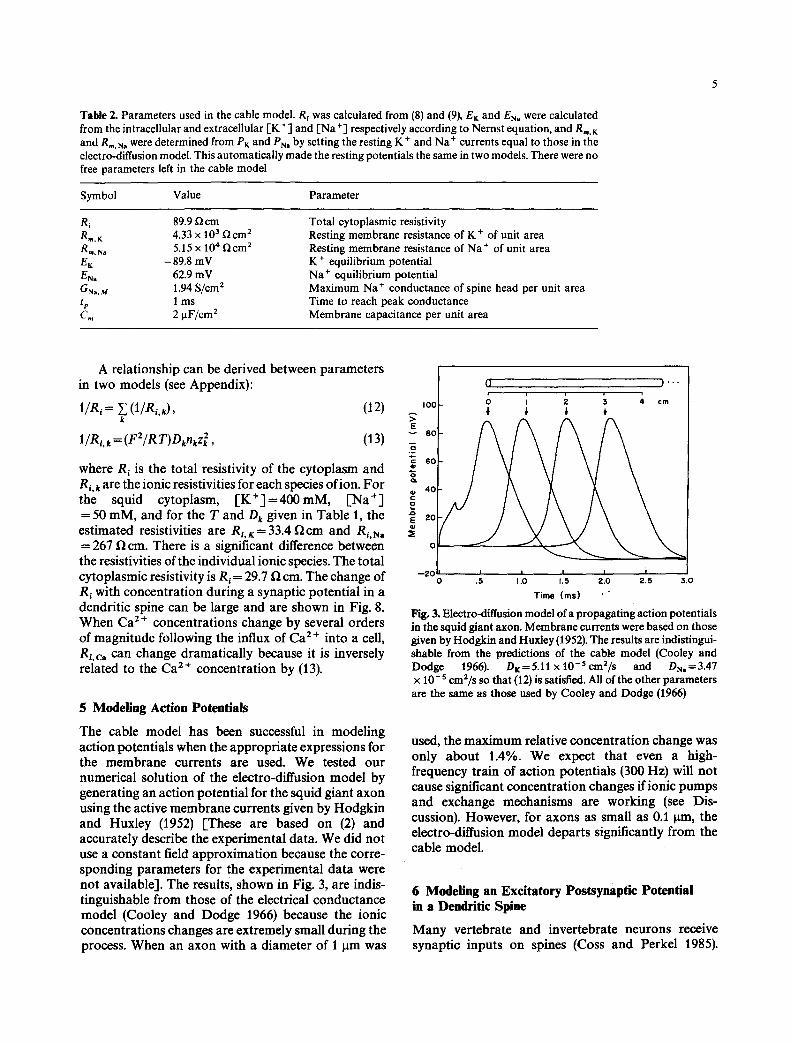
Table 2. Parameters used in the cable model. R~ was calculated from (8) and (9), EK and EN~ were calculated from the intracellular and extracellular [K +1 and [Na +] respectively according to Nernst equation, and R=. K and Rm.N~ were determined from PK and PN= by setting the resting K § and Na + currents equal to those in the electro-diffusion model. This automatically made the resting potentials the same in two models. There were no free parameters left in the cable model
Symbol Value Parameter
R~ 89.9 f~ cm R,.K 4.33 • 10 3 f2cm 2 R,..N= 5.15 x 10⁴ f~cm 2 EK -- 89.8 mV EN, 62.9 mV GNu. ~ 1.94 S/cm 2 t r 1 ms C,. 2 I.t F/cm 2
Total cytoplasmic resistivity Resting membrane resistance of K + of unit area Resting membrane resistance of Na § of unit area K § equilibrium potential Na + equilibrium potential Maximum Na § conductance of spine head per unit area Time to reach peak conductance Membrane capacitance per unit area
A relationship can be derived between parameters in two models (see Appendix):
1/R~ = ~ (1/Ri.k), k
(12) I~176 E 8 o
1/Ri, k = (F2/R T) DknkZ ~ , (13) _~
where Ri is the total resistivity of the cytoplasm and ~ eo R~. k are the ionic resistivities for each species of ion. For the squid cytoplasm, [ K + ] = 4 0 0 m M , [Na § ~ ,o = 50 mM, and for the T and D k given in Table 1, the ~ eo estimated resistivities are R i . x = 33.4 Q cm and R~.Na = 267 f~ cm. There is a significant difference between o the resistivities of the individual ionic species. The total cytoplasmic resistivity is R~ = 29.7 Q cm. The change of -ze Ri with concentration during a synaptic potential in a dendritic spine can be large and are shown in Fig. 8. When Ca 2+ concentrations change by several orders of magnitude following the influx of Ca 2 § into a cell, R~,ca can change dramatically because it is inversely related to the Ca 2 § concentration by (13).
5 Model ing Action Potentials
The cable model has been successful in modeling action potentials when the appropr ia te expressions for the membrane currents are used. We tested our numerical solution of the electro-diffusion model by generating an action potential for the squid giant axon using the active membrane currents given by Hodgkin and Huxley (1952) [These are based on (2) and accurately describe the experimental data. We did not use a constant field approximat ion because the corre- sponding parameters for the experimental data were not available]. The results, shown in Fig. 3, are indis- tinguishable from those of the electrical conductance model (Cooley and Dodge 1966) because the ionic concentrations changes are extremely small during the process. When an axon with a diameter of 1 Ilm was
0 )""
I I I I I .5 t.o 1.5 a.o a s 3.0
Time (ms) ' -
Fig. 3. Electro,diffusion model of a propagating action potentials in the squid giant axon. Membrane currents were based on those given by Hodgkin and Huxley (1952). The results are indistingui- shable from the predictions of the cable model (Cooley and Dodge 1966). DK=5.11 x 10 -s em2/s and DN,=3.47 x 1 O-s em2/s so that (12) is satisfied. All of the other parameters are the same as those used by Cooley and Dodge (1966)
used, the max imum relative concentration change was only about 1.4%. We expect that even a high- frequency train of action potentials (300 Hz) will not cause significant concentrat ion changes if ionic pumps and exchange mechanisms are working (see Dis- cussion). However, for axons as small as 0.1 0m, the electro-diffusion model departs significantly from the cable model.
6 Model ing an Excitatory Postsynaptic Potential in a Dendritic Spine
Many vertebrate and invertebrate neurons receive synaptic inputs on spines (Coss and Perkel 1985).
~ n d d m
Spine neck
Spine head
Fig. 4. Geometry of a model dendritic spine. The spine was located in the center of a dendrite with total length 300 pm and diameter 1 pm; the spine neck was 1 ~tm long and 0.1 pm in diameter; the spine head was 0.69 pm long and 0.3 pm in diameter
E
t - .Q g 0
J~ E
a
100
80
60
40
20
0
/ \ / \ ! "\
; \ \
0 1 2 3 4 5 Time (ms)
Because of the small size of dendritic spines, postsynap- tic potentials can be accompanied by significant changes in the internal ionic concentrations. In this section we simulate an excitatory postsynaptic poten- tial on a spine using the electro-diffusion model and compare the results with the conventional cable model. For simplicity, only two types of ions, K + and Na +, will be considered in this paper.
The morphology of the dendritic spine used in the simulations is shown in Fig. 4 (adapted from Koch and Poggio 1983). The total surface area of the spine head was 0.65 pm 2, neglecting the area at the ends of the cylinders. The synaptic input was modeled by adding a transient change in the resting Na + permeability of the membrane (Koch and Poggio 1983):
PN,(t) = PN.. M(etltp)" e-~'/',, (14)
where Psa . , is the maximum change in Na + permea- bility, tp is the time to reach peak, and e is the base of the natural logarithms. We follow the convention in Koch and Poggio (1983) and choose ct=4, which is smooth at t=0. For ~= 1 this function has a positive slope at t = 0 and is called the ~t-function by Rall (1967).
Table 1 summarizes the parameters used in our simulations of spines using the electro-diffusion model. We chose the membrane parameters so that the resting membrane potentials and resting membrane currents were the same as those in the cable model. The ionic membrane resistances for K + and Na + in cable model were determined from the total membrane resistance of about 4000 fl cm 2 and the resting membrane potential of about - 7 8 inV. Permeabilities were determined from membrane resistances by equating the resting currents of K + and Na + in two models.
The membrane potential change from the resting level during a simulated excitatory postsynaptic poten- tial is shown in Fig. 5. At the peak of the response the Na + permeability increased by 10 s over the resting membrane Na + permeability. The concomitant changes in the ionic concentration of K + are shown in Fig. 6. The changes of the Na + concentration (not
70
A 6O > E "-" 5 0
40 0 Q" 30 Q C
-~ 2o E
/ ",, r N,
1 2 3 4 5 Time (ms)
50
- / $
.Q ~ ,.10 X
0 1 2 3 4 5 c Time (ms)
Fig. 5a--c. Excitatory postsynaptic potential from the resting level ( - 78 mY) as a function of time at a the middle of the spine head, b the middle of the spine neck, and e the dendritic shaft at the base of the spine, modeled by the electro-diffusion model (solid line), the standard cable model (dashed line) and the modified cable model (dotted line). The parameters in these models are given in Tables t and 2
shown) were almost mirror images of those for K+; that is, they had about the same amplitude but opposite sign. A small change in the total con- centration ofK + and Na + causes a very large potential change because the membrane capacitance is quite small.
-20
-40
o - 6 0
- 8 0
-100
\
\ .
o ; 2 3 ,~ Time (ms)
0 . 3
0 . 2
0 .1
~- -0.1 ~ o Q
a - 1 0 , ,C
.~. - 2 0
-30
-40
-50
!
o i 2 3 :~ Time (ms)
0
& -2 r162
Jr -3 0
-5
-6 o ; 2 3 4
c Time (ms)
Fig. 6a--e. Changes of the intracellular K + concentration from the resting level (140 raM) during an excitatory postsynaptic potential at a the middle of the spine head, b the middle of spine neck, and e the dendritic shaft at the base of the spine as predicted by three models: The electro-diffusion model (solid line), the standard cable model (dashed line) and the modified cable model (dotted line). The parameters in these models are given in Tables 1 and 2
Fig. 7. Maximum response of an excitatory postsynaptic poten- tial from the resting level ( -78 mV) at the spine head and the dendritic shaft at the base of the spine as predicted by three models: The cable model (dashed line) and the modified cable model (dotted line) as functions of the maximum conductance change relative to the resting Na + conductance, and the electro- diffusion model (solid line) as a function of the maximum permeability change relative to the resting Na + permeability. GNa,,csl is the resting membrane conductance per unit area and is equal to the inverse of Rm, N a in Table 2
There are indeed significant concentrat ion changes in the spine compared to the resting concentration values and it is therefore incorrect to assume that the Nernst potentials remain constant, as in the cable model. In Fig. 7, the max imum excitatory postsynaptic potentials in the spine head and in the dendritic shaft at the base of spine are shown as functions of the max imum sodium permeabili ty over its resting value. The present model does not take into account the effects of limited extracellular space, such as extra- cellular K § accumulation. The consequences of in- eluding these effects is pointed out in the Discussion.
The results of the electro-diffusion model were compared with an equivalent cable model of the spine. The parameters given in Table 2 for the cable model were chosen to match those in Table 1 for the electro- diffusion model. The transient change in the mem- brane conductance per unit area of Na + from its resting values at the spine head dur ing the synaptic input was modeled by
GN,(t) = GN,, ~ e t / t o ) ~ e - =1, , , , (15)
where we chose a = 4 to match the functional form of the permeabili ty changes in (14). GN,, M is the max imum N a § conductance per unit area and was chosen by setting its ratio to the resting N a + conductance per unit area GNa ' rest(l/Rm. Na) equal to PNa, M/PNa, rest in the electro-diffusion model. The tp and Cm were same as those in the electro-diffusion model.
The ionic concentrations are normally assumed to remain constant in the cable model. However, it is
possible to compute the concentrations that are im- plicit in the cable model by integrating the currents flowing into each compartment for each ionic species:
Ank= i Ikdt, (16) 0
where I k is the total current of species k entering a compartment. Figures 5 and 6 show the time course of the membrane potential and K § concentration changes predicted by the cable model together with the results of electro-diffusion model. The maximum re- sponse of the membrane potential as a function of the maximum Na § conductance is plotted in Fig. 7 in comparison with electro-diffusion model. For small conductance changes the two models predicted similar potential responses. However, for large conductance changes there were significant differences between the responses predicted by the cable model and the electro- diffusion model, especially at the base of the dendritic spine.
The responses predicted by the cable model satu- rated as the membrane potential approached the Na § equilibrium potential. This saturation occurred at a lower membrane potential in the electro-diffusion model because of the increase in the internal Na § concentration and concomitant decrease of the Na + equilibrium potential. The longer the duration of the excitatory synaptic potential, the larger the change in the Na + equilibrium potential.
The discrepancies between the ionic concentration changes predicted by the two models are larger than what one might have expected from the differences between the membrane potentials. This is best seen by comparing the calculated K § concentration changes in the spine neck based on the two models (Fig. 6b). There is a dramatic decrease of K § concentration in the spine neck according to the electro-dhTusion model, while the cable model predicts that there should be a small increase. This difference can be attributed to the neglect of ionic diffusion in the cable model.
The membrane potential in the spine head is always higher than that of spine neck, so the potential gradient tends to drive ions from the head to the neck. However, the K § concentration in the spine head is much lower than that of spine neck due to the outflow o f K § ions to the extracellular space; therefore, the concentration gradient tends to drive K + ions from the neck to the head. The concentration gradient is so large that it dominates the process and results in a net K + flow from neck to head.
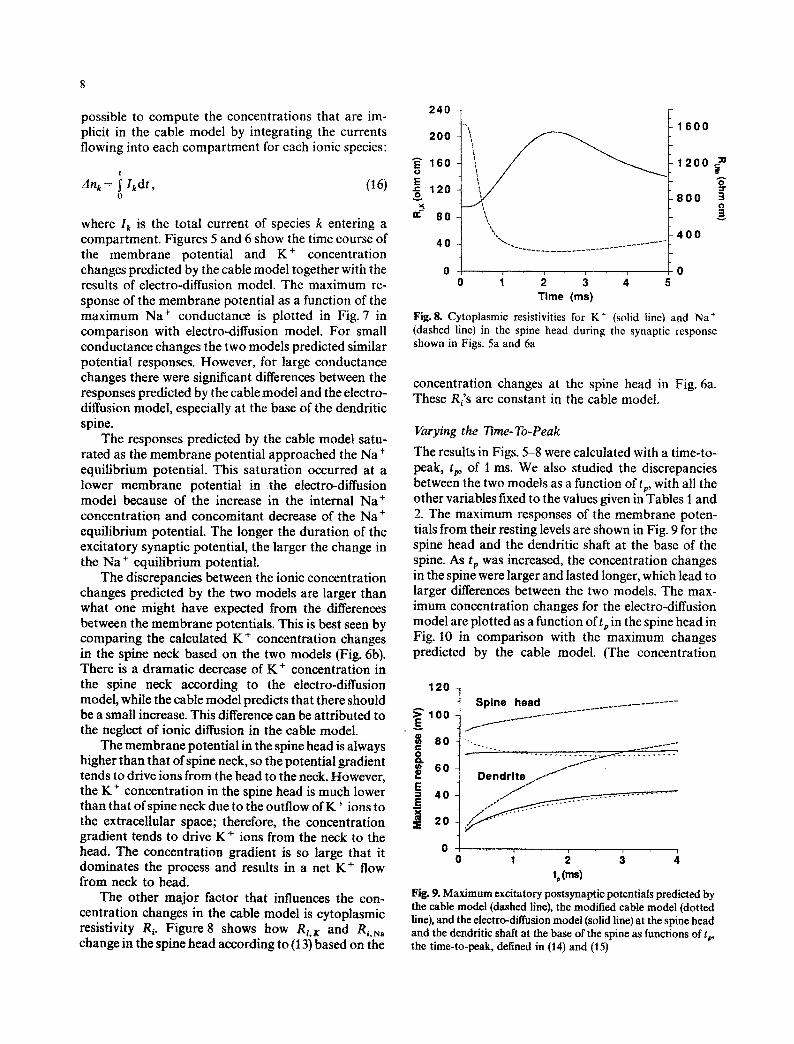
The other major factor that influences the con- centration changes in the cable model is cytoplasmic resistivity Ri. Figure 8 shows how Ri, K and R~,N~ change in the spine head according to (13) based on the
240
200
160
~ 1 2 0
a: 8 0
40
\ \ \
1600
1200 r
800 3 O g
400
�9 0 o i 2 3 4 5
Time (ms)
Fig. 8. Cytoplasmic resistivities for K + (solid line) and Na + (dashed line) in the spine head during the synaptic response shown in Figs. 5a and 6a
concentration changes at the spine head in Fig. 6a. These R~'s are constant in the cable model.
Varying the Time-To-Peak
The results in Figs. 5-8 were calculated with a time-to- peak, tp, of 1 ms. We also studied the discrepancies between the two models as a function of tp, with all the other variables fixed to the values given in Tables 1 and 2. The maximum responses of the membrane poten- tials from their resting levels are shown in Fig. 9 for the spine head and the dendritic shaft at the base of the spine. As tp was increased, the concentration changes in the spine were larger and lasted longer, which lead to larger differences between the two models. The max- imum concentration changes for the electro-diffusion model are plotted as a function of tp in the spine head in Fig. 10 in comparison with the maximum changes predicted by the cable model. (The concentration
120
>~E100 ~ 6 o g ~ 6 0
E = 4 0 E X
~ 2 o
o
Spine head
Dendrite . . I - - '~ ' -"
o i 2 3 tp (ms)
Fig. 9. Maximum excitatory postsynaptic potentials predicted by the cable model (dashed line), the modified cable model (dotted line), and the electro-diffusion model (solid line) at the spine head and the dendritic shaft at the base of the spine as functions of tp, the time-to-peak, defined in (14) and (15)
300
E 250
200 $
150 0 0
100 0 _= [ so
o
tp lms)
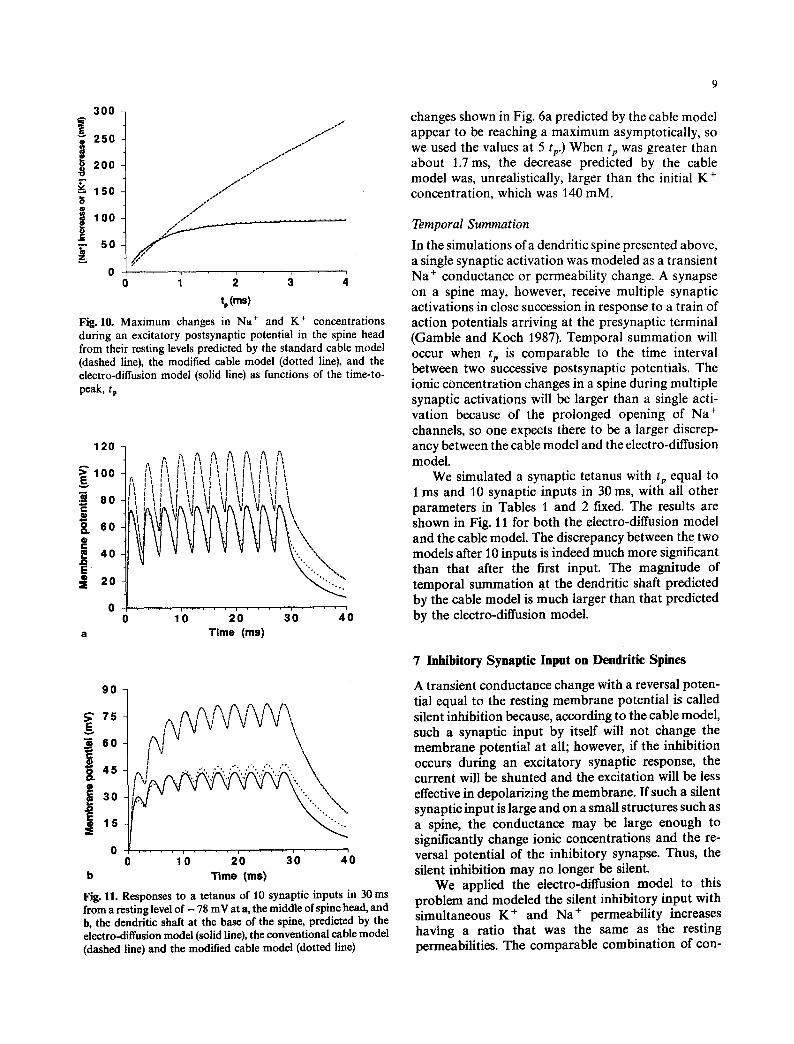
Fig. 10. Maximum changes in Na § and K § concentrations during an excitatory postsynaptic potential in the spine head from their resting levels predicted by the standard cable model (dashed line), the modified cable model (dotted line), and the electro-diffusion model (solid line) as functions of the time-to- peak, tp
1 2 0 -I ~ ,~ ,~ r, ~ h '~
q �9 1 1 I ! I I I I , g , o o x , , , , ,, ~' ~, , . ~ I ' I '~I ~
J .... ,, :, ,,l 'flil \ i ,o tii,1 ff1"/l'
4o
o 0 10 20 30 40
a Time (ms)
changes shown in Fig. 6a predicted by the cable model appear to be reaching a maximum asymptotically, so we used the values at 5 tz) When tp was greater than about 1.7 ms, the decrease predicted by the cable model was, unrealistically, larger than the initial K § concentration, which was 140 raM.
Temporal Summation
In the simulations of a dendritic spine presented above, a single synaptic activation was modeled as a transient Na + conductance or permeability change. A synapse on a spine may, however, receive multiple synaptic activations in close succession in response to a train of action potentials arriving at the presynaptic terminal (Gamble and Koch 1987). Temporal summation will occur when tp is comparable to the time interval between two successive postsynaptic potentials. The ionic concentration changes in a spine during multiple synaptic activations will be larger than a single acti- vation because of the prolonged opening of Na + channels, so one expects there to be a larger discrep- ancy between the cable model and the electro-diffusion model.
We simulated a synaptic tetanus with tp equal to 1 ms and 10 synaptic inputs in 30 ms, with all other parameters in Tables 1 and 2 fixed. The results are shown in Fig. 11 for both the electro-diffusion model and the cable model. The discrepancy between the two models after 10 inputs is indeed much more significant than that after the first input. The magnitude of temporal summation at the dendritic shaft predicted by the cable model is much larger than that predicted by the electro-diffusion model.
9O
;, , , , , / \ ; " , f \ f \
,.o d \ I . . , - . . " . ' " " " , . " , \ 4 5 t \ l "'..' '.: '..: ".' 'v '.: '. \
0 10 20 30 40 b T i m e ( m s )
Fig. 11. Responses to a tetanus of 10 synaptic inputs in 30 ms from a resting level of - 78 mV at a, the middle of spine head, and b, the dendritic shaft at the base of the spine, predicted by the electro-diffusion model (solid line), the conventional cable model (dashed line) and the modified cable model (dotted line)
7 I n h i b i t o r y S y n a p t i c I n p u t o n D e n d r i t i c S p i n e s
A transient conductance change with a reversal poten- tial equal to the resting membrane potential is called silent inhibition because, according to the cable model, such a synaptic input by itself will not change the membrane potential at all; however, if the inhibition occurs during an excitatory synaptic response, the current will be shunted and the excitation will be less effective in depolarizing the membrane. If such a silent synaptic input is large and on a small structures such as a spine, the conductance may be large enough to significantly change ionic concentrations and the re- versal potential of the inhibitory synapse. Thus, the silent inhibition may no longer be silent�9
We applied the electro-diffusion model to this problem and modeled the silent inhibitory input with simultaneous K + and Na § permeability increases having a ratio that was the same as the resting permeabilities. The comparable combination of con-
10
1 2
1 0 / . /
... 8
__ 6 e-
f i t .
2
0 1 2 3 4 5 Time (ms)
Fig. 12. Responses to silent inhibitory synaptic input at the spine head (solid line) predicted by the electro-diffusion model. The K + and Na + permeabilities changes had a ratio equal to that of their resting permeabilities so that in the standard cable model there was no response at the resting potential. The peak K + permea- bility change, Pr.ta, was 6.07 x-2cm/s. This apparently ex- citatory response is caused by a shift of the synaptic reversal potential (dotted line) from its resting level
7 0
60
50
40
30
20
g
O r
, D
E
=Z 1 0
0 o 2 3 4
Time (ms)
Fig. 13. Membrane potential responses to simultaneous ex- citatory and silent inhibitory synaptic inputs on the same spine at the middle of spine head, and the dendritic shaft at the base of the spine, predicted by three models: The electro-diffusion model (solid line), the conventional cable model (dashed line) and the modified cable model (dotted line). The amplitude of inhibition (the same as in Fig. 12) was 10 times larger than the amplitude of excitation. All other parameters are given in Tables I and 2. The responses at the spine head and the dendritic shaft in the absence of inhibition is given in Fig. 5a and b
ductance changes produces no change in potential in the cable model. Figure 12 shows that the response in the spine head predicted by the electro-diffusion simulation is excitatory, not silent as expected from the cable model. This is a consequence of the decrease in the concentration of K + during the response, which leads to an increase of the equilibrium potential for K § If the silent inhibitory input is carried exclusively by CI- , a third ion whose equilibrium potential is close to the resting potential, there should be no response. As the concentration of C1- inside the cell rises, the driving force for the C1- becomes zero and there is no net current.
Interaction Between Inhibitory and Excitatory Synaptic Inputs
In their study of nonlinear interactions between exci- tation and inhibition using the cable model Koch and Poggio (1983) and Koch et al. (1983) conclude that a strong silent inhibitory input can effectively veto the effect of an excitatory input provided that they have the appropriate temporal and spatial relationships. We studied this type of interaction at the spine head by modeling a silent inhibitory input as described above together with an excitatory input. As shown in Fig. 13, the veto effect predicted by the electro-diffusion model is much weaker than predicted by the cable model based on comparable conductances changes.
The reduction in the effectiveness of shunting inhibition on the excitatory synapse is brought about
mainly because the large K § outflow makes the Nernst potential of K § much more positive and therefore less inhibitory. Although we did not simulate the case when C1- is the source of inhibition, we would expect to obtain similar results since the depolarization and increase of C1- permeability would also produce a C1 - current that would in turn make the C1- Nernst potential less negative. According to the electro- diffusion model, it is impossible to have a truly silent inhibition on a spine.
For an inhibitory input on a large dendrite or cell body (or for a combination of excitation and inhi- bition), the change in concentration at the site of inhibition is almost negligible and the veto effect predicted by the cable model remains valid. However, for thin dendrites (around 0.1 lain in diameter) the changes in concentration can be very large, and the conclusions reached for the spine are equally valid for the dendrite. We have also studied the effect of silent inhibition as a function of the relative timing between excitation and inhibition on spines and have found that the veto effect predicted from the cable model (Koch and Poggio 1983) does not occur.
8 Modifications to the Cable Model
The electro-diffusion model is highly computation intensive and cannot be used routinely for large-scale simulations of complex dendritic trees (Wathey et al. 1989). However, we found that the following modifica-
tions of the cable model allowed it to more accurately approximate the predictions of the electro-diffusion model. At each time step:
i) Calculate the intracellular concentration of each ionic species explicitly in each compartment from the membrane currents and the ionic currents flowing between compartments [see (16)].
ii) Compute the new membrane equilibrium po- tentials for each compartment using the intracellular and extracellular ionic concentrations according to Nernst equation and update the membrane batteries:
El, = (RT/Fzk) In nk(out) nk(in) '
where nk(out) is the ionic concentration of species k outside the membrane and nk(in) is the ionic con- centration inside the membrane.
iii) Replace the single longitudinal resistance be- tween compartments with parallel resistances R~, k in series with batteries for each ionic species [-see (13)]. [In an earlier report (Qian and Sejnowski 1988), we did not update the cytoplasmic resistances; the update of these resistances significantly improves the modified cable model, especially for tp > 1 ms.]
iv) Determine the longitudinal batteries by the Nernst potential from ionic concentrations of the two compartments they connect and update in the same way as the membrane batteries. The potential of the battery for species k between compartments j and j + 1 is:
nk(J) Ei,k = (R T/Zzk) In n~,q + 1------) '
where a positive value for E~. k means that the positive terminal of the battery is pointing to the j + l compartment.
A schematic view of the modified cable model is represented in Fig. 14. This model was applied to the dendritic spine model in Fig. 4 and the results are shown in comparison with the electro-diffusion and cable models in Figs. 5-7, 9-11, and 13.
The agreement between the modified cable model and electro-diffusion model for predicting membrane potentials was good except for the interaction between excitatory and inhibitory inputs shown in Fig. 13. The comparisons between the predicted concentration changes was good at the spine head but less satis- factory at the spine neck and dendrite. However, note in Fig. 6b that the K + concentration change in the spine neck had at least the right sign. The discrepancy between the electro-diffusion model and the modified cable model is larger when tp is smaller, a condition in which concentrations are changing more quickly and are farther from equilibrium. The Nernst potential
11
Outside �9 ENa~Cm
" '
Rl.~ Ei.K Inside R=.K Ei.K
Fig. 14. Electrical circuit for a single compartment of the modified cable model. The batteries in the membrane and between compartments are calculated from the Nernst potentials and change value during a response as concentrations change. The resistivities in the cytoplasm are also updated at each time step
represents the driving force due to concentration gradient only in an equilibrium state.
9 Discussion
In most circumstances, the cable model of electrical conduction in neurons gives accurate predictions for membrane potentials during transient electrical events. A tiny amount of charge is enough t o cause a substantial change in the membrane potential because the membrane capacitance is small, and as a conse- quence the ionic concentrations usually are nearly constant. However, the individual concentrations of certain ions could change significantly as long as changes in the total charge are nearly balanced out. This is more likely to happen in very small structures such as dendritic spines and for an ion such as Ca 2 +, which is normally maintained at a very low con- centration inside a cell. Thus, the predictions from the cable model should not be used without a careful analysis.
In this paper, we have developed a one- dimensional electro-diffusion model of electrical con- duction which reduces to the cable model when ionic concentrations are approximately constant. This model was used to study changes in ion concentrations and membrane potentials in dendritic spines in re- sponses to synaptic inputs. We found that ionic concentrations changed considerably in many circum- stances. Thus, significant errors can be made in estimating membrane potentials and concentration changes using the cable model if the effects of diffusion and the changes in the driving forces for membrane currents are not taken into account.
On dendritic spines, these effects reduce the ampli- tude of excitatory postsynaptic potentials generated by Na + currents, and they make inhibitory inputs gen-
12
erated by K § and CI- currents nearly ineffective. The temporal summation of synaptic potentials is much weaker according to electro-diffusion model so multi- ple synaptic inputs in close succession will only make the response at the cell soma longer but not much larger. The cable model also exaggerates the veto effect of inhibition on an excitatory input when both occur on the same spine.
All these results can be understood as a conse- quence of changing ionic concentrations and shifting equilibrium potentials. The postsynaptic responses are mainly determined by the ionic species with the largest transient membrane permeability. Regardless of the equilibrium potential for this species (excitatory or inhibitory), the opening of channels with sufficient duration will shift the equilibrium potential of the synapse toward zero because of the large concen- tration changes. Therefore, if the equilibrium potential of the ionic species is greater than zero (Na § and Ca 2 +) the cable model will overestimate the response. For ions whose equilibrium potential is less than zero (K § and C1-), the cable model makes predictions that can be qualitatively incorrect. For example, under certain conditions an inhibitory synaptic input that causes a K § conductance increase may in fact produce a postsynaptic depolarization.
Several authors have suggested that active currents in spines could enhance the transmission of signals down dendrites to the cell body (Shepherd et al. 1985; Perkel and Perkel 1985; Segev and Rail 1988). Their conclusion is still valid except that the amplitude of an action potential on a spine would be reduced (see Fig. 7) and active spines would have to be closer together to maintain transmission.
For synapses on large dendrites rather than on spines, we do not expect any significant difference between the electro-diffusion model and the cable model because the ionic concentration changes are" negligible. Synaptic inputs on thick dendrites should not suffer the saturation caused by shifts of the Nernst potential, the absence of temporal summation, and lack of an inhibitory veto effect that we have demon- strated for synapses on spines. This raises the interest- ing possibility that otherwise identical synapses could have different functions depending on their location. It has been reported that during learning and develop- ment, the spine neck shortens and merges into the dendrite (Rausch and Scheich 1982; Coss and Globus 1978; Brandon and Coss 1982; Cosset al. 1980). The concentration changes in spines is caused not just by the small volume of the spine head but as well by the long, narrow spine neck which helps to maintain the large concentration changes that occur in the spine head. Thus, synapses on spines with long necks could switch to a different functional state if the neck were to
shorten sufficiently for the spine to merge with the dendritic shaft.
Ionic concentration changes are usually not ex- plicitly considered in the cable model. Although ionic currents in the cable model can be integrated to yield concentration changes, this usually gives erroneous results (Figs. 6b and 10) even when the membrane potentials are predicted fairly well. Often, the cable model is solved first to find the membrane potentials and then diffusion processes are introduced to deter- mine the ionic concentration changes (Gamble and Koch 1987; Yamada et al. 1989). Our model, however, considers the membrane potential and the ionic con- centrations changes at the same time and thus provides a more natural and accurate way for solving the problem.
Ionic pumps and ionic exchange across the mem- brane could affect the predictions made by our simu- lations. The influence of these slow membrane pro- cesses can be estimated as follows. Assume that at rest the pump current for Na § or K § balances the resting Na + or K + membrane current. The pump current density in our model should be around 2.7 IxA/cm 2 based on the data in Tables 1 and 2, which is consistent with experimentally-determined pump current dens- ities in the i.tA/cm 2 range (Weer and Rakowski 1984). A single excitatory postsynaptic potential lasting about 1.0ms would produce Na § and K § concentration changes of 50 mM in the spine head. In contrast, Na-K pumps would take about 200 ms to change the ionic concentrations by a comparable amount. Since our results were based on the first few ms of the response, the inclusion of pumps will not affect our conclusions significantly.
We have also assumed that extracellular ionic concentrations were constant to simplify our calcu- lations. Assume that the extracellular space around a spine head that is effectively available for exchange in 0.5 ms is about same as the volume of spine. Then a change of concentration in the spine head would cause an equal change with opposite sign outside the spine head. For tp = 0.25 ms, the extracellular [Na +] would change from 140mM to about l l 0 m M and [K § from 4 mM to about 34 mM in about 0.5 ms. [See Yamada et al. (1989) for a similar estimate.] Although the extracellular K § concentration would increase by a larger factor, the maximum value of an excitatory synaptic response is mainly determined by the Nernst potential of Na § because the Na § permeability is much larger during an excitatory synaptic input. Also, glial cells are very effective in maintaining K § homeostasis on a longer time scale so that the actual change during maintained activity is probably less.
Thus the main effect of a limited extracellular space is on the Nernst potential of Na +. Based on the above
estimates, this would reduce the peak response of the postsynaptic potential by about 6 mV at the spine head. For large tp and multiple synaptic inputs, the Na + concentration change is greater but is achieved over a longer period of time. The corresponding effective extracellular space around the spine head would then be larger because more time allows ions to diffuse farther. Thus, the modification would not be much greater. For an excitatory input driven by a Na § current, the effects of restricted extracellular space always reduce the amplitude of response and thus will tend to make the differences with the cable model even greater.
For interactions between excitation and inhibition on a spine or a thin dendrite, the change in con- centration of extracellular K § can no longer be neglected because of the large K § permeability caused by the inhibition. However, extracellular K + accumu- lation further reduces the veto effect of inhibition. In general, extracellular concentration changes always produce effects in the same direction as the intra- cellular concentration changes, as discussed at the beginning of this section.
The effects of restricted extracellular space, ionic pumps, and ionic buffers can be easily included in our model when the ionic concentrations are updated, but only if the relevant parameters are available from experiments. These factors are essential for models that treat the diffusion of intracellular Ca 2 § ions (Fogelson and Zucker 1985; Simon and Llinas 1985; Stockbridge and Moore 1984; Yamada et al. 1989).
We used an explicit method to solve the electro- diffusion equations. Very small time step had to be used to make the calculation stable and therefore the simulation was much slower than cable model. This problem can be partly alleviated by using an implicit method of integration (Mascagni 1989). The modified cable model introduced in the last section was much faster (see Appendix). However, the modified cable model may not be able to accurately predict the concentration changes in the spine neck and the dendrite, and its predictions of interactions between excitation and inhibition may also be seriously in error in some circumstances. The electro-diffusion model should be used whenever accurate estimates are needed.
A p p e n d i x
Derivation of (7)
In cylindrical coordinates (Q, ~b, z), (6) becomes:
O J4. + 1 0J4,r ~gnk 1 O(eJ4,e) + , =0. (A1)
For a cylindrically-symmetric neuronal process, J4.~ = 0, and all the variables are independent of ~b. Integrate both sides of (A 1)
13
over the cross sectional area of the process, assuming that J4.z and n k are independent of ~:
4 OJk. One (A 2)
where J4,~l~ = nt2 is the membrane flux of ionic species k, J,.,~. The Q and z components of (5) can be written as:
_ :0.4 0 v ) ,
_ /'dn4 nk dV'] J~,, = --D4 ~x~Z- + ~ ~-z ]" (A4)
Equation (7) is obtained by inserting (A4) into (A27. Equation (A37 can be integrated under the constant field approximation (Goldman 1943) to obtain (87.
Membrane Potential at a Diameter Jump or Branch Point
Consider Fig. 15 in which the diameter of a process changes from dl to d2 within a short distance e. As ~--*0, there is a discontinuity, or diameter jump at z=0. The potential at the jump is:
I V(0,t)= lim - S V(z, t)dz. (A6)
�9 ~ 0 s 0
From (10), this becomes:
V(O, t) = V~.,t + (F/4C..)
xl l im(1/e) i d(z )dz lY ,[n , (z , t ) -n k ..... ]z,, (A77 - _ l k L,~O 0
where the spatial variable z should not be confused with valence z 4. For small z we can use a linear approximation for d(z):
d(z)=dl +(d2-dOz/n.
This expression can be substituted into (A7) to obtain:
V(O,t)=V,~.t+(F/4C,,)[(dt+d27/2]Y.[nk(z,t)-nk ..... ]z~, (A8) k
which is the average of the potentials on both sides of diameter jump. This result can be generalized to the branching ease shown in Fig. 2: The branching point is then the average of the potentials in all three branches.
Numerical Methods
We used an explicit method to integrate the electro-diffusion equations. For a small time step At and spatial sample points separated by Az, the one-dimensional electro-diffusion (9) re-
d 2
!
I I - - z O E
Fig. 15. Jump in dendritic diameter from dl to d 2 over distance
14
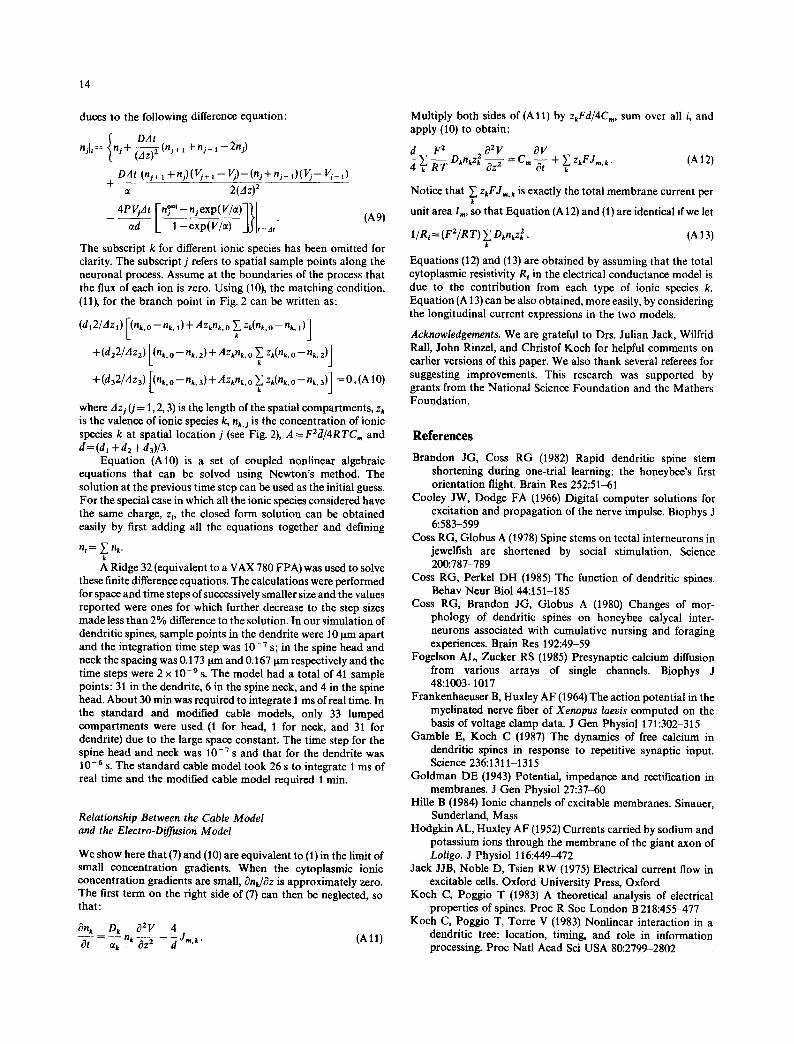
duces to the following difference equation:
( DAt njlt= i n s + ~ (nj+, + n j - i --2n i)
DAt (n j+ l + n.j) (V/+ l -- V j ) - (nj + n j_ I ) ( V j - - Vj_ 1) +
2(Az) 2
I-,:.,- L- ] ~ .JJl,-,,," (A9)
The subscript k for different ionic species has been omitted for clarity. The subscript j refers to spatial sample points along the neuronal process. Assume at the boundaries of the process that the flux of each ion is zero. Using (10), the matching condition, (11), for the branch point in Fig. 2 can be written as:
+(d32/dz3) [(n~.o--nk.3)+ Azknk. o ~ zk(nk.o--nk.3) ] =0,(A 10)
where Az s (j = 1, 2, 3) is the length of the spatial compartments, zk is the valence of ionic species k, nk,s is the concentration of ionic species k at spatial location j (see Fig. 2), A = F2Z[/4RTCm and aa= (dl +d2 + d3)/3.
Equation (A10) is a set of coupled nonlinear algebraic equations that can be solved using Newton's method. The solution at the previous time step can be used as the initial guess. For the special case in which all the ionic species considered have the same charge, zi, the closed form solution can be obtained easily by first adding all the equations together and defining
n i ~--- ,~ nk. k A Ridge 32 (equivalent to a VAX 780 FPA) was used to solve
these finite difference equations. The calculations were performed for space and time steps of successively smaller size and the values reported were ones for which further decrease to the step sizes made less than 2% difference to the solution. In our simulation of dendritic spines, sample points in the dendrite were 10 ~tm apart and the integration time step w a s 10 - 7 S; in the spine head and neck the spacing was 0.173 tam and 0.167 ttm respectively and the time steps were 2 x 10 -9 S. The model had a total of 41 sample points: 31 in the dendrite, 6 in the spine neck, and 4 in the spine head. About 30 min was required to integrate I ms of real time. In the standard and modified cable models, only 33 lumped compartments were used (1 for head, 1 for neck, and 31 for dendrite) due to the large space constant. The time step for the spine head and neck was 10 -7 s and that for the dendrite was 10 -6 s. The standard cable model took 26 s to integrate 1 ms of real time and the modified cable model required 1 rain.
Relationship Between the Cable Model and the Electro-Diffusion Model
We show here that (7) and (10) are equivalent to (1) in the limit of small concentration gradients. When the cytoplasmic ionic concentration gradients are small, OnUdz is approximately zero. The first term on the right side of (7) can then be neglected, so that:
ank Dk 02V 4 = ~-k nk~-z2 -- ~ J,,.l- (Al l )
Multiply both sides of (Al l ) by zkFd/4C,,, sum over all i, and apply (10) to obtain:
d F 2 2 02V 0V R-T D~nkzk az ~ = C,, ~-~ + ~ zkFJ,, k . (A 12)
Notice that ~ z~F.l,,, k is exactly the total membrane current per k
unit area Ira, so that Equation (A12) and (1) are identical if we let
1/R, = (F2/R T) Y~ Dknkz 2 . (A 13) k
Equations (12) and (13) are obtained by assuming that the total cytoplasmic resistivity Ri in the electrical conductance model is due to the contribution from each type of ionic species k. Equation (A 13) can be also obtained, more easily, by considering the longitudinal current expressions in the two models.
Acknowledgements. We are grateful to Drs. Julian Jack, Wilfrid Rail, John Rinzel, and Christof Koch for helpful comments on earlier versions of this paper. We also thank several referees for suggesting improvements. This research was supported by grants from the National Science Foundation and the Mathers Foundation.
References
Brandon JG, Coss RG (1982) Rapid dendritic spine stem shortening during one-trial learning: the honeybee's first orientation flight. Brain Res 252:51-61
Cooley JW, Dodge FA (1966) Digital computer solutions for excitation and propagation of the nerve impulse. Biophys J 6:583-599
Coss RG, Globus A (1978) Spine stems on tectal interneurons in jewelfish are shortened by social stimulation. Science 200:787-789
Coss RG, Perkel DH (1985) The function of dendritic spines. Behav Neur Biol 44:151-185
Coss RG, Brandon JG, Globus A (1980) Changes of mor- phology of dendritic spines on honeybee calycal inter- neurons associated with cumulative nursing and foraging experiences. Brain Res 192:49-59
Fogelson AL, Zucker RS (1985) Presynaptic calcium diffusion from various arrays of single channels. Biophys J 48:1003-1017
Frankenhaeuser B, Huxley AF (1964) The action potential in the myelinated nerve fiber of Xenopus laeois computed on the basis of voltage clamp data. J Gen Physiol 171:302-315
Gamble E, Koch C (1987) The dynamics of free calcium in dendritic spines in response to repetitive synaptic input. Science 236:1311-1315
Goldman DE (1943) Potential, impedance and rectification in membranes. J Gen Physiol 27:37-60
Hille B (1984) Ionic channels of excitable membranes. Sinauer, Sunderland, Mass
Hodgkin AL, Huxley AF (1952) Currents carried by sodium and potassium ions through the membrane of the giant axon of Loligo. J Physiol 116:449-472
Jack JJB, Noble D, Tsien RW (1975) Electrical current flow in excitable cells. Oxford University Press, Oxford
Koch C, Poggio T (1983) A theoretical analysis of electrical properties of spines. Proc R Soc London B 218:455-477
Koch C, Poggio T, Torre V (1983) Nonlinear interaction in a dendritic tree: location, timing, and role in information processing. Proc Natl Acad Sci USA 80:2799-2802
15
Malenka RC, Kauer JA, Zucker RS, Nicoll RA (1988) Postsynap- tic calcium is sufficient for potentiation of hippocampal synaptic transmission. Science 242:81-84
Mascagni MA (1989) Numerical methods for neuronal modeling. In: Koch C, Segev I (eds) Methods in neuronal modeling. MIT Press, Cambridge
Perkel DH, Perkel DJ (1985) Dendritic spines: role of active membrane modulating synaptic efficacy. Brain Res 325:331-335
Qian N, Sejnowski TJ (1988) Electro-diffusion model of electrical conduction in neuronal processes. In: Woody CW, Alkon DL, McGaugh JL (eds) Cellular mechanisms of conditioning and behavioral plasticity. Plenum Press, New York
Qian N, Sejnowski TJ (1989) Inhibition on spines and thin dendrites may be ineffective because of ionic concentration changes. Soc Neurosci (abstr) 15
Rail W (1967) Distinguishing theoretical synaptic potentials computed for different soma-dendritic distribution of synap- tic input. J Neurophysioi 30:1136-1168
Rall W (1977) Core conductor theory and cable properties of neurons. In: Kandel ER (ed) Handbook of physiology: the nervous system. American Physiological Society, Bethesda, Md, pp 39-97
Rall W (1978) Dendritic spines and synaptic potency. In: Poeter R (ed) Studies in neurophysiology. Cambridge University Press, Cambridge
Rail W, Segev I (1987) Functional possibilities for synapses on dendrites and dendritic spines. In: Edelman GM, Gall WF, Cowan WM (eds) New insights into synaptic function. Wiley, New York
Rausch G, Scheich H (1982) Dendritic spine loss and enlargement during maturation of the speech control system in mynah bird (Gracula religiosa). Neurosci Lett 29:129-133
Segev I, Rail W (1988) Computational study of an excitable dendritic spine. J Neurophysiol 60:499-523
Shepherd GM, Brayton RK, Miller JP, Segev I, Rinzel J, Rail W (1985) Signal enhancement in distal cortical dendrites by means of interactions between active dendritic spines. Proc Natl Acad Sci USA 82:2192-2195
Simon SM, Llinas RR (1985) Compartmentalization of the submembrane calcium activity during calcium influx and its significance in transmitter release. Biophys J 48:485-498
Stockbridge N, Moore JW (1984) Dynamics of intracellular calcium and its possible relationship to phasic transmitter release and facilitation at the frog neuromuscular junction. J Neurosci 4:803-811
Wathey J, Lytton W, Jester J, Sejnowski T (1989) Simulations of synaptic potentials using realistic models of hippocampal pyramidal neurons. Soc Neurosci (abstr)15
Weer PD, Rakowski RF (1984) Current generated by backward- running electrogenic Na § pump in squid giant axons. Nature 309:450-452
Yamada WM, Koch C, Adams PR (1989) Multiple channels and calcium dynamics. In: Koch C, Segev I (eds) Methods in neuronal modeling. MIT Press, Cambridge
Received: October 16, 1988 Accepted in revised form: June 27, 1989
Dr. Terrence Sejnowski Computational Neurobiology Laboratory The Salk Institute P.O. Box 85800 San Diego, CA 92138-9216 USA