An Electronic Load Controller for Micro-Hydro Power Plants in the Philippines Group: Kristian Lending, Yi Sheng Koh, Melvic Low, Ravindra Bhadti, Leonardo Ialongo, Alexander Gallo and Sanjana George Supervisor: Professor Tim Green
Transcript
An Electronic Load Controller for Micro-Hydro Power Plants in the Philippines
Group: Kristian Lending, Yi Sheng Koh, Melvic Low, Ravindra Bhadti, Leonardo Ialongo, Alexander Gallo and Sanjana George
3. Switching Control .................................................................................................................................. 4
High Level Design ......................................................................................................................................... 5
Appendix A: Further Graphs from Zener Diode Simulation Tests ............................................ 12
Appendix B: Full Microcontroller Arduino Code ........................................................................ 13
3
Introduction Approximately 2 billion people in the world do not have access to a reliable source of electricity.1 Our project group is working with Engineers Without Borders (EWB) who are aiming to install Micro-hydro power plants (MHPs) in Mountain Province in the Philippines. This is an area where factors such as lack of infrastructure and challenging terrain make it difficult to provide grid electricity.2 In addition to the high costs of the system, unregulated fluctuations in the load on the demand side often cause long-term damage to plant components.3
This motivates the need for an Electronic Load Controller (ELC). Our aim is to design a digital ELC that is cheap, light and easy to repair with a simple user interface. It should also be easy to upgrade the software side to include extra functionality such as remote monitoring.
Despite the limited time scale of the project, testing and analysis of a prototype design will continue beyond this with EWB, with implementation occurring in the summer of 2014. This could provide a stable source of local AC grid-equivalent power to the community in the Philippines and has the potential to be rolled out to 28 other MHP sites in the country.3
This report covers our design procedure for the ELC, detailing the decisions and challenges we faced, before deciding on our final low-level design. It then includes problem analysis from the results of our build and test phases. Lastly before concluding, we have studied the economic, environmental and social impacts of the load controller. All of which are crucial to the success of the project.
Project Context
Micro-hydro power plants (MHPs) are systems that utilise the gravitational potential energy of freely flowing water in order to generate AC electricity. They are currently a developing field with attempts mainly being carried out in countries such as Peru, Sri Lanka and Nepal.2 Micro-hydro power plants do not require rigorous maintenance and are relatively easy to operate.4 They compensate for the difficulty of grid extension in mountainous regions and have low transmission costs as the demand load is within close range of electricity generation.4
A high return on capital is difficult with rural electrification due to the remote locations of implementation and their economic situations.2 Electric motors used as generators, the use of plastics in pipes and low cost turbine designs have all greatly improved MHPs, however they are still not viewed as economically viable.2 This in turn leads to political reluctance to develop MHPs, especially with increasing subsidies on the cost of fossil fuels.2 This makes low cost one of our priorities in development of the ELC.
We are also developing a digital control system. This reduces the overall cost and improves ease of maintenance. If it were to break, ideally the local people would be able to fix it easily.3 This encourages simplicity in the design of our product, such that the indigenous population could understand the user interface of the technology and update the device should it be further developed. Lastly it should be sturdy enough to survive the weather conditions in the Philippines.3
In the future, MHPs could have a huge impact on the development of the local community, encouraging both economic and infrastructural growth. With improvements in the output power quality, the currently decentralized MHPs could be used for increased loads and potentially even connect to the grid.
Design Key Decisions The three major choices we made regarding the project are detailed below. Firstly we tackled the overall design angle from which to approach the problem. We then explored the dump load options for the ELC in further detail and finally analysed possible switching mechanisms.
4
1. Overall Method
The overall concept of our Electronic Load Controller is that the generator always ‘sees’ the same load on the demand side of the system. To do this we needed to provide a means of drawing power that we could control, to ensure that the total power drawn was always equal to that supplied by the turbine.
A logical means to solve this problem was to have our own power dump load of resistors that we could switch to change the demand. This is an efficient way of giving an effective resolution of power dissipation whilst still limiting damage to the quality of the supply voltage. We worked alongside the Heat Exchange Team at EWB who required that at least five of the resistors could be used as heating elements, as their goal is to use the heat produced to provide hot water to the village. Thus the dump load options and possible switching mechanisms became crucial to our project.
We also chose to develop a digital control system, as these are not only cheap and easy to implement but also provide greater flexibility in terms of the integration of updates or extra functionality to the system. They are also uncommon in current attempts to implement ELCs in many countries including Bangladesh and Nepal, which increases the innovativeness of our product.2, 5 2. Dump Load Options - Using resistors for fine tuning: This design involves using five kettle-heating elements and a fixed number of resistors in a binary configuration. These can all be switched independently to achieve the desired resistance and hence power dissipation of the load dump. The heating elements contribute towards heating the water and simultaneously provide large steps when changing the resistance. Meanwhile, the resistors in binary configuration act to fine-tune the resistance of the load dump to achieve a high resolution. They do not contribute to heating the water. Possible limitations of the design: The large number of heating elements and resistors each require a switch, increasing the cost of the ELC. In addition, the power dissipated by the resistors is wasted since they do not contribute towards heating the water. - Using Pulse Width Modulation (PWM): An alternative design is to use PWM for fine-tuning, to achieve the desired load resolution. Here the resistors are removed and one heating element undergoes PWM. The PWM is carried out using a high quality switch such as a solid-state relay. The remaining heating elements rely on less expensive switches, which is acceptable since they are not switched as frequently. Thus, the cost of the ELC is kept to a minimum. The power is also used efficiently, as all of it is dissipated into the water. Possible limitations of the design: Only one heating element can undergo PWM, making its lifespan significantly shorter than the remaining elements. This increases the frequency of required maintenance. A possible fix is to install high quality switches for all the heating elements. This drives up the initial cost, but means that PWM can be carried out on each resistor in turn for a set time. This increases the time period between replacement cycles, reducing cost in the long term. 3. Switching Control In deciding the circuitry to control the heating elements, the following criteria were assessed for each technology: cost, harmonics generated, impact on the alternator, response time, durability, and complexity of circuitry. The options considered with their respective considerations and reasons for being discarded are listed below. Relays: Relays provided good isolation between our control circuitry and the power lines. However their response tends to be in the ms range at best and they cannot be used for PWM effectively since they wear out quickly.6
5
Thyristors: Thyristors in an active rectifier configuration with phase control (a bridge rectifier using thyristors) would have allowed a single load configuration giving more flexibility on the dump-load, although generating higher amplitude harmonics. The configuration of the circuitry required the load to be switched on for a fraction of the half cycle.7 Despite the low frequency switching having no radio interference, it adds low frequency components, which are difficult to filter out effectively. Furthermore, the required thyristors would cost £10-25, much higher than the alternatives.8 Triodes for Alternating Current (TRIACs): A further option involving thyristors was to use TRIACs for switching each heating element separately. The maximum switching frequency for these components is in the µs range, allowing for PWM or phase control. They have a good power factor and can be found at prices below £1.8 However with respect to the alternatives, they have a much more limited power rating and would hence require more heating elements. Additionally, they are slower than alternatives and need a substantial turn off current. This makes PWM impractical, as more power will be dissipated in the control circuitry rather than in the resistors. Lastly, the control circuitry required is more complex than other alternatives. Metal-Oxide Semiconductor Field Effect Transistors (MOSFETs) - Our Chosen Option: MOSFETs are the fastest option and will allow for very high frequency PWM. Although this can cause significant radio interference, the high switching frequency means components can be filtered easily. This implies that both interference and any harmonics generated are reduced. To ensure correct biasing of the components we will use a bridge rectifier with no filtering. Filtering would use capacitors and therefore introduce a bad power factor. Moreover, by connecting each heating element separately, we can reduce the high frequency components by PWM of only one of the elements (See Using PWM above). An advantage of this system is that the changing load means a poor power factor is not introduced, if filtered properly. Comparatively, this is a more expensive option, as it requires a rectifier, several snubber circuits (to minimise large instantaneous fluctuations) and a considerable filter. Insulated Gate Bipolar Transistors (IGBTs): IGBTs are a valid substitute for MOSFETs in the same configuration and are more effective for higher power ratings. However for our power rating, MOSFETs are sufficient and less expensive.8 High Level Design
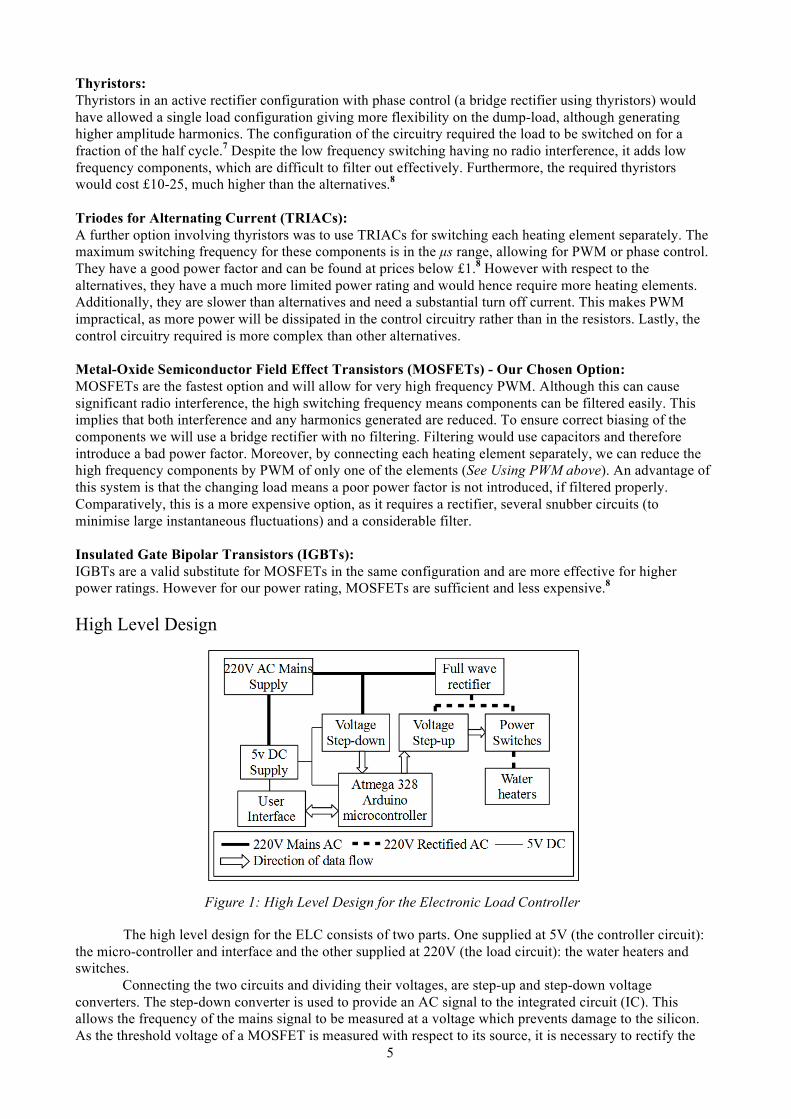
The high level design for the ELC consists of two parts. One supplied at 5V (the controller circuit): the micro-controller and interface and the other supplied at 220V (the load circuit): the water heaters and switches.
Connecting the two circuits and dividing their voltages, are step-up and step-down voltage converters. The step-down converter is used to provide an AC signal to the integrated circuit (IC). This allows the frequency of the mains signal to be measured at a voltage which prevents damage to the silicon. As the threshold voltage of a MOSFET is measured with respect to its source, it is necessary to rectify the
Figure 1: High Level Design for the Electronic Load Controller
6
AC waveform. This is to avoid being required to supply the transistor with a potential greater than the supply, which would be the case for half of the wave cycle. Due to the rectifying, the ground at the negative power rail then becomes different to the original ground potential elsewhere. Consequently isolation is required in between the transistors and the controller outputs, in order that the signal may pass from one to the other despite a change in reference. Therefore the voltage step-up is provided so that the MOSFETS may be driven from their rectified supply, while the IC works at its 5V DC.
The 5V DC is generated using a generic mobile phone charger. It was decided this was the best option, as they are manufactured cheaply, provide a reasonable quality output, and are readily available almost anywhere in the world. Low Level Design
Following from the high-level design, a number of specific decisions were made during implementation. The most major of these was the choice of switch, (See Switching Control Page 4) and, as stated, the MOSFET was selected. Similarly we chose optocouplers to provide isolation between the two voltage regions. Additionally, in order to allow the MOSFETs to drain with sufficient speed for the maximum switching frequency that could be used, the BJT and diode were included to allow the gate charge to drain faster. A small capacitor was also added to improve the stability of the system. The Buzzer was deemed necessary to provide a simple warning system, in the event that the controller was unable to balance out the power used (for example if the community was attempting to draw more power than the generator could supply, such that all of the water heaters were off).
For its ability to present simple information easily, an LCD screen was chosen for the output of the user-interface, controllable through the switches S2 and S3. Due to the number of pins required by the LCD screen, the chosen micro-controller would need at least 28 pins, hence why the Atmega 328 was chosen. A further advantage to this IC is its compatibility with the Arduino programming language. This makes this chip easier to program from scratch and simpler for others to update in the future.
For the purpose of this diagram, US-Style (zigzag) resistors are used to represent the water heaters. This can be done since they behave as resistors, only differing in that they are rated for their power output rather than their resistance. The USB port allows a connection to most current mobile phone chargers, which were deemed to be the cheapest and easiest option for powering the device (See High Level Design Page 5). Given that its purpose is merely power, no connection was needed for data pins from the chip.
Figure 2: Low Level Design for the Electronic Load Controller
7
Microchip Pseudo-Code
The microprocessor in the system acts as a Proportion and Integral (PI) controller. A PI controller is used to bring the measured frequency (the process variable) to the target frequency (the setpoint) by adjusting the output based on two terms of error: the Proportional and the Integral. The Proportional term is the simplest feedback mechanism, applying an output correction based on the current error from the setpoint. The Integral term applies a correction based on the sum of errors over time, which forces the system to reach the setpoint faster. Introducing an integral term also eliminates the small oscillations at steady state that a purely proportional system would have. To allow us to tune the controller on site for optimal performance, our control variables are not hard-coded, but are instead adjustable with a dial. To test the performance of the ELC, a diagnostic function is included that simulates the effects of a decrease in the power usage of the village. The simulation carries this out by decreasing the dump load power level that is required from the ELC.
//When in operation, loop the following //Read frequency //Calculate deviation from setpoint (proportional) //Calculate accumulative deviation (integral) //Read control variables from dials //Calculate corrections needed to dump power level //Apply corrections to dump power level //Check for warning conditions //Update display with current frequency and any warnings //When diagnostic button is pressed //Drop dump load power, start timer //Stop timer when output frequency stabilizes //Display results to display
Simulations
After completing the low-level circuit design, simulations of the design were performed using Simulink. The simulations aimed to ensure that the switching circuit would respond to input signals from the IC according to predictions. They also helped to determine whether any of the components were at risk of being damaged by the power they were dissipating. Simulation Model: The simulation model only included the switching circuit and load. Simulation of the IC and generator was ignored. This is because the output voltage and waveform of the IC are known, and can be modelled using a DC voltage source or square wave (for the MOSFET not undergoing PWM and undergoing PWM respectively). The generator was replaced with an ideal AC voltage source since testing of the feedback loop was not part of the aims of the simulation. Key Areas of Interest: In line with the aforementioned aims, there were several key areas of interest when running the simulation. First was the gate-source voltage (VGS) and drain-source voltage (VDS) of the MOSFET. These would indicate if switching was indeed taking place. Secondly, it was important to determine the power dissipated by the optocoupler and MOSFET. This could be achieved by measuring the voltage across and current through these components. Simulation Results:
(i) VGS and VDS The simulations showed that switching worked correctly at low frequencies below 10Hz (for the non-PWM MOSFETs) and high frequencies of approximately 2kHz (for the PWM MOSFETs).
Figure 3: Pseudo-Code Structure for the ELC Microchip
8
(ii) Power Dissipation in the Components Results showed that neither the optocouplers nor the MOSFETs were at risk of being damaged by the power they were dissipating, both at high and low frequencies.
Laboratory Testing
Testing in the lab was carried out, on a prototype we built, to verify the results of the simulations, as well as observe any possible phenomena that did not show up during simulation. The aims of the test were similar to before, with the exception of testing power dissipation in the MOSFET. This was not possible since the voltage source that was used had a current limit of 380mA, whereas proper MOSFET operation would involve currents of up to 10A. In addition, the voltage source was DC, and therefore bypassed the bridge rectifier completely (see Figure 2 – DB1).
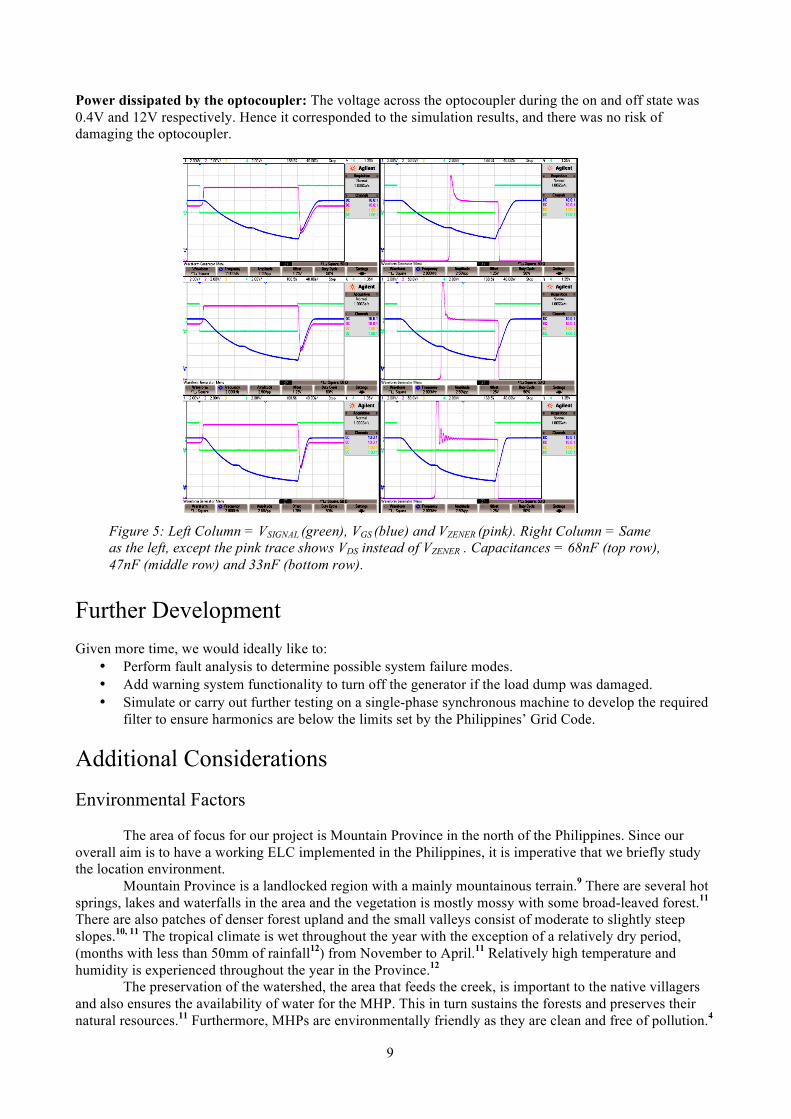
Testing MOSFET Switching: Starting with a configuration that did not contain a gate draining circuit and capacitor for frequency compensation (See Subsections Below), switching was tested out by applying a 5V peak-to-peak square wave of varying frequencies across the optocoupler input. At low frequencies below 500Hz (which simulated the MOSFETs not undergoing PWM), switching behaviour was as expected (see Figure 4). However, there were oscillations seen in VGS and VDS when switching off, which were not observed in the simulations. This was due to the gate not being able to drain its charge in time. In addition, it was observed that at high frequencies above 2kHz (for the PWM MOSFET), the MOSFET was unable to switch off in time. Adding a Gate Draining Circuit: In order to allow the MOSFET to operate at higher PWM frequencies, a draining circuit comprising a BJT and diode was added between the reference resistor and the gate. This brought the maximum frequency up to about 3.2kHz (see Figure 4). However, high voltage oscillations were still observed across VGS and VDS when the MOSFET was switching off. Frequency Compensation using a Capacitor: A capacitor was added across the gate and source of the MOSFET in order to remove the oscillations (see Figure 4). However, it was found that the capacitance caused a momentary dip in the Zener voltage when switching the MOSFET on (see Figure 5). This was due to the charging of the capacitor during switching, which diverted part of the current away from the Zener diode. Lowering the capacitance would reduce the time taken for the Zener voltage to return to steady state, but at the cost of reintroducing oscillations. It was eventually decided that a capacitance of about 68nF would be the settling point, since it removed the oscillations to a large extent and caused little disturbance to the Zener voltage (See VZENER and VDS Figure 5). Any lower value would mean that the peak value of VDS could reach up to 400V, which would damage the MOSFET.
Figure 4: Switching at 0.79Hz with no draining circuit or capacitor (top left), Switching at 2kHz with no draining circuit or capacitor (top right), Switching at 2.5kHz with draining circuit but no capacitor (bottom left), Switching at 2.5kHz with draining circuit and 68nF capacitor (bottom right). Green trace = 5V peak-to-peak switching signal, Blue trace = VGS, Pink Trace=- VDS
9
Power dissipated by the optocoupler: The voltage across the optocoupler during the on and off state was 0.4V and 12V respectively. Hence it corresponded to the simulation results, and there was no risk of damaging the optocoupler.
Further Development Given more time, we would ideally like to:
• Perform fault analysis to determine possible system failure modes. • Add warning system functionality to turn off the generator if the load dump was damaged. • Simulate or carry out further testing on a single-phase synchronous machine to develop the required
filter to ensure harmonics are below the limits set by the Philippines’ Grid Code.
Additional Considerations Environmental Factors
The area of focus for our project is Mountain Province in the north of the Philippines. Since our overall aim is to have a working ELC implemented in the Philippines, it is imperative that we briefly study the location environment.
Mountain Province is a landlocked region with a mainly mountainous terrain.9 There are several hot springs, lakes and waterfalls in the area and the vegetation is mostly mossy with some broad-leaved forest.11 There are also patches of denser forest upland and the small valleys consist of moderate to slightly steep slopes.10, 11 The tropical climate is wet throughout the year with the exception of a relatively dry period, (months with less than 50mm of rainfall12) from November to April.11 Relatively high temperature and humidity is experienced throughout the year in the Province.12
The preservation of the watershed, the area that feeds the creek, is important to the native villagers and also ensures the availability of water for the MHP. This in turn sustains the forests and preserves their natural resources.11 Furthermore, MHPs are environmentally friendly as they are clean and free of pollution.4
Figure 5: Left Column = VSIGNAL (green), VGS (blue) and VZENER (pink). Right Column = Same as the left, except the pink trace shows VDS instead of VZENER . Capacitances = 68nF (top row), 47nF (middle row) and 33nF (bottom row).
10
The conclusion we drew from our research was that the implementation of our ELC as part of the MHP plant would not have any considerable impact on the surrounding ecosystem. Our device is robust enough to work independently of the climate and will not harm or damage the environment. Economic Feasibility
Component Name Quantity Stock Number/ID Unit Price (£) Total Price (£)
Micro USB 2.0 connector, B receptacle 1 772-6768 0.52 0.52
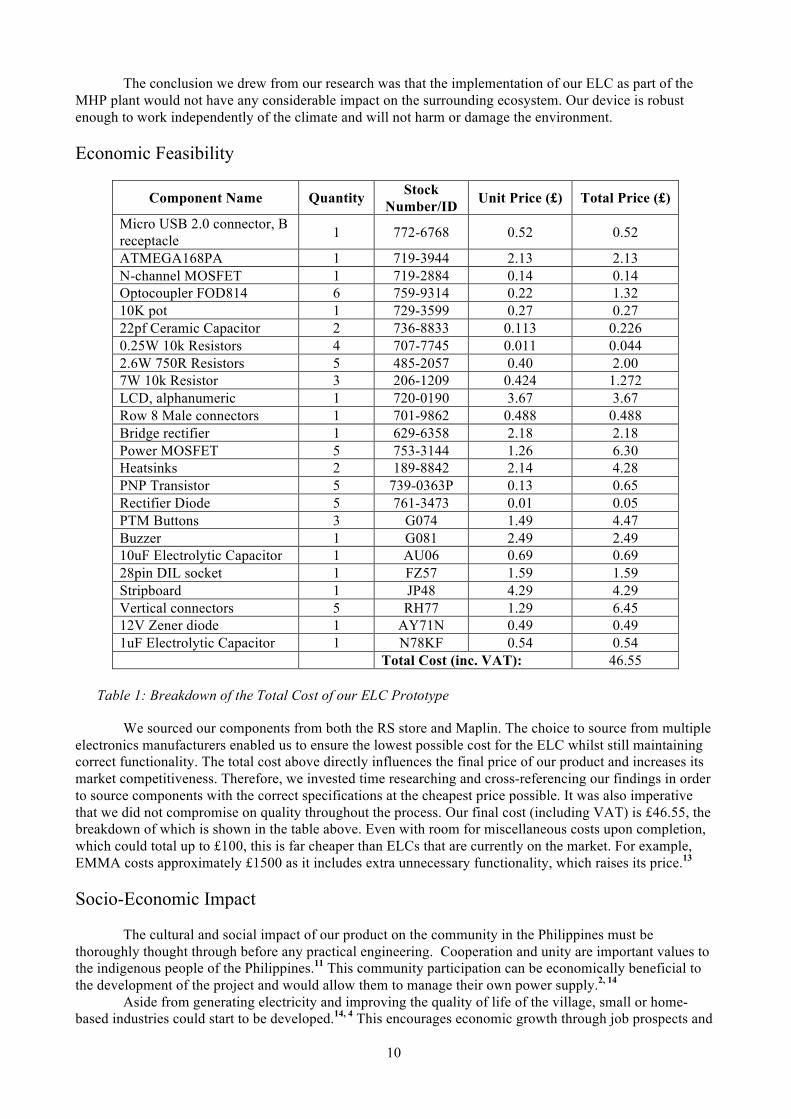
We sourced our components from both the RS store and Maplin. The choice to source from multiple electronics manufacturers enabled us to ensure the lowest possible cost for the ELC whilst still maintaining correct functionality. The total cost above directly influences the final price of our product and increases its market competitiveness. Therefore, we invested time researching and cross-referencing our findings in order to source components with the correct specifications at the cheapest price possible. It was also imperative that we did not compromise on quality throughout the process. Our final cost (including VAT) is £46.55, the breakdown of which is shown in the table above. Even with room for miscellaneous costs upon completion, which could total up to £100, this is far cheaper than ELCs that are currently on the market. For example, EMMA costs approximately £1500 as it includes extra unnecessary functionality, which raises its price.13
Socio-Economic Impact
The cultural and social impact of our product on the community in the Philippines must be thoroughly thought through before any practical engineering. Cooperation and unity are important values to the indigenous people of the Philippines.11 This community participation can be economically beneficial to the development of the project and would allow them to manage their own power supply.2, 14
Aside from generating electricity and improving the quality of life of the village, small or home-based industries could start to be developed.14, 4 This encourages economic growth through job prospects and
Table 1: Breakdown of the Total Cost of our ELC Prototype
11
encourages self-employment.4 There could also be a surge in tourism, which is a source of income to the area, due to readily available electricity.10, 4
Conclusion
Overall, we have successfully carried out and analysed the design procedure for our Electronic Load Controller. This included simulating and testing a prototype of part of the mechanism. Additionally we have achieved our aim of designing a fully digital load controller. The environmental and cultural aspects of our product were studied in depth and we ensured economic viability when purchasing components. This has resulted in our product being significantly cheaper than its competitors in the marketplace. Micro-Hydro Power Plants have huge potential for rural electrification of remote areas. We are now looking forward to the practical development of the ELC in the Philippines in the summer later this year.
References
1. Paper: S. Mbabazi and J. Leary Analysis and Design of Electronic Load Controllers for Micro-hydro Systems in the Developing World Organisation: University of Sheffield, E-Futures Year: (March 2010) 2. Paper: Dr Smail Khennas, and Andrew Barnett World Renewable Energy Congress VI Invited Paper: Micro-hydro power: An Option for Socio-Economic Development 3. Paper: Sipin Project Hydra Specification (Unpublished) Organisation: Engineers Without Borders Year: 2013 4. Paper: Jahidul Islam Razan, Riasat Siam Islam, Rezaul Hasan, Samiul Hasan, and Fokhrul Islam A Comprehensive Study of Micro-Hydropower Plant and Its Potential in Bangladesh Organisation: Department of Electrical and Electronic Engineering, Islamic University of Technology, DOI:10.5402/2012/635396 Year: November 2011 5. Paper: Johanna Barr Improving Maintenance of Micro Hydropower Systems in Rural Nepal – A qualitative study evaluating problems affecting micro hydropower maintenance and their possible solutions Organisation: Uppsala Universitet Year: February 2013 6. Online: Panasonic Ideas For Life LF-G RELAYS (ALFG) Data Sheet Available From: http://docs-europe.electrocomponents.com/webdocs/0e0d/0900766b80e0df05.pdf Date Accessed: October 29th 2013 7. Book: N. Mohan, T. M. Undeland, W. P. Robbins Power Electronics Third Edition Publisher: John Wiley & Sons Year: 2003 Pages: 126-135 8. Online: RS Electronics Datasheets during Component Research
Available From: http://uk.rs-online.com/web/ Date Accessed: November 2013 – March 2014 9. Online: Alojado Publishing International Philippine Islands, Mountain Province Available From: http://www.philippine-islands.ph/en/mountain_province-philippines.html Date Accessed: November 25th 2013 10. Online: Republic of the Philippines National Statistical Coordination Board Facts and Figures Mountain Province at a Glance Available From: http://www.nscb.gov.ph/rucar/fnf_mprov.htm Date Accessed: November 15th 2013 11. Paper: Pre-Feasibility Study Report For Microhydro Power Project Development In Sitio Bubog, Bgy. Nabuangan, Conner Apayao Organisation: SIBOL NG AGHAM AT TEKNOLOHIYA (SIBAT) Year: October 2004 12. Online: Crop Agriculture Review Climate Types Affecting Plant Growth Available From: http://www.cropsreview.com/climate-types.html Date Accessed: November 13th 2013 13. Online: Hollybrook Power Supplies EMMA (Energy & Micro-Generator Manager) SP15 Available From: http://www.hollybrookps.co.uk/energy-management-systems/emma-energy-micro-generator-manager-sp15.html Date Accessed: October 25th 2013 14. Paper: Micro-Hydro in Nepal Organisation: Practical Action, Technology Challenging Poverty
12
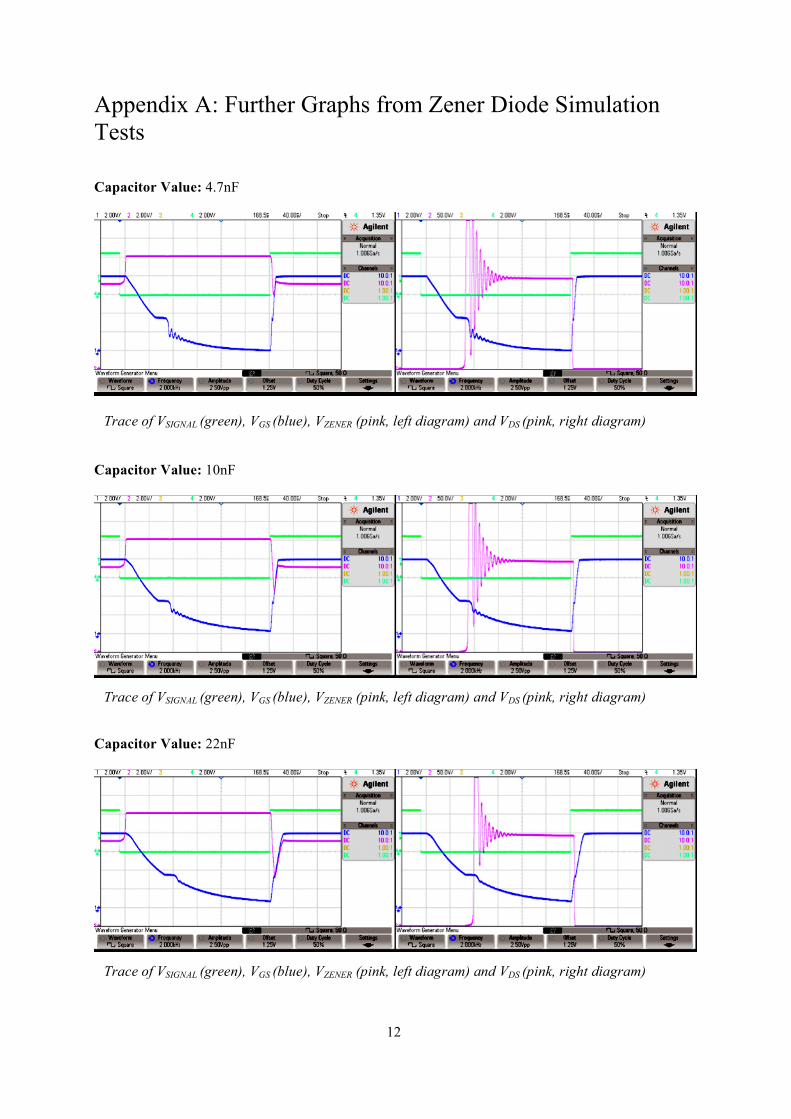
Appendix A: Further Graphs from Zener Diode Simulation Tests Capacitor Value: 4.7nF
Capacitor Value: 10nF
Capacitor Value: 22nF
Trace of VSIGNAL (green), VGS (blue), VZENER (pink, left diagram) and VDS (pink, right diagram)
Trace of VSIGNAL (green), VGS (blue), VZENER (pink, left diagram) and VDS (pink, right diagram)
Trace of VSIGNAL (green), VGS (blue), VZENER (pink, left diagram) and VDS (pink, right diagram)
13
Appendix B: Full Microcontroller Arduino Code
//Library inclusions for measuring input frequency and controlling LCD display #include <FreqMeasure.h> #include "LCDLib.h" //Definitions for control constants #define P_SCALE 10 #define I_SCALE 1 //Definitions for pins #define DIAL_P A0 #define DIAL_I A1 #define FREQ_PIN 8 #define OUTPUT_1 9 #define OUTPUT_2 10 #define OUTPUT_3 11 #define OUTPUT_4 12 #define OUTPUT_PWM 5 #define BUZZER 1 //GLOBAL DECLARATIONS //Power level is initialised to the maximum for safety int power = 499; double kp; double ki; double proportional, integral; double targetFreq = 60; double currentFreq; void setCoilPower(int power); void updatecoils(float proportional, float integral); void setup(){ //Initialisation steps for power levels, frequency measurement library //and LCD display setCoilPower(power); FreqMeasure.begin(); lcd_initialise(); } void loop(){ //Main loop. Each time a frequency measurement is available, change coil //power settings and display results to LCD display if(FreqMeasure.available()){ currentFreq = FreqMeasure.read(); proportional = currentFreq -‐ targetFreq; //if P is +ve, currentFreq is greater than target, so increase coil
14
power integral = 0.8*integral + proportional; //when integral is large, make more drastic changes updatecoils(proportional, integral); lcd_out(currentFreq, power); } } //Updates the required power level to correct frequency void updatecoils(float proportional, float integral){ kp = P_SCALE*analogRead(DIAL_P); ki = I_SCALE*analogRead(DIAL_I); power = power + floor(kp*proportional) + floor(ki*integral); //Check for boundaries if(power>499) power = 499; if(power<0) power = 0; setCoilPower(power); } //Take power level, convert to individual coil power levels void setCoilPower(int power){ if(power>=400) digitalWrite(OUTPUT_4, HIGH); else digitalWrite(OUTPUT_4, LOW); if(power>=300) digitalWrite(OUTPUT_3, HIGH); else digitalWrite(OUTPUT_3, LOW); if(power>=200) digitalWrite(OUTPUT_2, HIGH); else digitalWrite(OUTPUT_2, LOW); if(power>=100) digitalWrite(OUTPUT_1, HIGH); else digitalWrite(OUTPUT_1, LOW); //960Hz standard Arduino PWM analogWrite(OUTPUT_PWM, floor((power%100)*2.5)); return; }