+ All Categories
Home > Documents > AN EMPIRICAL STUDYeprints.usm.my/25715/1/AN_EMPIRICAL_STUDY_ON_THE... · 2013-07-13 · Table 2...

AN EMPIRICAL STUDYeprints.usm.my/25715/1/AN_EMPIRICAL_STUDY_ON_THE... · 2013-07-13 · Table 2...

Date post: 06-Jul-2019
Category:
Upload: trinhhanh
View: 217 times
Download: 0 times
Share this document with a friend
32
An Empirical Study On The Relationship Between Dividend Changes and Future Earning Of The Kuala Lumpur Stock Exchange Listed Companies By Lee Vooi Ling Research report in partial fulfillment of the requirements for the degree of Masters of Business Administration 2004
Transcript

An Empirical Study

On The Relationship Between

Dividend Changes and Future Earning

Of The Kuala Lumpur Stock Exchange Listed Companies

By

Lee Vooi Ling

Research report in partial fulfillment of the requirements

for the degree of Masters of Business Administration

2004

ii

ACKNOWLEDGEMENTS

I would like to take this opportunity to extend my appreciation to Dr Zamri Ahmad, of

the School of Management, University Science Malaysia, for providing me with his

invaluable guidance and supervision to pursue on this research study. Along the

development of this report, he has read the scripts and identified several problem

areas. His experience and knowledge assisted me in accomplishing this research

study.

Last but not least, my heartfelt appreciation to my lovely wife, Chiew Lean, for her

full support, understanding and encouragement throughout the course of my study.

iii

TABLE OF CONTENTS

Page

TITLE i

ACKNOWLEDGEMENTS ii

TABLE OF CONTENTS iii

LIST OF TABLES vi

ABSTRAK vii

ABSTRACT viii

Chapter 1: INTRODUCTION 1

Introduction 1

Background Information 2

Background Information – Dividend Studies in Malaysia 3

Problem Statement 4

Research Objectives and Questions 5

Significance of the Study 6

Organization of the Dissertation 6

Chapter 2: LITERATURE REVIEW 8

Previous Research on Dividend Signal 8

Reviews on Independent Variables 11

Industry Type 11

Firm Size 12

Theoretical Framework 13

Lintner’s Model 13

Predictive Content of Earning 14

Hypothesis 16

iv

Summary 18

Chapter 3: METHODLOGY 19

Research Design 19

Types of Study 19

Unit of Analysis 19

Time Horizon 19

Data 20

Data Collection 20

Data Inclusion Criteria 20

Major Variables Definition 21

Dividend per Share 21

Earning per Share 22

Tests of Hypothesis 22

Hypothesis 1 and Hypothesis 2 23

Hypothesis 3 23

Hypothesis 4, Hypothesis 5, Hypothesis 6 and Hypothesis 7 24

Hypothesis 8, Hypothesis 9, Hypothesis 10 and Hypothesis 11 25

Chapter 4: RESULTS 26

Profile of Sample 26

Normality Check 27

Descriptive Analysis of Dividend Change and

Future Earning Change

28

Hypothesis Testing 29

Hypothesis 1 and Hypothesis 2 29

Hypothesis 3 30

v

Hypothesis 4, Hypothesis 5, Hypothesis 6 and Hypothesis 7 32

Hypothesis 8, Hypothesis 9, Hypothesis 10 and Hypothesis 11 37

Conclusion 39

Chapter 5: DISCUSSION AND CONCLUSION 41

Discussion 41

Implication of Study 44

Limitation and Future Research Area 45

Conclusion 46

REFERENCES 48

APPENDICES 51

vi

LIST OF TABLES

Page

Table 1 Numbers of Sample Firms 28

Table 2 Test of Normality for Dividend Change and Future Earning

Change

28

Table 3 Result of Dividend Change versus Future Earning Change 29

Table 4 Significance of Association between Dividend Change and Future

Earning Change

30

Table 5 Result of Dividend Change and Future Earning Change Direction 31

Table 6 Dividend Increase’s Signal 32

Table 7 Dividend Decrease’s Signal 33

Table 8 Result of Dividend Change and Future Earning Change Direction

for Small and Large firms

34

Table 9 Results of Dividend Increase’s Signal in Small and Large Firm 35

Table 10 Firm Size: Sum of Ranks and Statistical Results 36

Table 11 Industry Sector: Sum of Ranks and Statistical Results 38

vii

ABSTRAK

Tesis ini adalah berhubung dengan hipotesis isyarat dividen yang menyatakan bahawa

perubahan dividen mengandungi informasi dan dapat digunakan untuk memberi

isyarat tentang keuntungan masa depan syarikat. Hasil kajian menunjukkan perubahan

dividen tidak dapat memberi isyarat mengenai keuntungan masa depan. Namun,

apabila magnitud perubahan dividen diambilkira, ia memberi isyarat kompleks.

Peningkatan dividen yang kecil mengisyaratkan peningkatan keuntungan masa depan

manakala peningkatan dividen yang besar mengisyaratkan pemerosotan keuntungan

masa depan. Hasil kajian juga menunjukkan tiada perbezaan yang bermakna dalam

magnitud peningkatan dividen di antara syarikat kecil dan syarikat besar. Namun yang

demikian, data masih menunjukkan peningkatan dividen dalam syarikat kecil adalah

lebih rendah daripada syarikat besar. Tambahan pula, kajian juga menunjukkan

bahawa terdapat perbezaan yang bermakna dalam magnitud perubahan dividen di

antara sektor-sektor industri apabila keuntungan masa depan meningkat tetapi tiada

perbezaan yang bermakna apabila keuntungan masa depan merosot. Sektor Harta

Tanah mempunyai perubahan dividen yang terbesar baik dari segi pemotongan

ataupun peningkatan dividen.

viii

ABSTRACT

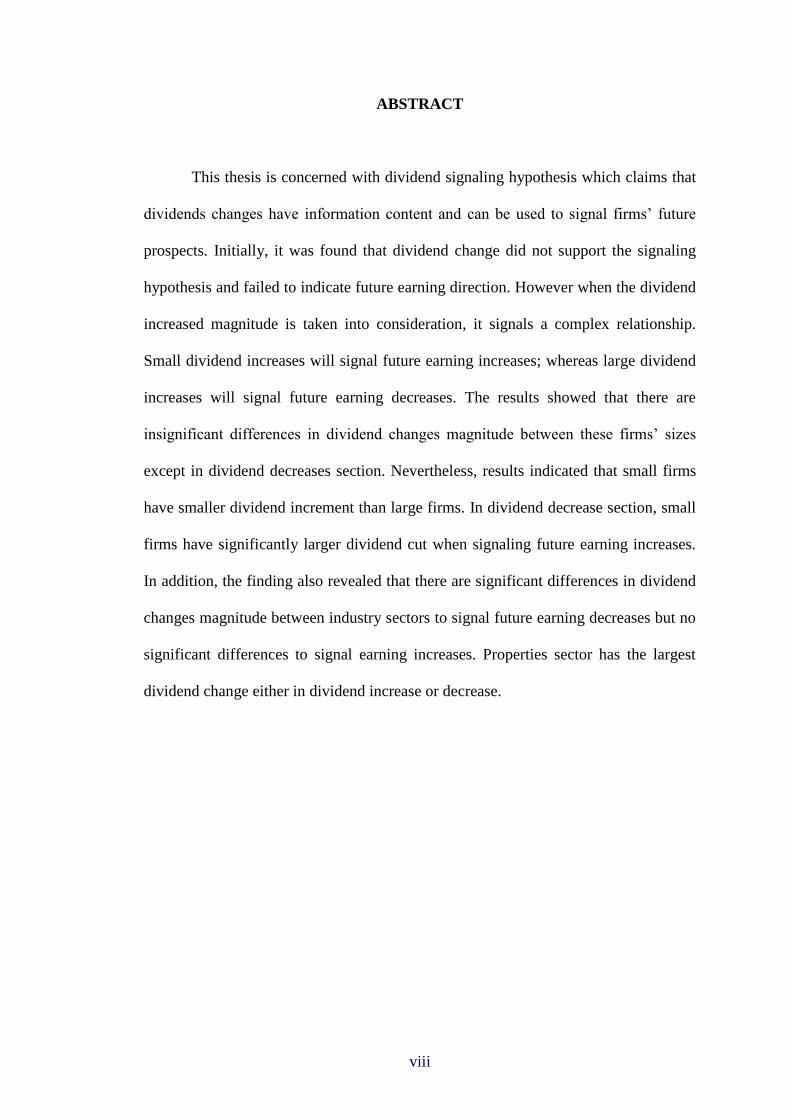
This thesis is concerned with dividend signaling hypothesis which claims that

dividends changes have information content and can be used to signal firms’ future

prospects. Initially, it was found that dividend change did not support the signaling

hypothesis and failed to indicate future earning direction. However when the dividend

increased magnitude is taken into consideration, it signals a complex relationship.

Small dividend increases will signal future earning increases; whereas large dividend

increases will signal future earning decreases. The results showed that there are

insignificant differences in dividend changes magnitude between these firms’ sizes

except in dividend decreases section. Nevertheless, results indicated that small firms

have smaller dividend increment than large firms. In dividend decrease section, small

firms have significantly larger dividend cut when signaling future earning increases.

In addition, the finding also revealed that there are significant differences in dividend

changes magnitude between industry sectors to signal future earning decreases but no

significant differences to signal earning increases. Properties sector has the largest

dividend change either in dividend increase or decrease.

1

Chapter 1

INTRODUCTION

Introduction

Back to a very basic question of “Why does a firm pay dividend”, a firm generally

pays dividend can be explained by excess cash flow from its investment needs and

investor preference (Damodaran, 1997). The pay out will attract different types of

investors. Investor with low incomes and high current needs would prefer high-payout

firms; whereas investors in high income brackets would favor low-payout firms.

Another consideration point would be the tax advantage between capital gain and

income tax effect (Damodaran, 1997; Emery, Finnerty and Stowe, 1998; Rao, 1989;

Shapiro and Balbirer, 2000). As a result, investors will invest in firms whose dividend

policies match their preferences. To retain its investor clientele attractiveness, firms

will carefully decide on their dividend policy.

Undoubtedly, dividends are paid out of earning. For firms to pay or initiate dividends,

it is because its operation generates sufficient and excessive cash. It is so termed

excessive due to firms should have already considered their investment funding needs.

On top of it, firms will also tend to evaluate whether the excessive cash has to be

distributed over the years in attempts to keeping cash for unforeseen possible

investments or paying out as a one time deal effect (Damodaran, 1997; Emery,

Finnerty and Stowe, 1998; Rao, 1989; Shapiro and Balbirer, 2000).

Thus, when there is a shift in the firms’ dividend policy, firms are conveying

information to the markets. Since dividend is part of earning, the changes should have

2

provided a signal on a firm earning. Dividend increases can signal future earning

increases (Aharony and Dotan, 1994; Daniels, Shin and Lee, 1997; Denis and Sarin,

1994; Kao and Wu, 1994). However, there are also studies claimed that dividend do

not provide signal to future earning (Best and Best, 2000; Fama and French, 2000;

Kumar and Lee, 2001; Penman, 1983)

Background Information

As early as 1961, Miller and Modigliani (1961) have written in their research paper

asserting that cash dividend announcement reflect changes in management’s

assessment of a firm’s future profitability. One can easily see that if a firm were to

follow a dividend stabilization policy, a dividend change somehow reflects firm self-

belief of its future earning capability. This hypothesized relationship by them was

referred to as “the information content of dividends” and was regarded by Watt (1973)

as the first statement of the information hypothesis. Ever since then this hypothesis

has motivated a considerable amount of theoretical and empirical researches.

For years, literatures have been investigated on the interpretation of what is the

information content of dividend change. What does dividend change convey to market?

Continuing on this dividend signaling hypothesis, Miller and Rock (1985) explained

further on their belief of the information asymmetry between a company’s

management and outside investors. Any reduction or omission of the cash dividend

may indicate future cash-flow weakness and it is not evident in the company’s

publicly available information; vice versa for increase or initiation. As such, corporate

decisions on dividend may signal inside information regarding expected future cash

flow.

3

There are reasons to believe that dividend carries information. First, managers are to

some extent restricted as to the kind of public statements they can make. Managers

are not able to straightforwardly announce futuristic performance (Lee and Yan,

2003). They are to some extent entangled into legislative obligation if they were to

provide wrong information to the market. In relation with information conveying to

market, signals from smaller firms are greater than from larger firms (Eddy and

Seifert, 1988). Larger firms have better accessibility to financial market than smaller

firms (Shapiro and Balbirer, 2000). To fund investment, smaller firms depend more

on internal generated cash. As stated earlier, dividend is part of earning. Smaller firms

give more prudent attention to its cash flow management.

Secondly, due to random economic factors, reported earning may vary from

company’s long run normalized earning. Managers are in a better position to

understand whether this earning variance is temporary. It is hard for investor to judge

the differences and firms’ performance in a longer horizon. Thus, managers can use

dividend to bridge the understanding gap and to provide a confident indicator of their

estimation of firm’s future earning capability.

Background Information – Dividend Studies in Malaysia

In his study on determinant of dividend policy in Malaysian firms, Pang (2001)

revealed that there are significant differences in dividend payment across industry

sectors. Yaakub (2001) also reported significant differences among sectors in firms’

dividend payout. Dividend policy is different along the stages of industrial growth

(Damodaran, 1997). Higher growth industries tend to pay lesser dividends than lower

growth industries. High growth industries require this internal generated cash to fund

4

more investments. With the recycling of cash, the excessive cash to be divided out to

investors will definitely be lower. These studies were on dividend rather than the

change of dividend. It will be interesting to look into whether the change in dividend

is different across industries.

Pandey (2003) reported that Malaysian firms increase dividend when earning

increases. They are reluctant to skip dividend when earning fall however they tend to

omit dividend when suffer losses. Pandey has also indicated future area of interest

would be the firm size effect on dividend policy. However his study is more focus on

dividend policy development which may link current dividend and current earning but

not the dividend change signals to future earning.

There are a number of researches investigating the relationship between current

dividend and current earning. These studies are carried out to check on the

applicability of Lintner’s dividend behavioral model, which depicts the relation

between current earning to dividend, in Malaysia context. Their results have drawn to

the nearly similar conclusion that current year’s dividend is based on current year’s

earning and past year’s dividend (Annuar and Shamsher, 1993; Gupta and Lok, 1995).

Nevertheless these studies are looking at current dividend derivation, whereas how the

movement of dividend over time impacts future sustainability of earning still remains

unanswered.

Problem Statement

The above background information and findings suggest a continued need to study,

understand and confirm the information content of dividend. This understanding will

5

be very important for the investors as well as the management team. It is believed that

dividend conveys information on future profitability due to information asymmetry.

Numerous studies have been carried out to prove this future earning hypothesis. They

have also drawn different conclusions on the relationship between future earning and

dividend change. However there is lack in similar work done in Malaysia context.

Therefore, this research focuses on dividend change and future earning of the Kuala

Lumpur Stock Exchange (KLSE) listed companies.

Research Objectives and Questions

The main focus of this research is to examine the relationship between dividend

change and future earning in KLSE listed companies. It is based on dividend signaling

model that whether market can perceive positive future earning outlook for dividend

increment and vice versa. Consistent with an information role for dividends, early

studies documented a positive relationship between dividend change and stock price

(Ofer and Siegel, 1987; Pettit, 1972). However, this research directly studies on future

earning performance in relation to current dividend change.

In order to better understand the relationship, the following objectives were

formulated:

1. To identify if there were any relationship between dividend change per share and

future earning per share.

2. To identify if dividend changes are different between smaller firms and larger firms.

6

3. To identify if the above relationship exists in different types of industry sectors.

Bearing on the above objectives, this study attempts to answer the following questions:

1. Does the change in dividend have a simple positive relationship to future earning?

2. Are the dividend changes smaller in small firms than in large firms?

3. Does the relationship of current dividend change and future earning differ among

industry?

Significance of the Study

From investors’ point of view, investors would like to understand a firm’s future

earning capability to better safeguard investment. A firm’s future earning capability

would reflect into stock price and also tell about firm’s future dividend payout

propensity. It is hoped that the established relationship can serve as an analysis

method for investors to forecast their investments. Thus, investors can understand

better of the company future performance via its signal from dividend change.

From management’s point of view, if the relationship exists between dividend change

and future earning, corporate managements should give due consideration to its

dividend policy and deliberately make changes in dividend yield. This is because the

dividend change will convey information of firm’s future earning capability. With

current earning information on hand, dividend announcement serves to confirm

investors’ concern on firm’s future financial expectation. An unaligned dividend

7

change would invite wrong interpretation of future performance and would lead to

wrong market reaction to stock price.

Organization of the Dissertation

The background and purpose of the study are provided in Chapter 1. The remaining

chapters are organized as follows. Chapter 2 covers the previous related researches,

theoretical framework and hypotheses developed. Chapter 3 reviews the research

methodology, data collection criteria and statistical analysis methods. Chapter 4

tabulates results, analyzes resulted obtained and verifies stated hypotheses. Chapter 5

discusses the result, states the limitation of study, proposes potential future research

area and concludes the findings of this study.

8

Chapter 2

LITERATURE REVIEW

Previous Research on Dividend Signal

The signaling hypothesis (Miller and Modigliani, 1961) suggests that dividend

changes contain new information about future earning. However, evidence on this

hypothesis is mixed.

Back to a few decades ago, Lintners (1956) shows corporate managers will raise

dividends only if they project a permanent rather than a temporary increase in earning.

Since dividend change may reflect managers’ permanent earning expectation,

dividend increases are interpreted as forecasts of higher future earning and dividend

reductions signal lower future earnings.

Watt (1973) can be considered among the first batch of academician to study the

information content of dividend. He collected data for a 22-year period from 1946 to

1967. Supporting the information hypothesis, his results indicated positive

relationship between future earning changes and current unexpected dividend changes.

Nevertheless, the relationship is weak. The average absolute size of the future earning

changes conveyed by dividend changes is very small. His explanation is that the speed

of dividend adjustment has created noise in information content. It is hard to

distinguish whether how much the dividend change is due to a change in firm target

payout or firm continues on its partial dividend adjustment policy.

From the same data source, Benartzi, Michaely and Thaler (1997) studied on dividend

9

change signal in companies listed on New York Stock Exchange from 1979 to 1991.

They provided a totally different signal direction which stated that firms’ dividend

changes are backward looking. Firms that increase dividend in current year have

already experienced significant earnings increase in prior year and current year. These

increased earnings persist for three years. Similarly, firms that cut dividend

experienced a reduction in earning in the same year and prior year. However these

firms showed significant earning increase in a year later. The explanation provided

was earnings lead dividends and not vice versa. Firms should have confirmed their

earning capabilities before risking themselves distributing out cash as dividend.

Consistent with Lintner’s finding, firms are risk averse to cut dividend.

Benartzi, Michaely and Thaler (1997) findings were reinforced by Ho and Wu (2001)

study. Ho and Wu specifically looked into dividend initiation and omission. Similarly,

they found that firms who have recorded positive past or concurrent earning change

have provided same dividend change direction. In order for firms to initiate dividend,

firms have already recorded earning increase. On the other hand, firms will cut

dividend if earning has dropped. It provided no signal to future earning.

All of the above studies indicated dividend change has either weak or no information

on future earning. However they are also some academicians supporting the dividend

signaling hypothesis. In search of the linkage between dividend and earning, Olson

and McCann (1994) concluded that the inclusion of dividend data into earning data

improves the predictability of future earning. This finding is consistent with the

signaling theory of dividend. They found that these firms are higher growth in asset

turnover which indicating growth in investment.

10

It the same year, Aharony and Dotan (1994) examined the association between

unexpected dividend change and unexpected future earning change. Unexpected is

defined as the difference between actual and expected values. They indicated that

firms that increased dividend realized greater unexpected future earnings in

subsequent periods than firms maintaining their dividend.

Rather than correlating the absolute size of dividend change to absolute size of future

earning change, Mozes and Rapaccioli (1998) categorized the future earning into

either increase or decrease however he further defined the dividend change as large or

small relative to dividend mean value. Mozes and Rapaccioli provided evidence that

future earning decreases are associated with large dividend increases; should the

dividend increases are small, future earning will increase. With the larger dividend

increase, firms realized of reinvestment opportunities lacking whereas the small

increase is due to partial adjustment in dividend payout.

Nissim and Ziv’s (2001) claimed that previous studies omitting an important variable

which is book value of equity. They pointed out that a drop in return on equity will

imply an expected increase in earning. Earning per share figure will carry less

information with the change in equity. They showed that dividend changes are

positively related to earning changes in each of two years following dividend change.

Their conclusion supports the information content of dividend hypothesis.

The reinvestment explanation was also used by Grullon, Michaely and Swaminathan

(2002). They rejected the future earning signaling models through dividend. Their

finding showed earnings decrease instead of increase after a dividend increase. They

11

did not breakdown the dividend into neither large nor small. The explanation was

when a firm is moving into mature state, its options to grow will reduce. With high

return investment opportunities are cut, firm earning growth rate should reduce. Thus,

an increase in dividend provides information of shrinking investment opportunities

and future earning growth.

The empirical evidence documenting the information content hypothesis has provided

mixed results. The focus of this study is looking at how effective the signaling

hypothesis in Malaysia context. Aivazian, Booth and Cleary (2003) found that

emerging market firms exhibit dividend behavior similar to US firms, in the sense that

dividends are explained by profitability, debt and the market to book ratio. However

he has also pointed that there are different sensitivities exist in these variables in

emerging market.

Reviews on Independent Variables

The following section will be reviewing pervious literatures of the major independent

variables considered in this study. There are two areas of interest which are industry

type and firm size.

Industry Type

Companies business can be categorized as cyclical, countercyclical or with no cycle

pattern. Some business does well while some industry does poorly (Laux, Starks and

Yoon, 1998). Michel (1979) and Pinches (1992) noticed differences in dividend

payout in United Stated firms. He attributed the results to business risk, maturity,

investment and follow-the-leader behavior in each industry sector. In the same market,

12

Emery, Finnerty and Stowe (1998) also reported that dividend payout ratios vary

across industries. They believed that investment opportunities faced by similar

industry sectors are the same. Thus, industry sectors with limited investment

opportunity will have higher payout. In Malaysia context, Pang (2001) studied on

listed companies in Malaysia. He reported that Consumer sector paid highest dividend

relative to other sectors and Trading has the lowest payout. His study is on Consumer,

Plantation, Industrial Products, Properties and Trading or Services sectors. Similarly,

Yaakub (2001) also reported significant differences among sectors in firms’ dividend

payout but did not indicate which sector has higher payout. All of the above studies

showed there is significant difference in dividend payout ratio across industries.

However none of them looked at the changes of dividend. Prior studies, which

directly focused on changes of dividend to future earning, did not segregate further to

industry level. Given the fact that the payout ratios are different in industries, it is

worthwhile to explore further to understand whether the dividend signaling hypothesis

works for all industries.

Firm Size

It is always believed that dividend signal from small companies is stronger relative to

large companies. This is due to the belief that large companies have other means of

conveying their business signal. More analysts followed up with larger firms and thus

more public information is available for larger firms. It is of that reason smaller firms

have more needs to signal than larger firms through dividend (Olson and McCann,

1994). Firm size can be grouped by companies’ market value. Using the same firm

size classification, Eddy and Seifert (1988) reported that the abnormal returns from an

13

announcement of a large dividend increase are greater for small firms than for large

firms.

Theoretical Framework

Lintner’s Model

After series of interviews with corporate managers, Lintner (1956) developed a simple

model relating dividend to earning. Corporate managers have revealed to him that

firms have long run target dividend payout ratio.

Di = target ratio X Ei

Where

Di is the target dividend in year i

Ei is the earning in year i

The dividend change would equal

Di - Di-1 = target ratio X (Ei - Di-1)

However, he also found that managers are reluctant to make dividend changes that

might have to be reversed. Thus, manager partially increase dividend toward long run

target ratio. The speed of adjustment will depend on corporate management.

Di - Di-1 = adjustment rate X target ratio X (Ei - Di-1)

14

Predictive Content of Earning

Lintner model has linked up simple model of dividend change and current earning. In

further study on information content of dividend, Watt (1973) made a regression form

to link dividend and future earning.

Ei,t+1 = αi + β1,i Ei,t + β2,i Ei,t-1 + β3,i Di,t + β4,i Di,t-1 + v i,t

Where

D refers to Dividend per share

E refers to Earning per share

i refers to firm i

t refers to year t

v is an error term

Watt’s result showed weak signal from current dividend to future earning. The

average absolute size of the future earning changes conveyed by dividend changes is

very small. Rather than correlating the absolute size of dividend change to absolute

size of future earning change, Mozes and Rapaccioli (1998) categorized the future

earning into either increase or decrease. With these earning categories, Mozes and

Rapaccioli compared the size of dividends change using Mann-Whitney test. From

here, they drawn conclusion on the size of dividend change provides a signal to future

earning.

In addition, they further estimated a logistic regression model using dummy variables

as below:

15

CEDOWN = a + a1PEDOWN + a2PDUP + a3PDDOWN + a4DIVINC +

a5DIVDEC

Where

CEDOWN is one when current earning decrease or equal zero otherwise

PEDOWN is one when previous earning decrease or equal zero otherwise

PDUP is one when previous dividend increase and zero otherwise

PDDOWN is one when previous dividend decrease and zero otherwise

DIVINC equals the dividend increase if previous dividend increased or zero otherwise.

DIVDEC equals the dividend decrease if previous dividend decreased or zero

otherwise.

If the coefficient a4 or coefficient a5 were tested significant, this logistic regression

will provide information on relationship between dividend change and future earning

change. This serves as a confirmation on Mann-Whitney test.

In the absence of theory specifying the relationship between dividend declared and

future earning, various regression models were derived from different researchers.

Examples:

(1) log(Dt/Dt-1) = β0 + β1log(Et/Et-1) + β2log(Dt-1/Et-1) + β3log(Et-1/Et-2) + є (Ming-

Shiun 2001)

(2) ΔEi,t/Pi,t-1 = αi + β1* ΔDi,t/Di,t-1 + β2* Ii,0*ΔDi,t/Di,t-1 (Benartzi, Michaely and

Thaler 1997)

16

It can be seen from the chapter on literature review, there are contradicting findings

among academicians. The complication of factors linkage does not really guaranteed

the best method of analysis. In this study, dividend change is hypothesized to affect

future earning. In addition, firm size and industry sectors are hypothesized to have

different dividend change.

Hypothesis

For the purpose of this paper, the following hypotheses were formulated and will be

tested in line with the objectives of this paper. The hypotheses will be able to address

research questioned raised in Section 1.5.

For the first three hypotheses, they are used to investigate the directional change

between dividend change and future earning change. Since dividend change can be

divided into increase and decrease, Hypothesis 1 and Hypothesis 2 are formulated to

test whether future earning change will follow similar direction. They have to be

separated in order not to cancel out each other effect on future earning. It is also

strongly stressed in Mozes and Rapaccioli (1998) finding that large dividend increase

will signal future earning decrease whereas small dividend increase signals future

earning increase. Hypothesis 3 is then developed.

H1: Increases in current dividend will have similar directional changes in future

earning.

H2: Decreases in current dividend will have similar directional changes in future

earning.

17

H3: Large current dividend increases will signal future earning decreases.

To answer the question of differences between small firm and large firm, Hypothesis

4 and Hypothesis 5 are formed. In addition, since Grullon, Michaely and

Swaminathan (2002) and Mozes and Rapaccioli (1998) argued that dividend change

provided different directional change in future earning, Hypothesis 6 and Hypothesis

7 are formed. In summary, all of these four hypotheses can be generalized as dividend

changes in small firms are smaller than dividend changes in large firms to signal

future earning change.

H4: Dividend increases in small firms are smaller than dividend changes in large

firms to signal future earning increases.

H5: Dividend decreases in small firms are smaller than dividend changes in large

firms to signal future earning decreases.

H6: Dividend increases in small firms are smaller than dividend changes in large

firms to signal future earning decreases.

H7: Dividend decreases in small firms are smaller than dividend changes in large

firms to signal future earning increases.

Similar to the above analysis on magnitude of dividend change, this study explores

further into the behavior of different sectors in providing future earning signal. The

18

following hypotheses are formulated:

H8: Dividend increases are different among sectors to signal future earning increases.

H9: Dividend decreases are different among sectors to signal future earning decreases.

H10: Dividend increases are different among sectors to signal future earning

decreases.

H11: Dividend decreases are different among sectors to signal future earning

increases.

Summary

Lintner’s model of dividend stresses that firms only increase dividend when

management strongly believes earning have permanently increased and are caution of

dividend reversal. The signaling theory suggests that management has more

information about the value of firms’ asset than outside investors. Management use

dividend as one of the channel to convey information to market. A dividend increase

hints higher future earning prospects and vice versa. Eleven hypotheses have been

formulated to explore the relationship between dividend change and future earning.

The next step is to determine the research methodology to carry out this study.

19

Chapter 3

METHODOLOGY

Research Design

This section discussed the issues pertaining to types of study, units of analysis and

time horizon. With this fundamental design, it further drafted how the data were

defined, data were collected and tests were carried out against the hypotheses.

Type of Study

The main purpose of this study was to test whether the information content of

dividend changes brings implication to future earning. Secondary, the factor of firm

size was being explored to investigate the connection to this dividend-earning

relationship. Thirdly, it continued to study if there are any differences among industry

sectors.

Unit of Analysis

Every data was taken from firm listed on the main board of Kuala Lumpur Stock

Exchange (KLSE) as of 1st January 2003. The unit of analysis was firm-year

observation on dividend change and future earning change.

Time Horizon

The data collection was done over a period of 10 years which was from 1993 to 2002.

This was in order to provide a bigger sample size. The dividend data were collected

from 1993 to 2000 whereas the future earning data were collected from 1994 to 2001.

20

Data

Data Collection

The data were gathered from Stock Performance Guide published by Dynaquest

Sendirian Berhad, Annual Companies Handbook and Investors Digest published by

Kuala Lumpur Stock Exchange. The sector classification was based on Stock

Performance Guide. The Stock Performance Guide was published with the purpose of

guiding investor to make decision on which stock to purchase and when to purchase.

It divided its information into two sections, namely descriptive and statistic

information. Firstly, it collected firm information on ownership, activities, corporate

structure and capital structure based on company’s handbook. Secondly, it collected

firm annual price range, earning per share, dividend per share, dividend yield and

price earning ratio from company’s handbook and KLSE.

Data Inclusion Criteria

There were altogether 559 firms listed on KLSE main board. To choose from within,

the sample firms chosen must fulfill the guidelines below:

(1) Data on firms that have 2 consecutive years in dividend declaration and 3

consecutive years in earning declaration. This is crucial to see a firm’s dividend

change and its future earning. The future earning was limited to immediate year

earning. This is due to dividend continues to change. Collection of more years of

future earning data will be contaminated by the effect of continual changes of

dividend.

(2) All estimated or forecasted earnings were not taken into consideration.

(3) Finance and Trust firms were removed since as they were bounded by regulatory

requirement.

21

(4) All prior data before a firm listed on KLSE main board were discarded.

(5) All firms with their financial year ended at December. For example, a firm

reported high earning with financial year ended in June 2003 did not mean that it had

high earning in calendar year 2003 earning but a combination of year 2002 and year

2003 performance. For easier comparison, earning for financial year ended at

December should be equal to earning in calendar year end.

(6) Firms remained in same sector classification throughout data collection duration.

These sample selection procedure or requirement resulted in 103 firms being selected

for the study. It has yielded 705 numbers of dividend change and earning change data.

A table of all sampled firms was placed in Appendix 1.

Major Variables Definition

To represent a firm’s dividend and earning, there are numerous ways of reporting.

Each of them may provide different meaning. For example, dividend can be reported

as gross dividend payout or nett dividend payout. Earning has nett earning or earning

before extraordinary item. It is worthwhile to provide description on earning and

dividend data captured in this study.

Dividend per Share (DPS)

The dividend in DPS was based on the nett dividend payout in calendar year. This

may have differences to firm published dividend per share which use financial year. It

was collected in this manner because from research point of view, the study intended

to look at future earning. Dividend change was measured as current year dividend

minus prior year dividend and the difference was deflated by prior dividend. Dividend

22

increase referred to positive dividend change whereas dividend decrease referred to

negative dividend change. (Benartzi, Michaely and Thaler, 1997; Grullon, Michaely,

and Swaminathan, 2002).

Earning per Share (EPS)

The earning in EPS was based on earning before extraordinary item. The earning per

share was taken from firms’ year end financial report. These EPS and DPS data were

adjusted to cater for capitalization change. As the number of share changed over the

years, the EPS and DPS fluctuated accordingly. For example, the EPS was recorded

as 10 in year 1. When there was a dilution of share in year 2 by 50%. The EPS for

year 2 was reported as 5. By merely comparing EPS, it showed a declination of 50%

in EPS. However, in actual fact, there was no lost for investor which had doubled the

share. In order to have fair comparison among data collected, the year 1 earning had

to be multiplied by 50%. Future earning change was measured as next year actual

EPS minus prior year EPS and the difference was deflated by prior EPS. Future

earning increase referred to positive future earning change whereas future earning

decrease referred to negative future earning change.

Tests of Hypothesis

For each firm-year result, two derived data, namely current dividend change and

future earning change, were collected. All these derived data were converted into

dummy variables. Data representing increases were coded as 1 and data representing

decreases were coded as 0. For dividend, an addition code was provided for flat or

unchanged dividend. A descriptive cross tabulation for these two dummy variables

was run. From the percentages of data fell in each category, the change of dividend

23

related to its future earning change would be observed. Chi-Square significance tests

were used to test whether there was any significant association between dividend

change and future earning change. Kolmogorov-Smirnov tests with Lilliefors

significance correction were used to confirm the assumption of dividend changes and

earning changes exhibited non-normality. From this preliminary test, further tests

were carried out to confirm the hypotheses.

Hypothesis 1 and Hypothesis 2

Hypothesis 1 stated that dividend increase will signal future earning increase where

Hypothesis 2 stated that dividend decrease will signal future earning decrease. To test

Hypothesis 1, a new dummy variable was formed. Data represent similar change

direction were coded as 1 and data represent different direction were coded as 0.

Since there was only two possible outcomes, either future earning increase or

decrease, from each dividend change, a binomial distribution test was carried out

(Black, 2001). If there were a significance difference between the groups, the

direction of signal should be observed from the higher value group. Similar analysis

was performed to verify Hypothesis 2.

Hypothesis 3

Hypothesis 3 stated that large current dividend increases will signal future earning

decreases. By filtering the dividend data to dividend increase only, this dividend

increase data will have future earning increase data and future earning decrease data.

A Mann-Whitney U test was run to determine whether there was difference between

these two future earning groups. If there were a significance difference between the

24

groups, the magnitude of dividend increase to signal both groups could be observed

from the ranking value.

Hypothesis 4, Hypothesis 5, Hypothesis 6 and Hypothesis 7

In this study, firm size was defined as its market value. A firm market value depended

on its stock price. A firm could be classified as a large firm, relative to median market

value, in a particular year but re-classed into small firm the following year. Thus, one

can not labeled firm as large or small based on any particular stock price of the entire

study period but has to evaluate its market size yearly.

For each year, a median market value was calculated from the sampled firms. The

firms which had a market value higher than median market value were classified as

large firm. Whereas the firms which had a market value lower than median market

value were classified as small firm. Eddy and Seifert (1988) used similar approach in

differentiating firm size.

As stated in previous chapter, all of these four hypotheses are generalized as dividend

changes in small firms are smaller than dividend changes in large firms to signal

future earning change. For each pair of dividend change and future earning change

data, a Mann-Whitney test was carried out to investigate whether there were any

significance differences between small firms and large firms. If there were a

significance difference between the groups, the magnitude of dividend increase to

signal both groups could be observed from the ranking value. By comparing the

magnitude of dividend change, it could be determined whether small firms’ dividend

change was smaller than larger firms and confirmed these hypotheses.


Recommended