AbstractWe analyze China’s rapid economic development in the contextof the dualistic development theory. Over the period 1965–2009,we find that China’s economic growth is mainly attributable to thedevelopment of the non-agricultural (industrial and service) sec-tor, driven by rapid labor migration and capital accumulation. Wefind that the sectoral reallocation of labor plays a significant role inpromoting China’s economic growth. Further, we find that themarginal productivity of agricultural labor stopped stagnating in1978, which indicates that China entered quickly into phase twoof economic development with the initiation of market reforms.Moreover, by 2009, the marginal productivity of labor has likelyexceeded the institutional wage, as defined by the initially low av-erage labor productivity, indicating that China may be now in theprocess of entering phase three of economic development.
1. Introduction
China has a long history of dualistic economic develop-ment. Prior to the 1978 economic reforms led by DengXiaoping, China was a very poor and largely peasantagrarian economy. Eighty percent of the labor force wasengaged in the rural agricultural sector. Agricultural laborproductivity was extremely low due to the presence ofsurplus labor relative to other scarce resources. The
* The authors are grateful to the participants of the Asian Eco-nomic Panel meeting in New York on 24–25 March 2011, partic-ularly Professors Wing Thye Woo, Jeffery D. Sachs, Mary-Françoise Renard, Fang Cai, Yunwing Sung, and Prema-chandra Athukorala, for their helpful comments. The authorsalso thank the Earth Institute at Columbia University and theAsian Economic Papers panel for their kind sponsorships.
brought to you by COREView metadata, citation and similar papers at core.ac.uk
economic reforms initiated in 1978 propelled the Chinese economy into a new phaseof development. Rural liberalization led to development in the agricultural sectorand to the establishment of township and village enterprises (TVEs). It also helpedrelease surplus labor from agricultural production. The steady marketization of eco-nomic activities and the integration of China into the international economy gener-ated a large demand for labor. As a result, there was a great increase in labor migra-tion, albeit on a temporary basis due to the restriction on labor mobility by thehousehold registration system (the Hukou system). In 1978, 4.38 million laborers mi-grated to the non-agricultural sector (Zhang and Song 2003); by 2009, the numberof rural–urban migrants rose to over 145 million (Yao 2011). Labor in the non-agricultural sector increased from 29.5 percent of total employment in 1978 to61.9 percent in 2009. Over the same period, the contribution of non-agricultural pro-duction to the value-added GDP increased from approximately 62 percent to 89 per-cent. Rapid development of the non-agricultural sector, fuelled by great inºows ofrural labor, has driven the Chinese economy to grow at an average rate of 8 percentper annum for more than three decades since the 1978 economic reforms.
China’s remarkable economic growth has been interpreted in various ways. Sincethe 1990s, two schools of thought, institutional experimentalism and institutionalconvergence, have emerged in the literature (Sachs and Woo 2000). Experimentalistsattribute China’s rapid economic growth to the discovery of new non-capitalistmechanisms (such as collectively owned TVEs) that were very efªcient. In contrast,proponents of institutional convergence regard China’s growth as the natural conse-quence of an initially poor peasant economy converging toward a developed marketeconomy. Both schools, though disagreeing on the degree of institutional innova-tion, strongly emphasize the role of marketization and internationalization in spur-ring economic growth in China. It is generally accepted, however, that economic re-forms are only able to lift an economy out of poverty if they are compatible withthat economy’s characteristics. China has been characterized as a dualistic economywith so-called “backward advantages,” namely, the presence of surplus agriculturallabor. The rapid development of China’s economy is in fact largely attributable to itsdualistic nature and the ºows of surplus labor between the two sectors. ThoughChina’s economic reforms are undoubtedly important, they facilitated rather thancaused the process of economic transition. Hence, it is more appropriate to interpretChina’s remarkable economic growth as a consequence of the development of adualistic economy with surplus labor.
The most well-known theory of dualistic development was proposed by Lewis(1954) and formalized by Ranis and Fei (1961). The Lewis-Ranis-Fei theory ofdualistic economic development describes the development of an over-populatedand underdeveloped economy with vast amounts of surplus agricultural
2 Asian Economic Papers
An Empirical Analysis of China’s Dualistic Economic Development: 1965–2009
labor.1 Economic growth in such an economy can be achieved by rapid developmentof the non-agricultural (industrial and service) sector, facilitated by capital accumu-lation and the drawing of surplus labor from the agricultural sector. Sectoral reallo-cation of surplus labor changes the productivity of labor and thereby drives theeconomy to transit from a labor-surplus stage to a labor-scarce stage of develop-ment. The Lewis-Ranis-Fei theory of dualistic economic development therefore pro-vides a suitable theoretical framework for studying the growth path of labor-surplusdeveloping economies such as China.
In this paper, we analyze the dualistic development of the Chinese economy usingthe Lewis-Ranis-Fei theory. In particular, we focus on addressing the pattern ofChina’s economic development by highlighting the role of sectoral reallocation ofsurplus labor. Moreover, we identify the three phases of China’s economic develop-ment and test if China has yet reached the Lewis turning point.2 To answer thesequestions we ªrst estimate Cobb–Douglas production functions for China’s agricul-tural and non-agricultural sectors using national-level data over the period 1965–2009. Our results show that China’s economic growth is driven by the rapid devel-opment of the non-agricultural sector, which results from the fast accumulation ofnon-agricultural capital as well as expansion of non-agricultural employment. Wethen evaluate the contribution of labor reallocation away from agriculture to non-agriculture by applying the Labor Reallocation Effects equation speciªed by theWorld Bank (1996). Our results suggest that labor reallocation has a positive impacton China’s economic growth, accounting for 1.37 percent of per annum GDPgrowth. This result coincides with the ªndings of Kuijs and Wang (2005), Woo (1998)and the World Bank (1996). It conªrms the signiªcant contribution of sectoral laborreallocation on the development of China’s dualistic economy. This ªnding also un-dermines other explanations of China’s growth miracle, such as the gradualist ap-proach by Lin, Cai, and Lee (1994) or the experimentalist strategy proposedNaughton (1995), both of which make no reference to the important role of surpluslabor in enabling the fast growth.
The phases of China’s economic development, and particularly the Lewis turningpoint, have been studied using various methods but no deªnitive conclusions have
3 Asian Economic Papers
An Empirical Analysis of China’s Dualistic Economic Development: 1965–2009
1 Throughout the paper we refer to the two sectors as agricultural and non-agricultural. Vari-ous authors have used different terms interchangeably for these two sectors. Lewis (1954)originally named the two sectors as the subsistence and the capitalistic sectors and later inLewis (1979) referred to them as the traditional and modern sectors. Jorgenson (1967, 291)elaborates further on the distinction between the two sectors and narrows this down to thestylized fact that the two sectors do not share the same production technology, particularlywhen it comes to capital accumulation.
2 The Lewis turning point refers to the point beyond which a developing country has de-pleted its surplus labor and its industry has to face rising wage rates (Yao 2011).
been reached. In this paper, we identify the phases of development and correspond-ing turning points by examining the evolution of labor productivities over time asindicated in the Lewis-Ranis-Fei model. We ªnd that the Chinese economy has fullyabsorbed the redundant agricultural labor and entered phase two of development,as shown by the rising marginal productivity of labor since the 1978 economic re-forms. We also ªnd that labor’s marginal productivity has continued to rise and by2009 may even have exceeded the institutional wage as deªned by the initial low av-erage productivity of labor. This indicates that by 2009 China may near, or have ac-tually reached, the Lewis turning point, which signals entry into phase three eco-nomic growth as deªned in the Lewis-Ranis-Fei model.
The paper proceeds as follows. Section 2 reviews the Lewis theory, the Ranis-Feimodel, and the related literature. Section 3 discusses China’s dual-sector economicdevelopment and rural–urban labor migration. Section 4 presents the model spe-ciªcations for estimating the production functions, decomposing dual-sectoral eco-nomic growth rates and evaluating the effect of labor reallocation away from agri-culture toward non-agriculture. Section 5 explains the data in relation to China’semployment, capital stock, labor migration, and technological progress. Section 6presents our estimation results. Section 7 provides detailed numerical analysis re-garding China’s sources of dual-sector economic growth, the role of labor realloca-tion, and phases of development and turning points that China has passed through.A ªnal section concludes and provides tentative policy recommendations.
2. Literature survey
2.1 The Lewis-Ranis-Fei modelThe Lewis (1954) theory of dualistic economic development provides the seminalcontribution to theories of economic development particularly for labor-surplus andresource-poor developing countries. In the Lewis theory, the economy is assumed tocomprise the agricultural and non-agricultural sectors. The agricultural sector is as-sumed to have vast amounts of surplus labor that results in an extremely low, closeto zero, marginal productivity of labor. The agricultural wage rate is presumed tofollow the sharing rule and be equal to average productivity, which is also known asthe institutional wage. The non-agricultural sector has abundant capital and re-sources relative to labor. It pursues proªt and employs labor at a wage rate higherthan the agricultural institutional wage by approximately 30 percent (Lewis 1954,150). The non-agricultural sector accumulates capital by drawing surplus labor outof the agricultural sector. When the surplus labor is exhausted, the Lewis turningpoint is reached and the economy completes the transition from a labor-surplusstage to a labor-scarce stage of development.
4 Asian Economic Papers
An Empirical Analysis of China’s Dualistic Economic Development: 1965–2009
Later, Ranis and Fei (1961) formalized the Lewis theory by combining it withRostow’s (1956) three “linear-stages-of-growth” theory. They subdivided Lewis’sªrst stage into two phases and make Lewis’s stage two correspond to their phasethree. These three phases, illustrated in Figure 1, are deªned by the marginal pro-ductivity of agricultural labor. The entry into each phase is formalized by three turn-ing points:
• The breakout point leads to phase one growth with redundant agricultural labor.• The shortage point leads to phase two growth with disguised agricultural
unemployment.• The commercialization point, or Lewis turning point, leads to phase three self-
sustaining economic growth with the commercialization of the agricultural sector.
2.2 Relevant empirical studies on China’s growthChina’s remarkable economic performance has been closely studied and intensivelydebated, with the focus being the identiªcation of the sources of China’s growth
5 Asian Economic Papers
An Empirical Analysis of China’s Dualistic Economic Development: 1965–2009
Figure 1. Lewis-Ranis-Fei phases of economic development in relation to agricultural laborinput (LA) and output (QA)
Source: Ranis and Fei (1961, diagram 1.3).
miracle. The debate over China’s growth has been dominated by two schools ofthought and has evolved over time. Initially the debate was over the speed of the re-forms, namely, whether China’s rapid growth was attributable to its gradual andincremental reforms or to its fast and comprehensive reforms. The accumulated evi-dence from Eastern Europe started to show that slow-reforming economies gener-ally performed worse than fast-reforming economies. In addition, Vietnam providedanother case-study for an economy where rapid reforms led to rates of economicgrowth similar to China’s. As a result of this evidence, the debate moved on to oneof interpreting the nature of China’s economic reforms. Most economists who hadfavored the big-bang approach now view China’s high growth as a consequenceof the steady institutional convergence of China’s socialist institutions towards capi-talist ones. On the other hand, most economists who had favored the gradualistexplanation now regard China’s high growth rate a consequence of institutionalinnovation. They argue that the gradual nature of the Chinese reforms was due toeconomic experimentation, and the experiments succeeded in producing new non-capitalist institutions that are at least as efªcient as capitalist ones. These gradualinnovations include 15-year land leases instead of land privatization, collec-tively owned enterprises instead of private enterprises, and incentive-compatibleproªt-sharing contracts between state and state-owned enterprises (SOEs) insteadof privatization.
The (initially gradualist) experimentalist school is led by Lin, Cai, and Lee (1994),Naughton (1995), and Nolan and Ash (1995). The convergence school is representedby Fan (1990, 1994), Bruno (1994), and Sachs and Woo (1994, 2000). In essence, thegradualist school claims that China’s economic experimentation and innovationhave helped China evolve toward a unique Chinese economic model. Conversely,the convergence school argues that China’s growth is the consequence of rapid con-vergence from an initial labor-intensive peasant agrarian economy to an East Asianmarket economy. Both schools stress the common point that market reforms havespurred China’s economic growth.
We note that China’s economic reforms were ªrst initiated in the backward rural ag-ricultural sector, which featured surplus labor, and then extended to the urban in-dustries. In our judgment, this reform sequence made the most of China’s dualisticeconomy and thereby helped it to undertake its economic takeoff. In contrast,the economic transition that occurred in the already industrialized and urbanizedSoviet economies led to economic downturns. Therefore, it was the dualistic econ-omy that allowed economies like China, Vietnam, and Laos to grow, regardless ofthe speed of reform, during their transition from central planning. China’s growthpath is more relevant to the dualistic explanation, such as the Lewis-Ranis-Fei the-ory, than other debates.
6 Asian Economic Papers
An Empirical Analysis of China’s Dualistic Economic Development: 1965–2009
The Lewis theory has been applied to several economies such as Japan, Korea, andTaiwan with various degrees of success (e.g., Ohkawa 1965; Ho 1972; Fei and Ranis1973). In view of China’s remarkable economic growth, the Lewis theory has re-cently been applied to its analysis, with particular focus on identifying the Lewisturning point, but no deªnitive consensus has been reached. For example, Cai (2007)argues that China had already reached the Lewis turning point. This was illustratedby increases in the wages of the rural migrant wages and the phenomenon of “rurallabor-scarcity,” which occurred in the Zhujiang triangle coastal area in 2003. Thiswas also accelerated by the substantial decline in China’s population growth duringthe demographic transition.
Cai’s view is supported by scholars like Park, Cai, and Du (2010) and Wang (2008),while challenged by other such as Meng and Bai (2007), Knight (2007), Yao (2011),and Knight, Deng, and Li (2010). Knight Deng, and Li (2010) argue that evidence onthe rising wages of migrants is subject to sample changes. Yao (2011) points out thatrecent agricultural wage increases are largely due to reductions in agricultural taxesin 2006, direct subsidies to grain production, and high price inºation for food. Vari-ous studies even indicate that China is a long way from the Lewis turning point. Forinstance, Knight et al. (2010) reports that in the 2002 and 2007 national householdsurveys, no signiªcant rise was observed in migrants’ wages and that a substantialpool of potential migrant workers, approximately 80 million, is still available in ru-ral areas. Yao and Zhang (2010) conªrm Knight’s ªnding and argue that it may notbe until 2018 that all of China’s potential migrants are fully absorbed.
Disagreement between current studies is largely attributable to the diversemethods3 used to identify China’s Lewis turning point. Many studies (see Cai 2007;Knight 2007; Meng and Bai 2007) examine changes in rural household’s net incomesand migrants’ wages, whereas others (see Kwan 2009; Knight, Deng, and Li 2010;Minami and Ma 2010; Yao and Zhang 2010) estimate the amount of surplus labor inrural China. There are also studies (Cai and Wang 2008; Yao 2011) that estimate ur-ban labor demand or the supply and demand functions for migrant workers.Studies based on estimates of labor supply and demand functions rely on ruralwages, and therefore, they share the same problems as studies that focus directly onrural wages. These problems were ªrst discussed by Minami (1968, 384):
when there is a rising trend in the real wage, we cannot ascertain straightfor-wardly whether that increase comes from a change in the marginal productivityof labor or from an increase in the subsistence level itself.
7 Asian Economic Papers
An Empirical Analysis of China’s Dualistic Economic Development: 1965–2009
3 Similar discussion is also provided by Knight, Deng, and Li (2010, 7–9).
Identifying the development turning point by measuring the amount of rural sur-plus labor seems close to the basic premise of the Lewis theory. Nevertheless, thetheory of surplus labor refers to the situation where the marginal productivity of la-bor is lower than the institutional wage. Therefore, surplus labor need not be limitedto rural labor, it could also exist in urban areas too, but this fact is difªcult to verifyin practice.
However, one technique that applies the Lewis-Ranis-Fei framework most directlyto identifying the phases of economic development has, to date, not been applied tothe Chinese case. This technique examines the change in the marginal productivityof agricultural labor over time and was ªrst applied by Minami (1968) to study Ja-pan’s agricultural commercialization. It not only provides intuitive implications onthe phases of economic development but also identiªes the time when the Lewisturning point is achieved. In this paper, we apply this technique to identify whetherChina has reached the Lewis turning point.
3. The Chinese experience
3.1 China’s dualistic economic developmentChina has had a long history of dualistic economic development. According toPutterman (1992), prior to the 1978 economic reforms, the rural agricultural sectorwas run using collective farms and wages were set by the government. The pursuitof proªt was only allowed in the urban industrial sector. The 1978 economic reformsdid not bring this dualistic structure to an end. Instead it allowed the urban sector todevelop further by creating a dynamic service sector and a new class of TVEs. Thus,China’s dualistic structure involves the agricultural sector in rural areas and thenon-agricultural sector4 in mainly urban areas.
As shown in Figure 2, the contribution of agricultural production to GDP falls fromapproximately 39 percent in the 1960s to 10 percent in 2009, whereas the contribu-tion of non-agricultural production rises from 61 percent to 90 percent during thesame period. Moreover, the non-agricultural sector grows at a faster pace than theagricultural sector. This indicates that economic growth in China is driven more bythe non-agricultural sector than the agricultural sector.
8 Asian Economic Papers
An Empirical Analysis of China’s Dualistic Economic Development: 1965–2009
4 More precisely, the agricultural sector includes farming, animal husbandry, forestry, andªshery. The non-agricultural sector includes construction, industry (i.e., manufacturing,mining and quarrying, electricity, gas and water supply), transport, post and telecommuni-cation services, wholesale and retail trade, and catering services. The output of TVEs is in-cluded in the non-agricultural sector, though they are in semi-urban locations.
3.2 China’s sectoral labor reallocationChina is a labor-surplus economy and most of this surplus is engaged in the agricul-tural sector. Before the 1978 economic reforms, labor mobility was controlled by thegovernment through the “Hukou system.” According to Zhao (2000), the averageannual rural–urban migration rate was only 0.24 percent in 1949–85, much lowerthan the world average rate of 1.84 percent in 1950–90. Since the early 1980s, the re-strictions on labor mobility have been relaxed to accommodate labor demand in thenon-agricultural sector. However, the one-child policy introduced in the 1970s hasbeen imposed more stringently, particularly in urban areas. This has slowed thegrowth of the urban-born labor force and aggravated the labor shortage in the non-agricultural sector (Knight 2007). Recently the restrictions on labor mobility havebeen relaxed and increasing numbers of rural laborers have migrated to towns andcities. As a result, relative employment in the agricultural sector (illustrated in Fig-ure 3) dropped from 70 percent in 1978 to 38 percent in 2009. Correspondingly, em-ployment in the non-agricultural sector rose rapidly and reached 62 percent of totalemployment. Note that even with the relaxation of restrictions on labor mobility,most of the migrants are only allowed into cities on a temporary basis.
There are no consistent and reliable data on China’s rural–urban labor migrationover time. Intermittent migration data are collected in population censuses at 8- to
9 Asian Economic Papers
An Empirical Analysis of China’s Dualistic Economic Development: 1965–2009
Figure 2. Development of the Chinese dual-sector economy (1960–2009)
Source: World Development Indictors (World Bank 2010).
10-year intervals, or in surveys covering a few provinces. Many studies (e.g., Wu1994; Zhang and Song 2003) apply the residual method suggested by the UnitedNations (1970) to derive a consistent time series for China’s rural–urban labor mi-gration. This method assumes that without international labor migration, the in-crease in urban population is attributable to the natural growth of the urban popula-tion and net rural-to-urban migration. Thus, net labor migration can be derived bysubtracting the natural population growth from the aggregate population increasein urban areas. Zhang and Song5 (2003, Table 1) apply this method and compute theseries for rural–urban labor migration in 1978–99. This is illustrated in Figure 4. Theabrupt drop in labor migration during 1989–91 may be due to events following theTiananmen Square incident. Yao (2011, Figure 6) presents a time series for rural–ur-ban migration in recent decades. As shown in Figure 4, the series reveals a large dis-
10 Asian Economic Papers
An Empirical Analysis of China’s Dualistic Economic Development: 1965–2009
5 Zhang and Song (2003) compute the natural growth of urban population as the product ofthe total urban population and the natural urban population growth rate, which is proxiedby the ofªcial “natural city growth rates.” The data for the natural city growth rates in 1978–82 and 1988–99 are sourced from the NBS Statistical Yearbook (2000). For the missing data in1982–88, they use a combination of correlations with city growth and projections from theavailable years. Similar patterns of the rural–urban labor migration are observed in the datagenerated by Wu (1994, Figure 4).
Figure 3. Employment in the two sectors
Source: Data before1965 are from China Statistical Yearbook (NBS 2004), and data after 1965 are from the World Development Indicators
(World Bank 2010).
crepancy, compared to that computed by Zhang and Song (2003), in the overlappingperiod 1993–99.
4. Model speciªcation
In this section we introduce the production function speciªcations of the two sec-tors, the equations used in the growth decomposition to identify phases of develop-ment and the equations used to compute the contribution to growth of labor reallo-cation away from agriculture.
We assume a dualistic economic framework with the agricultural and non-agricul-tural sectors representing the traditional and modern sectors of the Lewis theory.Accordingly, agricultural output (QA) is a function of agricultural hectares (HA), la-bor input (LA), and agricultural capital (KA). Output in the non-agricultural sector(QN) depends on employed labor (LN) and capital stock (KN). Both production func-tions feature Hicks neutral technological progress (fA(T), fN (T)) where T denotestime; the exact functional form of these contain trends that reºect socio-economicevents and possibly dummies for structural shifts. The resulting Cobb–Douglas pro-duction functions for the agricultural and non-agricultural sectors are
11 Asian Economic Papers
An Empirical Analysis of China’s Dualistic Economic Development: 1965–2009
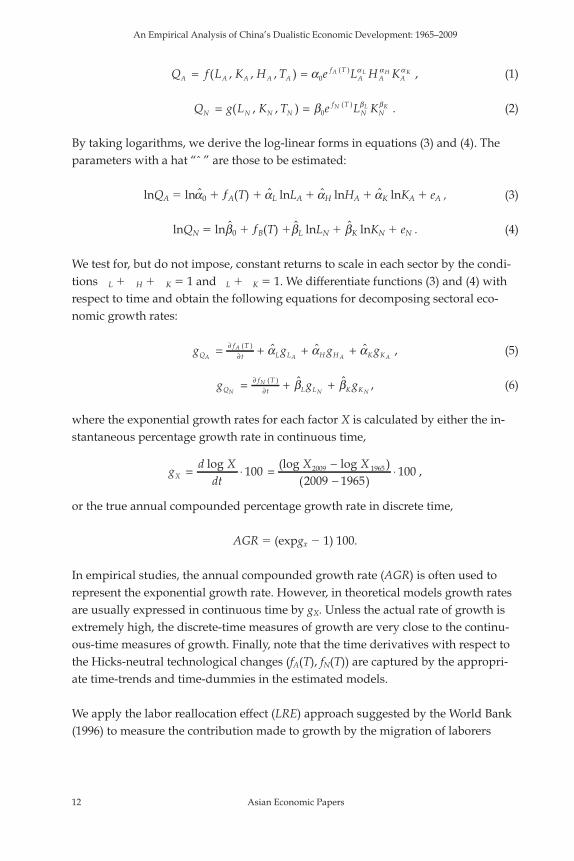
We test for, but do not impose, constant returns to scale in each sector by the condi-tions L � H � K � 1 and L � K � 1. We differentiate functions (3) and (4) withrespect to time and obtain the following equations for decomposing sectoral eco-nomic growth rates:
g g g gQf T
t L L H H K KA
A
A A A= + + +
¶( )
� � �a a a , (5)
g g gQf T
t L L K KN
N
N N= + +
¶( )
� �b b , (6)
where the exponential growth rates for each factor X is calculated by either the in-stantaneous percentage growth rate in continuous time,
gd X
dtX X
X = ⋅ = −−
⋅log (log log )( )
1002009 1965
1002009 1965 ,
or the true annual compounded percentage growth rate in discrete time,
AGR � (expgx � 1) 100.
In empirical studies, the annual compounded growth rate (AGR) is often used torepresent the exponential growth rate. However, in theoretical models growth ratesare usually expressed in continuous time by gX. Unless the actual rate of growth isextremely high, the discrete-time measures of growth are very close to the continu-ous-time measures of growth. Finally, note that the time derivatives with respect tothe Hicks-neutral technological changes (fA(T), fN(T)) are captured by the appropri-ate time-trends and time-dummies in the estimated models.
We apply the labor reallocation effect (LRE) approach suggested by the World Bank(1996) to measure the contribution made to growth by the migration of laborers
12 Asian Economic Papers
An Empirical Analysis of China’s Dualistic Economic Development: 1965–2009
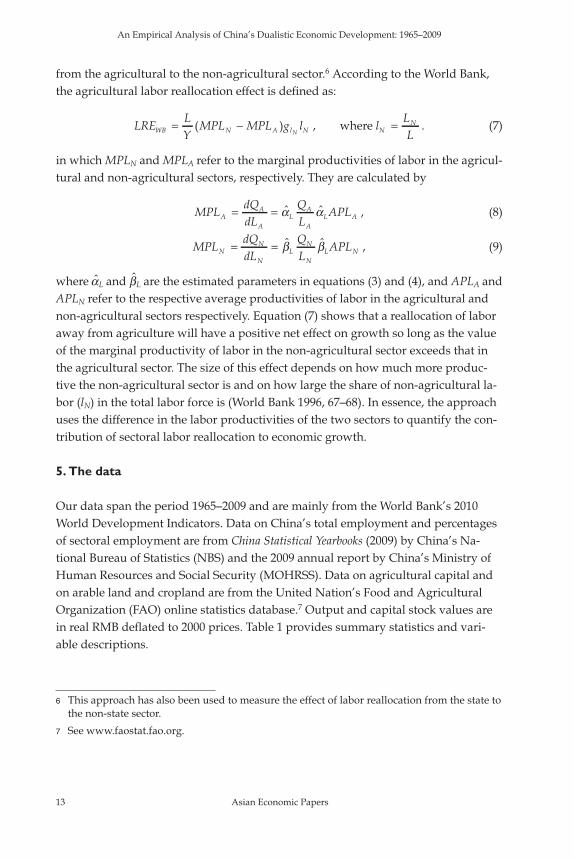
from the agricultural to the non-agricultural sector.6 According to the World Bank,the agricultural labor reallocation effect is deªned as:
LRELY
MPL MPL g lWB N A l NN= −( ) , where l
LLN
N= . (7)
in which MPLN and MPLA refer to the marginal productivities of labor in the agricul-tural and non-agricultural sectors, respectively. They are calculated by
MPLdQdL
QL
APLAA
AL
A
AL A= = � �a a , (8)
MPLdQdL
QL
APLNN
NL
N
NL N= = � �b b , (9)
where �aL and �bL are the estimated parameters in equations (3) and (4), and APLA andAPLN refer to the respective average productivities of labor in the agricultural andnon-agricultural sectors respectively. Equation (7) shows that a reallocation of laboraway from agriculture will have a positive net effect on growth so long as the valueof the marginal productivity of labor in the non-agricultural sector exceeds that inthe agricultural sector. The size of this effect depends on how much more produc-tive the non-agricultural sector is and on how large the share of non-agricultural la-bor (lN) in the total labor force is (World Bank 1996, 67–68). In essence, the approachuses the difference in the labor productivities of the two sectors to quantify the con-tribution of sectoral labor reallocation to economic growth.
5. The data
Our data span the period 1965–2009 and are mainly from the World Bank’s 2010World Development Indicators. Data on China’s total employment and percentagesof sectoral employment are from China Statistical Yearbooks (2009) by China’s Na-tional Bureau of Statistics (NBS) and the 2009 annual report by China’s Ministry ofHuman Resources and Social Security (MOHRSS). Data on agricultural capital andon arable land and cropland are from the United Nation’s Food and AgriculturalOrganization (FAO) online statistics database.7 Output and capital stock values arein real RMB deºated to 2000 prices. Table 1 provides summary statistics and vari-able descriptions.
13 Asian Economic Papers
An Empirical Analysis of China’s Dualistic Economic Development: 1965–2009
6 This approach has also been used to measure the effect of labor reallocation from the state tothe non-state sector.
7 See www.faostat.fao.org.
Agricultural and non-agricultural outputs are derived from the multiplication of therelative sectoral shares value-added in GDP by the real values of GDP. The data forChina’s total employment by the NBS show a spurious jump in 1990 due to ac-knowledged statistical adjustments. Such a jump is not revealed in the employmentseries by MOHRSS, but this is only available up to 2002. To generate a complete andconsistent series for employment, we rescale the data from NBS for the period 1965–95 using the average ratio of the two employment series. Thus, sectoral employmentseries are derived by multiplying the total employment data by the sectoral employ-ment shares. Agricultural capital is represented by the number of tractors, whichis consistently available over the entire sample period from the FAO. Capital stockin the non-agricultural sector is obtained by applying the conventional PerpetualInventory Method with an annual depreciation rate of 10 percent. The initial valueof the capital stock is set at 378,847,553,230 yuan at 2000 constant prices based onthe calculation by King and Levine (1994) that non-agricultural capital was equalto 63.9 percent of GDP in 1965. The two series of capital stock are illustrated inFigure 5.
14 Asian Economic Papers
An Empirical Analysis of China’s Dualistic Economic Development: 1965–2009
Table 1. Summary statistics
Variables Mean Min Max Description
QA 9.6�1011 2.25�1011 2.52�1012 Agricultural output: in yuan at constant 2000prices.
LA 3.32�108 2.55�108 3.80�108 Agricultural labor: total workers.
KA 756,452.4 73,021 3,010,658 Agricultural capital: total number of tractors.
HA 1.18�107 1.00�107 1.34�107 Agricultural hectares of arable land andcropland.
T1979–84 3.80 0 6 Agricultural technological trend: trend startsin 1979 and stops increasing in 1984, equalszero before 1979.
T1985–92 3.82 0 8 Agricultural technological trend that starts in1985 and ends in 1992. It equals zero before1985 and equals 8 from 1992 on.
T1993–on 3.40 0 17 Agricultural technological trend that starts in1993 and equals zero before 1993.
QN 4.84�1012 3.43�1011 2.18�1013 Non-agricultural output: in yuan at constant2000 prices.
LN 2.33�108 5.76�107 4.83�108 Non-agricultural labor: total workers.
T1984–on 7.8 0 26 Non-agricultural technological trend thatstarts in 1984 and equals zero before 1984.
D1967 0.02 0 1 Cultural Revolution dummy: equals one in1967, zero otherwise.
D1968 0.02 0 1 Cultural Revolution dummy: equals one in1968, zero otherwise.
Source: Authors’ calculations.
We model technological progress in the agricultural sector by three segmented de-terministic time trends. Following the work of Sachs and Woo (1994), the ªrst trendcovers 1979–84 to capture the decentralization of farming and the second trend cov-ers 1985–92 to capture the introduction of the market system in the rural economy.The third trend, starting in 1993, captures the slight slowdown in agricultural tech-nological progress. No technological trend is included before 1979, it being well es-tablished that agricultural technological progress had been negligible due todestabilizing socio-economic events (see Chow 1993).
Technological progress in the non-agricultural sector is modeled by a time trendfor 1984 onward. This trend is justiªed by the fact that experimental reformson SOEs began in August 1980 and this translated into widespread reforms by1984. Political events surrounding the Cultural Revolution justify the inclusionof year dummies for 1967 and 1968. Other events may have justiªed the in-clusion of year dummies for 1976 and 1990–91 but this would have removed al-most all dynamics from the model and would necessitate a substantial numberof dummies.
15 Asian Economic Papers
An Empirical Analysis of China’s Dualistic Economic Development: 1965–2009
Figure 5. Capital stock (1965–2009)
Source: Agricultural capital represented by the number of tractors is from World Development Indicators (World Bank 2010). Non-
agricultural capital is authors’ calculation, based on the World Development Indicators (World Bank 2010) and Penn World Tables
(Heston, Summers, and Aten 2002).
6. Estimates of the production functions
6.1 Stationarity testsBefore estimating the production functions, we test the stationarity of variables us-ing Augmented Dickey-Fuller (ADF) (Dickey and Fuller 1979, 1981) and KPSS(Kwiatkowski et al. 1992) tests. The ADF tests are for the null hypothesis that the se-ries are non-stationary, the KPSS tests are for the null hypothesis that the series arestationary. The results of these tests are reported in Table 2 and they suggest, at the5 percent signiªcance level, that all the variables are non-stationary and integratedof order one I(1). The one exception is the log of agricultural capital that is border-line integrated of order one I(1) or two I(2), lnKA � I(1/2), but it seems that this am-biguity may be due more to the long cycle in the data rather than it being I(2).Aware of the non-stationarity in the data we take steps to address it in the estima-tion of the models.
6.2 Result estimates of the production functionsWe run regressions on the data described in the previous section to estimate thelog-linear production functions in equations (3) and (4). We estimate these pro-duction functions8 by Ordinary Least Squares (OLS), Generalized Least Squares(GLS), and Maximum Likelihood (ML) with robust t-tests based on White’s (1984)heteroscedasticity-consistent standard errors. Regression results are reported inTables 2 and 3.
The OLS production function estimates are reported in columns (1) in Tables 3 and4, and they represent our initial base cases. The estimated elasticity parameters seemreasonable as do the technological trend parameters. F-tests suggest that neither sec-tor exhibits constant returns to scale. The diagnostics on the residuals highlight twoproblems not uncommon to time-series regressions. The ªrst is the large degree ofresidual serial correlation in the agricultural sector and the second is the heterosce-dasticity in the non-agricultural production function. The heteroscedasticity has al-ready been accounted for by using the White (1984) heteroscedasticity-consistentstandard errors for the t-tests and F-tests. The autocorrelation is accounted for in theGLS and ML estimates that follow.
16 Asian Economic Papers
An Empirical Analysis of China’s Dualistic Economic Development: 1965–2009
8 We estimated the production function in the agricultural sector by involving fertilizer con-sumption and irrigation but the results suffered from severe multi-collinearity problems. Wetherefore settled on the parsimonious parameterization reported in Table 3. Note also thatalthough it has been suggested that the panel estimates could have been carried out usingprovincial-level data, the data for some variables, for example, agricultural machinery, arenot available before 1978 across provinces. In that case, the sample period would not be longenough to test the Lewis theory, nor would it be long enough to identify the stages of eco-nomic development in China.
17 Asian Economic Papers
An Empirical Analysis of China’s Dualistic Economic Development: 1965–2009
Breusch-Godfrey autocorrelation LM �2 test 16.188[0.000]
2.9342[0.087]
2.041[0.153]
White heteroscedasticity �2 test 4.271[0.118]
2.230[0.328]
1.268[0.530]
Jarque-Bera normality �2 test 2.184[0.336]
1.914[0.384]
2.075[0.354]
Ramsey Reset F test 18.61[0.000]
18.27[0.000]
10.12[0.000]
Source: Authors’ calculations.
Note: * and ** denote signiªcance at the 5 percent and the 1 percent level, respectively.
Parentheses surround t statistics, square brackets represent densities in the tail of each distribution for rejection of the respective null
hypotheses. OLS, GLS, and ML estimates of t statistics are based on the White (1984) robust covariance estimator.
The GLS and ML estimates reported in columns (2) and (3), respectively, of Tables 3and 4 are for models that accommodate ªrst order autoregression, AR(1), in thestructural residuals. Equations (10) and (11) illustrate how AR(1) in the structural re-siduals is accommodated by adding a second equation to the production function:
lnQt � �fL lnLt � �fK lnKt � . . . � ut, (10)
ut � �rut�1 � et, (11)
where ut are the structural residuals and et are the non-structural residuals. Theseequations are valid for both the agricultural and non-agricultural production func-tions in equations (3) and (4). The GLS estimator is based on the Cochraine–Orcutt(1949) iterative procedure with the Prais–Winsten (1954) transformation to retain theªrst observation. The ML estimator is based on a uniªed log-likelihood equationthat subsumes equations (10) and (11) into one. The parameter estimates in the GLSand ML estimates are similar to one another. This indicates that the estimates arerobust to the estimation method. We expect that the GLS and ML parameter esti-mates are slightly better deªned than the OLS ones because the error autocorrela-tion has been corrected for. The structural residuals have signiªcant autoregressiveparameters of magnitude 0.626 and 0.628 in agriculture, and 0.315 and 0.309 in non-agriculture. The diagnostics now pass the Breusch–Godfrey (Breusch 1978; Godfrey1978) AR(1) test suggesting the non-structural residuals are, apart for the heterosce-dasticity, white noise. There is evidence of non-normality in the residuals of the non-agricultural production function but this is due to large negative socio-economicshocks associated with 1968, 1976, and 1990.
Model estimates on non-stationary series may lead to spurious regressions. There-fore, we carry out Engle–Granger (1987) co-integration tests on the two estimatedleast squares production functions to verify that these are not spurious regressions.The Engle–Granger test results indicate that for both sectors the null hypothesisof non-stationarity on the residuals can be rejected at the 10 percent signiªcancelevel. The computed tau statistics of the ADF tests on the residuals are –3.335 and–4.995 for the agricultural and non-agricultural sectors, respectively. They arelower than the Engle–Granger co-integration critical values at the 10 percent and5 percent signiªcance levels.9 This implies that the series, despite being non-stationary, are co-integrated and the estimates on the non-stationary variables arereliable and superconsistent.
18 Asian Economic Papers
An Empirical Analysis of China’s Dualistic Economic Development: 1965–2009
9 The estimated error correction parameters on the lagged error correction terms are –0.404and –0.740 respectively, indicating a more rapid speed of adjustment in the non-agriculturalproduction than agricultural production.
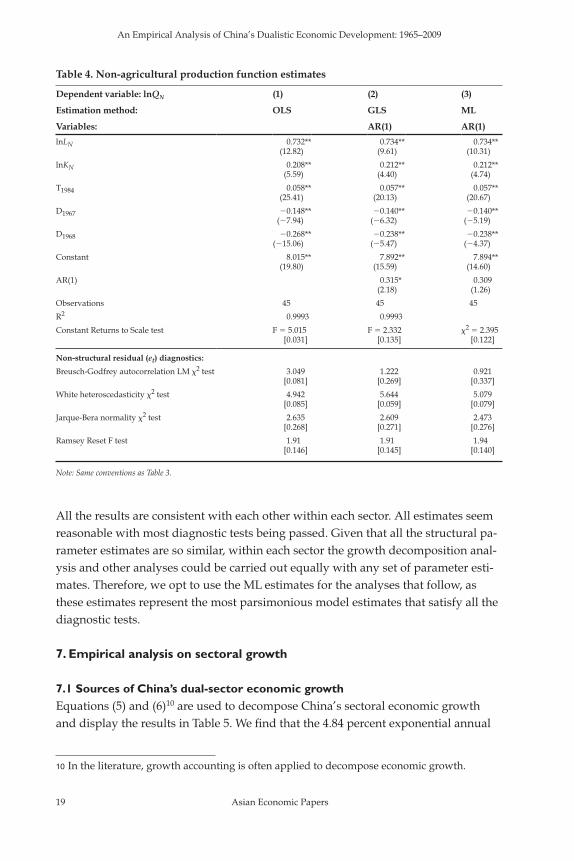
All the results are consistent with each other within each sector. All estimates seemreasonable with most diagnostic tests being passed. Given that all the structural pa-rameter estimates are so similar, within each sector the growth decomposition anal-ysis and other analyses could be carried out equally with any set of parameter esti-mates. Therefore, we opt to use the ML estimates for the analyses that follow, asthese estimates represent the most parsimonious model estimates that satisfy all thediagnostic tests.
7. Empirical analysis on sectoral growth
7.1 Sources of China’s dual-sector economic growthEquations (5) and (6)10 are used to decompose China’s sectoral economic growthand display the results in Table 5. We ªnd that the 4.84 percent exponential annual
19 Asian Economic Papers
An Empirical Analysis of China’s Dualistic Economic Development: 1965–2009
10 In the literature, growth accounting is often applied to decompose economic growth.
Table 4. Non-agricultural production function estimates
Breusch-Godfrey autocorrelation LM �2 test 3.049[0.081]
1.222[0.269]
0.921[0.337]
White heteroscedasticity �2 test 4.942[0.085]
5.644[0.059]
5.079[0.079]
Jarque-Bera normality �2 test 2.635[0.268]
2.609[0.271]
2.473[0.276]
Ramsey Reset F test 1.91[0.146]
1.91[0.145]
1.94[0.140]
Note: Same conventions as Table 3.
growth rate of non-agricultural labor is much higher than the 0.34 percent rate of ag-ricultural labor. Capital inputs in both sectors rise rapidly, 10.64 percent in the non-agricultural sector and 8.28 percent in the agricultural sector. Agricultural land,however, remains relatively constant, changing by an annual mean of just 0.30 per-cent during 1965–2009. Additionally, the 5.99 or 5.78 percent annual economicgrowth in the non-agricultural sector is over threefold that of the agricultural sectorat 1.80 percent when measured by instantaneous growth rates, or 1.87 percent whenmeasured by annually compounded growth rates. This implies that economicgrowth is mainly driven by the expansion of the non-agricultural sector, as sug-gested by the Lewis theory. Moreover, we ªnd that growth in the agricultural sectoris mainly driven by capital accumulation (83.06 percent), whereas growth in thenon-agricultural sector is attributable to both labor accumulation (59.99 percent) andcapital accumulation (39.02 percent). In both sectors, technological progress, despitebeing statistically signiªcant in the estimation, only accounts for a relatively smallshare of economic growth. These results show that China’s economic growth is duelargely to factor accumulation. This ªnding is consistent with most studies in the lit-erature (e.g., Woo 1998). Furthermore, we note that capital accumulates at a fasterrate per annum than labor, whereas it accounts for a relatively smaller share ofgrowth in the non-agricultural sector. This indicates that the expansion of laboremployment plays a prominent role in promoting the development of the non-agricultural sector. In summary, consistent with the Lewis-Ranis-Fei theory, China’seconomic growth is driven by the rapid expansion of the non-agricultural sector,which is affected by capital accumulation and employment growth fuelled by sec-toral labor reallocation.
7.2 The contribution of sectoral labor reallocationWe apply equation (7) to account for the sectoral labor reallocation effect (LREWB)suggested by the World Bank (1996). The merit of this approach is that it is inde-pendent of the number of migrant laborers and therefore one does not need to knowthe number of migrant workers to measure the contribution of sectoral labor reallo-cation to growth. As shown in Figure 6, the reallocation of labor away from agricul-ture has had a positive effect on China’s economic growth for most of 1966–2009 ex-cept for a few years like 1967–68, 1989–90, and 1999–2000, associated with speciªcsocio-economic disturbances. The computations suggest that sectoral labor realloca-
20 Asian Economic Papers
An Empirical Analysis of China’s Dualistic Economic Development: 1965–2009
However, it is well established that growth accounting has many drawbacks. For example, ittreats the contribution other than that by factor input as the total factor productivity. Ittherefore cannot distinguish the pure effect of technological progress on growth. In addition,the result is subject to the assigned input shares. In this paper, we carefully estimate the in-put elasticity and decompose economic growth by factor contributions. Chow and Li (2002)and Ho (1972) have used this approach to decompose economic growth in their studies.
tion contributes on average 1.37 percent to annual economic growth over the period1966–2009. This amounts to approximately 81.34 billion yuan per annum to China’sreal GDP. Our ªnding is close to the 1.3 percent annual contribution to growth in1985–93 reported by Woo (1998) and is consistent with other studies. For example,the World Bank (1996) found that the effect of labor reallocation away from agricul-ture accounted for 1 percent of China’s rapid economic growth during 1985–94. Caiand Wang (1999) report a 1.62 percent average contribution in 1982–97.
21 Asian Economic Papers
An Empirical Analysis of China’s Dualistic Economic Development: 1965–2009
Note: Column (1): Coefªcients are from the ML estimates for both sectors and are taken from column (3) in Tables 3 and 4.
Column (2): *Instantaneous annual growth rates in column (2) are derived by gX � [(lnX2009�lnX1965)/(2009�1965)]�100, where X
represents each of the inputs in turn: Labor, Capital, or Land.
**AGR is the annually compounded growth rate given by AGR�(exp gX �1)�100, values reported in square brackets.
Column (3): Each value is simply the product of the value in columns (1) and (2) and represents the components in equations (5) and
(6).
Column (4): The contribution to sectoral growth calculated as the corresponding value in column (3) divided by the respective total for
column (3) in each sector.
Additionally, in Figure 6, we ªnd that the contribution of sectoral labor reallocationachieved its highest values, at 7.09 and 3.93 percent, in 1978–84. This is closely asso-ciated with the boom of the TVEs, which has effectively absorbed large amounts ofrural surplus laborers (Knight 2007). However, since the mid-1990s, the contributionto the growth of labor reallocation has declined, indicating that labor absorption inthe non-agricultural sector has slowed down. This ªnding is supported by Kuijs andWang (2005), who also detect the slower pace of expansion in urban employmentsince 1993. The demise of TVEs as well as the stable share of industry employmentin the 1990s contributes to the decline in labor reallocation effect. Furthermore, thelow values of the reallocation effect in 1998–2002 may reºect the adverse impact ofthe 1997–98 Asian ªnancial crisis on China’s exports. To conclude, we ªnd that thereallocation of labor away from agriculture has made a substantial contributionto China’s economic growth. This ªnding agrees with the core of the Lewis-Ranis-Fei theory.
7.3 Phases in China’s economic development and the turning pointsAs suggested by Minami (1968), we identify the phases in China’s economic devel-opment, as well as the turning points, by comparing the agricultural marginal pro-ductivity of labor (MPL) to the agricultural institutional wage. Recall from Section2.1 that in the Lewis-Ranis-Fei model the initial agricultural institutional wage ispresumed to follow the sharing rule and be equal to the initially low average agri-
22 Asian Economic Papers
An Empirical Analysis of China’s Dualistic Economic Development: 1965–2009
Figure 6. The labor reallocation effect by the World Bank (1996) approach
Source: Authors’ calculations.
cultural labor productivity. In the model, an economy is deªned as entering phasetwo of economic development if the agricultural MPL starts to increase above itsnear-zero value but is still lower than the low agricultural institutional wage. Theadvantage of this method is that it does not require knowledge of sometimes un-available measures such as rural wages and surplus labor. Admittedly, the applica-tion of this technique is sensitive to the speciªcation of the agricultural institutionalwage. We address this drawback by comparing the agricultural MPL to variousproxies for the institutional wage. We represent three alternative institutional wagesby using the agricultural APL averaged over three time periods: 1965–78, just 1978,and 1965–2009. These three proxies allow us to verify the sensitivity of the results tothe choice of institutional wage. Among them, the mean value of the agriculturalAPL over the entire sample period of 1965–2009 is regarded as the best proxy in thatit accommodates potential increases in the subsistence level itself, as suggested byMinami (1968).
We compute the MPL in the agricultural and non-agricultural sectors using the esti-mated elasticities of output to labor using the estimates for equations (8) and (9), re-spectively. The series for MPL, APL, and the institutional wage are illustrated in Fig-ures 7 and 8. In Figure 7 it is obvious that in both sectors, both the marginal and
23 Asian Economic Papers
An Empirical Analysis of China’s Dualistic Economic Development: 1965–2009
Figure 7. APLs and MPLs
Source: Authors’ calculations based on the estimates in Table 3.
average productivities of labor are stagnant before the 1978 economic reforms andthen rise rapidly, particularly in the non-agricultural sector. The agricultural MPL islow before 1978 but begins to rise rapidly after the 1978 economic reforms. The ris-ing agricultural MPL indicates that the redundant labor has been reallocated awayfrom agriculture and the shortage point (see Figure 1) has been passed after 1978.
Figure 8 allows for the comparison of the agricultural MPL to various proxies for theagricultural institutional wage. It appears that by 2009, at the latest, the agriculturalMPL surpassed the assumed institutional wage, as measured by various criteria,thus suggesting that China has reached the Lewis turning point of economic devel-opment. For instance, the MPL reaches the institutional wage assumed as the meanvalue of the 1965–78 agricultural APL in 1994; whereas it reaches the 1978 APL in1995. When comparing this with our favored proxy for the institutional wage,namely, mean agricultural APL over the entire sample period 1965–2009, we ªndthat the rising MPL crosses it in 2009.
Notwithstanding our results, we also note that China is a large and diverse econ-omy. Thus, different Chinese regions may pass through the Lewis turning point in
24 Asian Economic Papers
An Empirical Analysis of China’s Dualistic Economic Development: 1965–2009
Figure 8. Agricultural APL and MPL
Source: Authors’ calculations based on the estimates in Table 3.
different years. Hence, entry into phase three economic growth may span severalyears rather than just one point in time. This way of looking at the Lewis turningpoint as occurring over a number of years is also adopted by Minami (1968),Garnaut and Song (2006), and Knight, Deng, and Li (2010). In short, we concludethat by 2009 China entered a transition period for the Lewis turning point and maytake several years to fully complete it.
8. Conclusion and policy recommendations
Having tested the Lewis-Ranis-Fei theory for China’s economy over 1965–2009,we found that China’s economic growth is mainly attributable to the developmentof the non-agricultural sector. This is driven by rapid capital accumulation andemployment growth. The reallocation of labor away from agriculture to non-agriculture has made a positive net contribution to China’s rapid economic growthby around 1.37 percent per annum. By generating measures of the marginal produc-tivity of labor, we found that the marginal productivity of agricultural labor startedto increase noticeably after the 1978 economic reforms. This indicates that China en-tered phase two, as deªned by the Lewis-Ranis-Fei theory, of economic develop-ment after 1978. The marginal productivity of agricultural labor has continued torise thereafter and by 2009 it seems to have exceeded the agricultural institutionalwage. Considering the huge diversity within an economy as large as China’s we feelcomfortable with the conclusion that China is now in a transition period of entryinto phase three of economic growth.
Our evidence leads us to make two tentative policy recommendations. First andforemost, more resources should be dedicated to improving labor productivity par-ticularly through rudimentary job training. As indicated by the dualism theory, thethird phase of economic development relies on increasing labor productivity. Pro-viding on-the-job training may improve the working skills of rural migrants andthereby raise their productivity.
Second, labor migration in China, though having made a signiªcant contribution toeconomic growth, is largely temporary. This special characteristic of Chinese labormigration highlights the discrepancy between the rate of urbanization and the paceof industrialization. The Hukou registration system is the reason for this discrep-ancy; and, hence, it is important to remove the Hukou restrictions on migration. It isalso important to provide more facilities and social services to accommodate ruralmigrants in urban areas. These policy changes would facilitate China’s full transi-tion into phase three of economic development.
25 Asian Economic Papers
An Empirical Analysis of China’s Dualistic Economic Development: 1965–2009
References
Breusch, Trevor. 1978. Testing for Autocorrelation in Dynamic Linear Models. Australian Eco-nomic Papers 17:334–355.
Bruno, Michael. 1994. Our Assistance Includes Ideas as Well as Money. Transition (World Bank)5(1):1–4.
Cai, Fang. 2007. The Lewisian Turning Point of China’s Economic Development. In: The ComingLewisian Turning Point and Its Policy Implications, Reports on China’s Population and Labor, editedby Fang Cai and Yang Du, pp. 147–169. Beijing: Social Sciences Academic Press.
Cai, Fang, and Dewen Wang. 1999. The Sustainability of China’s Economic Growth and LaborContribution [Chinese]. Journal of Economic Research 10:62–68.
Cai, Fang, and Meiyun Wang. 2008. A Counterfactual of Unlimited Surplus Labor in RuralChina. China and the World Economy 16(1):51–65.
Chow, Gregory. 1993. Capital Formation and Economic Growth in China. Journal of Economics108(3):809–842.
Chow, Gregory, and Kui-Wai Li. 2002. China’s Economic Growth: 1952–2010. Economic Develop-ment and Cultural Change 51(1):247–256.
Cochrane, Donald, and Guy Orcutt. 1949. Application of Least Squares Regression to Relation-ships Containing Autocorrelated Error Terms. Journal of the American Statistical Association44(245):32–61.
Dickey, David, and Wayne Fuller. 1979. Distribution of the Estimators for Autoregressive TimeSeries with a Unit Root. Journal of the American Statistical Association 74(366):427–431.
Dickey, David, and Wayne Fuller. 1981. Likelihood Ratio Statistics for Autoregressive Time Se-ries with a Unit Root. Econometrica 49(4):1057–1072.
Engle, Robert, and Clive Granger. 1987. Co-Integration and Error Correction: Representation,Estimation, and Testing. Econometrica 55(2):251–276.
Fan, Gang. 1990. Macroeconomics Analysis of Public Ownership [Chinese]. Shanghai: ShanghaiUnited Press.
Fan, Gang. 1994. Incremental Changes and Dual Track Transition: Understanding the Case ofChina. Economic Policy 9(19 Supplement):99–122.
Fei, John, and Gustav Ranis. 1973. A Model of Growth and Employment in the Open Dualistic Econ-omy: The Cases of Korea and Taiwan. New York: Asia Society.
Garnaut, Ross, and Ligang Song, editors. 2006. The Turning Point in China’s Economic Develop-ment. Canberra: Asia Paciªc Press.
Godfrey, Leslie. 1978. Testing Against General Autoregressive and Moving Average ErrorModels when the Regressor Includes Lagged Dependent Variables. Econometrica 46(6):1293–1302.
Heston, Alan, Robert Summers, and Bettina Aten. 2002. Penn World Table Version 6.1, Centerfor International Comparisons at the University of Pennsylvania (CICUP). Available at http://pwt.econ.upenn.edu/.
26 Asian Economic Papers
An Empirical Analysis of China’s Dualistic Economic Development: 1965–2009
Ho, Yhi-Min. 1972. Development with Surplus Population. The Case of Taiwan: A Critique ofthe Classical Two-Sector Model, à la Lewis. Economic Development and Cultural Change20(2):210–234.
Hobijn, Bart, Philip Franses, and Marius Ooms. 1998. Generalizations of the KPSS-test forstationarity. Erasmus University Econometric Institute Report 9802/A. Rotterdam: Economet-ric Institute.
King, Robert, and Ross Levine. 1994. Capital Fundamentalism, Economic Development, andEconomic Growth. Policy Research Working Paper No. 1285. Washington, DC: World Bank.
Knight, John. 2007. China, South Africa and the Lewis model. World Institute for DevelopmentEconomic Research Research Paper No 2007/82. Helsinki: UNU-WIDER.
Knight, John, Quheng Deng, and Shi Li. 2010. The Puzzle of Migrant Labor Shortage and RuralLabor Surplus in China. Department of Economics Discussion Paper Series No. 494. Oxford:Oxford University.
Kuijs, Louis, and Tao Wang. 2005. China’s Pattern of Growth: Moving to Sustainability and Re-ducing Inequality. World Bank Policy Research Working Paper No. 3767. Washington DC:World Bank.
Kwan, Fung. 2009. Agricultural Labour and the Incidence of Surplus Labour: Experience fromChina during Reform. Journal of Chinese Economic and Business Studies 7(3):79–94.
Kwiatkowski, Denis, Peter Phillips, Peter Schmidt, and Yongcheol Shin. 1992. Testing theNull Hypothesis of Stationarity against the Alternative of a Unit Root. Journal of Econometrics54(1–3):159–178.
Lewis, W. Arthur. 1954. Economic Development with Unlimited Supplies of Labor. The Man-chester School 22(2):139–191.
Lewis, W. Arthur. 1979. The Dual Economy Revisited. The Manchester School 47(3):211–229.
Lin, Justin, Fang Cai, and Zhou Li. 1994. China’s Economic Reforms: Pointers for Other Econ-omies in Transition. Policy Research Working Paper No. 1310. Washington, DC: World Bank.
Meng, Xin, and Nansheng Bai.2007. How Much Have the Wages of Unskilled Workers inChina Increased? Data from Seven Factories in Guangdong. In: China: Linking Markets forGrowth, edited by Ligang Song and Ross Garnaut, pp. 151–175. Canberra: Asian Paciªc Press.
Minami, Ryoshin. 1968. The Turning Point in the Japanese Economy. Quarterly Journal of Eco-nomics 82 (3):380–402.
Minami, Ryoshin, and Xinxin Ma. 2010. The Lewis Turning Point of Chinese Economy: Com-parison with Japanese Experience. China Economic Journal 3(2):163–179.
Ministry of Labor and Social Security of China. 2009. 2009 Human Resources and SocialSecurity Statistical Report. Available at http://w1.mohrss.gov.cn/gb/zwxx/2010-05/21/content_382330.htm.
National Statistical Bureau of China. 2001, 2003, 2004, 2009. The Chinese Statistical Yearbook.Beijing: PRC.
Naughton, Barry. 1995. Growing Out of the Plan: Chinese Economic Reform, 1978–1993. Cam-bridge: Cambridge University Press.
27 Asian Economic Papers
An Empirical Analysis of China’s Dualistic Economic Development: 1965–2009
Newey, Whitney, and Kenneth West. 1994. Automatic lag selection in covariance matrix esti-mation. Review of Economic Studies 61(4):631–653.
Nolan, Peter, and Robert Ash. 1995. China’s Economy on the Eve of Reform. The China Quar-terly 144(special issue):980–998.
Ohkawa, Kazushi. 1965. Agriculture and Turning Points in Economic Growth. The DevelopingEconomies 3(4):471–486.
Park, Albert, Fang Cai, and Yang Du. 2010. Can China Meet Her Employment Challenges? InGrowing Pains: Tensions and Opportunities in China’s Transformation, edited by Jean Oi, ScottRozelle, and Xuegang Zhou, pp. 27–55. Stanford, CA: Stanford Asia-Paciªc Research Center.
Prais, Sigbert, and Christopher Winsten. 1954. Trend Estimators and Serial Correlation. CowlesCommission Discussion Paper No. 383. Available at http://cowles.econ.yale.edu/P/ccdp/st/s-0383.pdf.
Putterman, Louis. 1992. Dualism and Reform in China. Economic Development and CulturalChange 40(3):467–493.
Ranis, Gustav, and John Fei. 1961. A Theory of Economic Development. American Economic Re-view 51(4):533–565.
Rostow, Walt. 1956. The Take-off into Self-Sustaining Growth. Economic Journal 66(261):25–48.
Sachs, Jeffrey D., and Wing Thye Woo. 1994. Structural Factors in the Economic Reforms ofChina, East Europe and the Former Soviet Union. Economic Policy 18(1):102–145.
Sachs, Jeffrey D., and Wing Thye Woo. 2000. Understanding China’s Economic Performance.Journal of Policy Reform 4(1):1–50.
United Nations. 1970. Methods of Measuring Internal Migration. New York: United Nations.
Wang, Dewen.W. 2008. Lewisian Turning Point: Chinese Experience [Chinese]. In Reports onChinese Population and Growth No. 9: Linking up Lewis and Kuznets Turning Points, edited by CaiFang, pp. 88–103. Beijing: Social Sciences Academic Press.
White, Halbert. 1984. A Heteroscedasticity Consistent Covariance Matrix Estimator and a Di-rect Test of Heteroscedasticity. Econometrica 48(4):817–838.
Woo, Wing Thye. 1998. Chinese Economic Growth: Sources and Prospects. In The Chinese Econ-omy, edited by Michel Fouquin and Francoise Lemoine, pp. 17–48. London: Economica.
World Bank. 1996. The Chinese Economy: Controlling Inºation, Deepening Reform. Washington,DC: World Bank.
World Bank. 2010. World Development Indicators. Washington, DC: World Bank.
Wu, Xiaoying. 1994. Rural to Urban Migration in the People’s Republic of China. The ChinaQuarterly 139:669–698.
Yao, Yang. 2011. The Relationship between China’s Export-led Growth and Its Double Transi-tion of Demographic Change and Industrialization. Asian Economic Papers 10 (2):52–76.
Yao, Yang, and Ke Zhang. 2010. Has China Passed the Lewis Turning Point? A Structural Esti-mation Based on Provincial Data. China Economic Journal 3(2):155–162.
28 Asian Economic Papers
An Empirical Analysis of China’s Dualistic Economic Development: 1965–2009
Zhang, Kevin, and Shunfeng Song. 2003. Rural-Urban Migration and Urbanization in China:Evidence from Time-Series and Cross-Section Analyses. China Economic Review 14(4):386–400.
Zhao, Yaohui. 2000. Rural to Urban Labor Migration in China: the Past and the Present. In Ru-ral Labor Flows in China, edited by Loraine West and Yaohui Zhao, pp. 15–33. Berkeley, CA: In-stitute of East Asian Studies, University of California.
29 Asian Economic Papers
An Empirical Analysis of China’s Dualistic Economic Development: 1965–2009