An Empirical Examination of Global Software Piracy: Implications for Pricing and Policy Ramnath K. Chellappa [email protected]Yuanyuan Chen [email protected]Sriram Venkataraman [email protected]Goizueta Business School, Emory University, Atlanta GA 30322 Abstract The impact of global piracy on the US software industry has largely been understood through analysis of data from Business Software Alliance, a trade group representing the world's largest software makers. While the impact of cultural and legal factors on global piracy has been individually examined by prior research, we present a theory-based structural two-stage piracy model that not only includes these extant covariates but also the role of uniform global pricing hitherto adopted by most domestic software firms. Through an empirical analysis of piracy data from 1994-2002 covering all major continents, we compare our structural model of two-stage piracy that separates preventive factors (first stage) from deterring ones (second stage), with extant reduced-form OLS estimates. Several interesting findings result; first, we demonstrate that the two-stage utility-theory based model (which suggests that some consumers buy outright while some others first pirate and turn buyers) is superior to single-stage or other reduced-form models in explaining piracy. Second, we observe that the relative impact of moral and legal costs on prevention and deterrence are distinctly different warranting a closer look at pricing. Third, we do observe a distinct increase in the baseline utility and value for software post-piracy suggesting externality benefits. And finally we observe that price discounts may play a bigger role in deterring piracy (in the second stage) but may not play a significant role in preventing people from engaging in this activity. We then suggest that software firms should eschew global pricing and derive an optimal pricing menu for current country-specific conditions while underscoring the importance of enforcement actions in mitigating piracy. Keywords: piracy, digital goods, price discrimination, public policy 1. Introduction “For almost fifteen years, the software industry has battled against software theft, recognizing that widespread piracy threatens the very existence of our industry. Despite these efforts, software piracy remains a serious problem throughout the world, accounting for one-
Transcript
An Empirical Examination of Global Software Piracy: Implications for Pricing and Policy
Goizueta Business School, Emory University, Atlanta GA 30322
Abstract
The impact of global piracy on the US software industry has largely been understood through
analysis of data from Business Software Alliance, a trade group representing the world's largest
software makers. While the impact of cultural and legal factors on global piracy has been
individually examined by prior research, we present a theory-based structural two-stage piracy
model that not only includes these extant covariates but also the role of uniform global pricing
hitherto adopted by most domestic software firms. Through an empirical analysis of piracy data
from 1994-2002 covering all major continents, we compare our structural model of two-stage
piracy that separates preventive factors (first stage) from deterring ones (second stage), with
extant reduced-form OLS estimates. Several interesting findings result; first, we demonstrate
that the two-stage utility-theory based model (which suggests that some consumers buy outright
while some others first pirate and turn buyers) is superior to single-stage or other reduced-form
models in explaining piracy. Second, we observe that the relative impact of moral and legal
costs on prevention and deterrence are distinctly different warranting a closer look at pricing.
Third, we do observe a distinct increase in the baseline utility and value for software post-piracy
suggesting externality benefits. And finally we observe that price discounts may play a bigger
role in deterring piracy (in the second stage) but may not play a significant role in preventing
people from engaging in this activity. We then suggest that software firms should eschew global
pricing and derive an optimal pricing menu for current country-specific conditions while
underscoring the importance of enforcement actions in mitigating piracy.
Keywords: piracy, digital goods, price discrimination, public policy
1. Introduction
“For almost fifteen years, the software industry has battled against software theft, recognizing that widespread piracy threatens the very existence of our industry. Despite these efforts, software piracy remains a serious problem throughout the world, accounting for one-
2
quarter of the software used in the United States, and 40 percent of the software used worldwide. In parts of Asia and the former Soviet Republic, piracy rates approach 90 percent, virtually eliminating sales of legitimate software.”
Source: Testimony of Richard C. LaMagna, Senior Manager, Worldwide Anti-Piracy Investigations, Microsoft Corporation, before the House Subcommittee on Courts, The Internet, and Intellectual Property on March 13, 2003.
While the US software industry claims that global piracy is a cause for significant concern,
popular belief in some quarters suggest that piracy may even be beneficial (Haruvy, et al. 2004).
This belief hinges on the potential externality benefits of piracy, where it is argued that some
consumers pirate and get to know more about the product, thus eventually becoming buyers of
legitimate copies. While there is no clear empirical evidence to support or deny this claim,
industry groups have consistently asserted that upwards of 43 percent of all installed packaged
software worldwide is pirated leading to losses to the tune of $50 billion for the US software
industry. According to the Seventh Annual Business Software Alliance (BSA) and IDC Global
Software study on global piracy, in 2009 for every one hundred dollars worth of PC software
purchased legitimately, seventy five dollar’s worth was obtained illegally. In its effort to monitor
and prevent piracy, the BSA and its various international affiliates keep track of piracy levels
and monetary losses of software firms across the globe. While domestically BSA has pursued
legal action against pirates through active enforcement of the Digital Millennium Copyright Act
(DMCA), managing or even understanding the factors associated with global piracy is more
complex given the country-specific variance in legal situations, ethical attitudes toward piracy
and affordability of the consumer base. Thus, a rigorous examination of these factors and their
impact on global sales and piracy is of importance to both vendors and regulators alike.
In examining piracy, it is important to keep in mind that it is not an isolated trait where
consumers are necessarily pre-disposed toward pirating or buying; and neither is it truly costless
to the consumer. Theory suggests that consumers trade off purchase (where costs are price-
3
based) and piracy (where costs may be non-monetary like legal and/or moral costs) decisions.
Understanding and calibrating how consumers make these complex tradeoffs is central to
formulate effective public policies on piracy and managers’ pricing decisions. While empirical
studies on global piracy has identified a number of covariates e.g., a country’s wealth (Gopal
and Sanders 2000, Shin, et al. 2004), cultural aspects such as individualism/collectivism (Husted
2000, Marron and Steel 2000, Moores and Dhaliwal 2004), and some law-related elements, such
as membership and duration of membership in international intellectual property treaties (e.g.,
World Intellectual Property (WIPO), World Trade Organization (WTO), Universal Copyright
Convention) (Burke 1996, Papadopoulos 2003), we identify three significant shortcomings that
we address in our research using the publicly available global piracy data from BSA.
First, previous studies do not necessarily consider legal and cultural factors
simultaneously when examining country-specific piracy either for reasons of limited interest or
due to potentially high correlation amongst explanatory factors. Moreover, the estimations are
typically reduced-form or Ordinary Least Squares (OLS) models that suffer from endogeneity
problems that the same unobservable can affect both the explanatory and dependent variables.
For example, rich countries may have both strong legal protection for private properties and low
piracy rates. Extant research in econometrics shows that R-square can become spurious when
endogeneity problems are ignored (Berry, et al. 1995). Therefore, we use a structural model to
eliminate these problems.
Second, price has been consistently identified as an important determinant of piracy by
both analytical models (Chellappa and Shivendu 2003, Conner and Rumelt 1991, Sundararajan
2004) and survey-based research (Cheng, et al. 1997). However, empirical models of software
piracy based on secondary data have ignored the global pricing strategy of software firms, a
strategy that has drawn some flak from both academics and the trade press. Extant research
4
(Gopal and Sanders 1998) on piracy opines that “The key problem is that prices are set at the
U.S. levels, which are significantly higher than individuals in most countries can afford.” Trade
press reports (Crampton 2005) observed that while hardware prices varied across countries,
software prices were the same “… like oil and coal, however, most major software programs sell
for a global price, ” and many governmental and non-governmental agencies also find it
“appropriate to use the US price index for pre-packaged software adjusted by changes in
exchange rates” (Lequiller, et al. 2003, p.49).
Third, while it has been suggested that there are externalities associated with piracy, i.e.,
past pirates may be influenced to buy and that piracy costs are suffered in two stages, extant
empirical research does not accommodate the influence of piracy on future purchases. In this
regard, a key contribution of our research is to address these gaps as evinced by the above three
characteristics of extant empirical research on piracy.
From a pricing point of view, while it is not surprising that intellectual property rights
(IPR) firms act like monopolists since they are often the sole owners of a good (Philips 1998),
piracy has the same impact of a competitor albeit illegitimate. Some IPR industries recognized
this early on, e.g. to combat intellectual property (IP) violation through photocopying, some
book publishers have engaged in price discrimination and/or offer lower print quality versions
(e.g., Eastern Economy Edition from Prentice Hall) of its products in countries with higher rates
of IP violation. While there have been some recent reports of software vendors like Microsoft
reconsidering their global pricing strategy in China and Brazil (Zhu 2008), there is little formal
analysis on optimal country-specific prices. Another important goal of our research is to
empirically determine optimal country-specific prices taking into account the prevalent piracy-
related factors.
5
For our investigation we construct our dataset from BSA’s piracy data and many other
public sources for 53 countries over a period of 9 years (from 1994-2002). We first develop the
econometric specification of the two-stage piracy model of Chellappa and Shivendu (2005)
through a nested decision tree wherein some consumers make the decision to buy right away
while others decide to buy after pirating. Note this structure also recognizes that the piracy
costs may possibly have two roles: in the first stage they can prevent people from engaging in
piracy at all, while in the second stage they can deter pirates from holding on to their pirated
version. After recovering the coefficient estimates, we are able to derive country-specific
optimal pricing recommendations that accounts for the prevalent institutional and cultural
environment.
The rest of the paper is organized as follows. In the second section, we derive the
structural model of two-stage piracy behavior, followed by the empirical operationalization of
the model as a nested discrete choice model. In the third section, we describe the data collection
procedure, empirical analysis and results. We conclude the paper with a discussion of
implications for global policy makers and software vendors, as well as directions for future work.
2. Structural model of two-stage piracy behavior
Analytical models of piracy are unconstrained by data requirements and have had the luxury of
studying the problem at a granular level, i.e. through a consumer’s utility function. Hence,
these models have been able to truly capture the utilitarian nature of a consumer’s tradeoff
between buying and pirating. First, these models show that any impact of moral and legal costs
is bounded by price, i.e., they are important only to the extent that the combined costs are less
than the price of the software itself (Chellappa and Shivendu 2003, Conner and Rumelt 1991).
Second, these models have shown that piracy is not a single-stage decision. Rather, consistent
with theories of experience goods consumption, some consumers may initially pirate to
6
experience the good and update their value perception of the product; post-sampling some of the
pirates may turn buyers (Chellappa and Shivendu 2005, Givon, et al. 1995). This suggests that
any externality benefits, if present, will manifest themselves in the second stage. While these
theory models provide rich insights into the underlying piracy behavior, it is empirical work on
global piracy that has identified several market-level factors influencing piracy, e.g. cultural and
legal factors (Gopal and Sanders 2000, Marron and Steel 2000). So far, there has been no
research (that we are aware of) that has reconciled the approaches of the two research streams.
In this section we begin by presenting the conceptual setup before deriving an empirically
testable model.
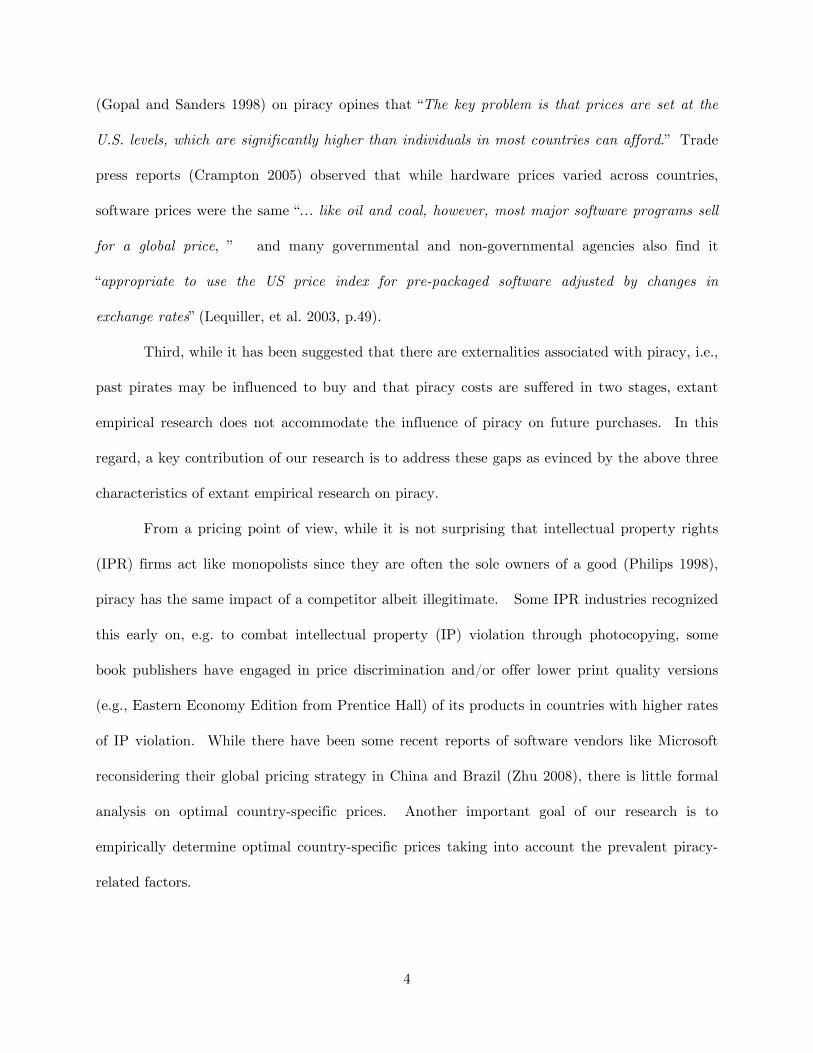
2.1. Theoretical model
Our objective in this section is to provide a simple conceptual set-up that summarizes
the two primary approaches to modeling consumers’ decision to buy or pirate a good. We pose
this in the context of the global piracy problem that we are interested in. Consider a
representative consumer for each country such that the consumers are defined by some value v
for a software good such that this value is heterogeneous across countries where ( ).v K∼ .
Similarly, the representative consumer in different countries suffer different moral ( )m and legal
( )l costs, where the respective distributions are given by ( ).m G∼ and ( ).l H∼ . If the price of
the good is given by p , we can write the utility from buying as bu v p= − and that from
pirating as ( )pu v m l= − + . In a model where consumers make the decision between pirating
and buying in one go (henceforth referred to as the single-stage model), he will buy a product if
and only if 0bu ≥ (individual rationality (IR) constraint) and b pu u≥ (incentive compatibility
(IC) constraint). The latter constraint implies that consumers will pirate if p m l> + . Thus
for a market of N consumers, we can write the demand in the presence of piracy for the single-
7
stage model as ( ) ( )( ) ( )( )1 | , , 1 1d p v m l N K p R p= − − where ( ).R is the joint distribution of
( ).G and ( ).H .
However, in the two-stage model introduced by Chellappa and Shivendu (2005),
consumers do not fully incur the piracy costs in the first stage itself. Rather, since there is
always the possibility of buying in the second stage, only those that keep a pirated copy incur
the full costs of piracy. Let δ be the transient parameter such that the consumer who pirates
in the first stage incurs only a portion of the piracy costs ( )m lδ + , and suffers the rest
( )( )1 m lδ− + only if he decides to keep the pirated product. Furthermore, the pirates have
now updated their value of the product from v to ( )ˆ ˆ| ~ .v v J , where ( )ˆ ˆv v v v> < if the product
was initially underestimated (overestimated). The pirates would, therefore, now reevaluate their
piracy decision with the new value. Thus in the first stage, consumers will buy if and only if
v p> and ( )p
p m l m lδδ
< + ⇒ < + and in the second stage the pirates will buy if and only if
v̂ p> and ( )1 ( )1
pp m l m lδ
δ< − + ⇒ < +
−.
We can, therefore, write the demand in the first stage as
We will now proceed to discuss our data and the estimation procedure, followed by a
discussion of our empirical findings.
3. Data and analyses
Our annual time-series data span nine years (1994-2002), and cover all the major continents.
Akin to the BSA Global Software Piracy Study1, representative countries from each continent
are randomly sampled such that every region of piracy is represented. The resulting sample
consists of 460 observations spanning 53 countries. To the best of our knowledge, the BSA
statistics are the most reliable and granular global piracy numbers available to date. A recent
work (Png 2010) suggests that this piracy data may have biases; first, pre- and post- 2003 data
collection follow slightly different methods (potentially inflating piracy numbers by up to 4%
points) and second, the methods employed by BSA might actually be measuring legitimate
demand in a correct fashion rather than piracy rates. Prior researchers (Husted 2000, Marron
and Steel 2000) have also raised potential concerns about this data but have dismissed it
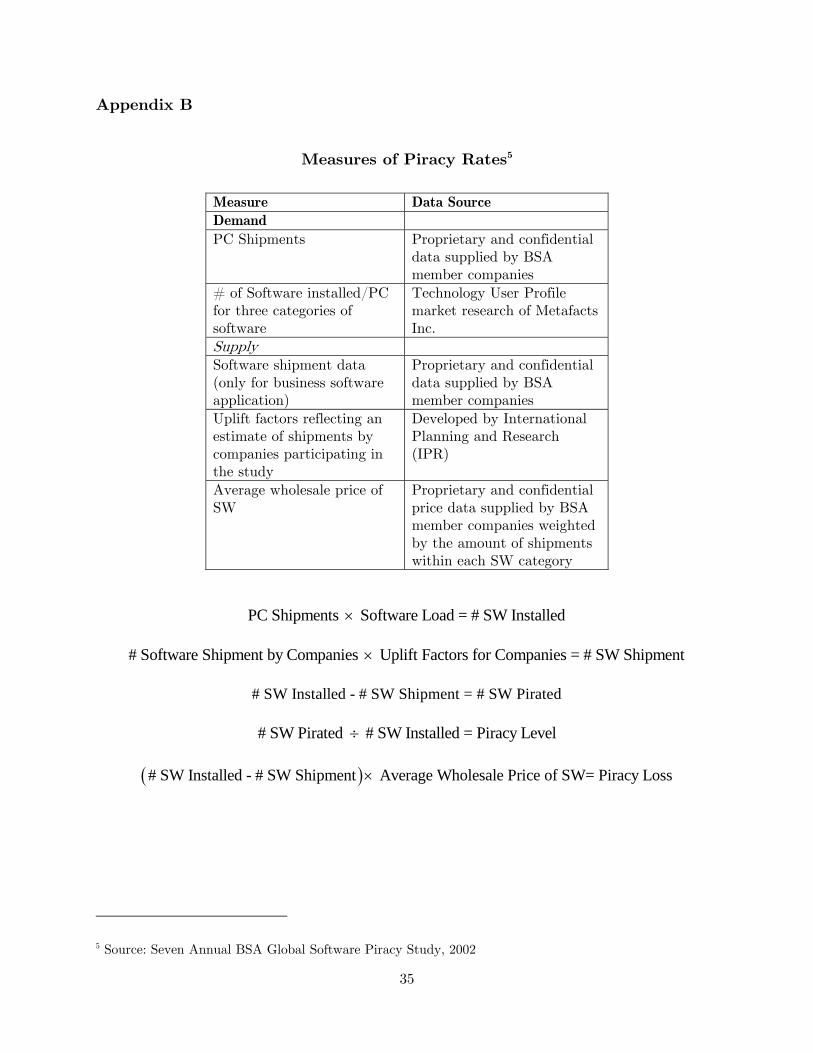
1 The BSA software piracy study lists 80 countries and seven regions, while the Hofstede sample consists of 50 countries and five regions, with 53 countries in common. http://www.bsa.org/globalstudy. Appendix B summarizes the methodology and process that are used to measure piracy rates by BSA. Note that this data does not differentiate between users pirating themselves and buying from counterfeiters for a low price and includes both forms of piracy.
13
themselves after further analysis. We choose to be conservative and following Png’s (2010)
main recommendations we restrict our data analysis to 1994-2002 and in our main estimation
equation the dependent variable is legitimate sales rather than piracy.
3.1. Price and v measures
For each country, piracy levels and corresponding monetary-loss data are acquired from
public and private BSA reports. World Bank’s World Development Indicators Database is used
to generate a) number of personal computers in use for each country-year pair and b) country-
specific valuev . Global software prices are set to US levels (Gopal and Sanders 1998) and based
on the country-specific producer price index (PPI) for pre-packaged software (Buisson 2003).
As separate country-specific PPIs for pre-packaged software have not yet been developed, the
Organization for Economic Co-operation and Development (OECD) suggests, “as long as price
indices are not available, it might still be better to use the US Producer Price Index (PPI)
adjusted by the relative inflation rate between a country and US preferably PPI for a country
vis-à-vis PPI for US…” (Lequiller, et al. 2003, p.50). The US PPI for pre-packaged software is
obtained from the reported by the U.S. Department of Labor. The PPI tracks average prices of
domestically produced and consumed commodities. These are derived from the value of
shipments of products as reported by producers for the economic census2. The Department of
Labor reports PPI from 1997-2003. In order to adjust for price trending, we use data belonging
to 1997 as the baseline data to derive our PPI index for years’ 1994-1996. For example, PPI of
Year 1994 is derived from 19941994 1997
1997
*Sales
PPI PPISales
= . We then adjusted US PPI by the
2Appendix C demonstrates how the Producer Pricing Index is created by the U.S. Department of Labor. Detailed information about Producer Price Index is available on the Department of Labor website: http://www.bls.gov/ppi
14
relative inflation rate for countries other than US. This price also differs year-to-year, as
software firms generally do revise prices each year (Philips 1998).
3.2. Measures of moral ( )m and legal ( )l costs
Literature models moral and legal costs as non-monetary price-equivalent costs faced by
a consumer during his decision to pirate (Chellappa and Shivendu 2003). While moral costs or
ethical propensity to pirate are suggested to be driven by the cultural background of a consumer
(Gopal and Sanders 1998), legal costs or legal ramifications of pirating are suggested to be a
result of institutional factors (Bagchi, et al. 2006). Prior literature3 finds that some of the
cultural indicator developed by Hofstede (1997) are highly influential in determining piracy
(Gupta, et al. 2004, Husted 2000, Marron and Steel 2000, Shin, et al. 2004). It is suggested that
consumers vary in their natural predisposition toward committing an immoral activity such as
piracy depending upon the cultural background they come from. Hofstede (1997) suggests that
there are four indicators that capture cultural differences across the globe -- namely power
distance (PDI), collectivism (COL), masculinity (MAS), and uncertainty avoidance (UAI). Of
these factors, Gopal and Sanders (2000) provide empirical support for collectivistic societies not
valuing individuals’ property rights and hence engaging in higher levels of piracy. Marron and
Steel (2000), also find statistically significant correlation between collectivism and piracy level.
While there is no empirical support that links MAS and UAI to piracy, Husted (2000) suggests
that piracy is not only related to collectivism (COL) but also to power distance (PDI). Thus in
our study we use both these country-specific constructs as measures of moral cost.
Piracy research also suggests that a second component of piracy costs arises from a
consumers’ expectation of getting caught and the punitive damage he might suffer in that case
3 Please see online appendix for a summary of all empirical and analytical literature on all types of piracy.
15
(Chellappa and Shivendu 2003, Globerman 1988). Extant empirical work on global piracy
suggests that drivers of legal barriers to piracy stem from a country’s institutional infrastructure
(Andrés 2006, Van Kranenburg and Hogenbirk 2005). Some have constructed indices that
specifically examine aspects of legal protection of patent rights, coverage, and participation in
international patent agreements (Burke 1996, Park and Ginarte 1997) while other investigate
the provisions for loss protection (Van Kranenburg and Hogenbirk 2005). A shortcoming of
using these measures alone is that while they capture punitive aspects of protection (through
laws) if caught, they do not address the reality of a country’s actual enforcement of these laws,
which would influence a consumer’s expectation of getting caught (Andrés 2006, Samuelson
1999). Independently however, some literature (Ronkainen and Guerrero-Cusumano 2001) has
used the Corruption Perceptions Index (compiled annually by Transparency International) as a
proxy measure of the law enforcement of IPR. Given that both the laws relating to IPR and
their enforcement are relevant to consumers’ attitudes toward piracy, it is critical to include a
measure of both in identifying a consumer’s legal cost of pirating (Ostergard 2000, Samuelson
1999). Thus, we use both corruption control and effective of legal legislation related indices as
measures of legal cost of pirating.
These measures are available from the World Bank4 as collected from multiple sources
where the Rule of Law Index and Control of Corruption Index are from governance research.
World Bank releases reports on the aggregate governance research indicators bi-annually from
1996 to 2002. First, the Rule of Law Index is a composite measure and includes several
indicators, including perceptions of the incidence of crime, the effectiveness and predictability of
the judiciary and the enforceability of contracts. It is a proxy for the extent to which agents
4 www.worldbank.org/wbi/governance/govdata/
16
have confidence in and abide by the rule of society, and is understood to be indicative of the
success of a society in developing an environment in which fair and predictable rules form the
basis for economic and social interactions and the extent to which property rights are protected
(Cass 2003). The other indicator, Control of Corruption Index, measures perceptions of
corruption and represents control of governance failure. It also assesses the likelihood that
private property will be expropriated and analyzes the independence of the judiciary, the
existence of corruption within the judiciary and the ability of individuals and businesses to
enforce contracts. It represents the degree to which a country’s laws protect private property
rights and the degree to which its government enforces those laws.
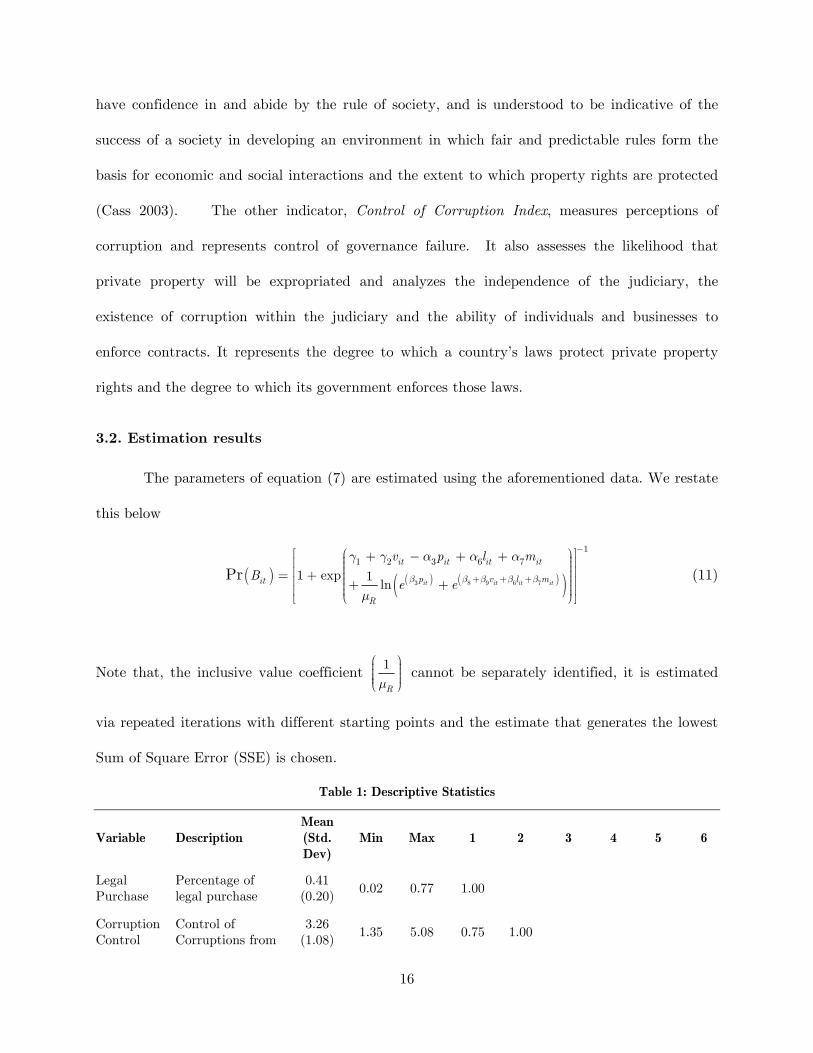
3.2. Estimation results
The parameters of equation (7) are estimated using the aforementioned data. We restate
⎛ ⎞⎟⎜ ⎟⎜ ⎟⎜ ⎟⎜⎝ ⎠ cannot be separately identified, it is estimated
via repeated iterations with different starting points and the estimate that generates the lowest
Sum of Square Error (SSE) is chosen.
Table 1: Descriptive Statistics
Variable Description Mean(Std. Dev)
Min Max 1 2 3 4 5 6
Legal Purchase
Percentage of legal purchase
0.41 (0.20) 0.02 0.77 1.00
Corruption Control
Control of Corruptions from
3.26 (1.08) 1.35 5.08 0.75 1.00
17
Index Governance Index
Rule of Law Rule of law index
3.29 (0.96) 1.44 4.86 0.72 0.96 1.00
PDI Power distance index
57.26 (22.39) 11.00 104.00 -0.62 -0.71 -0.68 1.00
COL Collectivism 54.38
(25.23) 9.00 94.00 -0.71 -0.73 -0.74 0.67 1.00
Price
Producer price index from Bureau of Labor adjusted by inflation rate
107.74 (24.52)
54.63 163.83 -0.26 0.00 0.06 0.00 -0.01 1.00
Value
Country's total software market revenue divided by its number of personal computers in use
94.08 (57.93)
6.82 460.26 -0.20 -0.08 -0.05 0.06 0.02 0.41
N=460 (excluding 17 observations with missing values)
3.3. Discussion of results
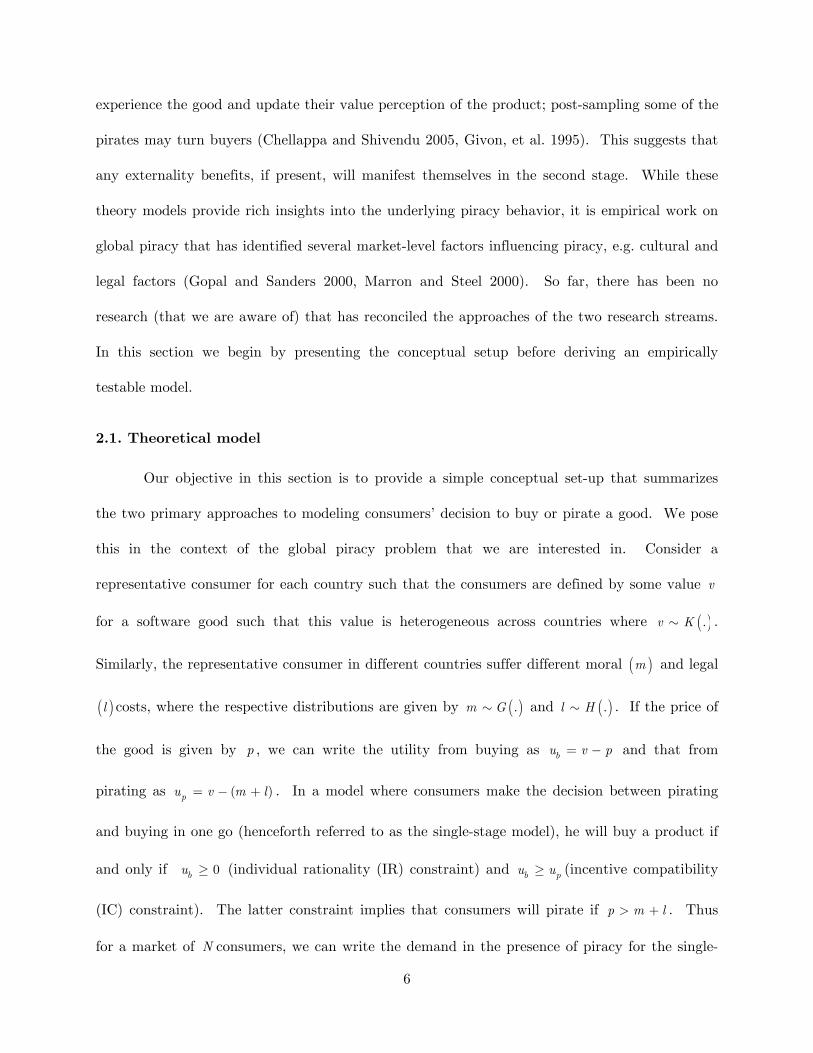
We estimate one reduced-form model (Model 1) and two structural demand models
(Models 2-3). Recall that the central objective of reduced-form analysis is to either describe or
forecast actions of economic agents (consumers and/or firms) using marketplace data. Here we
fit a statistical/econometric model involving selected variables without developing an underlying
theoretical model that guides associations between the variables included in the model. By
imposing less structure this approach potentially affords us improved forecastability (Erdem, et
al. 2007). However, reduced-form or OLS analysis may be limited in their usefulness to assess
impact of big policy changes (like new pricing scheme, increased legal/moral costs) using
existing data. First, statistical inference in reduced-form analysis relies on fitting the conditional
distribution amongst variables. Hence predicting the impact of a policy change in variables that
are ‘too far’ from what is observed in the data used for inference can generate very erroneous
18
predictions. Second, if the policy change itself results in change in decision rule employed by
agents whose behavior is being modeled, that too can result in inaccurate predictions.
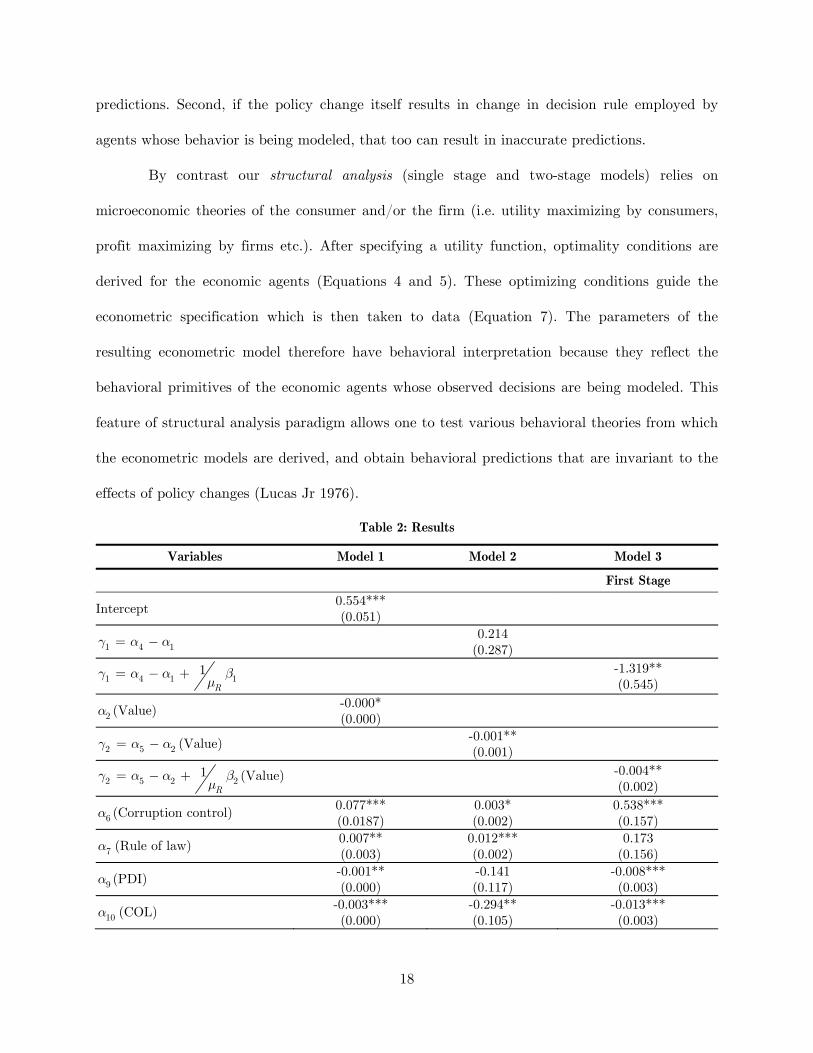
By contrast our structural analysis (single stage and two-stage models) relies on
microeconomic theories of the consumer and/or the firm (i.e. utility maximizing by consumers,
profit maximizing by firms etc.). After specifying a utility function, optimality conditions are
derived for the economic agents (Equations 4 and 5). These optimizing conditions guide the
econometric specification which is then taken to data (Equation 7). The parameters of the
resulting econometric model therefore have behavioral interpretation because they reflect the
behavioral primitives of the economic agents whose observed decisions are being modeled. This
feature of structural analysis paradigm allows one to test various behavioral theories from which
the econometric models are derived, and obtain behavioral predictions that are invariant to the
effects of policy changes (Lucas Jr 1976).
Table 2: Results
Variables Model 1 Model 2 Model 3
First Stage
Intercept 0.554*** (0.051)
1 4 1γ α α= − 0.214 (0.287)
1 4 1 11R
γ α α βμ
= − + -1.319** (0.545)
2α (Value) -0.000* (0.000)
2 5 2γ α α= − (Value) -0.001** (0.001)
2 5 2 21R
γ α α βμ
= − + (Value) -0.004** (0.002)
6α (Corruption control) 0.077*** (0.0187)
0.003* (0.002)
0.538*** (0.157)
7α (Rule of law) 0.007** (0.003)
0.012*** (0.002)
0.173 (0.156)
9α (PDI) -0.001** (0.000)
-0.141 (0.117)
-0.008*** (0.003)
10α (COL) -0.003*** (0.000)
-0.294** (0.105)
-0.013*** (0.003)
19
3α (Price) -0.002*** (0.000)
-0.011*** (0.001)
-0.004* (0.002)
Second Stage
8 4 1β β β= − 13.116* (7.223)
9 5 2β β β= − (Value) 0.076*** (0.018)
6β (Corruption control) 5.343** (2.434)
7β (Rule of law) 5.302** (2.545)
10β (PDI) -0.005 (0.040)
11β (COL) -0.078** (0.039)
3β (Price) -0.136*** (0.032)
1Rμ
0.1
n 460 460 460
Adj. 2R 0.70 0.64 0.72
likelihood ratio test 59.98 61.73
Note: *** p<0.01, ** p<0.05, * p<0.10. Standard errors in parentheses Time dummies are not significant, therefore not reported here
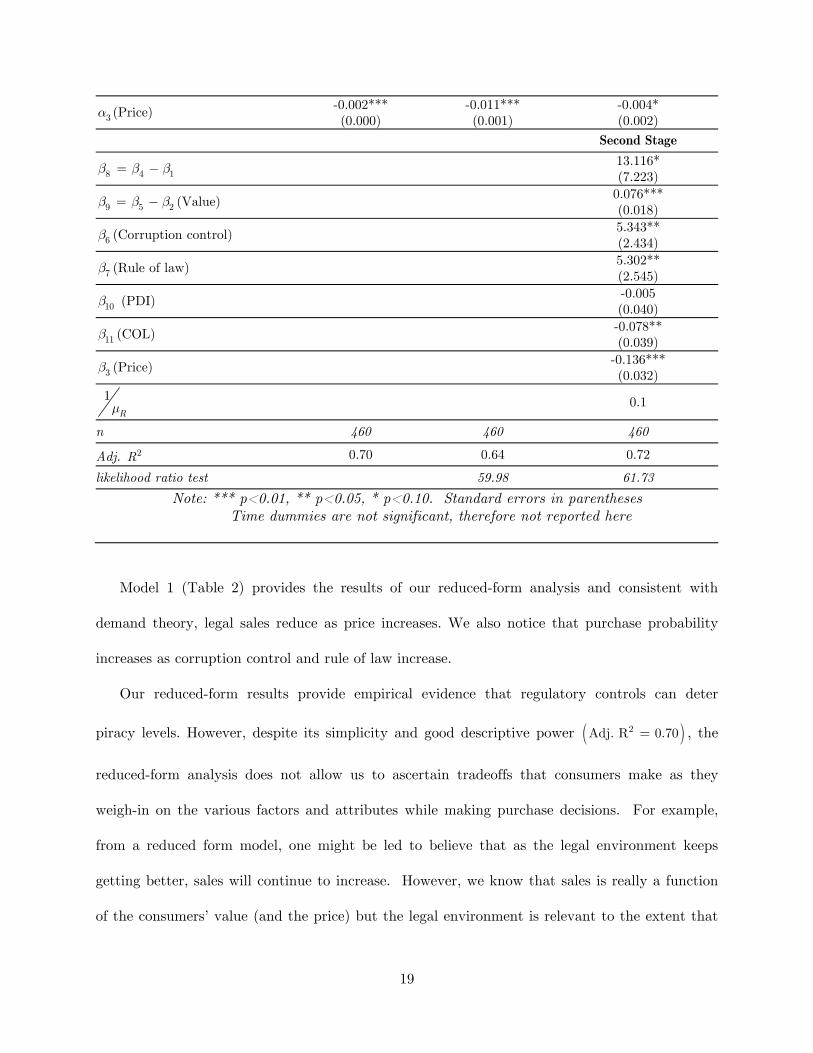
Model 1 (Table 2) provides the results of our reduced-form analysis and consistent with
demand theory, legal sales reduce as price increases. We also notice that purchase probability
increases as corruption control and rule of law increase.
Our reduced-form results provide empirical evidence that regulatory controls can deter
piracy levels. However, despite its simplicity and good descriptive power ( )2Adj. R 0.70= , the
reduced-form analysis does not allow us to ascertain tradeoffs that consumers make as they
weigh-in on the various factors and attributes while making purchase decisions. For example,
from a reduced form model, one might be led to believe that as the legal environment keeps
getting better, sales will continue to increase. However, we know that sales is really a function
of the consumers’ value (and the price) but the legal environment is relevant to the extent that
20
it acts as a counter to the pirating option. To assess these tradeoffs that consumers make, we
have to rely on estimating the structural models detailed in the previous section.
The single stage model (Model 2) is a demand model where piracy is constrained to occur in
one stage, i.e. consumers purchase or pirate. Unlike in Model 3, there are no externality benefits
in that there is no allowance for pirates to turn into buyers once they have updated their fit.
While structural models should only be compared using the likelihood-ratio tests, we also
manually computed the adjusted R-squared for all the models. We can see that Model 3
outperforms all other models in both model statistics. While we report the results for all models
in Table 2, for parsimony we limit the discussion of our analysis to our results for Model 3
alone.
First note that we are not able to individually identify some of the coefficients ( 1,2,4,5α and
1,2,4,5β ) of the original utility model, rather we only estimate 1γ and 2γ which are some
aggregate measure of the consumers’ baseline utilities and value for software in the two stages.
The simple reason for this is that we do not have granular data on the intermediate step; this
should also give pause to the reader who might be concerned about over-identification given
that we only have data at the aggregate level. However, note that this does not detract us from
understanding the role played by the key independent variables (price, moral and legal cost) and
their relative importance in the two stages — which is the primary objective of this paper.
First note that prevalent legal environment or rule of law in terms of code of punishment
has little impact on the basic decision of a consumer to pirate ( 7α is not statistically significant)
but is an important factor in deterring consumers ( )7 5.302 * *β = from permanent use of the
pirated software. On the other hand note that legal enforcement or legislative effectiveness (as
measured by corruption control) plays an important role in both preventing consumers (first
stage 0.538***) from pirating and deterring (second stage 5.343**) them from permanent use of
21
pirated software. This simply means that the punishment component may not kick in until
users have decided to keep the pirated software while the prevailing enforcement levels of these
laws are always critical. Also note that the moral cost which is a function of the prevalent
ethical indices or culture of a country is generally significant as one expects from prior
literature. What might be interesting is the strong statistical significance at the prevention
stage implying that basic decision to use pirated goods is greatly influenced by the cultural
environment even if they appear to play a lesser role to legal costs in the eventual decision to
keep the pirated good.
Perhaps the most telling observation is with regards to the role of price. While the
coefficient for price is weakly significant (at 90% confidence) in the first stage, we can see it is
strongly significant (at 99% confidence) and of a higher magnitude in the second stage. The
negative sign means that with higher prices, sales will be lower. From a piracy point of view,
this can imply that price plays a relatively smaller role in consumers’ initial decision to engage
in piracy but can be a determining factor in their eventual decision to continue with the pirated
good. Finally note that even if unable to individually identify value-coefficients we find
positive and significant values for 8 4 1β β β= − and 9 5 2β β β= − ; this implies that consumers
who buy in the second stage have higher baseline utility and valuation for software , compared
to those who continue to hold on their pirated copy. This suggests that there are perhaps
potential benefits of piracy due to sampling the good in the first stage.
In sum, price and varying levels of regulatory controls across countries, warrant that
firms and policy makers work in concert while formulating their strategies. Failure to do so
limits firms’ ability to extract profits and public policy officials’ ability to control piracy. Also
note that while the data does not distinguish between pirating by the consumer himself and the
consumer buying a pirated copy, in the former case also the consumer incurs a monetary
22
equivalent opportunity cost due to search, technological know-how, etc. From an empirical
point of view the impact of the price coefficient would be considered overestimated, although we
have no data or extant evidence to distinguish between pirating oneself and buying from a
counterfeiter. However, this should not affect our two-stage model since even the consumer
buying a counterfeit copy is unlikely to be unaware of the fact that he is buying pirated
software. Not only is this copy likely to cost significantly less but he would also be warned that
he cannot register this software and use it to get updates and patches. Hence the moral and
legal costs remain.
4. Global Policy and Pricing Strategies
Our model and empirical estimates provide certain important insights into policy and
pricing strategies in a global context. In this section we shall first examine optimal global
pricing strategies that vendors should adopt, followed by a discussion on the implication of
preventive versus post-piracy punitive actions to thwart piracy.
4.1. Optimal global pricing strategies
“How much does a Big Mac cost in India versus in New York versus in Taipei, and how do you map a similar Big Mac index to software? It's a very difficult problem. We do know that we need to work with these governments so we do have software and the right offerings priced in a way that's relevant to them and their consumers and their constituencies.”
-- Martin Taylor, Microsoft's general manager of platform strategy
That price in itself is significant at both stages is not surprising, however, that still
leaves the vendor with the question of how to set optimal prices. For example, while ideally the
vendor would like to set two prices one for pirates and one for buyers (or prices differently at
the two levels), price itself is endogenous to the decision to buy/pirate. Further, it is practically
impossible to set two different prices for these two consumer segments. On the other hand, the
heterogeneities in the piracy cost indices make evident that it is prudent to develop a
23
discriminatory strategy of pricing. Increasingly firms have begun to recognize this, e.g.,
Microsoft has decided to deviate from its “one-rate policy” in dealing with certain countries
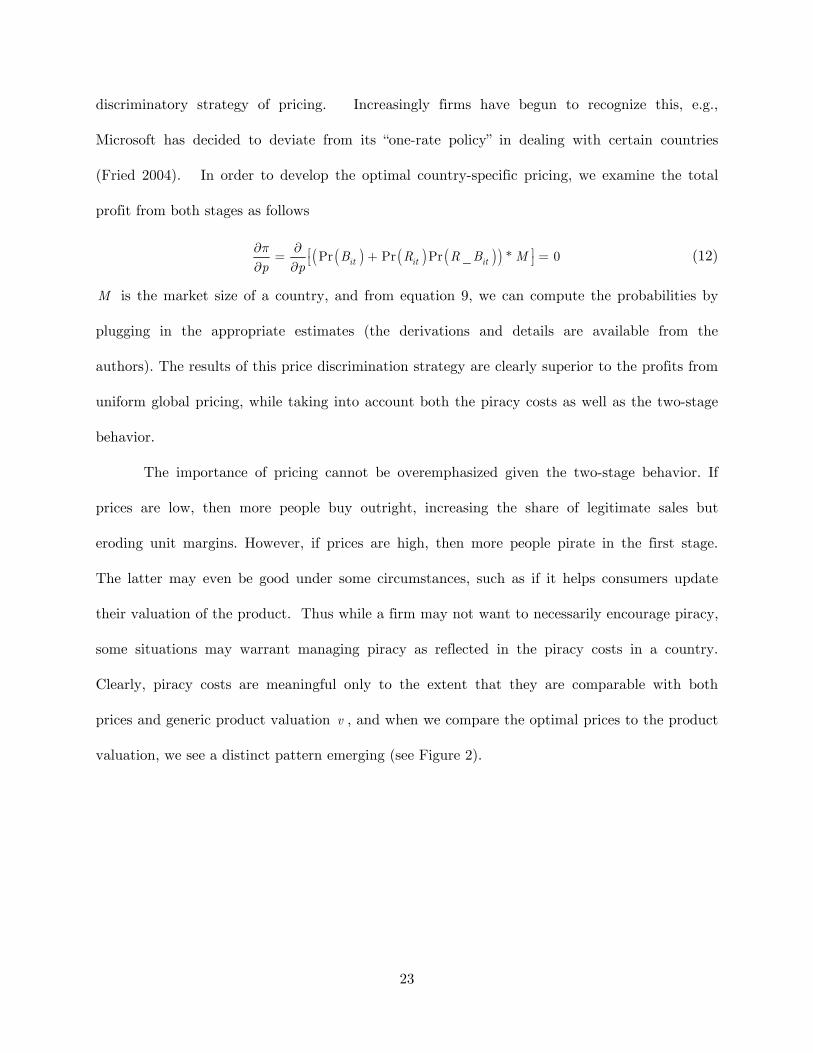
(Fried 2004). In order to develop the optimal country-specific pricing, we examine the total
profit from both stages as follows
( ) ( ) ( )( )Pr Pr Pr _ * 0it it itB R R B Mp p
π∂ ∂ ⎡ ⎤= + =⎣ ⎦∂ ∂ (12)
M is the market size of a country, and from equation 9, we can compute the probabilities by
plugging in the appropriate estimates (the derivations and details are available from the
authors). The results of this price discrimination strategy are clearly superior to the profits from
uniform global pricing, while taking into account both the piracy costs as well as the two-stage
behavior.
The importance of pricing cannot be overemphasized given the two-stage behavior. If
prices are low, then more people buy outright, increasing the share of legitimate sales but
eroding unit margins. However, if prices are high, then more people pirate in the first stage.
The latter may even be good under some circumstances, such as if it helps consumers update
their valuation of the product. Thus while a firm may not want to necessarily encourage piracy,
some situations may warrant managing piracy as reflected in the piracy costs in a country.
Clearly, piracy costs are meaningful only to the extent that they are comparable with both
prices and generic product valuation v , and when we compare the optimal prices to the product
valuation, we see a distinct pattern emerging (see Figure 2).
24
Figure 2: Optimal country-specific prices
We can observe that while product valuation and optimal prices are closer to each other
for countries with higher piracy costs, for those with lower piracy costs, the distance is larger.
The economic intuition behind this observation is particularly interesting for an industry where
firms have long been considered to be endowed with monopoly power. For all practical
purposes, IPR-based firms are monopolists in that they are often the sole owners of a product,
and the basic principle behind monopoly pricing is to extract all consumer surplus, i.e., prices
are close to product valuation. However, piracy acts like a competitor in this industry even if
the competing firm itself is not engaging in any sort of profit maximizing. This effectively
restricts prices to be { }min value,piracy-costsp = . From a firm’s point of view, our results
suggest that a trade-off matrix (Figure 3) between value and piracy costs can provide broad
recommendations for prices.
The broad implication for a software vendor is that under certain conditions, pricing
may have to be driven by piracy and enforcement situations, as monopoly strategy of zero
25
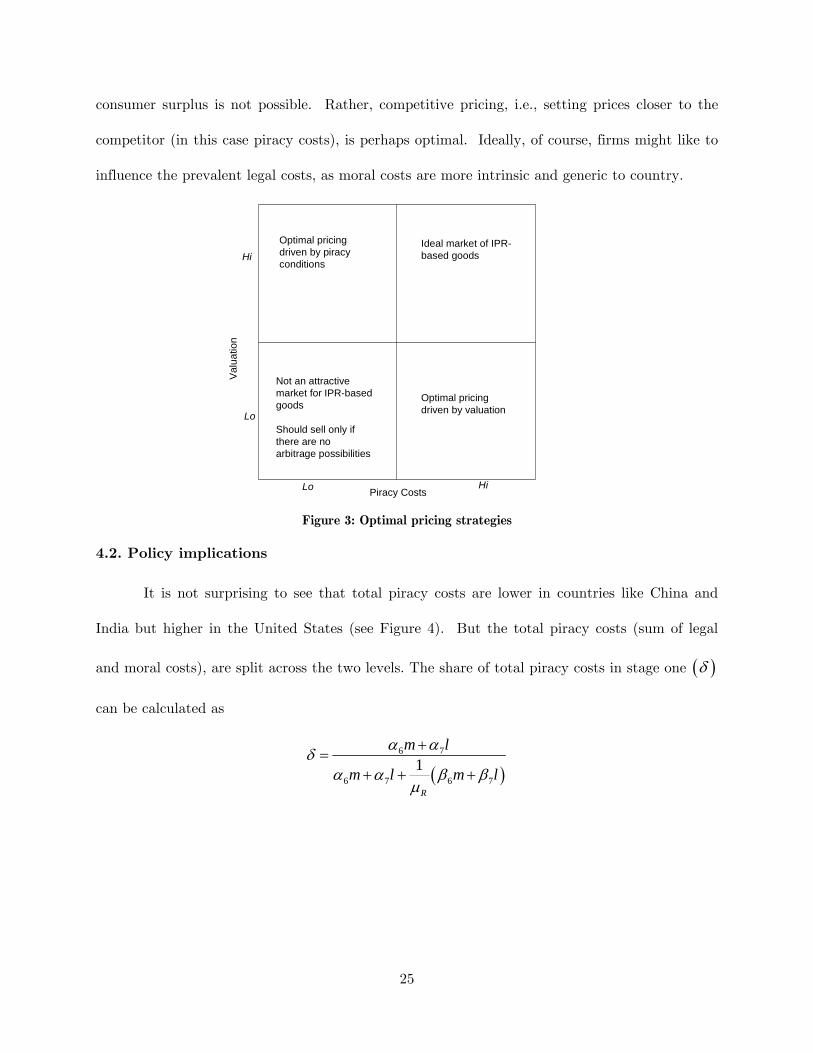
consumer surplus is not possible. Rather, competitive pricing, i.e., setting prices closer to the
competitor (in this case piracy costs), is perhaps optimal. Ideally, of course, firms might like to
influence the prevalent legal costs, as moral costs are more intrinsic and generic to country.
Piracy Costs
Val
uatio
n
Lo Hi
Lo
HiIdeal market of IPR-based goods
Optimal pricing driven by valuation
Optimal pricing driven by piracy conditions
Not an attractive market for IPR-based goods
Should sell only if there are no arbitrage possibilities
Figure 3: Optimal pricing strategies
4.2. Policy implications
It is not surprising to see that total piracy costs are lower in countries like China and
India but higher in the United States (see Figure 4). But the total piracy costs (sum of legal
and moral costs), are split across the two levels. The share of total piracy costs in stage one ( )δ
can be calculated as
( )
6 7
6 7 6 71
R
m l
m l m l
α αδα α β β
μ
+=
+ + +
26
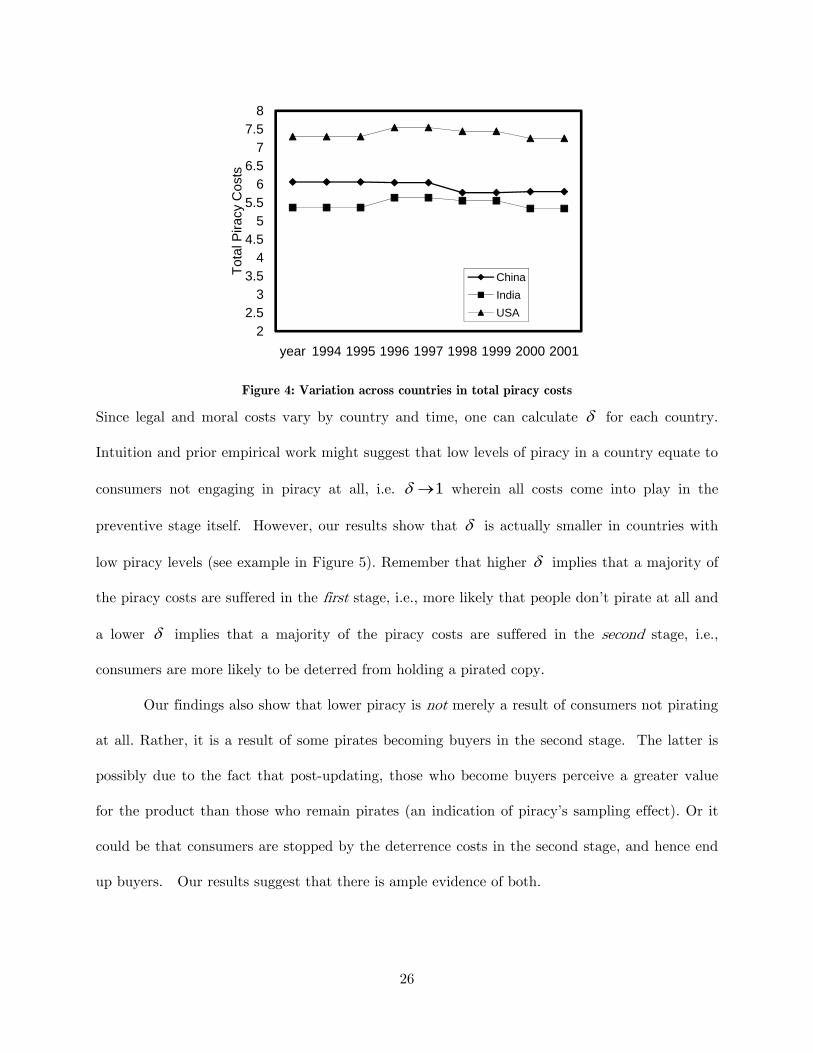
Figure 4: Variation across countries in total piracy costs
Since legal and moral costs vary by country and time, one can calculate δ for each country.
Intuition and prior empirical work might suggest that low levels of piracy in a country equate to
consumers not engaging in piracy at all, i.e. 1δ → wherein all costs come into play in the
preventive stage itself. However, our results show that δ is actually smaller in countries with
low piracy levels (see example in Figure 5). Remember that higher δ implies that a majority of
the piracy costs are suffered in the first stage, i.e., more likely that people don’t pirate at all and
a lower δ implies that a majority of the piracy costs are suffered in the second stage, i.e.,
consumers are more likely to be deterred from holding a pirated copy.
Our findings also show that lower piracy is not merely a result of consumers not pirating
at all. Rather, it is a result of some pirates becoming buyers in the second stage. The latter is
possibly due to the fact that post-updating, those who become buyers perceive a greater value
for the product than those who remain pirates (an indication of piracy’s sampling effect). Or it
could be that consumers are stopped by the deterrence costs in the second stage, and hence end
up buyers. Our results suggest that there is ample evidence of both.
22.5
33.5
44.5
55.5
66.5
77.5
8
year 1994 1995 1996 1997 1998 1999 2000 2001
Tota
l Pira
cy C
osts
ChinaIndiaUSA
27
Figure 5: Proportion of piracy costs incurred in the first-stage
Note that in constructing regulatory implications, we should keep in mind that there is
no one global regulator of public policy. Rather, the results should be meaningfully interpreted
by the U.S. software industry so as to influence IPR protection in different countries. The
impact of legal costs in the second stage can largely be associated with enforcement-related
activities; our findings point out that in countries with low piracy, the second-stage costs
dominate the first-stage ones. And since the second-stage legal costs are entirely composed of
legal enforcement, an important implication is that the industry should not only push for
countries to enact laws to protect IP, but rather the enforcement of these laws should be
emphasized. This implies that just because a country has signed a WTO agreement, it doesn’t
mean that piracy will reduce, follow-up actions regarding overall enforcement continue to be
important. Indeed a recent event study on piracy pre and post legal actions pursued by the
Recording Industry Association of America, finds that while such actions cannot eliminate
piracy they do have positive outcomes that are important to managing piracy (Bhattacharjee, et
al. 2006).
0.2
0.25
0.3
0.35
0.4
0.45
0.5
0.55
year 1994 1995 1996 1997 1998 1999 2000 2001
Del
ta
China
India
USA
28
To summarize, we provide compelling evidence for the differential impact of legal and
moral costs on piracy levels in different countries. Clearly, legal costs, an outcome of legal
controls put forth by regulators thwart piracy albeit to different degrees across different
countries. This study therefore calls for regulators to critically examine their legal controls
geared to deter piracy.
4.3 Limitations and future research
An important limitation of our work is that due to constraints, we only have aggregate
information on software piracy. It would be interesting to break down piracy based on software
categories (e.g., counterfeiting and individual pirating) to see if some suffer more piracy than
others. The specific impact of sampling effects of piracy and the price points could be better
understood if data were available at this granular level. Further, we also do not include the size
of the local software industry in each country. Note that while all piracy data is restricted to
software from U.S.-based firms, one important indicator could be the local production itself.
Countries with a large installed local base might do a better job of production and enforcement.
Finally, we believe that the results from this study could be extended to study piracy in the
music, movie and video-games piracy industries.
References
Allenby, G. M., "A unified approach to identifying, estimating and testing demand structures with aggregate scanner data," Marketing Science, 8, 3, (1989) 265-280. Allenby, G. M., and P. E. Rossi, "Quality perceptions and asymmetric switching between brands," Marketing Science 10, (1991) 185-204. Andrés, AR, "The relationship between copyright software protection and piracy: Evidence from europe," European Journal of Law and Economics, 21, 1, (2006), 29-51. Bagchi, Kallol, Peeter Kirsand Robert Cerveny, "Global software piracy: Can economic factors alon explain the trend?," Communications of the ACM, 49, 6, (2006), 70.
29
Ben-Akiva, Moshe E. and Steven R. Lerman, Discrete choice analysis : theory and application to travel demand MIT Press, Cambridge, MA, 1985. Berry, S., "Estimating discrete-choice models of product differentiation," The Rand Journal of Economics, 25, 2, (1994), 242-262. Berry, S, J Levinsohnand A Pakes, "Automobile prices in market equilibrium," Econometrica: Journal of the Econometric Society, (1995), 841-890. Bhattacharjee, Sudip, R. Gopal, K. Lertwacharaand J. R. Marsden, "Impact of legal threats on online music sharing activity: An analysis of music industry legal actions," Journal of Law and Economics, XLIX, Aprile, (2006), 91-114. Buisson, Benoît, "Producer Price Index for Pre-Packaged Software," 18th Meeting of the Voorburg Group, October, (2003), Tokyo, Japan. Burke, A. E., "How Effective are International Copyright Conventions in the Music Industry," Journal of Cultural Economics, 20, (1996), 51—66. Cass, R. A., "Property rights systems and the rule of law," (2003), http://ssrn.com/paper=392783. Chellappa, Ramnath K. and Shivendu Shivendu, "Economic implications of variable technology standards for movie piracy in a global context," Journal of Management Information Systems, 20, 2, (2003), 137-168. Chellappa, Ramnath K. and Shivendu Shivendu, "Managing piracy: Pricing and sampling strategies for digital experience goods in vertically semented markets," Information Systems Research, 16, 4, (2005), 400-417. Cheng, H., R. Simsand Teegen. H., "To purchase or to pirate software:An empirical study," J. Management Inform. Systems, 13, 4, (1997), 49-60. Chintagunta, Pradeep K., "Investigating purchase incidence, brand choice and purchase quantity decisions of households," Marketing Science, 93, 1, (1993), 184-209. Chintagunta, P. K., J. R. Dubé, and V. Singh, "Balancing profitability and customer welfare in a supermarket chain," Quantitative Marketing and Economics, 1, (2003), 111-147. Christen, M., S. Gupta, J. Porter, R. Staelin, and D. R. Wittink. "Using market-level data to understand promotion effects in a nonlinear model," Journal of Marketing Research. 34, 3, (1997), 322-334. Conner, Kathleen Reavis and Richard P. Rumelt, "Software Piracy: An Analysis of Protection Strategies," Management Science, 37, 2, (1991), 125.
30
Crampton, Thomas, "One price fits all for software sellers," The New York Times, (2005), http://www.nytimes.com/2005/06/24/technology/24iht-ptprice.html. Davis, T. R. V., "Integrating internal marketing with participative management," Management Decision 39, 2, 121-132. Erdem, T, MP Keaneand B Sun, "A dynamic model of brand choice when price and advertising signal product quality," SSRN eLibrary, (2007), http://ssrn.com/abstract=965473. Fried, Ina, "Microsoft may bow to overseas price pressure," c|Net News.com, (2004), http://news.com.com/2100-1016-5166912.html. Givon, Moshe, Vijay Mahajanand Eitan Muller, "Software Piracy: Estimation of Lost Sales and the Impact on Software Diffusion," Journal of Marketing, 59, 1, (1995), 29. Goldberg, P. and F. Verboven, "The Evolution of price dispersion in the European car market," Review of Economic Studies, (2001), 811-848. Globerman, S., "Addressing international product piracy," J. Internat. Bus. Stud., 19, 3, (1988), 497—504. Gopal, R. and L. Sanders, "Global Software Piracy: You Can't Get Blood Out of A Turnip," Communications of the ACM, 43, 9, (2000), 82-89. Gopal, Ram D and G Lawrence Sanders, "International software piracy: Analysis of key issues and impacts," Information Systems Research, 9, 4, (1998), 379-397. Guadagni, Peter M. and John D. C. Little, "A logit model of brand choice calibrated on scanner data," Marketing science, 2, 3, (1983), 203-239. Gupta, Pola B., Stephen J. Gouldand Bharath Pola, ""To Pirate or Not to Pirate": A Comparative Study of the Ethical Versus Other Influences on the Consumer's Software Acquisition-Mode Decision," Journal of Business Ethics, 55, 3, (2004), 255. Gupta, Sunil, "Impact of sales promotions on when, what, and how much to buy," Journal of Marketing Research, 25, 4, (1988), 342-366. Haruvy, Ernan, Vijay Mahajanand Ashutosh Prasad, "The Effect of Piracy on the Market Penetration of Subscription Software*," The Journal of Business, 77, 2, (2004), S81. Hofstede, G., Cultures and Organizations: Software of the Mind, McGraw Hill, New York, 1997. Husted, Bryan W, "The impact of national culture on software piracy," Journal of Business Ethics, 26, 3, (2000), 197. Lequiller, François, Nadim Ahmad, Seppo Varjonen, William Caveand Kil-Hyo Ahn, "Report of the OECD Task Force on Software Measurement in the National Accounts," OECD Statistics Working Papers, 2003/1, (2003), OECD Publishing.
31
Lucas Jr, RE, "Econometric policy evaluation: A critique," Proceedings of the The Phillips curve and labor markets: Carnbegie-Rochester Conference Series on Public Policy, Amsterdam, 1976, 19-46. Marron, Donald B and David G Steel, "Which countries protect intellectual property? The case of software piracy," Economic Inquiry, 38, 2, (2000), 159. McFadden, D., Econometric Models of Probabilistic Choice, MIT Press, 1981. Moores, Trevor T and Jasbir Dhaliwal, "A reversed context analysis of software piracy issues in Singapore," Information & Management, 41, 8, (2004), 1037. Nevo, A. "Measuring market power in the ready-to-eat cereal industry," Econometrica, 69, 2, 307-342. Ostergard, R. L., "The measurement of intellectual property rights protection," Journal of International Business Studies, 31, (2000), 349—360. Papadopoulos, T., "Determinants of International Sound Recording Piracy," Economics Bulletin, 6, 10, (2003), 1-9. Park, Walter G and Juan Carlos Ginarte, "Intellectual property rights and economic growth," Contemporay Economic Policy, XV, July, (1997), 51-63. Philips, Roger A., Guide to Software Export: A Handbook for International Software Sales, Haworth Press, Binghampton, NY, 1998. Png, Ivan P., "On the Reliability of Software Piracy Statistics," Electronic Commerce Research and Applications, 9, 5, (2010), 365-373. Ronkainen, I. A. and J. L. Guerrero-Cusumano, "Correlates of intellectual property violation," Multinational business review, 9, 1, (2001), 59. Samuelson, P., "Implications of the agreement on trade related aspects of intellectual property rights for cultural dimensions of national copyright laws," Journal of Cultural Economics, 23, (1999), 95-107. Shin, Seung Kyoon, Ram D Gopal, G Lawrence Sandersand Andrew B Whinston, "Global Software Piracy Revisited," Association for Computing Machinery. Communications of the ACM, 47, 1, (2004), 103. Sudhir, K. "Structural analysis of manufacturer pricing in the presence of a strategic retailer", Marketing Science, 20, 3, (2001), 244-264. Sudhir, K., P. K. Chintagunta, and V. Kadiyali, "Time-varying competition," Marketing Science, 24, 1, (2005), 96-109.
32
Sundararajan, Arun, "Managing Digital Piracy: Pricing and Protection," Information Systems Research, 15, 3, (2004), 287. Van Kranenburg, H. L. and A. E. Hogenbirk, "Multimedia, Entertainment, and business Software Copyright Piracy: A Cross-national Study," Journal of Media Economics, 18, (2005), 109—129. Zhu, Rich, "Microsoft Slices Software Prices," Shanghai Daily, December 09, (2008), http://www.shanghaidaily.com/sp/article/2008/200812/20081209/article_383734.htm.
33
Appendix A
Sources Concept Measured
1. Rule of Law
Columbia University (CUD)
For the most part, is the state seen as legitimately representing its citizens? Rate the state’s adherence to the rule of law, considering the country as a whole.
Global Insight (DRI)
Losses and Costs of Crime : A 1-point increase on a scale from 0" to "10" in crime during any 12- month period. Kidnapping of Foreigners: An increase in scope, intensity, or frequency of kidnapping of foreigners that reduces the GDP growth rate by 1% during any 12-month period. Enforceability of Government Contracts : A 1 point decline on a scale from 0" to "10" in the enforceability of contracts during any 12-month period. Enforceability of Private Contracts: A 1-point decline on a scale from 0" to "10" in the legal enforceability of contracts during any 12-month period.
Economist Intelligence Unit (EUI)
Violent crime Organized crime Fairness of judicial process Enforceability of contracts Speediness of judicial process Confiscation/expropriation
Heritage Foundation (HER)
Black market
Property Rights
Amnesty International (HUM)
Independence of Judiciary
Political Risk Services (PRS)
Law and Order.
Business Environment Risk Intelligence
Direct Financial Fraud, Money Laundering and Organized Crime
World Markets Research Center (WMO)
Judicial Independence An assessment of how far the state and other outside actors can influence and distort the legal system. This will determine the level of legal impartiality investors can expect. Crime How much of a threat businesses face from crime such as
34
kidnapping, extortion, street violence, burglary and so on. These problems can cause major inconvenience for foreign investors and require them to take expensive security precautions.
2. Control of Corruption
Columbia University (CUD)
Rate the severity of corruption within the state To what extent do the country's primary political decision makers (e.g. chief executive and cabinet members) engage in patterns of nepotism, cronyism and patronage? To what extent do the country’s civil services (occupying middle and higher management roles) engage in patterns of nepotism, cronyism and patronage? To what extent do patterns of nepotism, cronyism and patronage undermine the state's ability to exercise the basic functions of government effectively? To what extent do patterns of nepotism, cronyism and patronage distort broad patterns of economic development?
Global Insight's (DRI)
Risk Event Outcome non-price: Losses and Costs of Corruption: A 1-point increase on a scale from 0 to 10" in corruption during any 12-month period. "
Economist Intelligence Unit (EIU)
Corruption
Political Risk Services (PRS)
Corruption within the political system, which distorts the economic and financial environment, reduces the efficiency of government and business by enabling people to assume positions of power through patronage rather than ability, and introduces an inherently instability in the political system.
Business Environment Risk Intelligence
Indirect Diversion of Funds
World Markets Research Center (WMO)
Corruption: This assesses the intrusiveness of the country’s bureaucracy. The amount of red tape likely to countered is assessed, as is the likelihood of encountering corrupt officials and other groups
Note: Excerpt from D. Kaufmann, A. Kraay and M. Mastruzzi. “Governance Matters III: Governance Indicators for 1996—2002”, May 2003, World Bank Governance & Anti-Corruption Working Papers. We choose to use Control of Corruption Index from World Bank Governance & Anti-Corruption (WBG) instead of Transparency International Corruption Perception Index (TI) because TI index relies on a subset of the sources WBG use to create the index (10 data sources in TI vs. 14 sources in WBG). In addition, TI index uses simple average of scores as the estimate of corruption, while WBG construct Control of Corruption Index based on a weighted average of scores.
35
Appendix B
Measures of Piracy Rates5
Measure Data Source Demand PC Shipments Proprietary and confidential
data supplied by BSA member companies
# of Software installed/PC for three categories of software
Technology User Profile market research of Metafacts Inc.
Supply Software shipment data (only for business software application)
Proprietary and confidential data supplied by BSA member companies
Uplift factors reflecting an estimate of shipments by companies participating in the study
Developed by International Planning and Research (IPR)
Average wholesale price of SW
Proprietary and confidential price data supplied by BSA member companies weighted by the amount of shipments within each SW category
PC Shipments Software Load = # SW Installed×
# Software Shipment by Companies Uplift Factors for Companies = # SW Shipment×
# SW Installed - # SW Shipment = # SW Pirated
# SW Pirated # SW Installed = Piracy Level÷
( )# SW Installed - # SW Shipment Average Wholesale Price of SW= Piracy Loss×
5 Source: Seven Annual BSA Global Software Piracy Study, 2002
36
Appendix C
Computing Producer Pricing Index6
Producer Pricing Index (PPI) is created based on the survey on producers in each
industry. For any given industry, producers are selected for the survey via a systematic
sampling from a listing of all firms that file with the Unemployment Insurance System. After a
firm is selected and agrees to participate in the survey, a probability sampling technique called
disaggregation is used to determine which specific products or services will be in the PPI. The
formula used to calculate the PPIs is a modified Laspeyres index. The Laspeyres index compares
the base period revenue for a set of goods to the current period revenue for the same set of
goods.
The following formula closely approximates the actual computation procedure:
( )i 0 0 0 0 0I ( / ) / 100iQ P P P Q P⎡ ⎤= ×⎣ ⎦∑ ∑
Where:
0P is the price of a commodity in the base period; iP is the price of a commodity in the current
period; and 0Q is the quantity of the commodity shipped during the base period. In this form,
the index is the weighted average of price relatives (price ratios for each item 0/iP P= . The
expression 0 0Q P represents the weights in value form.
6 Source: Producer Pricing Index: Frequently Asked Questions. U.S. Department of Labor, http://www.bls.gov/ppi/ppifaq.htm#6