+ All Categories
Home > Documents > An empirical investigation into the antecedents of …AN EMPIRICAL INVESTIGATION INTO THE...

An empirical investigation into the antecedents of …AN EMPIRICAL INVESTIGATION INTO THE...

Date post: 25-Feb-2020
Category:
Upload: others
View: 16 times
Download: 0 times
Share this document with a friend
29
An empirical investigation into the antecedents of knowledge dissemination at the strategic business unit level Citation for published version (APA): Song, X. M., Bij, van der, J. D., & Weggeman, M. C. D. P. (2001). An empirical investigation into the antecedents of knowledge dissemination at the strategic business unit level. (ECIS working paper series; Vol. 200109). Eindhoven: Technische Universiteit Eindhoven. Document status and date: Published: 01/01/2001 Document Version: Publisher’s PDF, also known as Version of Record (includes final page, issue and volume numbers) Please check the document version of this publication: • A submitted manuscript is the version of the article upon submission and before peer-review. There can be important differences between the submitted version and the official published version of record. People interested in the research are advised to contact the author for the final version of the publication, or visit the DOI to the publisher's website. • The final author version and the galley proof are versions of the publication after peer review. • The final published version features the final layout of the paper including the volume, issue and page numbers. Link to publication General rights Copyright and moral rights for the publications made accessible in the public portal are retained by the authors and/or other copyright owners and it is a condition of accessing publications that users recognise and abide by the legal requirements associated with these rights. • Users may download and print one copy of any publication from the public portal for the purpose of private study or research. • You may not further distribute the material or use it for any profit-making activity or commercial gain • You may freely distribute the URL identifying the publication in the public portal. If the publication is distributed under the terms of Article 25fa of the Dutch Copyright Act, indicated by the “Taverne” license above, please follow below link for the End User Agreement: www.tue.nl/taverne Take down policy If you believe that this document breaches copyright please contact us at: [email protected] providing details and we will investigate your claim. Download date: 01. Mar. 2020
Transcript

An empirical investigation into the antecedents ofknowledge dissemination at the strategic business unitlevelCitation for published version (APA):Song, X. M., Bij, van der, J. D., & Weggeman, M. C. D. P. (2001). An empirical investigation into the antecedentsof knowledge dissemination at the strategic business unit level. (ECIS working paper series; Vol. 200109).Eindhoven: Technische Universiteit Eindhoven.

Document status and date:Published: 01/01/2001

Document Version:Publisher’s PDF, also known as Version of Record (includes final page, issue and volume numbers)

Please check the document version of this publication:

• A submitted manuscript is the version of the article upon submission and before peer-review. There can beimportant differences between the submitted version and the official published version of record. Peopleinterested in the research are advised to contact the author for the final version of the publication, or visit theDOI to the publisher's website.• The final author version and the galley proof are versions of the publication after peer review.• The final published version features the final layout of the paper including the volume, issue and pagenumbers.Link to publication

General rightsCopyright and moral rights for the publications made accessible in the public portal are retained by the authors and/or other copyright ownersand it is a condition of accessing publications that users recognise and abide by the legal requirements associated with these rights.

• Users may download and print one copy of any publication from the public portal for the purpose of private study or research. • You may not further distribute the material or use it for any profit-making activity or commercial gain • You may freely distribute the URL identifying the publication in the public portal.

If the publication is distributed under the terms of Article 25fa of the Dutch Copyright Act, indicated by the “Taverne” license above, pleasefollow below link for the End User Agreement:

www.tue.nl/taverne

Take down policyIf you believe that this document breaches copyright please contact us at:

[email protected]

providing details and we will investigate your claim.

Download date: 01. Mar. 2020

COPYRIGHT: AUTHORS ONLY SUBMITTED TO: JOURNAL OF PRODUCT INNOVATION

MANAGEMENT

AN EMPIRICAL INVESTIGATION INTO THE ANTECEDENTS OF KNOWLEDGE DISSEMINATION AT THE STRATEGIC BUSINESS UNIT

LEVEL

Michael Song University of Washington

Hans van der Bij

Eindhoven University of Technology

Mathieu Weggeman Eindhoven University of Technology

Correspondence address Michael Song

Michael L. & Myrna Darland Endowed Distinguished Chair in Entrepreneurship Professor of Marketing and Innovation Management

309 Mackenzie Hall, Box 353200 University of Washington

Seattle, Washington 98195-3200 (206) 543-4587 Fax: (530) 706-5432 Home: (425) 961-0521

email: [email protected]

September 14, 2001

Acknowledgement: All authors contributed equally to this manuscript. The authors wish to acknowledge the financial support provided by the Faculty of Technology Management at the Eindhoven University of Technology.

AN EMPIRICAL INVESTIGATION INTO THE ANTECEDENTS OF KNOWLEDGE DISSEMINATION AT THE STRATEGIC BUSINESS UNIT

LEVEL

Abstract

The development of new products requires not only the continuous generation and acquisition of knowledge, but also the continuous dissemination of knowledge. New product development is a complex and multifunctional process that requires cross-functional input and effective coordination among specialized functional areas. However, the dissemination of knowledge does not always happen spontaneously. People with a technical background are often highly individualistic and do not naturally share knowledge. So, at least in a technical environment, the dissemination of knowledge must be fostered by the organization.

In management research, particularly on technology and innovation management, there has been an explosion of interest in enhancing communication in new product development. The facilitating factors this research identifies would seem intuitively useful in enhancing knowledge dissemination; however, most of this research does not refer to knowledge dissemination explicitly, and these enhancing factors have not been empirically tested for this specific use.

Research on knowledge and its management has not given much attention to the way knowledge in an organization is generated and disseminated, and the factors that can facilitate these processes. If such factors are mentioned, they are not empirically tested and their relative impact is not addressed.

In this study we identified important factors in enhancing knowledge dissemination, validated the factors empirically, and determined their relative impact. We focused on technological knowledge, not on the individual level, but on the firm level. We deduced 17 potential facilitating factors from management research. After in-depth interviews executed at IBM, Philips, Microsoft, Motorola, Sony, Intel, and Merck, we made a selection of these factors on the basis of their perceived applicability by practitioners. In the end, 11 factors remained and these were empirically tested in 277 US high-technology firms, at the strategic business unit level.

The results indicate that individual commitment to the firm, a long-term perspective on R&D, organizational crises, and the availability of lead user and supplier networks facilitate knowledge dissemination, while organization redundancy impedes it. Other potential factors, such as the use of information technologies, appear to be non-significant.

AN EMPIRICAL INVESTIGATION INTO THE ANTECEDENTS OF KNOWLEDGE DISSEMINATION AT THE STRATEGIC BUSINESS UNIT

LEVEL

Introduction

It has been widely accepted that knowledge is critical to firm success, particularly for

firms operating in technology-intensive industries. As supporting evidence, the unique approach

to knowledge management by high-profile Japanese companies such as Honda, Canon,

Matsushita, NEC, and Kao is generally acclaimed as the secret to their success over their western

competitors [38, 40].

Especially in new product development, up-to-date technological knowledge is

indispensable. However the availability of such knowledge alone is not enough. New product

development is a complex and multifunctional process, and integrated cross-functional input and

effective coordination among specialized functional areas are critical for new product success [7,

22, 47]. Therefore, besides the continuous generation and acquisition of new knowledge, the

dissemination of this knowledge is of crucial importance. The latter will be the subject of this

paper.

In research on general management, and on technology and innovation management, there

has been an explosion of interest in enhancing communication in new product development. The

facilitating factors mentioned in this research can probably be used to enhance knowledge

dissemination in new product development; however, most of this research does not refer to

knowledge dissemination explicitly, or have tested these factors empirically for this specific use.

Research on knowledge itself has been focused on the object of knowledge - on defining

it [4], on distinguishing it from other dimensions, whether explicit or tacit, individual or

collective (e.g., [43, 18, 32]), and on distinguishing it from the object of information (e.g., [16]).

Very little research has been focused on the knowledge dissemination process, and on the factors

that can promote this process. Moreover, if such factors are mentioned, they are not empirically

tested (e.g., [39, 11]), and their relative impact is not addressed.

In this paper we identify important factors in enhancing knowledge dissemination in new

product development, empirically validate these factors, and assess their relative impact. We

focus on the dissemination of technological knowledge, which is very important for the success

of product and process innovations. We began by deducing 17 potential facilitating factors from

management literature; then, by means of in-depth interviews with R&D managers and their

supervisors at IBM, Philips, Microsoft, Motorola, Sony, Intel, and Merck, we reduced the

potential factors to 11. These we tested empirically in 277 US high-technology firms, at the level

of the strategic business unit (SBU), since knowledge dissemination is primarily a firm-level

phenomenon.

We present our findings as follows. After defining knowledge dissemination, we offer a

rationale from a theoretical and practical perspective for the factors that we tested empirically.

We next present the research design and our analysis and results. Finally, we discuss important

implications, and directions for future research.

Possible antecedents of knowledge dissemination

Theoretical Background

To identify potential factors facilitating knowledge dissemination, we reviewed articles

published in 17 top management journals over the last 15 years. We addressed articles not only

on knowledge or knowledge management, but also on more or less related topics such as

organizational learning, individual learning, innovation management, R&D management,

technology management, information systems, human resource management, and strategic

management. Finally, without claiming to be exhaustive, we identified 17 potential facilitating

factors. We will discuss these factors below; they are summarized in Table 1.

To be able to disseminate knowledge people must be brought together in one way or

another. Physical co-location is mentioned by McDonough III, Kahn, and Barczak [33], Coombs

and Hull [11], Moenaert and Caeldries [34], and Allen [1]. The latter concludes that the

probability of communication decreases with distance, and at a startling rate: a mere swing-door

or staircase between two departments can result in a huge difference.

The use of teams to increase knowledge integration is noted e.g. by Matusik and Hill [32]

and Nonaka [39]. Kendall [27] emphasizes the coordinative function of information technologies

to enable, intensify, or expand the interactions of organizational members. Warkentin, Sayeed,

and Hightower [50] wonder whether the advantages of such virtual teams may not be outweighed

by some serious disadvantages, like a lack of group cohesion. Griffin and Hauser [22] suggest the

use of cross-functional teams. Lead user and supplier networks are found to foster knowledge

integration by Matusik and Hill [32], Nonaka [39], Dodgson [14], and Gemünden, Heydebreck

and Herden [19].

Factors on the individual or small group level include such human resource concerns as

formal rewards [36, 32], job rotation [6, 35], and individual commitment [39]. Moreover,

feedback has been identified as an integrating knowledge mechanism. Feedback mechanisms are

named by Matusik and Hill [32] and Coombs and Hull [11]. Busby [8] mentions post-project

evaluations.

The majority of factors concern organizational measures. On the top management level

the availability of R&D budget [14, 24, 25], a long-term strategic orientation [14, 49], asset

specificity [9], organizational redundancy [39], goal congruency between departments [20, 48],

organizational crisis [15, 21, 28, 39], stimulating risk taking behavior [45], and management

support for integration [48], are mentioned.

(insert Table 1 about here)

Field Research

After our literature review we conducted 10 in-depth interviews with R&D managers and

their supervisors in seven knowledge-intensive organizations, including IBM, Philips, Microsoft,

Motorola, Sony, Intel, and Merck. We followed the standard format of the structured open-

response interview that ‘uses an interview schedule which is in format rather like the structured

interview, with questions included in a set of order. However, many more questions will be open-

ended, and there may be flexibility to allow variation in the order in which groups of questions

are asked’ [29]. We listed the potential facilitating factors, and asked the managers to select those

that in their perception were most important in influencing knowledge dissemination. Next, in a

less structured way, we asked for stories of success and failure in the management of knowledge

dissemination and its consequences for the firm. In the end, the managers selected 11 factors as

most interesting and important in their impact on knowledge dissemination (see Table 1).

Respondents regarded physical co-location and virtual co-location through information

technologies as important in enhancing knowledge dissemination. Several companies regularly

invite their current and potential suppliers and lead users to participate in retreat conferences to

discuss their current technological and new product development problems. Suppliers and

customers make notes, ask questions and talk with each other at the conferences. Often

participants come back with proposals for solving perceived problems. Companies co-develop

with those participants whose proposals look promising. In general, respondents did not mention

the use of teams to foster knowledge dissemination.

Regarding the factors on the individual or small group level, in general, respondents

identified formal rewards and individual commitment as important. They did not mention job

rotation. Despite their importance, respondents noted that formal reward systems for knowledge

integration are rare in high-technology companies. Most appraisal forms do not use the criterion,

‘shares knowledge with others’, and the common criterion ‘is able to work independently’

actually discourages knowledge sharing. Respondents considered the use of feedback relatively

unimportant for knowledge dissemination.

The usefulness of all the organizational measures on the top management level except

asset specificity and goal congruency were confirmed in the field research. Respondents not only

emphasized the availability of R&D budgets, but also a stable allocation of the budget to

important research areas over years. Two respondents stated that the use of short-term financial

measures would kill technology creation. ‘You need stability in knowledge production. You can

close a laboratory on the short term, but you cannot rebuild it in one year’. European respondents

favored the use of organizational redundancy and organizational crisis (either real, or generated

intentionally by top management) to enhance knowledge dissemination. However, these

measures are not used on a large scale. Results from the field research indicate that, since people

with a technical background tend to be more individualistic than those with a non-technical

background, technicians do not give high priority to knowledge sharing. Therefore management

should force the engineers to leave their silos in latter stages of the development process and

work together. It is the only way to keep the development process within 48 weeks, according to

one of the respondents.

Methodology

Research Instrument Development Procedure

We used existing scales wherever possible and undertook the following six steps to

develop the new scales. First, we conducted a literature review and identified a pool of items for

each of the constructs from the existing literature. We tried to generate items that tap the domain

of each construct as closely as possible [10].

Second, in addition to the “theory-in-use” field research described earlier, we also

conducted in-depth interviews in seven knowledge-intensive organizations (IBM, Philips,

Microsoft, Motorola, Sony, Intel, and Merck) to build an understanding of the knowledge

management process, and to develop appropriate measurement items. A total number of 32 senior

executives, IT officers, and R&D experts were interviewed during this research stage. The

interviews followed a standard protocol and they consisted of three parts. The first part of the

interviews was designed to elicit salient constructs and definitions of those constructs.

Participants were first asked their opinions regarding important issues in the knowledge creation

process. The second part of the interviews focused on eliciting team member evaluations of the

theoretical model to describe their own experiences. The third part of the interviews addressed

perceptions of the relevance and completeness of scale items drawn from our literature review

and earlier case studies.

Third, we carried out desk research by examining company documents regarding their

knowledge dissemination process and reviewing the relevant literature. We then performed a

content analysis using the procedure recommended by Kassarjian [26]. The aim was to

standardize the outcomes of the different interviews from the different companies. All

measurement items generated from the above two steps were given a unique code. Five

researchers with adequate knowledge in the field of knowledge management independently

verified for all issues how they could be positioned in the developed research instrument. Four

researchers compared their outcomes and discussed any differences. In cases where consensus

could not be reached, the fifth researcher served as a referee and determined the final positioning.

The referee had to intervene in only one of the measurement items.

Fourth, using the measurement items generated, we developed the first draft of our

research instrument. We discussed this first draft with a representative panel of experienced IT

officers and R&D managers from the companies. This helped us to refine a number of the items

included in the first draft of our research instrument. We then followed the recommendations of

Churchill [10] and identified subsets of items that were unique and possessed "different shades of

meaning" to informants. We submitted a list of constructs and corresponding measurement items

to a panel of academic “experts” for critical evaluation and suggestions. We constructed a

questionnaire based on those items judged to have high consistency and face validity.

Fifth, we pretested the survey for clarity and appropriateness using the participants of the

case studies. The participants were asked to indicate any ambiguity or difficulties they

experienced in responding to the items. Based on the feedbacks from the participants, we

eliminated some items and modified other items which managers either had difficulties with or

found them to be ambiguous.

Sixth, the final research instruments were subjected to additional pretests involving

personal interviews with six executives in Motorola, Microsoft, and IBM. We ask these

executives to complete the survey as they applied to their business unit. At this stage, this pretest

resulted only minor refinements on two measurement items.

Measures

Dependent variable. Since a scale for knowledge dissemination was not available in the

literature, we developed the scale using the research instrument development procedure discussed

in the earlier section. Knowledge dissemination was defined as an interaction in which the

knowledge of one individual is used to enlarge the knowledge of another and is disseminated

throughout the organization. The 4-item scale measures: the extent the company periodically

circulates documents (e.g. reports, newsletters) that provide new knowledge created, the extent

data on technology management are disseminated at all levels in the company on a regular basis,

the extent information about successful and unsuccessful technology development is freely

communicated across all business functions, and the extent of cross-functional communication

concerning technology developments in the company.

Independent variables. Co-location of R&D personnel was measured by a 3-item scale,

which measures the physical distance between the different departments of R&D, the extent to

which offices of R&D personnel are located in close proximity to each other, and the ease with

which R&D personnel travels to meet. These measurement items were adopted from Pinto,

Pinto, and Prescott [42].

Information Technologies were measured by a 4-item scale, which measures the level of

investment relative to the industry standard, the IT systems’ ease of use, the quality of the service

of the systems, and the level of usage of the systems in the organization. These measurement

items were adopted from Sethi and King [44].

Lead user and supplier networks were measured by a 2-item scale that was adopted from

Athanassiou and Nigh [3]. It measures the strength of the network of suppliers of the company

relative to the main competitors, and the strength of the lead user network relative to the main

competitors.

Formal rewards were measured by the extent to which knowledge creation is a major

component of the organizations’ performance evaluation (adopted from [17]).

Individual commitment was measured by a 5-item scale, adopted from [2]. It measures the

extent to which people defend the company when others criticize it, their personnel loyalty to the

organization, their commitment to the company, their expectation to work with the company for

some time, and the extent to which they are continually on the lookout for the opportunity to

work with other companies.

R&D budget was measured by the percentage of R&D expenses on the sales revenues.

Long term orientation was measured by a 4-item scale, which measures the extent to

which renewal of the R&D budget is virtually automatic in the organization, the extent to which

top management believes R&D effort will lead to benefit in the long run, the willingness to make

long-term investment in R&D, and the extent to which the strategic plans of R&D are long-term

oriented. These measurement items were adopted from Lusch and Brown [30].

Organizational crisis was measured by a 3-item scale, that is based on the field research.

It measures the extent to which top management intentionally creates organizational crises, the

frequency of organizational crises in the organization, and the extent to which organizational

crisis is a characteristic of the firm.

Organizational redundancy was measured by a 3-item scale, which measures the extent to

which organizational redundancy is a characteristic of the firm, the degree to which skills and

resources in the organization overlap, and the degree business activities across different divisions/

departments in the company overlap. These measurement items were adopted from Hansen [23].

Risk taking behavior was measured by a 3-item scale, adopted from [46]. It measures the

extent to which senior management desires high-risk, high-return investment, the extent to which

management provides incentives to work on new ideas despite the uncertainty of the outcomes,

and the extent to which top management encourages people to keep trying if they fail in the

process of creating something new.

Management support for integration was measured by the extent to which top

management formally promotes knowledge creation in the organization. These measurement

items were adopted from Song and Parry [46]).

To control for possible industry and firm effects, we included eight variables: buyer

power (BPOW) measures the extent to which the customers of the firm are able to negotiate

lower prices from it; supplier power (SPOW) measures the extent to which the firm is able to

negotiate lower prices from its suppliers; seller concentration (CONC) measures the percentage

of total sales accounted for by the four competitors with the largest sales; ease of entry (ENTRY)

measures the likelihood of a new competitor being able to earn satisfactory profits in the firm’s

principal served market segment within three years after entry; market growth (MGRO) measures

the average annual growth rate of total sales in an SBU’s principal served market segment over

the past three years; technological change (TCHG) measures the extent to which

production/service technology in an SBU’s principal served market segments has changed over

the past three years; relative size (RSIZE) measures the size of an SBU’s sales revenues in its

principal served market segment in relation to those of its largest competitor; and relative cost

(RCOST) measures the SBU’s average total operating costs (administrative, production,

marketing/sales, etc.) in relation to those of its largest competitor in its principal served market

segment. These control variables were adopted from Narver and Slater [37].

Data Collection

The data were collected using mail surveys. The sampling frame consisted of the

companies listed in the High-Technology Industries Directory, all of which were sent a mailing.

After initial contacts to identify appropriate informants, we narrowed the original list to 686 firms

that had valid contact information for the final survey. Phone calls were made to verify the

contact information. In administering each of the mail surveys, we followed the total design

method for survey research [13]. The first mailing packet included a personalized letter, an

express postage-paid envelope with individually typed return-address label, and the

questionnaires. We sent out three follow-up letters. We re-sent the questionnaire, together with a

reminder letter, to each firm that did not respond after three weeks. To increase the response rate,

we supplemented our extensive personal contacts and networking efforts with numerous

incentives. From the 686 firms, we collected complete data from 277 firms (a 40% response rate).

These companies are operating in the following businesses: telecommunications equipment;

semiconductors and computer related products; software related products; Internet related

services and equipments; instruments and related products; electronic and electrical equipment;

pharmaceutical, drugs, & medicines; industrial machinery & equipment.

To test for possible non-response bias, we compared early (first wave of mailing) with

late responses on the level of knowledge dissemination of the firm. The results indicated no

significant differences at a 95% confidence interval. We also collected additional financial data

from secondary sources such as CompuStat and company annual reports to compare respondent

with non-respondent firms on annual sales and number of employees. The results indicated that

there were no significant differences between the responding and non-responding firms at a 95%

confidence interval. Thus, we conclude that there is no non-response bias and that the results may

be generalized to the firms that did not respond.

Analysis

We performed a factor analysis using Varimax rotation. The factor loadings are reported

in Table 2. For the nine factors, all the corresponding measures have acceptable loadings, ranging

from 0.59 to 0.90. These loadings suggest a high level of validity for all the nine constructs. The

total variance explained by the nine factors is 0.74.

(insert Table 2 about here)

For hypothesis testing purposes, the measure on each multiple-item scale was obtained by

simple addition of the individual scale items and division by the number of items in the scale.

In Table 3, we present construct reliabilities on the diagonal, and correlations on the off-diagonal.

The reliability of all measures is found to surpass the 0.70 threshold recommended by Nunnally

[38], hence implying a high level of scale reliability.

(insert Table 3 about here)

Ordinary least squares technique was employed for estimating model parameters. A

backward regression was performed to determine which of the 11 independent variables

(enhancing factors in knowledge dissemination) were most strongly related to the dependent

variable (level of knowledge dissemination). The backward regression technique produces a

parsimonious model, as it chooses to skip all factors that do not significantly contribute to the

variance in the dependent variable. The p-values associated with the F-statistics of the

independent variables are used as an omission criterion. In order to participate in the regression

model the p-value associated with the F-statistics for the variable must not exceed 0.10. In an

iterative process non-significant factors are successively deleted. Thus, the resulting model

explains as much variance with as few factors as possible.

To address problems associated with multicollinearity, an application of the Belsley, Kuh,

and Welsch [5] multicollinearity diagnostic test was executed; results indicated no serious

multicollinearity problems.

Results

Results of the backward regression are presented in Table 4. F-statistic was 26.50

(p<.0001), R-square and adjusted R-square were respectively 0.44 and 0.43. Overall, the findings

confirm the value of four of the eleven potential enhancing factors. Lead user and supplier

networks, individual commitment, long-term orientation, and organizational crisis positively

influence knowledge dissemination at an alpha level of 0.001. Individual commitment and long-

term orientation have the strongest impact. Organizational redundancy appears to have a negative

influence on knowledge dissemination at an alpha level of 0.001, while co-location, information

technologies, formal rewards, R&D budget, risk taking behavior, and management support for

integration are not significant. Moreover, the control variables supplier power, concentration, and

relative firmsize appear significant at an alpha level of 0.01 or 0.001.

(insert Table 4 about here)

The result regarding organizational redundancy is very interesting. Firms wishing to

increase knowledge dissemination should avoid organizational redundancy. The results regarding

non-significant factors are interesting as well, especially regarding information technologies. We

will discuss these intriguing findings below.

Discussion

Enhancing knowledge dissemination

Past research in general management, technology and innovation management, and

knowledge management identifies several factors that might enhance the dissemination

throughout an organization of technological knowledge in new product development. However,

until now these factors have not been empirically validated or ranked in importance. In this study,

we tested these factors in 277 US high-technology firms. Our results show that lead user and

supplier networks, individual commitment, long-term orientation, and organizational crisis all

improve knowledge dissemination significantly. Organizational redundancy, counterintuitively,

impairs it, while co-location, information technologies, formal rewards, R&D budget, risk taking

behavior, and management support for integration all have no significant effect.

In general, our results show that the management of the knowledge dissemination process

matters. However, some counter-intuitive results also indicate that this management process is

complex and not always straightforward.

Lead user and supplier networks

Clearly a strong pattern of relations among organization members and the organizations’

lead users and suppliers increases the level of knowledge dissemination, as suggested (but not

empirically proven) in past research [39, 14, 19]. As one would expect, communication between

organization members and lead users and suppliers leads to knowledge dissemination among

organization members. Probably individuals’ information about lead users and suppliers is

accurate and interesting enough to share among organization members, while it is useful enough

to enter the belief systems of these members.

Individual commitment

Individual commitment appeared to have the strongest positive impact on knowledge

dissemination. This confirms the knowledge management literature [43, 39]. According to

Nonaka [39] individual commitment is based on three factors: intention, autonomy, and

environmental fluctuation. Intention regards the way people approach the world and try to make

sense of it. Autonomy leads to greater flexibility in acquiring, relating, and interpreting

information. Environmental fluctuations generate new patterns of interaction between people and

their environment (see also [31, 51]). Why would commitment enhance the sharing of

knowledge? Possibly, identification with and involvement in the organization also means

communication with the people in the organization, at least for some. Moreover, environmental

fluctuations give this communication the purpose of identifying and explaining these fluctuations;

and eventually it alters the belief systems of the people involved.

Despite its impact, individual commitment is not the easiest factor to manage.

Management might try to gain individual commitment by increasing autonomy and reinforcing

environmental fluctuations.

Long-term orientation

Long-term orientation is also very important for knowledge dissemination. This also

confirms past research [14, 49]. A long-term orientation offers a stable strategic direction,

implemented by a steadily growing number of organization members. While following the same

strategy together, people become more involved with each other and more willing to disseminate

knowledge. Though too much commonality might decrease the number of subjects to share,

clearly there is usually enough dissimilarity to promote the sharing of ideas.

Organizational crisis

The positive influence of organizational crisis on knowledge dissemination is posited by

Drazin, Glynn, Kazanjian [15], Greve [21], Kim [28], and Nonaka [39]. Disruptive events may

lead to the demolition of existing frames of ideas and beliefs, and so offer the opportunity to

build new ones. Evidently, organizational crises also increase personnel loyalty to the

organization and its members and thus stimulate the sharing of new ideas and beliefs.

Organizational redundancy

The negative impact of organizational redundancy on knowledge dissemination might at

first seem counterintuitive: it is not posited in existing research. But where there is too much

similarity there may be no incentives to share knowledge. Overlapping skills and resources in the

company, and overlapping business activities across different divisions/ departments may lead to

such similarity. However, we suppose that results will differ for Japanese firms.

Non-significant factors

Non-significant factors include co-location, information technologies, formal rewards,

R&D budget, risk taking behavior, and management support for integration.

The non-significance of co-location for the dissemination of technological knowledge does not

contradict Moenaert and Caeldries [34]. They found that placing R&D professionals in close

proximity to one another increased market learning, but did not increase technological learning.

In our opinion the most surprising non-significant factor is information technologies.

Research on less positive influences of information technologies has been rather limited. Among

the few studies, that of Daft and Lengel [12] on media richness should be mentioned. The authors

label information technologies as ‘lean’ media, by which it is relatively difficult to transfer rich

information, i.e. information that will change understanding within a time interval. This might be

harmful in the uncertain new product development area.

In view of the factors with a high impact on knowledge dissemination, it seems that it is

most important to manage the intrinsic motivation of people to share knowledge. Extrinsic

motives like formal rewards, direct management support for integration, and R&D budget

obviously do not influence people significantly to share knowledge with one another.

Finally, enhancement of risk taking behavior rather stimulates people to elaborate their

own ideas than to share these ideas with others. To further explain the negative and non-

significant influences, future research is needed.

Table 1.

Factors mentioned in literature for enhancing the level of knowledge dissemination

Factors Authors

• Co-location • McDonough III et al [34], Coombs and Hull [11], Moenaert and Caldries [34], Allen [1].

• Teams* • Matusik and Hill [32], Nonaka [39].

• Information Technologies • Kendall [27], Warkentin et al [50].

• Lead user and supplier networks • Matusik and Hill [32], Nonaka [39], Dodgson [14], Gemünden et al [19].

• Formal rewards • Mueller and Dyerson [36], Matusik and Hill [32].

• Job rotation* • Bird [6], Moenaert and Souder [35].

• Individual commitment • Nonaka [39].

• Feedback mechanisms* • Matusik and Hill [32], Coombs and Hull [11].

• Post-project evaluation* • Busby [8].

• R&D budget • Dodgson [14], Hausman et al [24], Kamien and Schwarz [25].

• Long term orientation • Dodgson [14], Souder [49].

• Asset specificity* • Christensen [9].

• Organizational redundancy • Nonaka [39].

• Goal congruency* • Ginn and Rubenstein [20], Song et al [48].

• Organizational crisis • Drazin et al [15], Greve [21], Kim [28], Nonaka [39].

• Risk taking behavior • Sitkin [45].

• Management support for integration • Song et al [48].

Note: * means that the factor has not been selected in the field research.

Table 2.

Factor Loadings with Varimax Rotation

Factor Loadings*

Items F1 F2 F3 F4 F5 F6 F7 F8 F9

KDIS2 KDIS4 KDIS1 KDIS3 CL3 CL1 CL2 UIT1 UIT4 UIT2 UIT3 NETW1 NETW2 COMMIT1 COMMIT4 COMMIT3 COMMIT2 COMMIT5 LTO4 LTO3 LTO1 LTO2 OR3 OR2 OR1 ORGC3 ORGC1 ORGC2 RISKA1 RISKA3 RISKA2

0.85 0.75 0.73 0.60

0.21 0.13 0.18

0.13

-0.01 0.07 0.05

0.03 0.10

0.13 0.09 0.19 0.25 0.30

-0.16 0.04 0.10 0.26

-0.17 -0.02 -0.22

0.24 0.02 0.17

-0.02 0.06 0.08

0.08 0.07 0.33 0.26

0.80 0.80 0.74

0.02

-0.04 0.13 0.17

-0.01 0.03

0.02 0.08 0.06 0.11 0.27

-0.05 -0.02 -0.03 0.10

-0.09 -0.19 0.05

0.13 0.17 0.09

-0.10 -0.11 -0.18

0.07 0.09 0.12 0.01

0.08 0.23

-0.05

0.81 0.80 0.78 0.59

-0.00 0.18

0.08 0.07 0.03 0.10

-0.04

-0.06 -0.01 -0.14 0.06

-0.06 -0.07 -0.02

0.17 0.03 0.36

-0.05 -0.15 -0.11

0.02 0.07

-0.05 0.18

-0.05 -0.02 0.08

0.14

-0.02 0.07 0.03

0.89 0.84

-0.06 0.09

-0.02 -0.10 0.03

-0.02 -0.01 -0.15 0.02

0.06 0.01

-0.12

0.03 0.08

-0.09

0.01 0.01 0.10

0.27 0.25 0.25 0.07

0.17 0.09 0.08

0.04 0.04 0.22

-0.07

0.11 -0.04

0.85 0.85 0.75 0.71 0.66

-0.03 -0.02 -0.19 -0.03

0.01

-0.01 -0.09

0.10 0.13

-0.02

-0.30 -0.12 -0.28

0.02 0.04 0.09 0.14

0.05 0.08

-0.11

-0.05 0.02

-0.00 -0.14

-0.03 -0.10

-0.14 -0.00 -0.19 0.01

-0.02

0.87 0.87 0.75 0.68

0.03

-0.02 -0.03

-0.06 0.07

-0.07

0.24 0.07 0.09

-0.11 -0.22 -0.11 -0.09

-0.18 -0.02 -0.05

-0.07 -0.13 -0.02 0.10

-0.01 -0.04

-0.01 -0.04 -0.11 0.12

-0.13

-0.05 0.10

-0.02 -0.06

0.90 0.87 0.83

-0.09 -0.03 -0.04

-0.06 -0.08 -0.20

0.05 0.14 0.10 0.17

0.15 0.22 0.04

0.17

-0.06 0.14 0.25

0.01 0.04

0.04 0.07

-0.00 0.19

-0.08

-0.07 -0.10 0.07 0.07

0.01

-0.10 -0.04

0.79 0.77 0.75

-0.01 -0.07 -0.07

0.08 -0.15 0.02 0.16

-0.13 -0.13 -0.12

-0.04 -0.17 0.10

-0.21

0.11 -0.04

-0.21 -0.12 -0.31 0.08

-0.34

0.11 0.08 0.04 0.12

-0.16 -0.09 -0.03

-0.18 0.19

-0.26

0.81 0.80 0.74

*Item identified as nine factors: F1=knowledge dissemination; F2=co-location; F3=information technologies; F4=lead user and supplier networks; F5=individual commitment; F6=long-term orientation; F7=organizational redundancy; F8=organizational crisis; F9=risk taking behavior. Note: black numbers indicate items that load highly for each of the nine factors.

Table 3.

Measurement Information

Mean S.D. KD CL UIT NETW COMMIT REWARD RDP LTO OR ORGC RISKA MS

Knowledge dissemination

Co-location

Information Technologies

Lead user and supplier networks

Individual commitment

Formal rewards

R&D budget

Long-term orientation

Organizational redundancy

Organizational crisis

Risk taking behavior

Management support for

integration

5.39

5.60

6.05

2.82

5.94

7.23

5.98

4.66

3.67

5.37

3.08

6.10

2.38

2.22

1.96

2.47

2.24

2.77

2.74

2.61

2.34

2.52

2.76

2.53

0.84

0.34

0.17

0.15

0.41

0.21

0.22

0.21

-0.33

0.32

-0.05

0.06

0.80

0.25

0.04

0.35

0.17

0.56

-0.00

-0.21

0.39

-0.29

-0.11

0.76

0.17

0.19

0.10

0.14

-0.11

-0.11

0.41

-0.25

-0.01

0.72

-0.01

-0.01

0.03

-0.11

-0.06

0.07

0.07

0.11

0.89

0.09

0.15

-0.17

-0.10

0.22

-0.44

-0.20

NA

0.20

0.13

-0.23

0.23

0.02

0.11

NA

0.06

-0.28

0.31

-0.05

-0.01

0.82

-0.03

-0.05

0.28

0.17

0.88

-0.14

-0.18

-0.28

0.77

-0.18

-0.04

0.85

0.38

NA

*Note: The Cronbach Coefficient Alpha for each measure is on the diagonal in italics; the

intercorrelations among the measures are on the off-diagonal.

Table 4.

Backward Regression: the level of knowledge dissemination as a dependent variable

coefficient standard

error

significance

level

t-value standardized

coefficient

Intercept

Lead user and supplier networks

Individual commitment

Long-term orientation

Organizational redundancy

Organizational crisis

Supplier power

Seller concentration

Relative size

F-value

R2

Adjusted R2

1.91

0.16

0.40

0.30

-0.21

0.20

0.15

-0.13

-0.21

26.50

0.44

0.43

0.56

0.04

0.06

0.05

0.05

0.05

0.05

0.04

0.06

**

**

**

**

**

**

*

*

**

3.42

3.62

7.19

6.56

-4.34

4.28

3.07

-2.86

-3.46

0

0.17

0.38

0.33

-0.21

0.22

0.17

-0.14

-0.18

Notes: *p<0.01; **p<0.001

References 1. Allen, T.J. Managing the Flow of Technology. Cambridge: MIT Press, 1988. 2. Anderson, E. and Weitz, B. The use of pledges to build and sustain commitment in distri.

Journal of Marketing Research 29(1): 18-35 (1992). 3. Athanassiou, N. and Nigh, D. The impact of US company internationalization on top

management team advice networks: A tacit knowledge perspective. Strategic Management Journal 20: 83-92 (1999).

4. Audi, R. The Cambridge dictionary of philosophy. Cambridge: Cambridge University Press,

1995. 5. Belsley, D.A., Kuh, E., and Welsch, R.E. Regression diagnostics. New York, NY: John

Wiley & Sons, 1980. 6. Bird, A. Careers as repositories of knowledge: a new perspective on boundaryless careers.

Journal of Organizational Behavior 15: 325-344 (1994). 7. Brown, S.L. and Eisenhardt, K.M. Product development: Past research, present findings, and

future directions. Academy of Management Review 20(2): 343-378 (1995). 8. Busby, J.S. An Assessment of Post-Project Reviews. Project Management Journal 30(3): 23-

29 (1999). 9. Christensen, J.F. Asset profiles for technological innovation. Research Policy 24: 727-746

(1995).

10. Churchill, G.A., Jr. A paradigm for developing better measures of marketing constructs. Journal of Marketing Research, 16(February): 64-73 (1979).

11. Coombs, R. and Hull, R. Knowledge management practices and path-dependency in

innovation. Research Policy 27: 237-253 (1998). 12. Daft, R.L. and Lengel, R.H. Organizational information requirements, media richness and

structural design. Management Science 32(5): 554-571 (1986). 13. Dillman, D.A. Mail and Telephone Surveys: The Total Design Method. New York, NY: John

Wiley and Sons, 1978. 14. Dodgson, M. Organizational Learning: A Review of Some Literatures. Organization Studies

14(3): 375-394 (1993). 15. Drazin, R., Glynn, M.A., and Kazanjian, R.K. Multilevel theorizing about creativity in

organizations: A sensemaking perspective. Academy of Management Review 24(2): 286-307 (1999).

16. Dretske, F.I. Knowledge and the flow of information. Oxford: Basil Blackwell, 1981. 17. Dyer, B. and Song, X.M. The impact of strategy on conflict: A cross-national comparative

study of US and Japanese firms. Journal of International Business Studies 28: 467-493 (1997).

18. Faulkner, W. Conceptualizing knowledge used in innovation: a second look at the science-

technology distinction and industrial innovation. Science, Technology and Human Values 19(4): 425-458 (1994).

19. Gemünden, H.G., Heydebreck, P., and Herden, R. Technological interweavement: a means of

achieving innovation succes. R&D Management 22(4): 359-376 (1992). 20. Ginn, M.E. and Rubenstein, A.H. The R&D/ production interface: A case study of new

product commercialization. Journal of Product Innovation Management 3: 158-171 (1986). 21. Greve, H.R. Performance, aspirations, and risky organizational change. Administrative

Science Quarterly 43(1): 58-86 (1998). 22. Griffin, A. and Hauser, J.R. Integrating R&D and marketing: A review and analysis of the

literature. Journal of Product Innovation Management 13: 191-215 (1996). 23. Hansen, M.T. The search-transfer problem: The role of weak ties in sharing knowledge across

organization subunits. Administrative Science Quarterly 44(1): 82-111 (1999). 24. Hausman J., Hall, B.H., and Griliches, Z. Econometric models for count data with an

application to the patents-R&D relationship. Econometrica 52: 909-938 (1984). 25. Kamien, M.L. and Schwarz, N.L. Market structure and innovation. Cambridge: Cambridge

University Press, 1982.

26. Kassarjian, H.H. Content analysis. Journal of Consumer Research 4(1): 8-18 (1977). 27. Kendall, K.E. The significance of information systems research on emerging technologies:

Seven information technologies that promise to improve managerial effectiveness. Decision Sciences 28(4): 775-792 (1997).

28. Kim, L. Crisis construction and Organizational Learning: Capability Building in Catching-up

at Hyundai Motor. Organization Science 9(4): 506-521 (1998). 29. King, N. The qualitative research interview. In: Qualitative methods in organizational

research. Cassell, C., G. Symon (eds.). London: Sage, 1998. 30. Lusch, R.F. and Brown, J.R. Interdependency, contracting and relational behavior in

marketing channels. Journal of Marketing 60(4): 19-38 (1996).

31. March, J.G. and Olsen, J.P. The Uncertainty of the Past: Organizational Learning under Ambiguity. European Journal of Political Research 3: 147-171 (1975).

32. Matusik, S.F. and Hill, C.W.L. The Utilization of Contingent Work, Knowledge Creation,

and Competitive Advantage. Academy of Management Review 23(4): 680-697 (1998). 33. McDonough III, E.F., Kahn, K.B., and Barczak, G. An investigation on the use of global,

virtual, and colocated new product development teams. Journal of Product Innovation Management 18: 110-120 (2001).

34. Moenaert, R.K. and Caeldries, F. Architectural Design, Interpersonal Communication, and

Learning in R&D. Journal of Product Innovation Management 13: 296-310 (1996). 35. Moenaert, R.K. and Souder, W.E. An Information Transfer Model for Integrating Marketing

and R&D Personnel in New Product Development Projects. Journal of Product Innovation Management 7: 91-107 (1990).

36. Mueller, F. and Dyerson, R. Expert humans or expert organizations? Organization Studies

20(2): 225-256 (1999).

37. Narver, J.C. and Slater, S.F. The effect of a marketing orientation on business profitability. Journal of Marketing 54(October): 20-35 (1990).

38. Nonaka, I. The knowledge-creating company. Harvard Business Review 69(6): 96-104

(1991). 39. Nonaka, I. A Dynamic Theory of Organizational Knowledge Creation. Organization Science

5(1): 14-37 (1994). 40. Nonaka, I and Takeuchi, H. The knowledge creating company: How Japanese companies

create the dynamics of innovation. New York: Oxford University Press, 1995. 41. Nunnally, J.C. Psychometric theory. 2nd ed., New York: McGraw-Hill, 1978. 42. Pinto, M.B., Pinto, J.K., and Prescott, J.E. Antecedents and consequences of project team

cross-functional cooperation. Management Science 39(10): 1281-1297 (1993). 43. Polanyi, M. The tacit dimension. London: Routledge & Kegan Paul, 1966.

44. Sethi, V. and King, W.R. Development of measures to assess the extent to which an

information technology application provides competitive advantage. Management Science 40(12): 1601-1627 (1994).

45. Sitkin, S.B. Learning through failure – the strategy of small losses. Research in

Organizational Behavior 14: 231-266 (1992).

46. Song, X.M. and Parry, M.E. R&D-marketing integration in Japanese high-technology firms: Hypotheses and empirical evidence. Journal of Academy of Marketing Science 21(2): 125-133 (1993).

47. Song, X.M. and Parry, M.E. The determinants of Japanese new product success. Journal of

Marketing Research 34: 64-76 (1997). 48. Song, X.M., Xie, J., and Dyer, B. Antecedents and consequences of marketing managers’

conflict-handling behaviors. Journal of Marketing 64(1): 50-67 (2000). 49. Souder, W.E. Managing new product innovations. Lexington, MA: Lexington Books, 1987.

50. Warkentin, M.E., Sayeed, L., and Hightower, R. Virtual teams versus face-to-face teams: An

exploratory study of a web-based conference system. Decision Sciences 28(4): 975-995 (1997).

51. Winograd, T. and Flores, F. Understanding Computer and Cognition. Reading, MA:

Addison-Wesley, 1986.

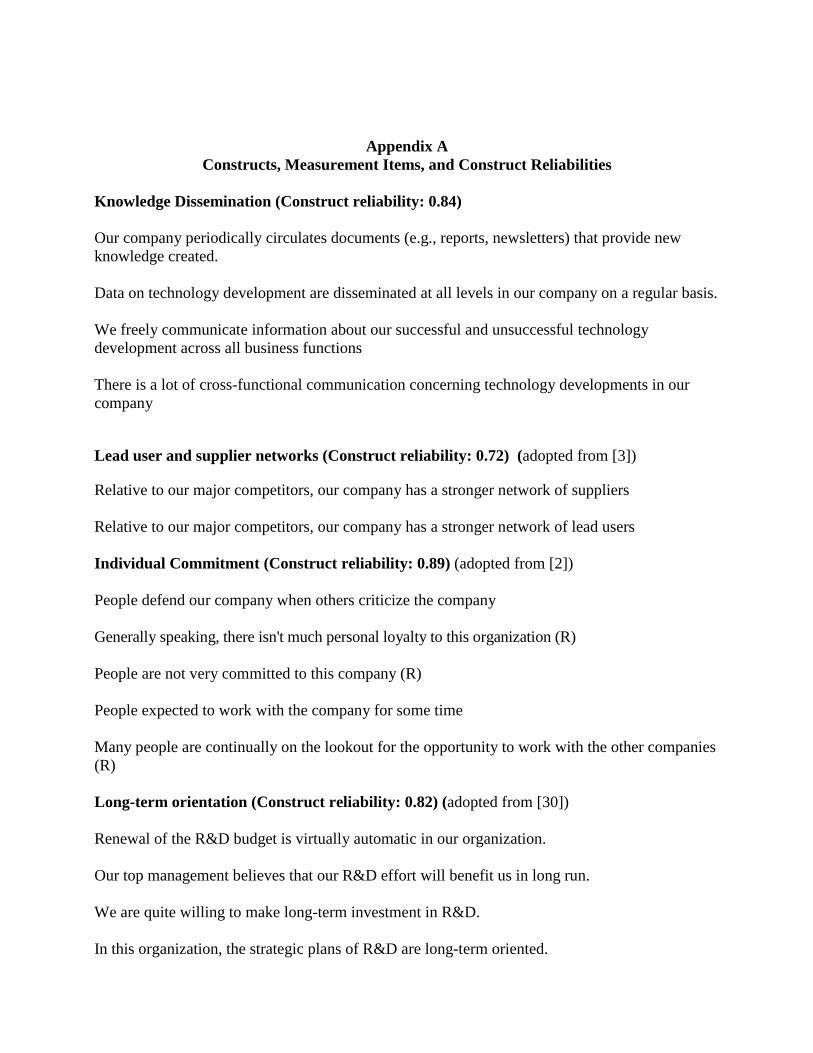
Appendix A Constructs, Measurement Items, and Construct Reliabilities

Knowledge Dissemination (Construct reliability: 0.84) Our company periodically circulates documents (e.g., reports, newsletters) that provide new knowledge created. Data on technology development are disseminated at all levels in our company on a regular basis. We freely communicate information about our successful and unsuccessful technology development across all business functions There is a lot of cross-functional communication concerning technology developments in our company

Lead user and supplier networks (Construct reliability: 0.72) (adopted from [3])

Relative to our major competitors, our company has a stronger network of suppliers Relative to our major competitors, our company has a stronger network of lead users Individual Commitment (Construct reliability: 0.89) (adopted from [2]) People defend our company when others criticize the company Generally speaking, there isn't much personal loyalty to this organization (R) People are not very committed to this company (R) People expected to work with the company for some time Many people are continually on the lookout for the opportunity to work with the other companies (R) Long-term orientation (Construct reliability: 0.82) (adopted from [30]) Renewal of the R&D budget is virtually automatic in our organization. Our top management believes that our R&D effort will benefit us in long run. We are quite willing to make long-term investment in R&D. In this organization, the strategic plans of R&D are long-term oriented.

Organizational Redundancy (Construct reliability: 0.88) (adopted from [23])

Organizational redundancy is a characteristic of our firm. The degree of overlapping of skills and resources in this organization is (0=none; 10=very high) The degree of overlapping of business activities across different divisions/departments in our company is (0=none; 10=very high)

Organizational Crisis (Construct reliability: 0.77) (new items based on field research)

Our top management sometimes intentionally creates organizational crisis We tend to have frequent organizational crisis in this organization Organizational crisis is a characteristic of our firm

Control Variables (adopted from [37]) Supplier power (SPOW) The extent to which the firm is able to negotiate lower prices from its suppliers (0-10 scale) Seller concentration (CONC) In an SBU’s principal served market segment, the percentage of total sales accounted for by the four competitors with the largest sales (including the SBU if appropriate) (0-10 scale) Relative size (RSIZE) The size of an SBU’s sales revenues in its principal served market segment in relation to those of its largest competitor (0-10 scale) Note: (R) indicates that the item was reversed coded.


Recommended