An Empirical Investigation of Decision-Making Satisfaction in Web-Based Decision Support Systems by Pratyush Bharati University of Massachusetts, Boston and Abhijit Chaudhury 1 Bryant College, RI Abstract Web-based information systems are increasingly being used for decision support applications. However few empirical studies have been conducted on web-based decision support systems (DSS). This experimental research endeavors to understand factors that impact decision-making satisfaction in web based decision support systems. Using structural equation modeling approach, the analysis reveals that information quality and system quality influence decision-making satisfaction, while information presentation does not have an effect on decision-making satisfaction. Keywords : Decision-Making Satisfaction, Web-Based Decision Support System, Information Quality, System Quality, e-Commerce, e-Business. Paper Reference: Bharati, P. and A. Chaudhury (2004), “An Empirical Investigation of Decision-Making Satisfaction in Web-Based Decision Support Systems”, Decision Support Systems, Vol. 37, No. 2, pp. 187-197. Copyright Information: Please use this paper in accordance with the copyright information mentioned on the publisher website at: http://authors.elsevier.com/home.html 1 Corresponding Author: Abhijit Chaudhury 1150 Douglas Pike, Bryant College, Smithfield, RI 02917 Phone: 401 232 6418 Fax: 401 232 6438 E-mail: [email protected]
Transcript
An Empirical Investigation of Decision-Making Satisfaction in Web-Based DecisionSupport Systems
byPratyush Bharati
University of Massachusetts, Bostonand
Abhijit Chaudhury1
Bryant College, RI
AbstractWeb-based information systems are increasingly being used for decision supportapplications. However few empirical studies have been conducted on web-based decisionsupport systems (DSS). This experimental research endeavors to understand factors thatimpact decision-making satisfaction in web based decision support systems. Usingstructural equation modeling approach, the analysis reveals that information quality andsystem quality influence decision-making satisfaction, while information presentationdoes not have an effect on decision-making satisfaction.
Keywords:Decision-Making Satisfaction, Web-Based Decision Support System, InformationQuality, System Quality, e-Commerce, e-Business.
Paper Reference:Bharati, P. and A. Chaudhury (2004), “An Empirical Investigation of Decision-MakingSatisfaction in Web-Based Decision Support Systems”, Decision Support Systems, Vol.37, No. 2, pp. 187-197.
Copyright Information: Please use this paper in accordance with the copyrightinformation mentioned on the publisher website at: http://authors.elsevier.com/home.html
1 Corresponding Author: Abhijit Chaudhury1150 Douglas Pike, Bryant College, Smithfield, RI 02917Phone: 401 232 6418Fax: 401 232 6438E-mail: [email protected]
An Empirical Investigation of Decision-Making Satisfaction inWeb-Based Decision Support Systems
Introduction
Web-based technologies are having a major impact on design, development and
implementation processes for all types of decision support systems (DSS) [4] [10]. For
instance, web technologies are being utilized for the development of DSS tools by leading
developers of decision support technologies such as SAS Inc. [17]. Oracle is encouraging
its customers to port their DSS applications, such as data mining, customer relationship
management (CRM) and online analytic processing (OLAP) systems, to a web-based
environment using their application server Oracle 9Ai [42]. Similarly, real-time data fed
from manufacturing plants are now helping floor managers make decisions regarding
production adjustment to ensure that high-quality products are produced and delivered
[30].
Web-based decision support systems are being employed by organizations as decision
aids for employees as well as customers. A common usage of web based DSS has been to
assist customers configure product and service according to their needs. These systems
allow individual customers to design their own products by choosing from a menu of
attributes, components, prices and delivery options. For example, on web-sites of most
desktop computer makers (www.dell.com, www.compaq.com and www.ibm.com),
individuals can start with a basic configuration defined by a processor model and speed,
and then go on to specify the full configuration with their choice of hard-drive size,
2
memory, and add-ons such as CD-ROMs, multi-media, monitors, and printers. Similar
instances can be found in: 1) the apparel industry (www.landsend.com, www.blair.com,
www.weddingchannel.com), which allows a user a virtual model to design one’s dress
before ordering; 2) in the finance industry (www.calvertgroup.com), which allows the
user to try out various retirement saving plans; and 3) in the toys industry
(www.vermontteddybear.com), where children can custom design the teddy bears they
desire with respect to color, size and coat-type.
These web-based DSS self-services are being employed in various ways. Carpoint
(carpoint.msn.com) has a web-Based DSS in which users can search a used car database
and then use the Kelley Blue Book to establish a standard price for that particular make
and model. The comparison feature permits pair-wise comparison of new car alternatives
across multiple pre-specified attributes. In the health care industry, drkoop.com has a
drug checker application to help make certain the medications a person takes do not
interact with each other or with food to cause an adverse reaction. At drkoop.com, users
also can use health calculators on topics such as stress, nutrition and fitness [43].
Ba, Kalakota, and Whinston [4] originally introduced and conceptualized the role of the
web for decision support systems. Power [44] defined a web-based decision support
system as a computerized system that delivers decision support information or decision
support tools to a manager or business analyst using a "thin-client" Web browser like
Netscape Navigator or Internet Explorer. This paper is one of the earliest examinations of
factors that lead to the satisfactory usage and implementation of web-based DSS. It is
based on the IS success model of DeLone and McLean [19]. The model has been
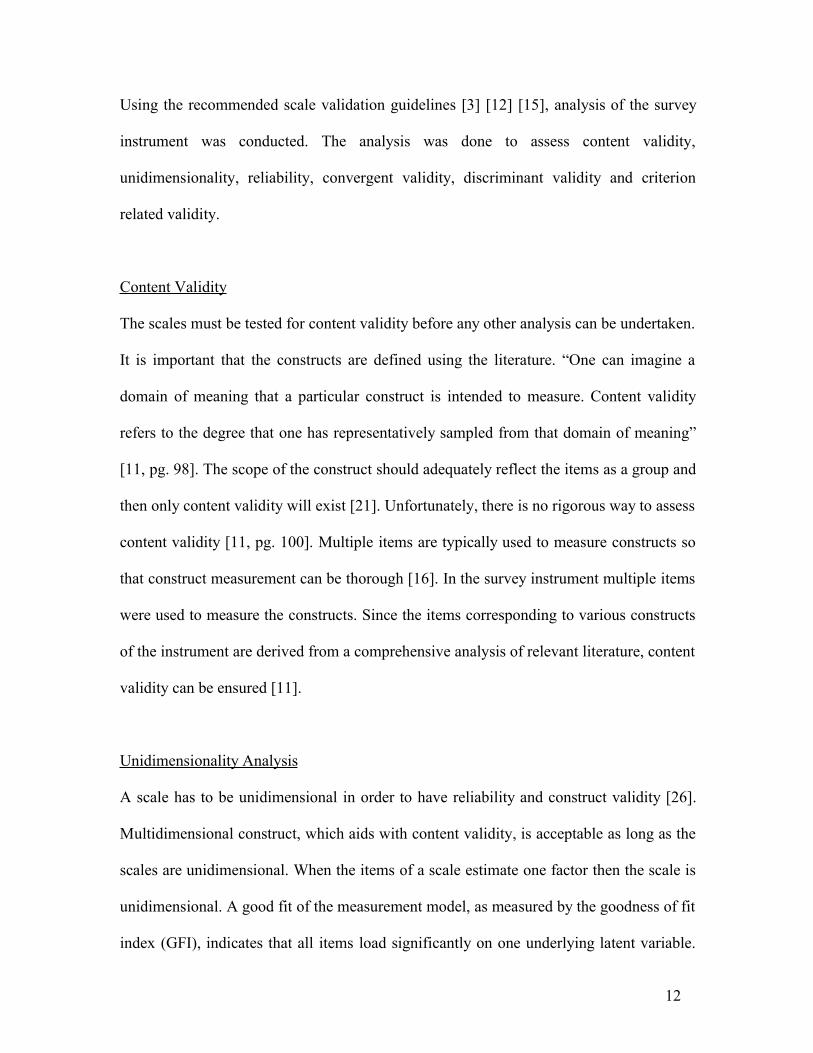
3
validated using confirmatory factor analysis, unidimensionality analysis, and reliability
analysis, as well as convergent, discriminant, content and criterion-related validity tests.
The research uses a structural equation model (SEM) to identify the factors that affect
decision-making satisfaction in web-based DSS. The hypotheses of the model are tested
through laboratory experiments and supported/rejected on the basis of statistical analysis.
This paper is organized as follows. The next section presents literature review. The
section thereafter describes the conceptual model underlying the research. Then, the
methodology and data analysis are presented in subsequent sections. Finally, the
implications of the study and suggestions for future research are presented in the last
section.
Literature Review
The web has now become the platform of choice for building DSS. The present research
investigates these web-based decision support systems, with a focus on factors that affect
decision-making satisfaction in web-based DSS. The field of DSS began with the seminal
work of Bonczek, Holsapple, and Whinston [13], who conceptualized the DSS as
consisting of three components - user interface, a knowledge processing system and a
knowledge base. This model led to a wide stream of research in the area of DSS, resulting
in many applications in the industry. Most DSS applications today are located on a single
machine or are operating in a client server environment.
DSS on the web has precipitated three major changes to the environment where DSS is
being employed: a change in the user community, a change in problem domains, and a
4
change in the underlying technology architecture. DSS applications have generally been
implemented in commercial environments where users are employees of the firm. With
the advent of web-based DSS, the user community is no longer limited to the managers
and experts working on business-related problems. The examples cited in the beginning
of the paper referred to web-based DSS targeted to general consumers using DSS for
consumer decision-making. Similarly, the problem domain is being extended to interest
communities such as consumers, students, children, and patients.
The new web platform has brought both promises and constraints. We are no longer
limited to a single knowledge base nor does the knowledge processing need to take place
locally, as DSS was first conceptualized in the Bonczek, Holsapple, and Whinston [13]
model. However, the limitation of the bandwidth has an impact on the richness of the
interaction, which has consequences on how processing is shared between the server and
the browser-based client-end. These changes in DSS have made it incumbent on us DSS
researchers to reexamine the factors that influence the efficacy of DSS in this new
environment.
As people become computer-savvy, web-based decision support systems have the
potential to aid them in making better decisions about products and services. Another
example of a web-based DSS for customers is found at Landsend.com, where customers
can choose the kind of chino pants they want and also build a virtual model of their
bodies and then see how the chino pants looks on their virtual body [47]. These and other
self-service information technologies that aid in decision-making are becoming quite
prevalent. These web-based decision support systems are being used, but there is very
5
little research that has evaluated these systems from the perspective of users. Thus, more
studies are needed that focuses on evaluating web-based decision support systems.
Information systems research has used cost-benefit analysis, system usage estimation and
user satisfaction [36] [48] to measure IS effectiveness. IS effectiveness has been
conceptualized and operationalized using several instruments [19] [27] [31] [34] [41]
[48] [52]. Communication theory has also been used to understand the impact of
information systems at the individual level. The IS success taxonomy [19], which is
based on Mason’s [39] theory, employs this approach.
Mason [39] used the communication model of Shannon and Weaver [46] as the basis for
his model. The basic elements of the model are receipt of the information, the evaluation
of the information, and the application of the information leading to a change in recipient
behavior and a change in the system performance. Further, Mason [39] has illustrated the
classes of output of an information system as technical level, semantic level and influence
level.
Building on the work of Mason [39], DeLone and McLean [19] have developed a
taxonomy of information systems success. According to DeLone and McLean [19], the
concept of levels of output from communication theory demonstrates the serial nature of
information (i.e. a form of communication). The information system creates information,
which is communicated to the recipient. The recipient is or is not influenced by the
information. The information flows through a series of stages from its production through
its use or consumption to its influence on individual and/or organizational performance.
6
DeLone and McLean’s [19] IS success model suggests system quality and information
quality singularly and jointly affect both use and user satisfaction. Use and user
satisfaction are direct antecedents of individual impact. Lastly, the impact on individual
performance should eventually have some organizational impact. This research model is
partially based on the IS success model. The paper employs the constructs at the technical
level, namely system quality and information quality, and investigates the influence of
web-based DSS at the individual level, specifically on decision-making satisfaction.
Conceptual Model
The IS success model [19] explains the impact of IS at the individual and organizational
levels. This research model (Figure 1) builds on the constructs of system and information
quality and their impact on user satisfaction, as it is partly based on the IS success model.
The dependent construct in the model is “decision-making satisfaction.” The dependent
variable is directly and positively influenced by three independent constructs: system
quality, information quality and information presentation.
Dependent Construct: Decision-Making Satisfaction
Decision-making satisfaction scrutinizes the ability of a system to support decision-
making and problem-solving activities. The items in this construct determine whether the
system supports the individual in recognizing problems, structuring problems, and
making decisions related to the goal of controlling a business process [23].
7
In the information system framework proposed by Chervany, Dickson, and Kozar [14],
decision effectiveness was used. Other measures such as decision confidence [28] [29]
[53] and time to decision [6] [7] [32] have also been employed. The construct uses
decision effectiveness and decision confidence for the decision-making satisfaction
construct.
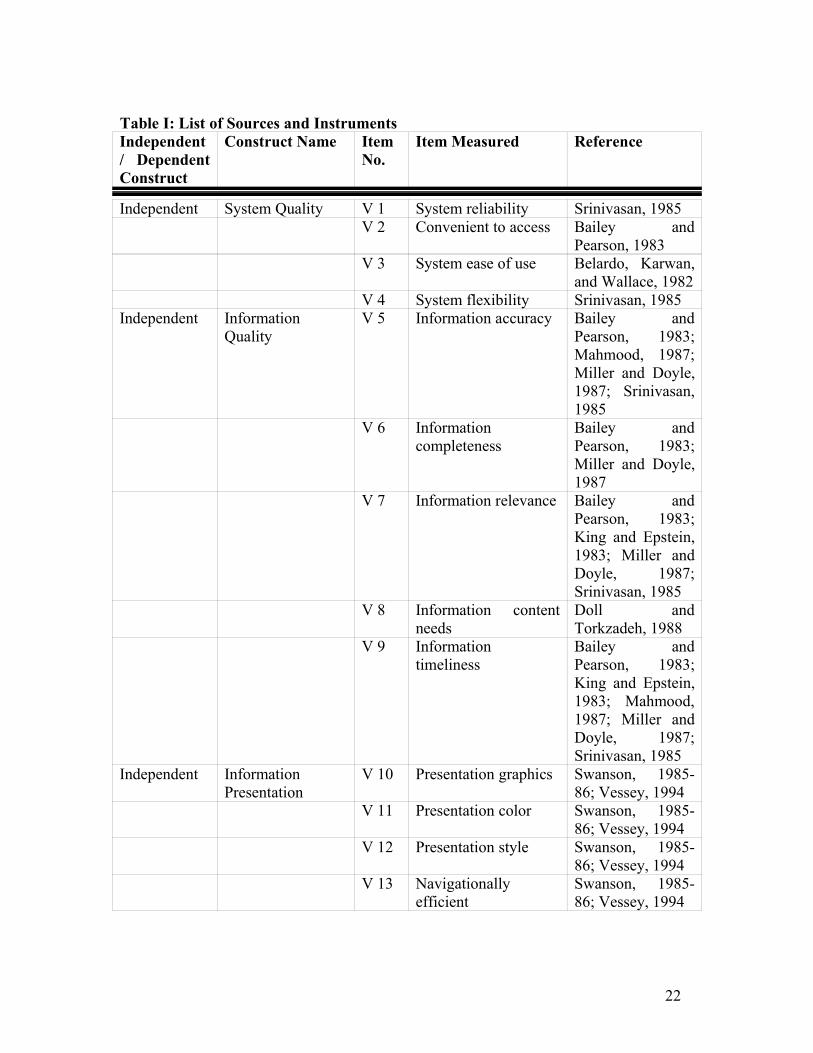
Independent Construct: System Quality
System quality is manifested in the system’s overall performance, which can be measured
by individual perceptions of this quality. This quality is a manifestation of system
hardware and software. Perceptual measures such as ease of use [6], convenience of
access [5], system reliability and flexibility [48] have been used in previously tested
survey instruments to measure system quality. In this study, these four measures have
been adopted for the system quality construct.
Hypothesis 1: System quality will positively contribute to decision-making satisfaction.
Independent Construct: Information Quality
Quality of information influences decision-making satisfaction. The decision-maker
estimates the value of an information system. Gallagher [22] has used user perception of
the value of the information system to determine the information quality of the system.
Another study [37] underscores the perceived importance and usableness of information.
In some studies, information quality has not been considered separately, but as an integral
part of user satisfaction [5] or user information satisfaction [33]. The measures that have
8
been employed for information quality are information accuracy [5] [38] [41] [48],
information completeness [5] [41], information relevance [5] [35] [41] [48], information
content needs [20] and information timeliness [5] [35] [38] [41] [48]. These five
measures have been used for the information quality construct.
Hypothesis 2: Information quality will positively contribute to decision-making
satisfaction.
Independent Construct: Information Presentation
Information presentation is an area of research that examines how information is
displayed. Numerous studies have looked at factors such as display formats, color, and
graphs versus tables and how these factors aid in decision-making [51]. Improperly
designed screens and interfaces can cause users unnecessary work and negatively
influence their decision-making environment. Evaluation of the interface should include
characteristics of the interface in terms of presentation, format and processing efficiency
[49]. The measures of information presentation are graphics, color, presentation style, and
navigational efficiency.
Hypothesis 3: Information presentation will positively contribute to decision-making
satisfaction.
Experimental Design and Data Collection
9
The survey was operationalized using measures of several instruments borrowed from
research literature (Table I). A small group of fifteen undergraduate students participated
in the pre-test of the survey. Comments were received from the participants and the
survey was modified accordingly. The survey instrument was administered in a laboratory
setting, which had twenty four PCs running wintel platform. The subjects were senior
year business school undergraduates and graduate MBA students at two different
Universities.
The researcher/s introduced the experiment to all the subjects, who had voluntarily agreed
to take part in the experiment. A sheet with the experimental procedure was handed out to
the subjects. Each subject was randomly assigned a website with a web-based DSS,
which was used to aid the customer in making a decision. These sites were owned by
different firms but were of a very similar nature. The subjects completed all the tasks as
per the procedure. After the procedure was completed each subject filled the survey
questionnaire. The total sample for the experiment was 210.
Data Analysis
The study analyzed the data using the structural equation modeling (SEM) approach.
Structural equation modeling allows the specification of measurement errors within a
broader context of assessing measurement properties, and subscribes to a causal –
indicator model – where the operational indicators are reflective of the unobserved
theoretical construct. It has been suggested in the past that the structural equation model
should not have too many indicator variables and about 20 indicator variables or less is an
ideal number [9]. Following this recommendation, the framework has less than 20
10
indicator variables. This research is a confirmatory study as it is investigating a well-
established theory-base. As a covariance-based structural equation modeling technique or
package like AMOS should be used as confirmatory and not as an exploratory method
[25], the study has applied an appropriate technique for data analysis.
Before the data can be analyzed and results can be discussed, the extent to which the
operational indicators map to their higher order constructs needs to be ascertained. In
order to validate the construct, the different tests that have been conducted are:
V 15 Decision effectiveness Chervany,Dickson, andKozar, 1972
Table II: Tests for Unidimensionality, Reliability and Convergent ValidityNo.
Construct No. ofindicators
Unidimensionality[Goodness of Fit Index (GFI)]
Reliability[Cronbach’s ]
ConvergentValidity[BentlerBonnet ]
1. System Quality 4 .99 .73 .982. Information
Quality5 .97 .85 .96
3. Informationpresentation
4 .92 .83 .91
4. Decision-makingsatisfaction*
- SystemQuality
- Information Quality
- Informationpresentation
2
.95
.96
.92
.83
.93
.95
.92
* A combined model was run for this construct.
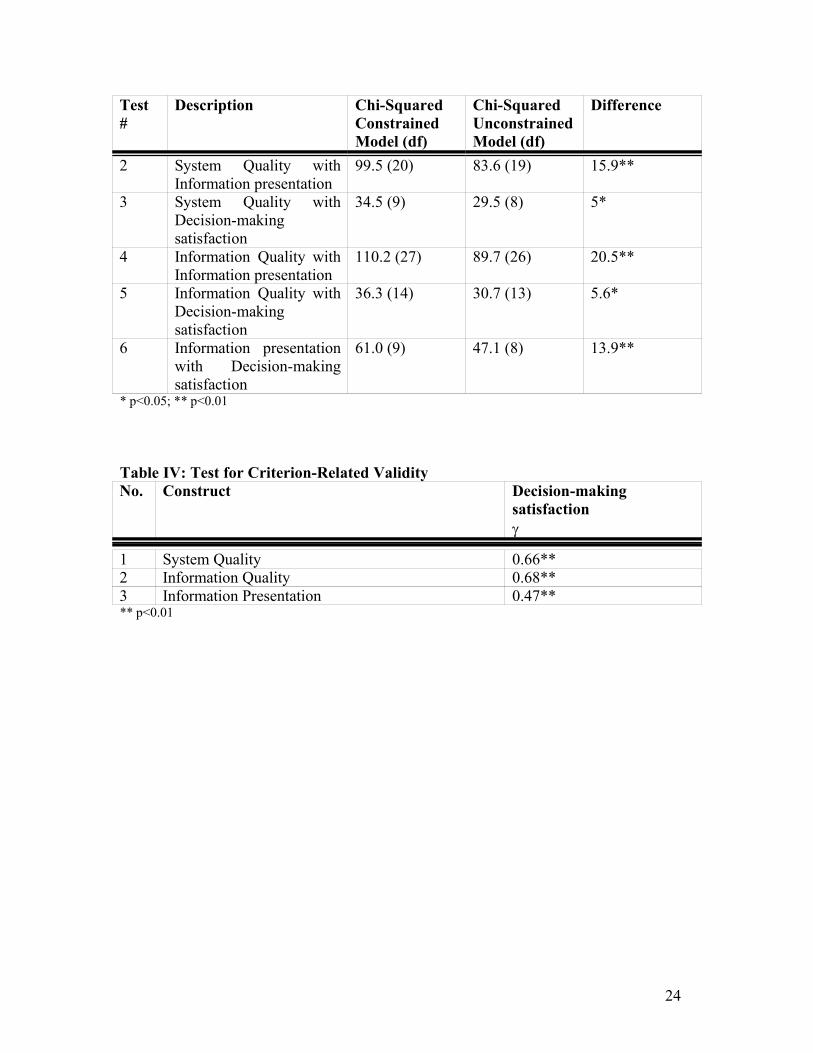
Table III: Test for Discriminant ValidityTest#
Description Chi-SquaredConstrainedModel (df)
Chi-SquaredUnconstrainedModel (df)
Difference
1 System Qualitywith Information Quality
120.9 (27) 113.4 (26) 7.5**
23
Test#
Description Chi-SquaredConstrainedModel (df)
Chi-SquaredUnconstrainedModel (df)
Difference
2 System Quality withInformation presentation
99.5 (20) 83.6 (19) 15.9**
3 System Quality withDecision-makingsatisfaction
34.5 (9) 29.5 (8) 5*
4 Information Quality withInformation presentation
110.2 (27) 89.7 (26) 20.5**
5 Information Quality withDecision-makingsatisfaction
36.3 (14) 30.7 (13) 5.6*
6 Information presentationwith Decision-makingsatisfaction
61.0 (9) 47.1 (8) 13.9**
* p<0.05; ** p<0.01
Table IV: Test for Criterion-Related ValidityNo. Construct Decision-making
satisfaction
1 System Quality 0.66**2 Information Quality 0.68**3 Information Presentation 0.47**** p<0.01
24
References
[1] S.L. Ahire, D.Y. Golhar, and A.M. Waller, Development and Validation of TQMImplementation Constructs, Decision Science 27, No.1 (1996), [pp. 23-56].
[2] S. Albrecht, Service, Service, Service (Adams Media Corporation, Holbrook, MA,1994).
[3] J.C. Anderson, and D.W. Gerbing, Structural Equation Modeling in Practice: AReview and Recommended Two-Step Approach, Psychological Bulletin 103, No.3(1988), [pp. 411-433].
[4] S. Ba, A.B. Kalakota, Whinston, Executable Documents DSS, Proceedings of 3rdInternational Conference on DSS, (Hong Kong, 22-23 June 1995).
[5] J. Bailey, and S. Pearson, Development of a Toll for Measuring and Analyzing UserSatisfaction, Management Science 29, No.5 (1983), [pp. 530-545].
[6] S. Belardo, K.R. Karwan, and W.A. Wallace, DSS Component Design Through FieldExperimentation: An Application to Emergency Management, Proceedings of the ThirdInternational Conference on Information Systems (Dec. 1982), [pp. 93-108].
[7] I. Benbasat, A.S. Dexter, and P.S. Masulis, An Experimental Study of theHuman/Computer Interface, Communications of the ACM 24, No.11 (1981), [pp. 752-762].
[8] P.M. Bentler, and D.G. Bonett, Significance Tests and Goodness of Fit in the Analysisof Covariance Structure, Psychological Bulletin 88 (1980), [pp. 588-606].
[9] P.M. Bentler, and C. Chou, Significance Tests and Goodness-of-Fit in the Analysis ofCovariance Structures, Social Methods and Research 16, (1987), [pp. 78-117].
[10] H.K. Bhargava, and D.J. Power, Decision Support Systems and Web Technologies:A Status Report, Seventh Americas Conference on Information Systems (2001).
[11] G. Bohrnstedt, Measurement, in: Handbook of Survey Research, P. Rossi, J. Wrightand A. Anderson, Eds., (San Diego, Academic Press, 1983), [pp. 98].
[12] K.A. Bollen, Structural Equations with Latent Variables, (New York, John Wiley,1989).
[13] R.H. Bonczek, C.W. Holsapple, and A.B. Whinston, Foundations of DecisionSupport Systems, Academic Press (May 1981).
[14] N. L. Chervany, G.W. Dickson, and K. Kozar, An Experimental Gaming Frameworkfor Investigating the Influence of Management Information Systems on Decision
25
Effectiveness, MISRC Working Paper No. 71-12, (Management Information SystemsResearch Center, University of Minnesota, Minneapolis, MN, 1972).
[15] W.W. Chin, Issues and Opinion on Structural Equation Modeling, MIS Quarterly 22,No.1 (1998), [pp. 7-16].
[16] G. Churchill, A Paradigm for Developing Better Measures of Marketing Constructs,Journal of Marketing Research 16 (1979), [pp. 64-73].
[17] M. Cohen, C.B. Kelly, and A.L. Medaglia, Decision Support with Web-EnabledSoftware, Interfaces, (Mar-Apr. 2001).
[18] L. J. Cronbach, Coefficient Alpha and Internal Structure of Tests, Psychometrica 16(1951), [pp. 297-334].
[19] W.H. DeLone, and, E. R. McLean, Information Systems Success: The Quest for theDependent Variable, Information Systems Success 3, No. 1 (Mar. 1992), [pp. 60-95].
[20] W.J. Doll, and G. Torkzadeh, The Measurement of End-User ComputingSatisfaction, MIS Quarterly 12, No.2, (1988), [pg. 259-274].
[21] S.C. Dunn, R.F Seaker, M.A. Waller, Latent Variables in Business LogisticsResearch: Scale Development and Validation, Journal of Business Logistics 15, No.2(1994), [pp. 145-172].
[22] C.A. Gallagher, Perceptions of the Value of a Management Information System,Academy of Management Journal 17, No.1 (Mar. 1974), [pp. 46-55].
[23] E.J. Garrity, and G.L. Sanders, Dimensions of Information Systems Success in:Information Systems Success Measurement, Eds. E. J. Garrity and G. L. Sanders, (IdeaGroup Publishing, Hershy, PA, 1998).
[24] R.D. Gatewood, and H. S. Field, Human Resource Selection, (The Dryden PressChicago, IL, 1990).
[25] D. Gefen, D. W. Straub, and M.C. Boudreau, Structural Equation Modeling andRegression: Guidelines For Research Practice, Communications of the Association forInformation Systems 4, No.7 (Oct. 2000), [pp. 1-57].
[26] D. Gerbing, and J. Anderson, An Updated Paradigm for Scale DevelopmentIncorporating Unidimensionality and Its Assessment, Journal of Marketing Research 25(1988), [pp. 186-192].
[27] D. Goodhue, User evaluations of MIS success: what are we really measuring? in: J.F. Nunamaker and R. H. Sprague, Proceedings of the Twenty-Fifth Annual HawaiiInternational Conference on Information System Sciences, IEEE Computer Society Press4, No.1 (1992), [pp. 303-314].
26
[28] M.D. Goslar, G.I. Green, and T.H. Hughes, Decision Support Systems: An EmpiricalAssessment for Decision Making, Decision Sciences 17, No.1 (1986), [pp. 79-91].
[29] H.G. Guental, N. Surprenant, and K. Bubeck, Effectively Utilizing Computer-AidedDesign Technology: The Role of Individual Difference Variables, Proceedings of theFifth International Conference on Information Systems (Dec. 1984), [pp. 21-30].
[31] S. Hamilton, and N.L. Chervany, Evaluating Information System Effectiveness partI: Comparing Evaluation Approaches, MIS Quarterly 5, No.3 (1981), [pp. 55-69].
[32] C.T. Hughes, Relationships between Demographics, Training etc. in a DSSEnvironment, Information and Management 12, No.5 (1987), [pp. 257-261].
[33] J. Iivari, User Information Satisfaction (UIS) Reconsidered: An Information Systemas the Antecedent of UIS, Proceedings of the Eighth International Conference onInformation System (Dec. 1987), [pp. 56-73].
[34] B. Ives, and M.H. Olson, User involvement and MIS success: A review of research,Management Science 30, No.5 (1984), [pp. 586-603].
[35] W.R. King, and B.J. Epstein, Assessing Information System Value, DecisionSciences 14, No.1 (Jan. 1983), [pp. 34-45].
[36] J.L. King, and E.L. Rodriguez, Evaluating management information systems, MISQuarterly 2, No.3 (1978), [pp. 43-51].
[37] D.F. Larcker, and V.P. Lessig, Perceived Usefulness of Information: A PsychometricExamination, Decision Sciences 11, No.1 (Jan. 1980), [pp. 121-134].
[38] M.A. Mahmood, Systems Development Methods – A Comparative Investigation,MIS Quarterly 11, No.3 (Sept. 1987), [pp. 293-311].
[39] R.O. Mason, Measuring Information Output: A Communication Systems Approach,Information and Management 1, No.5 (Oct. 1978), [pp. 219-234].
[40] R.L. Matsueda, Testing Control Theory and Differential Association: A CausalModeling Approach, American Sociological Review 41 (1982), [pp. 489-504].
[41] J. Miller, and B.A. Doyle, Measuring Effectiveness of Computer Based InformationSystems in the Financial Services Sector, MIS Quarterly 11, No.1 (Mar. 1987), [pp. 107-124].
[42] Oracle White Paper: Oracle 9i Application Server (Dec. 2001).
27
[43] D.J. Power, Web-Based and Model-Driven Decision Support Systems: Concepts andIssues, Proceedings of the Americas Conference on Information Systems (2000), [pp.352-355].
[44] D. J. Power, Web-Based Decision Support Systems, The On-Line Executive Journalfor Data-Intensive Decision Support 2, No.34 (Aug.1998).
[45] T. Ravichandran, and, A. Rai, Total Quality Management in Information SystemsDevelopment: Key Contructs and Relationships, Journal of Management InformationSystems 16, No.3 (Winter 1999), [pp. 124-155].
[46] C.E. Shannon, and W. Weaver, The Mathematical Theory of Communication(University of Illinois Press, Urbana, IL, 1949).
[47] A.J., Slywotzky, C.M. Christensen, R. S. Tedlow, and N. G. Carr, The Future ofCommerce, Harvard Business Review (Jan. – Feb. 2000).
[48] Srinivasan, A., Alternative Measures of System Effectiveness: Associations andImplications, MIS Quarterly 9, No.3 (Sept. 1985), [pp. 243- 253].
[49] E.B. Swanson, A Note of Informatics, Journal of Management Information Systems2, No.3 (1985-86), [pp. 86-91].
[50] N. Venkatraman, Strategic Orientation of Business Enterprises: The Construct,Dimensionality, and Measurement, Management Science 35, No.8 (1989), [pp. 942-962].
[51] I. Vessey, , The Effect of Information Presentation on Decision Making: A Cost-Benefit Analysis, Information and Management 27 (1994), [pp. 103-119].
[52] R. Zmud, Individual difference and MIS success: A review of the empiricalliterature, Management Science 25, No.10 (1979), [pp. 966-979].
[53] R. Zmud, E. Blocher, and R.P. Moffie, The Impact of Color Graphic Report Formatson Decision Performance and Learning, Proceedings of the Fourth InternationalConference on Information Systems (Dec. 1983), [pp. 179-193].
28
Author Biographies
Pratyush Bharati: Pratyush Bharati is an assistant professor in the Management Science
and Information Systems department of College of Management at the University of
Massachusetts. He received his Ph. D. from Rensselaer Polytechnic Institute. His present
research interests are in: management of IT for service quality, diffusion of e-commerce
technologies in small and medium sized firms and web-based decision support systems.
His research has been published in several international journals including
Communications of the ACM. He is a member of Association of Computing Machinery
and Association of Information Systems.
Abhijit Chaudhury: Dr. Abhijit Chaudhury is a Professor of Management Information
Systems in Bryant College. He received his bachelor’s and master’s degree in
Engineering. He has a PhD in Information Systems from Purdue University. He is a very
active researcher with around 40 papers and presentations in the US in last 10 years. Dr.
Chaudhury has taught at the University of Texas, Austin, the Babson College, the
University of Massachusetts and the Bentley College. His research has been published in
several journals such as: Information Systems Research, Communications of ACM,
several transactions of IEEE, and Journal of Management Information systems. He is an
author of a textbook titled: E-Commerce and E-Business Infrastructure, published by
McGraw-Hill Publishers. Another two books of his on Mobile-Commerce and Business
Modeling have been published by Kluwer Publishers.