University of New Mexico UNM Digital Repository SHRI Publications Southwest Hispanic Research Institute 6-1-1993 An Empirical Investigation of Discrimination in the Hispanic Mortgage Market. Gonzalo E. Martinez Metzler Follow this and additional works at: hps://digitalrepository.unm.edu/shri_publications is Working Paper is brought to you for free and open access by the Southwest Hispanic Research Institute at UNM Digital Repository. It has been accepted for inclusion in SHRI Publications by an authorized administrator of UNM Digital Repository. For more information, please contact [email protected]. Recommended Citation Martinez Metzler, Gonzalo E.. "An Empirical Investigation of Discrimination in the Hispanic Mortgage Market.." (1993). hps://digitalrepository.unm.edu/shri_publications/42
Transcript
University of New MexicoUNM Digital Repository
SHRI Publications Southwest Hispanic Research Institute
6-1-1993
An Empirical Investigation of Discrimination in theHispanic Mortgage Market.Gonzalo E. Martinez Metzler
Follow this and additional works at: https://digitalrepository.unm.edu/shri_publications
This Working Paper is brought to you for free and open access by the Southwest Hispanic Research Institute at UNM Digital Repository. It has beenaccepted for inclusion in SHRI Publications by an authorized administrator of UNM Digital Repository. For more information, please [email protected].
Recommended CitationMartinez Metzler, Gonzalo E.. "An Empirical Investigation of Discrimination in the Hispanic Mortgage Market.." (1993).https://digitalrepository.unm.edu/shri_publications/42
UNIVERSITY OF NEW MEXICO, ALBUQUERQUE, NEW MEXICO 87131
Southwest Hispanic Research Institute
Maurice Kivlighan
Maurice Kivlighan
Maurice Kivlighan
Center for Regional Studies #103 Summer 1993 AN EMPIRICAL INVESTIGATION OF DISCRIMINATION IN THE HISPANIC MORTGAGE MARKET By Gonzalo E. Martinez Metzler The University of New Mexico
Maurice Kivlighan
Maurice Kivlighan
Maurice Kivlighan
Maurice Kivlighan
Maurice Kivlighan
Maurice Kivlighan
Maurice Kivlighan
Maurice Kivlighan
Maurice Kivlighan
Maurice Kivlighan
Center for Regional Studies #103 Summer 1993
AN EMPIRICAL INVESTIGATION OF DISCRIMINATION IN THE HISPANIC MORTGAGE MARKET
By
Gonzalo E. Martinez Metzler The University of New Mexico
WORKING PAPER SERIES
Southwest Hispanic Research Institute The University of New Mexico Albuquerque, NM 87131-1036
(505)277-2965
Acknowledgments: This research was supported by a grant from the Center for Regional Studies at the University of New Mexico.
Published and disseminated by the Southwest Hispanic Research Institute as part of an ongoing project to stimulate research focused on Southwest Hispanic Studies. Copies of this working paper or any other titles in the publication series may be ordered at cost by writing to the address indicated above.
ACKNOWLEDGEMENTS
I would like to thank the Center for Regional Studies
for their financial support and professors Alberto Davila,
Peter Gregory and Richard Santos for all their support
during this investigation. I would especially like to thank
Amy Goodwin for her encouragement and inspiration.
i
ii
ABSTRACT
An Empirical Investigation of Discrimination in the Hispanic
Mortgage Market
Gonzalo E. Martinez Metzler
Junior College Degree, Northwest College, 1987
B.A. Economics, University of New Mexico, 1989
M.A. Economics, University of New Mexico, 1993
This Master's Thesis empirically investigates whether
Hispanics are discriminated against in the mortgage market.
The use of the 1989 Metropolitan file of the American
Housing Survey allows me to test the effects of borrower
race and default risk in mortgage lending. The empirical
analysis is based on a probit model of whether Hispanics,
blacks and non-Hispanic whites households obtain FHA or
conventional mortgages. FHA mortgages are fully insured and
generally require a lower downpayment, but are typically
more expensive. Given a choice between FHA and conventional
mortgages, borrowers will prefer the relatively cheaper
The purpose of this Master's thesis is to empirically
investigate whether Hispanics are discriminated against in
the housing market. Of course, it would appear housing
discrimination does exist for Hispanics. But, does this
finding hold up after account is taken of non-discrimination
factors?
The use of the 1989 Metropolitan file of the American
Housing Survey (AHS} will allow me to test the effects of
borrower race and default risk in mortgage lending for
Hispanics, blacks, and non-Hispanic whites across the
nation. Consistent with Gabriel and Rosenthal's (1991)
mortgage lending study that used FHA mortgages as a proxy
for default risk, the empirical analysis is based on a
probit model of whether Hispanics, blacks and non-Hispanic
whites borrowers obtain FHA or conventional mortgages 1•
1 FHA offers 5% downpayment loans while most conventional lenders require at least 10%. FHA, however, also requires a 3.8% mortgage insurance premium, whereas conventional mortgages with a loan-to-value ratios above 80% generally require less private mortgage insurance, and those loans with ratios below 80% do not require mortgage insurance.
3
FHA mortgages are fully insured and generally require a
lower downpayment, but are typically more expensive. Given a
choice between FHA and conventional loans, households will
will tend to be credit constrained in the conventional
market. After controlling for various socioeconomic
characteristics of Hispanic households, any remaining race
effect in the probit model may be reflective of events
unrelated to default risk.
The thesis is organized as follows: The relevant
literature on housing discrimination is discussed in Chapter
I. A statistical background on the Hispanic housing problems
is presented in Chapter II. The analytical framework to test
for the existence of credit discrimination in the Hispanic
mortgage market is given in Chapter III. Data and variables
descriptions are given in Chapter IV. Results, and
conclusions are presented in Chapters 5 and 6 respectively.
Appendix I introduces a theoretical model that explains the
impact of collateral requirements on credit rationing. In
Appendix II, variables description and statistical results
are presented, followed by the references.
4
II. BACKGROUND
The Federal Housing Administration (FHA) created by the
. enactment of the National Housing Act of 1934, and the
Veterans Administration's (VA) loan programs authorized by
the Servicemen's Readjustment Act of 1944 were designed to
increase homeownership rates among middle income households.
By insuring the mortgages against default, these two federal
programs decrease the default risk to a lender thus making
mortgages available at lower interest rates, for longer
periods of time and with lower monthly payments to the
borrower.
FHA loans are available to all households and are fully
insured carrying mortgages insurance premiums equal to 3.8%
of loan value. Also, the FHA requires a minimum 3% to 5%
downpayment, and limits the loan size to a ceiling which
varies from$ 67,500 to$ 124,875 for cities with high
housing costs. On the other hand, conventional lending
institutions normally require mortgage insurance only to
loans with less than 20% downpayment (U.S. GPO, 1990).
The VA Loan Guaranty Program provides housing credit
only to veterans and service personnel. VA loans are
guaranteed to a maximum of $27,500 in the case of default.
Additionally, the minimum downpayment ratio required by VA
loans in many cases is set to zero. For example in fiscal
year 1981 over 67% of the veterans purchasing a home with a
guaranteed loan were able to obtain zero downpayment loans.
Also, VA mortgages require mortgage insurance at only 1% of
loan value, but entail no other cost to the household
(Veterans Administration, 1982).
5
Consistent with the Stiglitz and Weiss (1981) model of
credit rationing, borrowers identified as having a higher
probability or cost of default on the basis of race, income,
location or wealth, should be subject to tighter credit
constraints and hence be more likely to obtain non
conventional mortgages, ceteris paribus. The empirical
evidence reveals that the relative number of government
insured mortgages increases in periods of increasing default
risk, as lenders tighten non-price constraints on
conventional loans (Duca and Rosenthal, 1991).
Also, recent studies of racial discrimination in
mortgage markets suggest that minority households are
disadvantaged in terms of (1) mortgage credit availability
(Garza, 1983), (2) the likelihood of minorities owning homes
(Krivo, 1986), (3) racial choices in urban residential
location (Gabriel and Rosenthal, 1989) and (4) the share of
aggregate housing wealth owned by minority households (Long
and Caudill, 1992). Race could also have an impact on the
credit standards for minority borrowers if the expected
default cost for minorities exceed that of white borrowers
6
(Yinger, 1986) 2 •
In addition, extant research suggests that Veterans'
Administration (VA) and conventional mortgage holders have a
significantly different demand responsiveness for housing;
that marginal changes in credit constraints affect housing
demand; and that the Federal Housing Administration (FHA)
lending mitigates the effect of mortgage constraints
(Rosenthal, et al., 1991).
In terms of racial segregation in the urban housing
market, the evidence on the effect of household socio-
economic and demographic characteristics on residential
location indicates that while the location choice of non-
Hispanic whites is sensitive to changes in socio-economic
and demographic characteristics, blacks' location patterns
are little influenced by large simulated changes in
household characteristics. This result may reflect the
absence of racial discrimination against non-Hispanic white
households in the housing market, which would allow for a
wider residential location choice for white relative to
black families (Gabriel and Rosenthal, 1989).
While FHA loans have helped Hispanics purchase their
own homes, the cost associated with it in the form of higher
2 Indeed, these housing problems might provide the basis for other forms of segregation, and can mean distress along several fronts such as health, safety and transportation that could lead to disadvantages in employment, educational opportunities and economic stability (Lopez, 1986).
interest rates has been high. The evidence of the impact of
the FHA loan program on Hispanic mortgages shows that 64.8
percent of Hispanic families have FHA mortgages secured
7
through federal entities as compared to 40.6 percent of non-
Hispanic white households, and the median length of FHA
loans made to Hispanics is about equal to that of white
households, 30.1 versus 30.2 years (Lopez, 1986).
Table 1~ Percent Distribution of Hispanic and Non-Hispanic White First Mortgage Interest Rates by Mortgage Type, 1981.
Hispanic Non-Hispanic White
Interest Rate % FHA VA Conventional FHA VA conventional
Less than 6.0 15.2 21.5 3.6 34.4 25.8 6.7
6.0 to 7.9 26.8 19.2 18.9 21.4 21.5 24.1
8.0 to 9.9 39.3 52.3 50.6 28.2 38.0 46.4
10.0 to 11.9 11.7 5.2 18.0 11.8 10.8 14.0
12 or more 7.0 1.7 8.9 4.2 3.9 8.8
source: L6pez, Manuel M., •su casa noes mi casa ... ,· (1986): 133.
The data in Table 1 reveal that 58% of Hispanics
receiving FHA loans paid an interest rate above 8% compared
to 44.2% for non-Hispanic whites. The higher mortgag,e
interest rates paid by Hispanic households could be
explained if there is price discrimination against Hispanics
by conventional lending institutions or Hispanics had a
higher demand for mortgages than whites during the late
1970's and early 1980's, a period of volatile interest
rates. However, the data in Table 2 indicate that only 63.3
percent of all FHA mortgages to Hispanic households are
post-1970, for non-Hispanic whites this percentage is 82.5
percent.
Table 2. Percent Distribution of Year First Mortgage was Assumed by Hispanics and non-Hispanic Whites by Mortgage Type, 1981.
Hispanics Non-Hispanic Whites
Year Assumed FHA VA conventional FHA VA Conventional
1975-1981 44.0 54.1 63.8 55.5 61.1 68.3
1970-1974 19.3 16.2 19.4 27.0 11.6 20.2
1965-1969 16.3 11.0 10.2 7.4 14.0 7.2
1960-1964 14.2 10.8 5.7 5.5 9.3 3.1
1959 or earlier 6.2 7.9 0.8 4.7 4.1 1.2
source: L6pez, Manuel M., •su casa noes mi casa ... ,• (1986): 134.
In 1980, the Veterans Administration's loan program
accounted for 17.0 percent of all Hispanic primary
mortgages. The 1980 census shows that VA mortgages have a
median life of 30.2 years for Hispanic as well for white
households, and data in Table 1 indicate that 14.7 percent
of all VA mortgages made to whites and only 6.9 percent for
Hispanics have an interest rate above 10 percent. This
higher interest rate paid by white households can be
explained by the recency of non-Hispanic white's VA
mortgages. About 61 percent of all VA mortgages to non-
8
Hispanic white households were made between 1975 and 1981,
when mortgage interest rates averaged 11.3%, for Hispanics
this percentage is only 54 percent.
Moreover, the evidence reported by the Census Bureau
shows that during the 1970's a larger percentage of non-
Hispanic whites than Hispanic households have been able to
afford the increasing expense of home ownership. The
Hispanics home ownership rate dropped from 46.2 percent in
1970 to 43.3 percent in 1980. The drop in the Hispanic home
9
ownership rate can be explained by the fact that the average
cost of new housing increased by 134.1 percent, and that for
existing units by 133.0 percent between 1972 and 1982, while
Hispanic households income rose by only 77.8 percent as
compared to 83.7 for whites (U.S. HUD, 1989}.
Table 3. Percent Distribution of Hispanic and non-Hispanic White Price/Income Ratios for Home Purchases 1977-1981 by Mortgage Type.
Hispanic Non-Hispanic White
Price/Income ratio Total FHA VA conv Total FHA VA Conv
Less than 1.0 10.9 8.0 5.1 13.0 11.8 10.4 7.9 11.5
institutions argued that the guidelines of the agencies that
buy mortgages to be repacked into securities tend to
increase the racial gap in mortgage lending. The analytical
framework to address the above issues and to test for the
existence of credit rationing in the mortgage market is
presented 1n the following chapter.
12
III. ANALYTICAL FRAMEWORK TO TEST FOR THE EXISTENCE OF
CREDIT RATIONING IN THE BLACK MORTGAGE MARKET
Black households could face tighter credit constraints
in the conventional mortgage market because of their
relatively lower income levels, housing preferences and/or
their perceived relatively high rate of default.
Utility maximization theory suggests that households
will maximize their utility by choosing their preferred
combination of tenure status and quantity of housing subject
to a given set of prices, income and credit constraints. The
following model shows how the perceived default risk of a
group could displace this group into the FHA market.
Housing Goods
I I
I
I - ,. -1- -
I I
I I
Figure 1. Levels of Housing/Non-housing Goods Consumption Under Credit Rationing.
In figure 1, the budget line shows the different
combinations of housing and non-housing consumption levels
for a household with income (I). The vertical intercept
(!/Ph) and the horizontal intercept (I/Pnh) represent the
maximum amount of housing and non-housing units that could
be obtained if only one of the two alternatives was
consumed3• If there are no credit constraints, households
could freely choose the housing level that would maximize
their utility. That is, for households that highly prefer
13
housing to other goods the optimal level of housing and non-
housing consumption would be at H1 and NH1 where their
indifference curve (A) is tangent to the budget constraint;
and for household with relatively lower housing preferences
(indifference curve C) their optimal level of housing and
non-housing consumption would be at point H2 and NH2 ,
respectively.
In the presence of credit rationing, however,
3 Housing is assumed to be a normal good. That is, as household income increases, the amount of housing units consumed also increases. An indifference curve is a line connecting all combination of housing and non-housing goods that are equally desirable to the household. The indifference curves are assumed to be downward sloping and convex to the origin. The slope of the indifference curves, or the marginal rate of substitution refers to the maximum amount of nonhousing units a household is willing to give up in exchange for one more unit of housing which increases at a decreasing rate. As long as the household desires more of housing and non-housing units, every point on a curve farther from the origin will be preferred to any point on a lower indifferent curve.
14
households with housing preferences above point Z that are
perceived by the conventional market as risky investments
because of their current income level, their higher housing
preferences and/or their race would be displaced into the
FHA mortgage market. Given the additional mortgage cost
associated with the insurance premium required by the FHA
market, households that are displaced into the FHA market
would face the budget line represented by I/PM-Z-I/PfM· The
lower vertical intercept I/Pfha represents the maximum amount
of housing goods that could be obtained, by a credit
rationed household, in the FHA market if only housing goods
were consumed. Since credit rationed households are also
constrained by a maximum share of income that they can spend
on housing, they would also be displaced to a lower
indifference curve (B) that yields a lower housing
consumption level (H3 ) •
This theoretical development, however, does not explain
why banks would ration credit to Hispanics. Basic supply and
demand laws tell us that if demand for loans exceeds the
supply of loans, interest rates will increase thus reducing
the quantity demanded or increasing the supply of loans
until demand and supply are equated at a new equilibrium
interest rate. According to this principle there is no
reason for credit rationing to exist. Several explanations,
however, exist. In the short run credit rationing can be
15
viewed as a temporary disequilibrium caused by an exogenous
shock. During this period lagged interest rate adjustments
allow for credit rationing (Goodwin, 1986) . Long term credit
rationing could be explained by government interventions in
the mortgage markets such as the imposition of usury laws
(Smith, 1983), and in mortgage markets with imperfect
information, it is difficult for banks to distinguish low
risk borrowers from riskier borrowers, and to do so the
banks use a variety of screening devices (Bester, 1985) 4 •
That is, the interest rate a borrower agrees to pay and
the collateral requirement determined by the banks act as a
function of the perceived risk of borrowers. When lending
institutions are faced with an excess demand for loans at a
given rate, banks could increase the lending rate or
increase the collateral requirement to accommodate this
excess demand. However, why do banks prefer to ration credit
than to increase the lending rate, the supply of funds or
the collateral requirement when there is an excess demand
for loans?
In figure 2, the loan offer curve for minorities
4 "Usury restrictions limit the availability of credit. Studies have found that the average number of loans and the dollar amount of loans are substantially lower in low-ceiling states than in high ceiling states. In states where free market is above the ceiling, the poor, the transient, the young and those with large families are rationed out of the credit market first, since financial institutions must utilize nonprice methods to decrease risk and increase effective yields" {U.S. GPO, 1980).
16
L=S(Rc) that maximizes the bank's expected profits and the
minority's demand for loans curve L=D(Rc) are expressed as a
function of the loan rate, Rc· If minorities are perceived
as a higher default risk group, then the minorities loan
offer would be lower than the overall market offer curve
L=S (Rem) 5•
l .. D
Z<
0 R\. Rc
Figure 2. Loan Demand and Loan Offer curves.
The household demand for loans curve L = D(Rc) is
5 The loan offer curve is derived in Appendix I. This loan offer function has the following properties: ( 1) the loan amount (L) equals zero when the return of an alternative investment (~) is greater than the loan rate Rc; (2} if ~ = Rb, then the bank is indifferent between extending the loan and investing on the alternative investment and (3) the loan amount (L) approaches zero as the contracted (Rc) goes to infinity. That is, the probability of default increases as Rc increases thus reducing the bank's expected profits (Jaffee and Mopigliani, 1969).
17
inversely related to the loan rate. That is, as the interest
rate increases the quantity of mortgages demanded decreases.
Minority borrowers will be rationed in the amount indicated
by {Z) if the optimal market loan rate, say Rem' is less
than Rc because the bank's optimum loan offer for minorities
lies below the minority's demand curve. Lending institutions
would not ration credit if there were not legal restrictions
on the loan rate they could charge to different individuals.
However, legal restrictions, and considerations of good will
and mores, and rate fixing agreements among banks make it
almost impossible for lending institutions to charge
significantly different rates to different customers.
Why, when faced with excess demand for loans, would not
banks increase their collateral requirements thus reducing
the demand for funds and the risk of default, and increasing
the returns to the bank?
Theoretical models that explain the impact of
collateral requirements on credit rationing suggest that in
the bank's view an increase in collateral requirements has
two effects on the mortgage market: {1) households that
decided to stay in the market will choose less expensive
homes, and {2) low risk, less wealthy potential home buyers
will drop out of the mortgage market. The increased
collateral requirement could significantly increase the
second effect, thus decreasing the bank's expected returns
18
{Wette, 1983) 6•
Hispanic borrowers who are denied loans could not
obtain a loan even if they indicated a wiliness to pay more
than the advertised interest rate, or to put up more
collateral than is demanded. If banks increased the interest
rate or the collateral requirements, low risk Hispanic home
buyers could drop out of the mortgage market. Thus, the risk
on the bank's loan portfolio could increase possibly
decreasing the bank's expected profits. Moreover, credit
rationing would exist if banks limit the number of loans
that they will make, rather than limiting the size of each
loan, or relating the interest charged to the loan size.
The credit rationing theory presented in this chapter
suggests that Hispanic households could be rationed in the
conventional credit market because of their relatively lower
income levels, higher housing preferences and/or their race.
Also, this theory suggests that households that are
displaced into the relatively more expensive FHA mortgage
market would face a relatively lower housing consumption
level. The empirical model needed to investigate whether
Hispanics are discriminated against in the housing market is
presented in the following chapter.
6 The theoretical model is presented in Appendix I.
IV. THE EMPIRICAL MODEL, DATA AND VARIABLES DEFINITION
Data for the analysis are taken from the 1989
Metropolitan file of the American Housing Survey (MAHS),
which contains individual respondent records in 11
metropolitan areas7• This data set has been widely used in
previous housing studies and provides the best detailed
housing and socio-economic data on households across the
19
nation. The only shortcoming of using the MARS data is that
it does not provide information on whether the household
that holds a FHA secured mortgage had been previously denied
a conventional mortgage, or if the household had only
applied to FHA mortgages because he/she perceived the
conventional mortgage market as being unfriendly.
An alternative source of housing information is the
Horne Mortgage Disclosure Act (HMDA) data. However, the HMDA
data only provides one piece of economic information about
the applicant, income. Given the choice in data sets, the
MAHS data was selected for this study because its provides a
complete socio-economic description of households'
characteristics across the nation.
To reduce measurement errors only those households that
purchased their homes between 1980 and 1989 and obtained
7 The 11 Metropolitan areas are: Boston, Dallas, Detroit, Fort Worth, Los Angeles, Minneapolis, Philadelphia, Phoenix, San Francisco, Tampa and Washington D.C.
newly originated conventional or FHA mortgages were
selected. From the original sample of 36,000 records only
3,779 were selected.
20
The Gabriel and Rosenthal model is used here, augmented
by a measure of permanent income and transitory income,
because households could borrow against their future income
thus spreading housing consumption cost over time according
to their expected permanent income. The empirical analysis
1s based on a probit model of whether Hispanic borrowers
obtain fully insured Federal Housing Administration (FHA) or
conventional mortgage financing.
Consistent with Stiglitz-Weiss model of credit
rationing, Hispanic households perceived as high risk
borrowers should be subject to credit constraint and be more
likely to obtain FHA financing, ceteris paribus.
The probit model is given by:
FHA=u0 +u1 logYP+u2 logYt+u3 CITY+u4 RAR+u 5 BLACK
+u6 HISPANIC+u1AGEl+U8~+u9 SEX+ei (1)
where: Yp and Yt are measures of permanent and transitory
incomes, respectively. CITY is the identifier for central
city location; HAR is the housing price appreciation rate;
AGEl, BLACK, HISPANIC, MAR and SEX are the age, race,
marital status and sex of the household head; and ao, a1 , ~,
a 3 , a 4 , a 5 , a 6 , ~, a 8 and a 9 are coefficients. The error term
21
(ei) is assumed to have a normal distribution and finite
variance.
The dependent variable in the probit model equals 1 if
the household obtained a FHA loan and 0 if it obtained a
conventional loan. Gabriel and Rosenthal used a measure of
household wealth (housing downpayment plus all liquid
assets) to test for the likelihood of binding conventional
downpayment constraints. However, most housing analysts
suggest that some form of long-term income variable, which
has a wealth component in it, is a principal determinant of
housing tenure choice. That is, households look beyond their
current income and wealth level in making their housing
decisions. Households could borrow against future incomes to
spread out housing consumption over time consistent with
their expected permanent income (Goodman and Kawai, 1984;
Goodman, 1988; Cameron, 1986).
Moreover, mortgage payments-to-income ratios are also
an important tool of non-price credit rationing. Given that
the preferred budget share of housing declines with
household's income, then conventional payments-to-income
ratio constraints will be relatively more binding for lower-
income families 8• Since FHA payments-to-income standards
are less restrictive than conventional criteria,
8 Carliner (1973) finds that the income elasticity for housing demand is less than 1 , which means that the preferred budget share of housing declines with income.
22
then we can expect that lower-income families will favor FHA
financing.
Using the method presented by Goodman and Kawai {1982),
the following regression equation was estimated to construct
the permanent and transitory components of measured income:
Y1 =C¥ 0 +C¥1 EDUC+m2 SEX+ +C¥3 EXP+m4 EXP2
+C¥5 MAR+a6 HISPANIC+t17 BIACK+W1 (2)
where EDUC and EXP are measures of human wealth. EXP2 is
included to capture nonlinear effects of this variable on
permanent income. Sex, marital status (MAR) and race (BLACK
or HISPANIC) indicate other human and non-human wealth
variables for each household head. These dummy variables
equal 1 if the household head is Hispanic or black, female,
and married and equal 0 otherwise. Wi is the disturbance
term uncorrelated with the explanatory variables so that the
OLS estimation procedure provides consistent and efficient
estimators.
The signs of the coefficients are expected to be:
a 1 > 0 , a 2 < 0 1 a 3 > 0 1 a 4 < 0 1 a 5 >0 1 a 6 < 0 and a 7 < 0
The predicted value of Yi can be interpreted as the
estimate for permanent income (YP), and the predicted value
of wi as the estimate for transitory income {Yt) .
The dummy variable CITY equals 1 if the house is
located within the central city of a metropolitan area an 0
23
otherwise. Central city locations are usually identified
with urban decay that may be associated with lower housing
appreciation rates. Vandell and Thibodeau (1985) have shown
that neighborhood quality is a significant predictor of loan
default rate. Therefore, central city location should be
positively related to the probability of obtaining FHA
mortgage financing.
Lenders expectations of annual home appreciation rate
(HAR) also affect lender exposure to default risk, because
low rates of home appreciation depress the rate of
collateralization on the loan. We can expect that
conventional lenders would impose stricter downpayment
constraints to households buying in areas with lower
appreciation home rates to insure that mortgages are fully
collateralized. In comparison, FHA lending procedures
prohibit the use of property location as a factor of loan
evaluation. This implies that households locating in areas
of low housing appreciation rates ~auld be more likely to
obtain FHA mortgages. The home appreciation rate (HAR) was
entered into the probit model as the house annual rate of
appreciation from the time the household purchased the
property to the time of the survey (1989) 9•
Households are described by the following demographic
9 HAR = (VALUE/ PPRICE) 1190-buyyear Where VALUE is the estimated property value in 1989; PPRICE is the price paid for the property and buyyear is the year property was purchased.
24
variables: (1) Assuming that credit history, credit
worthiness and the likelihood of owning increases with age,
conventional lenders may apply more flexible credit
constraints to older households, increasing their likelihood
of obtaining a conventional loan.
(2) Household head race is defined by the HISPANIC and
BLACK 0-1 dummy variables and equal 1 if the household head
race is Hispanic or black respectively, and 0 otherwise.
Generally, minority households are associated with lower
levels of income and wealth than white households, and
minorities tend to be concentrated in central city locations
subject to lower housing appreciation rates. Also, as racial
discrimination persists in the labor market, non-whites are
more likely to suffer layoffs or other income shocks (Kain
and Quingley, 1975; Gabriel and Walch, 1984).
(3) MAR and (4) SEX are also dummy variables. Both
equal 1 if the household head is female and married and 0
otherwise. These two variables are used to account for the
possibility that different family types may have different
underlying preferences for tenure choice.
These differences suggest that the expected default
risk on a mortgage issued to a minority would be greater
than for a non-Hispanic white household. Consistent with
Stiglitz and Weiss, conventional lenders are expected to
apply tighter credit constraints to minority applicants.
25
Given that various proxies for default risk and cost
have been fully integrated into the model, any remaining
race effects would reflect one of two possibilities: the
proxies for default risk and cost do not fully capture
lender evaluations of individuals default risk, or household
race is an important factor determining the type of mortgage
minority households obtain for reasons other than default
risk. The results from the empirical analysis, of the impact
of household race and other socio-economic characteristics
on the type of mortgage a household obtain, are presented in
the next chapter.
26
V. RESULTS
The permanent and transitory incomes, and the probit
model were estimated from the complete sample of 3767 home
buyers from 1980 through 1989 in 11 metropolitan areas. The
variables used in all the estimations are listed and fully
described in Table 1. All variables refer to the head of the
household.
The sample data statistics are presented in Table 2.
The total sample consists of 3316 non-Hispanic white, 230
black and 221 Hispanic households with a mean age of 39
years. With a mean income of $52,088, households in the
sample are well above the 1988 national average household
income of $32,191. This limits the study to the upper
middle income population excluding those households that are
at or below national average, for whom discrimination in the
mortgage market could be more intense.
The first column of table 3 reports the coefficients
and t-values associated with each variable in the permanent
and transitory incomes linear estimation. The second column
reports the results from the logarithmic estimates. The
t-statistics 1n parentheses indicates the statistical
significance of the coefficient.
All the coefficients in the estimated permanent and
transitory incomes function have the expected sign, and are
27
statistically significant with the exception of the race
variables- HISPANIC and BLACK. The education, experience and
marital status variables reflect the positive returns to
income of each variable. The gender variable, SEX, has the
expected negative sign which reflects that females earnings
are lower than comparable males. Although, the signs of the
coefficients for the race variables are negative, their low
t-statistic may be reflective of the higher income and
education characteristics of the sample.
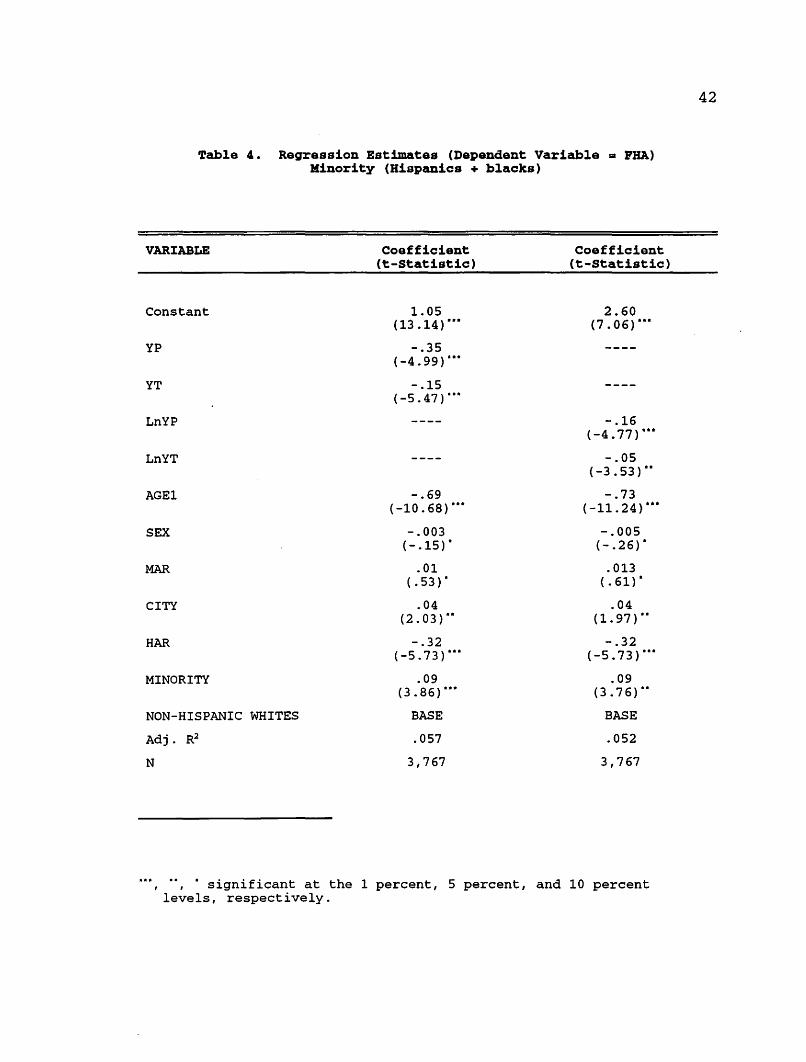
In Tables 4 and 5, the regression estimates and the
estimates of the probit model for minorities (Hispanics and
blacks combined) indicate that variables which proxy for
lenders' concern over default risk have the expected effect
on the type of loan that minorities obtain. The permanent
and transitory income coefficients are negative and
statically significant which indicates that as income
increases the probability of obtaining an FHA loan
decreases.
Similarly, the estimated coefficients of the annual
housing appreciation rate (HAR), central city location
(CITY) and age (AGEl) are of the expected sign and are
statistically significant. These estimates indicate that
younger households buying houses located in central city
location, characterized by lower appreciation rates, are
more likely to obtain FHA mortgages. The marital status
(MAR) and gender (SEX) variables are not statistically
significant.
28
The estimated coefficient for the race (MINORITY)
variable is of the expected sign (positive) and is
statistically significant (3.86). This indicates that even
after controlling for various proxies that control for
lender perception of default risk, minorities are relatively
more likely to obtain FHA mortgages than comparable
non-Hispanic white households.
Despite our choice of a different data source in this
study, the results are consistent with Gabriel and
Rosenthal's study that finds that the race effect for blacks
has an important impact on the type of loan they obtain.
However, when blacks and Hispanics are entered separately
into the model the estimated impact of the individual race
on the type of mortgage obtained is substantially different.
In Tables 6 and 7, the regression estimates and the
estimates of the probit model for blacks and for Hispanic
households reveal that when the two groups are independently
entered into the equations, the race effect increases for
black household and for Hispanics it disappears. That is,
black households are more likely to face tighter credit
constraints in the conventional mortgage market thus
increasing their probability of obtaining a FHA mortgage
relative to comparable Hispanics and non-Hispanic whites.
Although the estimated coefficients for the HISPANIC
variable in these models are negative (-.02), they are not
statistically significant (-.52 and -.69 for the liner and
logarithmic equations respectively). Therefore, the race
variable for Hispanics, relative to non-Hispanic white
households, does not have a significant effect on the
probability of obtaining an FHA mortgage.
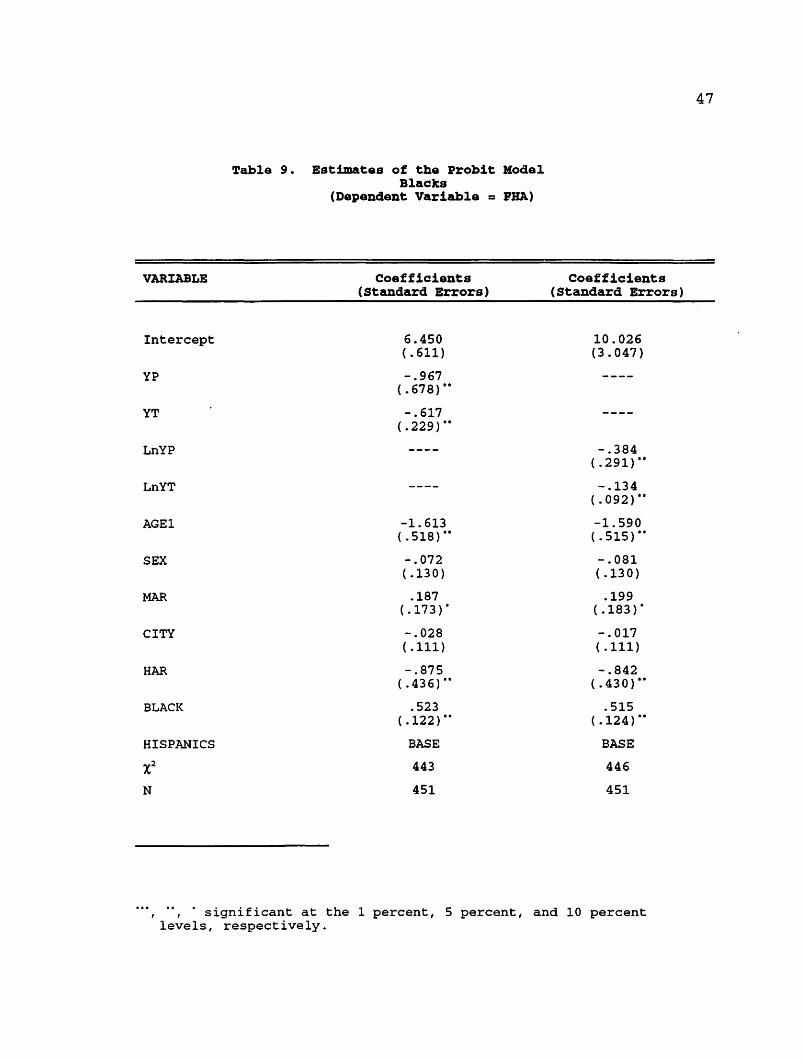
Furthermore, the results presented in Tables 8 and 9,
suggest that the impact of black's race on the probability
of obtaining a FHA loan, relative to Hispanic households,
remains positive and statistically significant.
29
30
VI. CONCLUSIONS
The empirical results presented in this Master's thesis
suggest that socio-economic variables which proxy for
lender's concerns about default risk and cost have an
important effect on the type of mortgages borrowers obtain.
These results are consistent with previous studies of
mortgage lending discrimination that have found that blacks
are less likely to obtain conventional financing than
whites, even after controlling for socio-economic proxies
for default risk {Gabriel and Rosenthal, 1991), and that
blacks and Hispanics as a whole face higher denial rates ~n
the conventional mortgage market than comparable
non-Hispanic white households {Munnell et al., 1992).
Also, these findings are consistent with the
theoretical model of credit rationing developed by Stiglitz
and Weiss {1981), and provide one more piece of evidence on
the credit rationing behavior -based on perceived
differences in borrowers' default risk and cost- of
conventional lending institutions.
The results of this study, however, suggest that when
the race effect of Hispanic and black households is
separately analyzed Hispanic households do not face credit
rationing, proxied by the likelihood of obtaining a FHA
mortgage, in the conventional mortgage market . These
31
results in no way suggest that all Hispanic sub-groups are
not in disadvantage in terms of conventional mortgage
availability, but given that the data used in this study
categorized Hispanics of all origins together, a comparison
among distinct Hispanic sub-groups could not be made.
Further research is recommended to determine if these
results hold among various Hispanic groups e.g. Mexican
American, Cuban, Puerto Rican, and others.
Selective policy recommendations could be formulated
once research on the Hispanic mortgage market, at the
subgroup level, is conducted. For the moment, policy that
targets all Hispanics is not recommended because it may not
serve those Hispanic subgroups that are presently at a
greater disadvantage.
32
APPENDIX I
Consider Stiglitz and Weiss (1981) investment model
with credit rationing to explain why among loan applicants
that appear to be identical some receive a loan and others
do not; even if (1) the rejected applicants agree to pay a
higher interest rate and to put up more collateral than the
rate and amount advertised by the bank, and (2) the supply
of credit increases to accommodate any excess demand for
loans.
Let's assume that a profit maximizing bank has
identified two households, a non-Hispanic white and a
Hispanic, that (1) want to buy a house costing a
predetermined amount of money (C), (2) would pay a mortgage
rate (Rc) and (3) would get a loan amount (L). In the bank's
view the riskiness of each mortgage can not be ascertained
and to simplify the model a one period mortgage is assumed.
However, the bank perceives non-Hispanic whites as a
risk-free group and Hispanics as a members of a risky group.
That is, the ability of both households to met all of their
mortgage payments (x) may take a value between q and Q with
the probabilities indicated in Figure 1 by the bell-shaped
curve, and the Hispanic household probability of default
indicated by the shaded area.
Since the bank is certain that the non-Hispanic white
borrower will meet all of his/her mortgage payments, the
analysis that follows focuses on the bank's lending
33
practices towards Hispanic households that are perceived as
risky borrowers.
P<x>
q (l+Rc)l Q
Figure 3 The probability of default and possible proceeds from a venture.
Given a loan amount L, the Hispanic borrower owes the
bank (1 + Rc) L at the end of the period. If x < (1 + Rc) L,
then the Hispanic borrower is in partial default, and if the
household ability to meet the mortgage payments increases,
that is x ~ (1 + Rc) L, then the bank gets paid in full and
the borrower keeps the difference if any. The bank's
expected profits from the loan to the risky borrower are
given by:
(l+Rc) L (l+Rc) L
IIe= I xp(X) dx + (l+Rc) L I p(X} dx- (l+Rb) L (3) q 0
The first term in Equation (3) is the bank's expected
repayment if the Hispanic household is unable to meet its
34
mortgage payments, that is, x ~ (1 + Rc) L. The second term
is the contracted repayment times the probability that the
repayment ability of the household would be sufficient to
repay the loan in full. The last term is the opportunity
cost of the loan to the lender, where Rb is the certain rate
of return on alternative investments, say, Treasury bills.
The optimal loan size (L) to the Hispanic borrower that
would maximize the bank's expected profit is calculated by
setting the first derivative of the expected profits (~)
with respect to (L) equal to zero.
(4)
q
+ (l+Rc) I p(X} dx- (l+Rb) = o (l+Rc) 1
Rearranging gives:
Q (l+Rc)L
= I p (X) dx = 1- I p (X) dx (5)
(l+Rc)L q
and
35
(6)
In equation (6), the optimal loan size is the amount
for which the probability of default equals the present
value of the excess of the loan rate over the opportunity
cost of the loan. For example, values of Rc = 0.15 and Rb =
0.08 induce the bank to extend a loan such that P[default] =
0.061. As the return of the contract loan rate (Rc)
increases, the bank is induced to accept a higher
probability of default.
By taking the second derivative of the expected profits
equation (~)with respect to the loan size (L), I can show
that equations (5) and (6) are consistent with a profit
maximum for all values of L between q/{1+Rc) and Q/{l+Rc).
{< 0 for q~ (1 +Rc> L ~Q =0 otherwise
(7)
The optimal loan size to the risky borrower could be
expressed as a function of the loan rate by the loan offer
curve, L = S(Rc). Let's suppose that the lender believes
that the probability that the risky household would meet all
of his/her mortgage payments (x) is uniformly distributed