An Empirical Investigation of Kaizen Event Effectiveness: Outcomes and Critical Success Factors Jennifer A. Farris Dissertation submitted to the faculty of the Virginia Polytechnic Institute and State University in partial fulfillment of the requirements for the degree of Doctor of Philosophy In Industrial and Systems Engineering Dr. Eileen Van Aken (Chair) Dr. Kimberly Ellis Dr. C. Patrick Koelling Dr. Richard Groesbeck Dr. Geoffrey Vining Dr. Toni Doolen December 18, 2006 Blacksburg, Virginia Keywords: Kaizen, Kaizen Event, Teams, Lean Manufacturing
Transcript
An Empirical Investigation of Kaizen Event Effectiveness: Outcomes and Critical Success Factors
Jennifer A. Farris
Dissertation submitted to the faculty of the Virginia Polytechnic Institute and State University in partial fulfillment of the requirements for the degree of
An Empirical Investigation of Kaizen Event Effectiveness: Outcomes and Critical Success Factors
Jennifer A. Farris
ABSTRACT
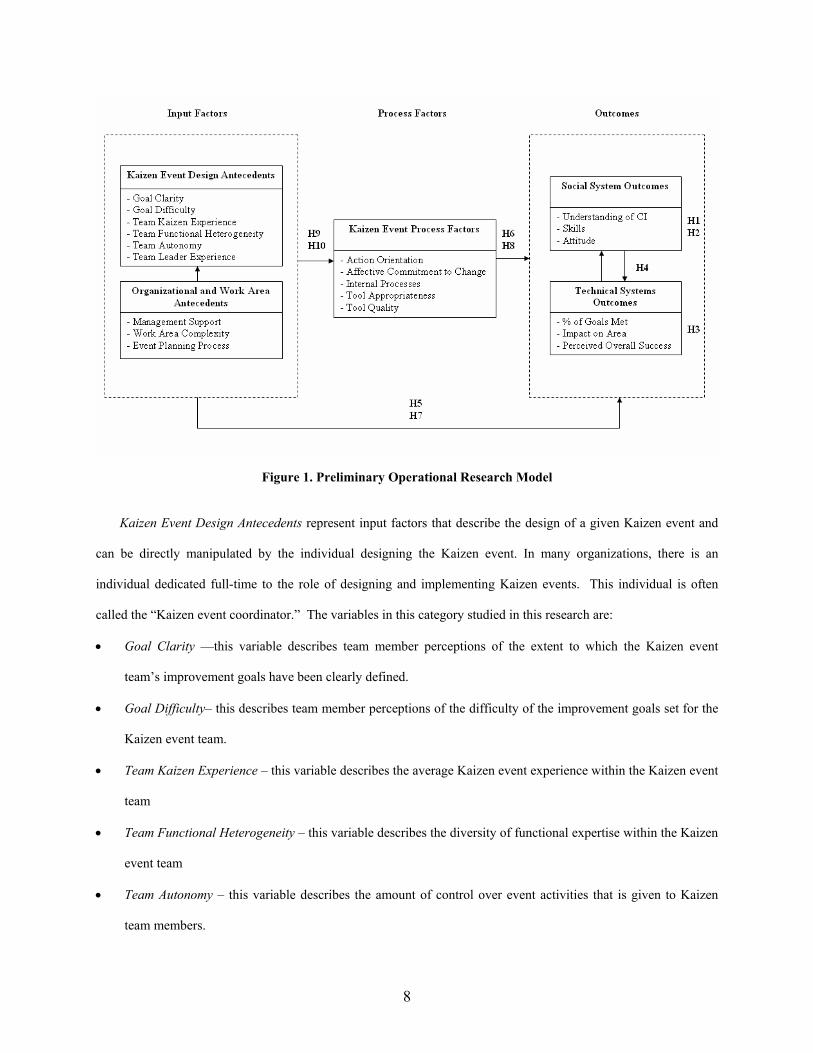
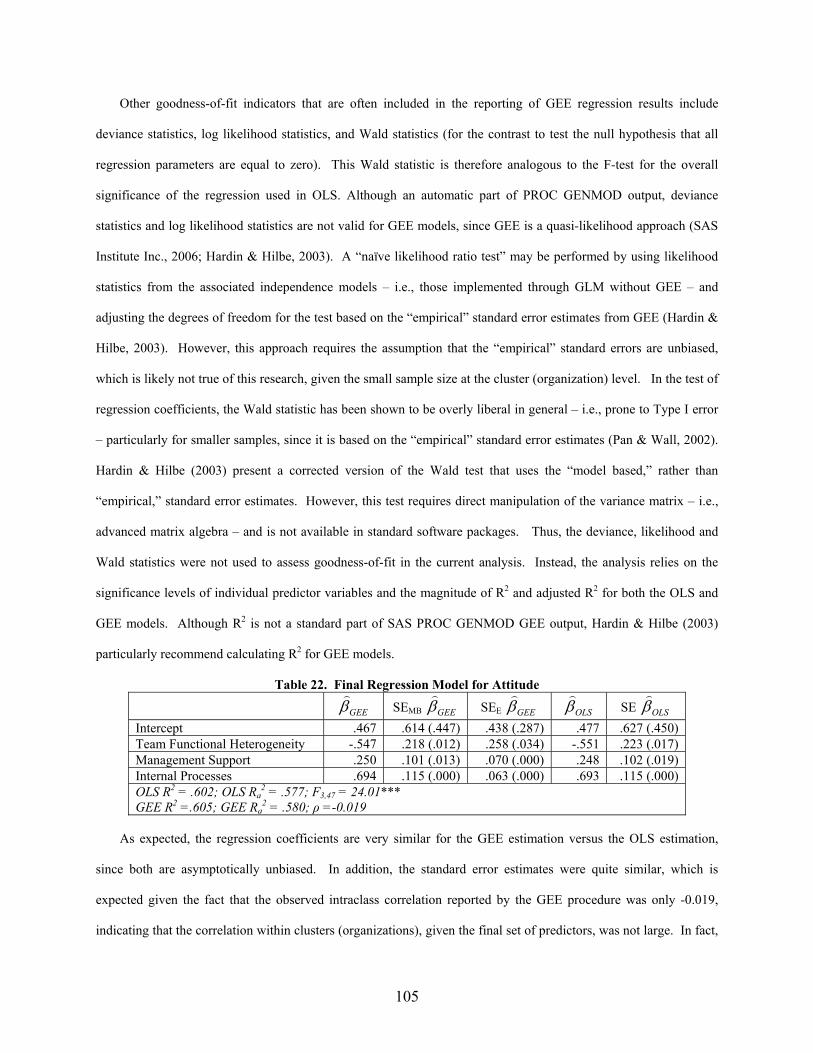
This research presents results from a multi-site field study of 51 Kaizen event teams in six manufacturing organizations. Although Kaizen events have been growing in popularity since the mid 1990s, to date, there has been no systematic empirical research on the determinants of Kaizen event effectiveness. To address this need, a theory-driven model of event effectiveness is developed, drawn from extant Kaizen event practitioner articles and related literature on projects and teams. This model relates Kaizen event outcomes to hypothesized key input factors and hypothesized key process factors. In addition, process factors are hypothesized to partially mediate the relationship between input factors and outcomes. Following sociotechnical systems (STS) theory, both technical and social (human resource) aspects of Kaizen event performance are measured. Relationships between outcomes, process factors and input factors are analyzed through regression, using generalized estimating equations (GEE) to account for potential correlation in residuals within organizations.
The research found a significant positive correlation between the two social system outcomes (attitude toward Kaizen events and employee gains in problem-solving knowledge, skills and attitudes). In addition, the research found significant positive correlations between the social system outcomes and one technical system outcome (team member perceptions of the impact of the Kaizen event on the target work area). However, none of the three technical system outcomes (employee perceptions of event impact, facilitator ratings of event success and actual percentage of team goals achieved) were significantly correlated.
In addition, the research found that each outcome variable had a unique set of input and process predictors. However, management support and goal difficulty were a common predictors of three out of five outcomes. Unexpected findings include negative relationships between functional diversity, team and team leader Kaizen event experience, and action orientation and one or more outcomes. However, many of the findings confirmed recommendations in Kaizen event practitioner articles and the project and team literature. Furthermore, support for the mediation hypothesis was found for most outcome measures. These findings will be useful both for informing Kaizen event design in practicing organizations and for informing future Kaizen event research.
ii
ACKNOWLEDGEMENTS
There are many people who have contributed to this research, both directly and by providing the friendship, encouragement and support that enabled me to keep going and to enjoy my graduate education. First, I would like to thank my advisor, Dr. Van Aken. Thank you for all the ways you have mentored, encouraged and taught me over the years. Thank you for giving me opportunities to work on many interesting research projects and for helping me develop skills related to research, teaching and other aspects of life in academia. Thank you for acting as my professional advocate and for helping me pursue opportunities for research, teaching, funding, conference presentations, publications and jobs. Thank you also for acting as my personal mentor and for helping me protect and balance my time throughout my graduate studies.
To each of my committee members, thank you for your guidance and support in this dissertation and my graduate studies as a whole. To Dr. Ellis, thank you especially for your mentoring and support in my three semesters as your teaching assistant. You taught me a lot about what it means to be a professor and encouraged me to continue my graduate work. To Dr. Koelling, thank you for your wisdom and guidance in the development of my dissertation framework and for your encouragement to focus on the “big picture” in research and life. To Dr. Groesbeck, thank you for your guidance and support in the many lab research projects we worked on together. You helped me develop many different research skills and have been particularly instrumental in the refinement and analysis of the survey scales for this research. To Dr. Vining, thank you for your kind encouragement and for challenging me to think deeply about the complex statistical issues in this research. Your guidance was instrumental in the development of my analysis methods. To Dr. Doolen, thank you for your faith in me and for the opportunity to work on the Kaizen research program from the conceptual stages. I learned a lot from you about the proposal writing process and also about the specific content areas.
To all of the team members and facilitators who participated in this research, thank you for your willingness to share your time and knowledge to expand the Kaizen event body of knowledge. A special thank you to the facilitators at the six participating organizations, who served as data collection coordinators for their organizations. In addition, I am grateful to the National Science Foundation for supporting this research under grant no. DMI-0451512. Also, a special thank you to June Worley who supervised data collection and data entry for the two organizations on the west coast. Thank you for all your work and for your quick and cheerful responses to any questions that I had.
To all the faculty and staff of the Virginia Tech Industrial and Systems Engineering Department, thank you for your help over the years. I particularly want to thank Lovedia Cole for welcoming me to the department and for all her help in understanding and completing the requirements of a graduate education, Kim Ooms for all her help with scheduling and creating documents for meetings, and Nicole Lafon for all her help with payroll and travel reimbursements. To all the Management Systems graduate students, thank you for all your camaraderie, knowledge and encouragement – both professional and personal – a special thank you to James Glenn and Michael Schwandt who had helped me stay focused (and sane) during these last few months of my dissertation work.
To my family – Mike, Karen, Stephen, Amy, Valerie, Jordan, and Norma – thank you for your constant encouragement and for your faith in me throughout this process. I could not and would not have done this without you. Also, thank you to my Virginia Tech family, the Graduate Christian Fellowship. To Patrice Esson, Mary Dean Coleman, Abbie McGhee, Jay McGhee, Amy Albright, Dustin Albright, Shannon Alford, Jarrod Alford and Julia Novak, especially, thank you for your friendship, fellowship and wisdom throughout the years and for helping me have fun and stay focused in graduate school and life. Finally, I am grateful to God who makes all things possible.
1.1 Research Motivation...................................................................................................................................1 1.2 Research Questions ....................................................................................................................................3 1.3 Research Purposes and Objectives .............................................................................................................4 1.4 Problem Statement......................................................................................................................................5 1.5 Sub-Problems and Outputs .........................................................................................................................5 1.6 Research Model and Definitions ................................................................................................................7 1.7 Research Hypotheses................................................................................................................................10 1.8 Overview of Research Design, Premises, and Delimitations....................................................................11 1.9 Contributions of this Research..................................................................................................................13
CHAPTER 2: LITERATURE REVIEW....................................................................................................................16
2.1 Review of the Literature Related to Kaizen Event Outcomes ..................................................................16 2.1.1 Introduction to Kaizen Events.........................................................................................................16 2.1.2 “Kaizen Event” versus “Kaizen” ....................................................................................................19 2.1.3 Technical System Outcomes...........................................................................................................21 2.1.4 Social System Outcomes.................................................................................................................22
2.2 Review of the Literature Related to Input Factors and Process Factors ...................................................23 2.2.1 Project Success Factor Theory ........................................................................................................23 2.2.2 Team Effectiveness Theory.............................................................................................................29 2.2.3 Broader OSU – VT Research Initiative to Understand Kaizen Events ...........................................30 2.2.4 Critical Success Factors from the Kaizen Literature.......................................................................31
2.3 Research Model Specification ..................................................................................................................44 CHAPTER 3: RESEARCH METHODS....................................................................................................................48
3.1 Operationalized Measures for Study Factors............................................................................................48 3.1.1 Operationalized Measures for Technical System Outcomes...........................................................49 3.1.2 Operationalized Measures for Social System Outcomes.................................................................50 3.1.3 Operationalized Measures for Event Process Factors .....................................................................51 3.1.4 Operationalized Measures for Kaizen Event Design Antecedents..................................................53 3.1.5 Operationalized Measures for Organizational and Work Area Antecedents...................................54
3.2 Overview of Data Collection Instruments ................................................................................................56 3.3 Data Collection Procedures ......................................................................................................................57
3.3.1 Sample Selection.............................................................................................................................57 3.3.2 Mechanics of the Data Collection Procedures and Data Management............................................61
3.4 Data Screening..........................................................................................................................................62 3.5 Factor Analysis of Survey Scales .............................................................................................................65
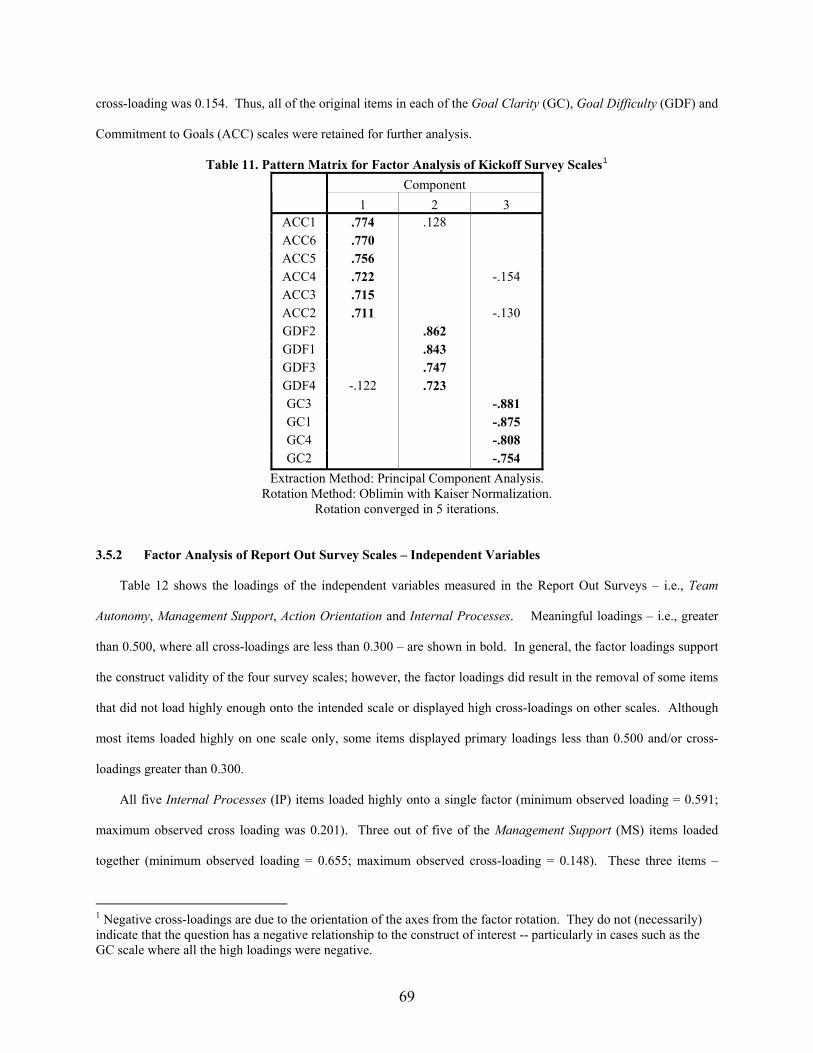
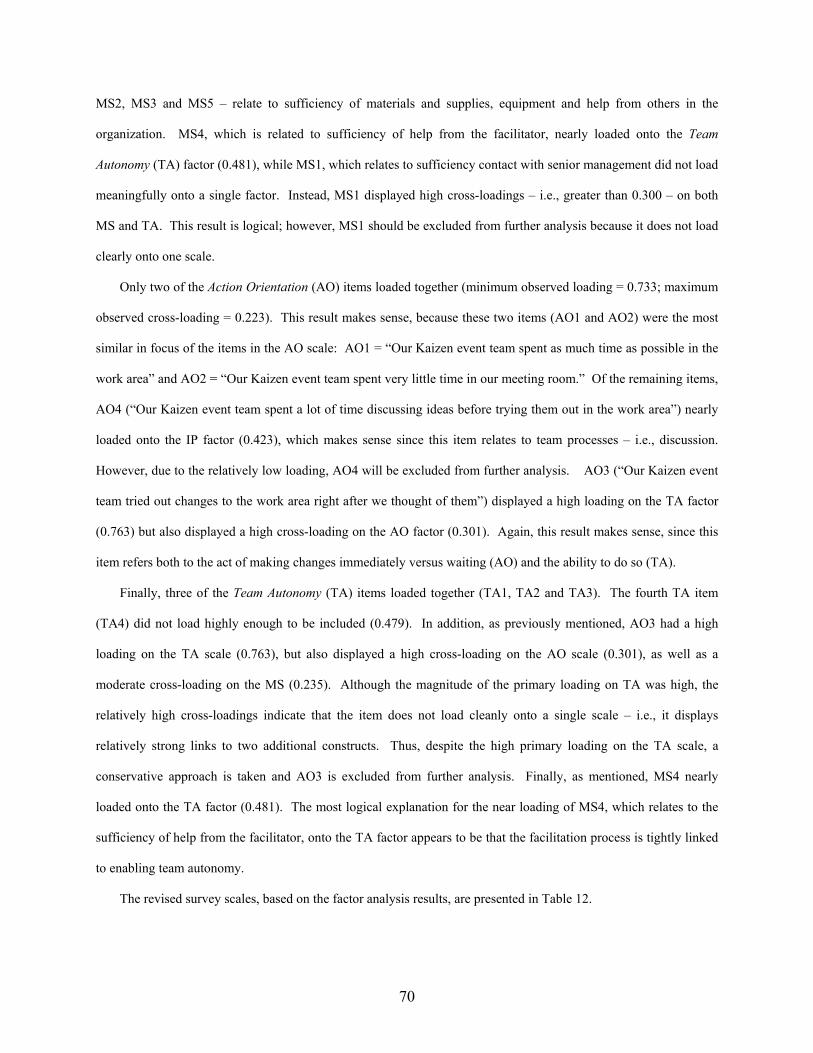
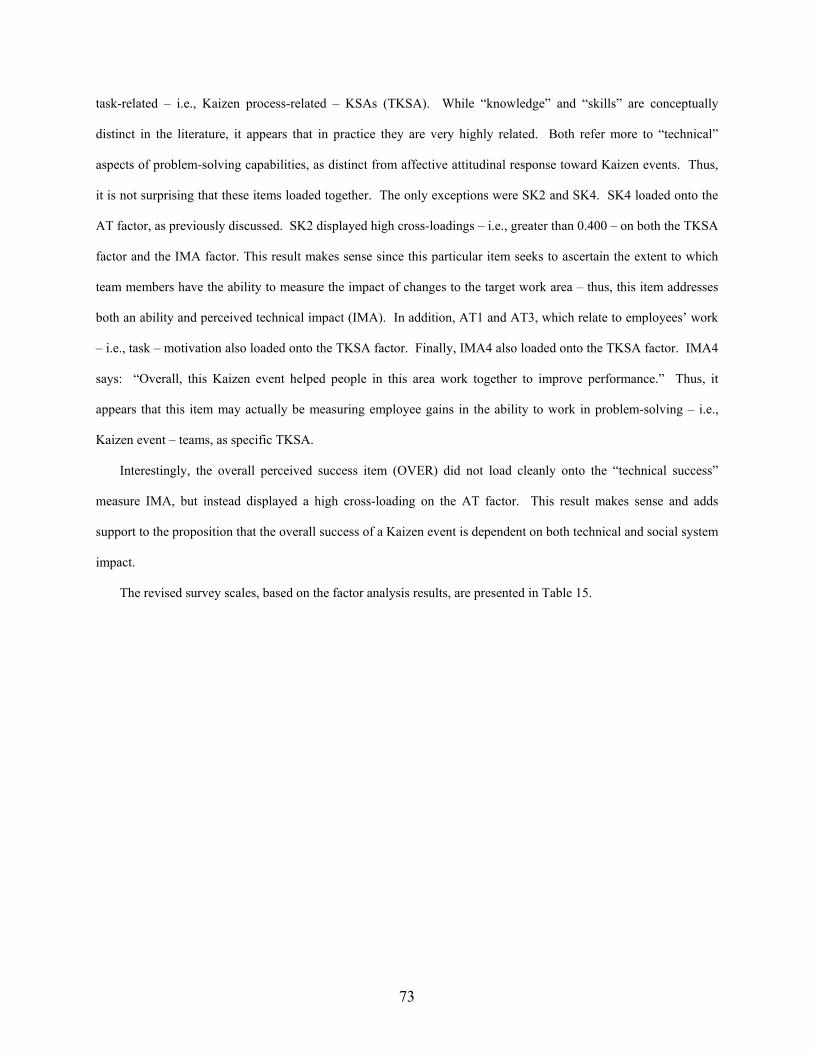
3.5.1 Factor Analysis of Kickoff Survey Scales ......................................................................................68 3.5.2 Factor Analysis of Report Out Survey Scales – Independent Variables .........................................69 3.5.3 Factor Analysis of Report Out Survey Scales – Outcome Variables ..............................................72
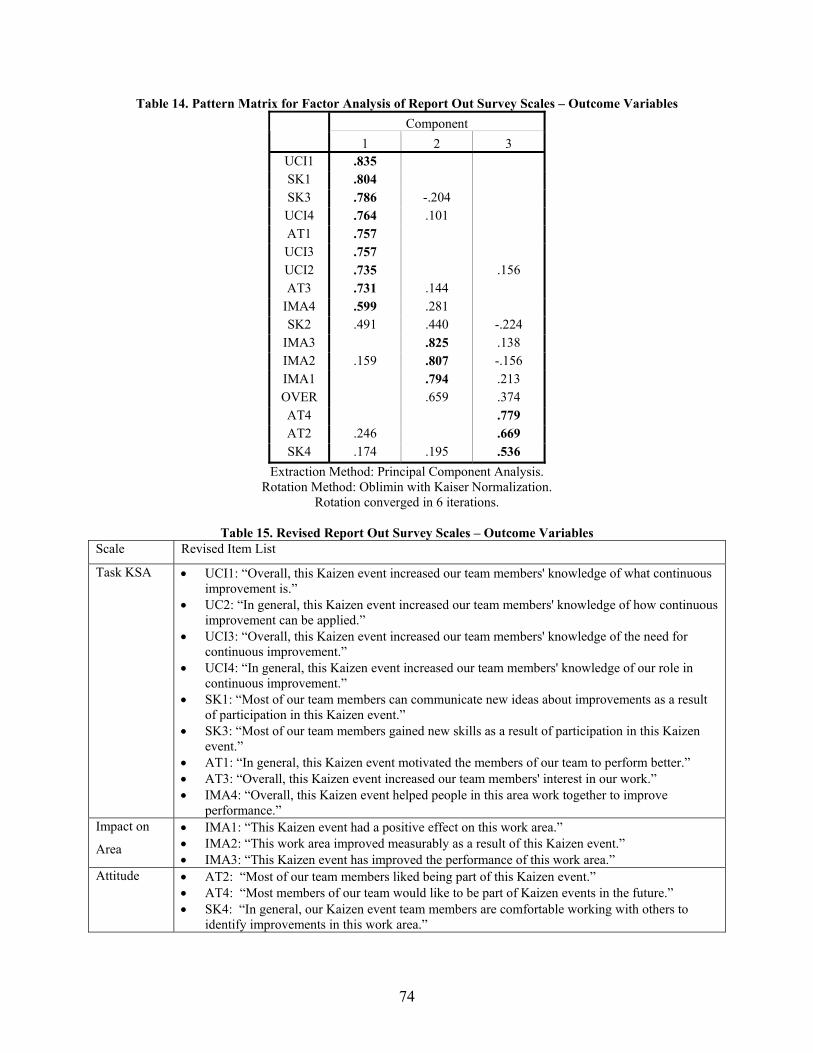
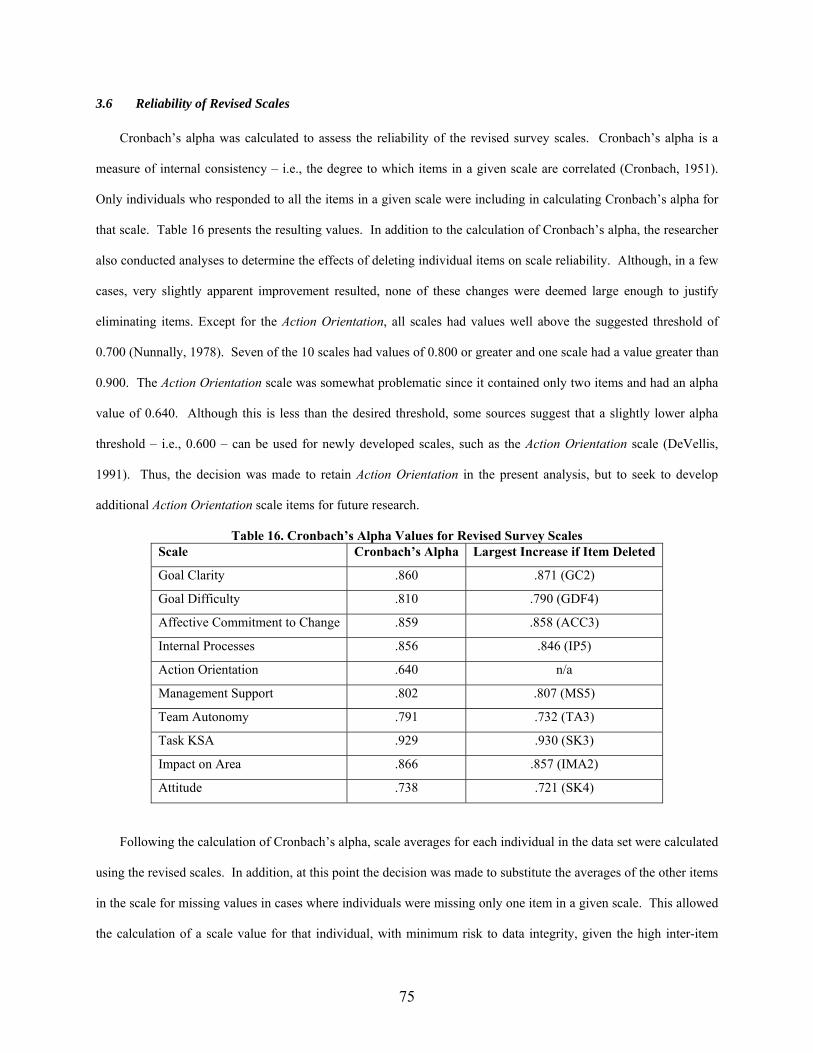
3.6 Reliability of Revised Scales ....................................................................................................................75 3.7 Aggregation of Survey Data to Team-Level.............................................................................................76 3.8 Screening of Aggregated Variables ..........................................................................................................87
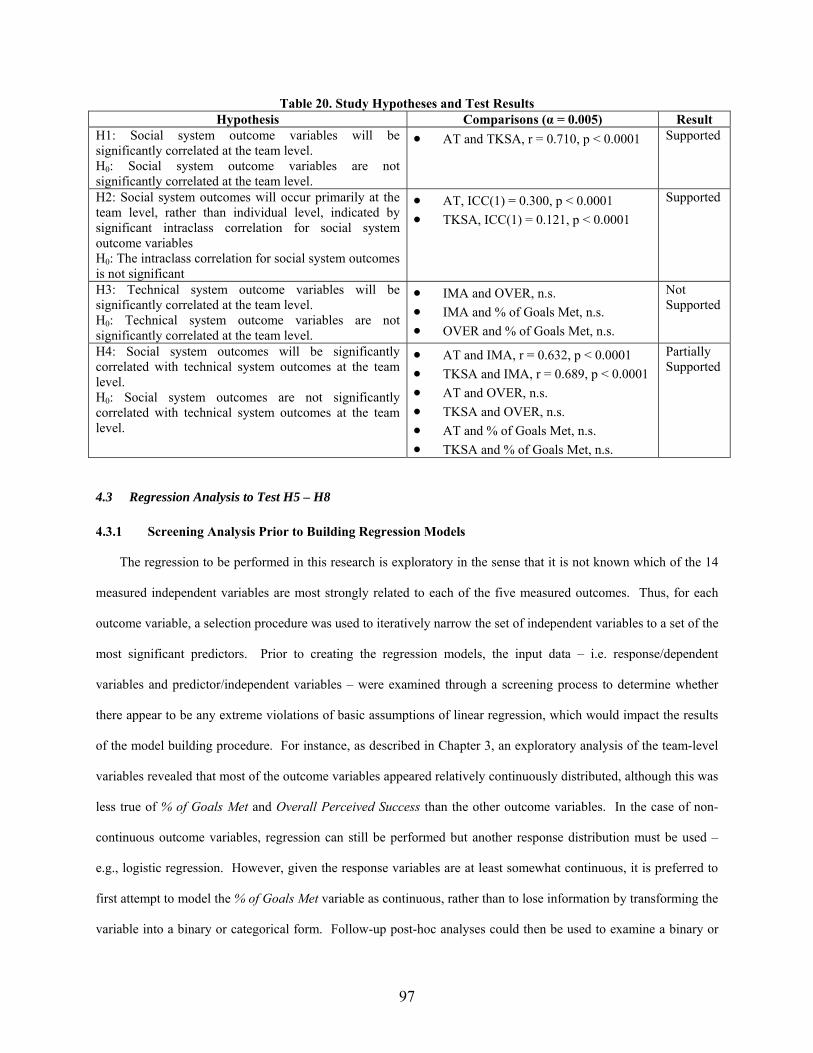
4.1 Overview of Models Used to Test Study Hypotheses ..............................................................................89 4.2 Analysis of H1 - H4..................................................................................................................................94 4.3 Regression Analysis to Test H5 – H8.......................................................................................................97
4.3.1 Screening Analysis Prior to Building Regression Models ..............................................................97
iv
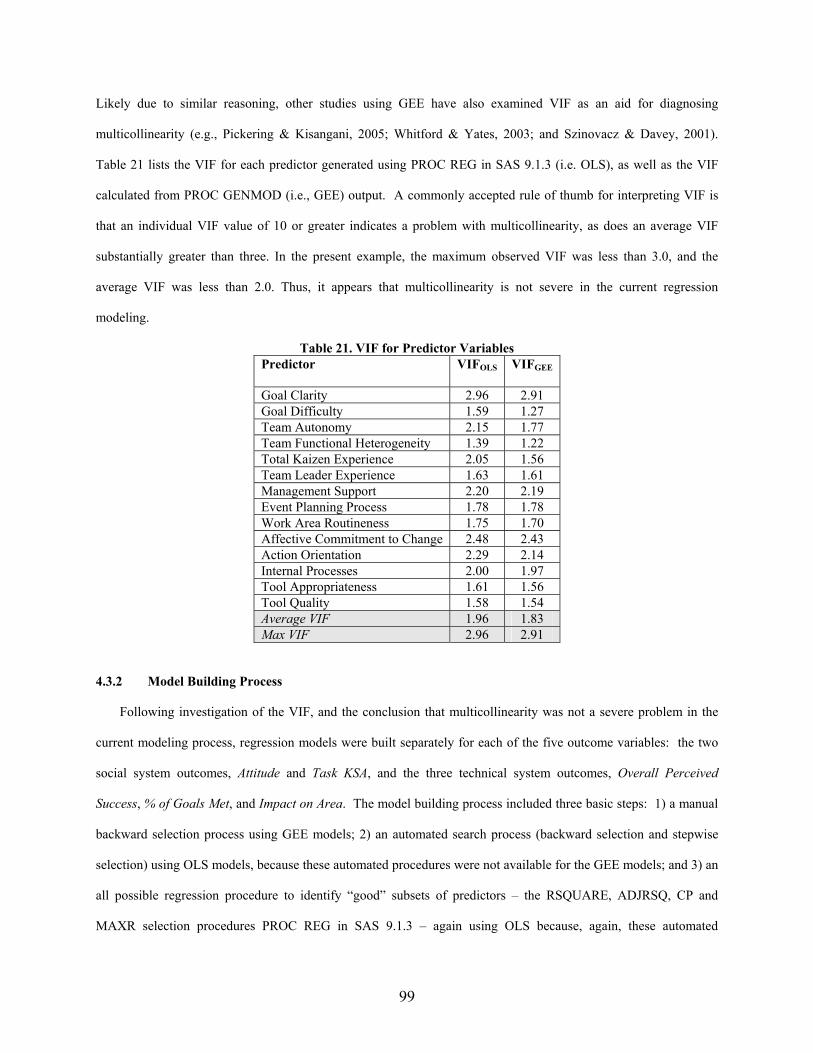
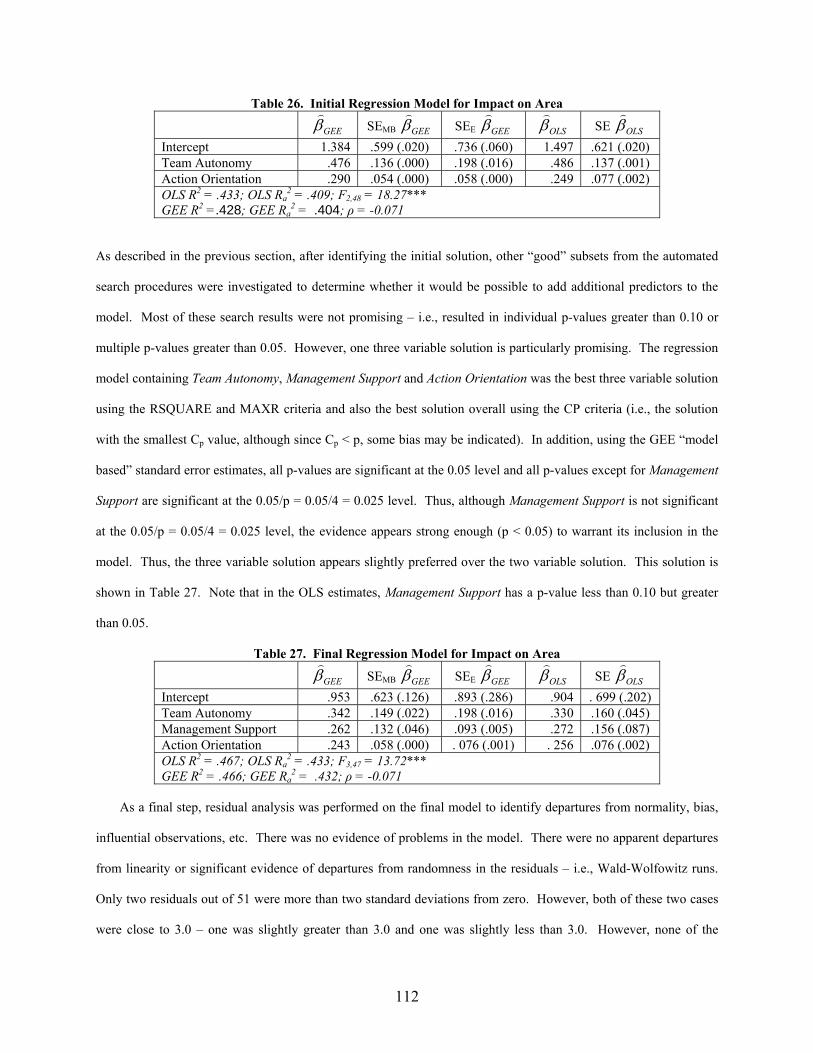
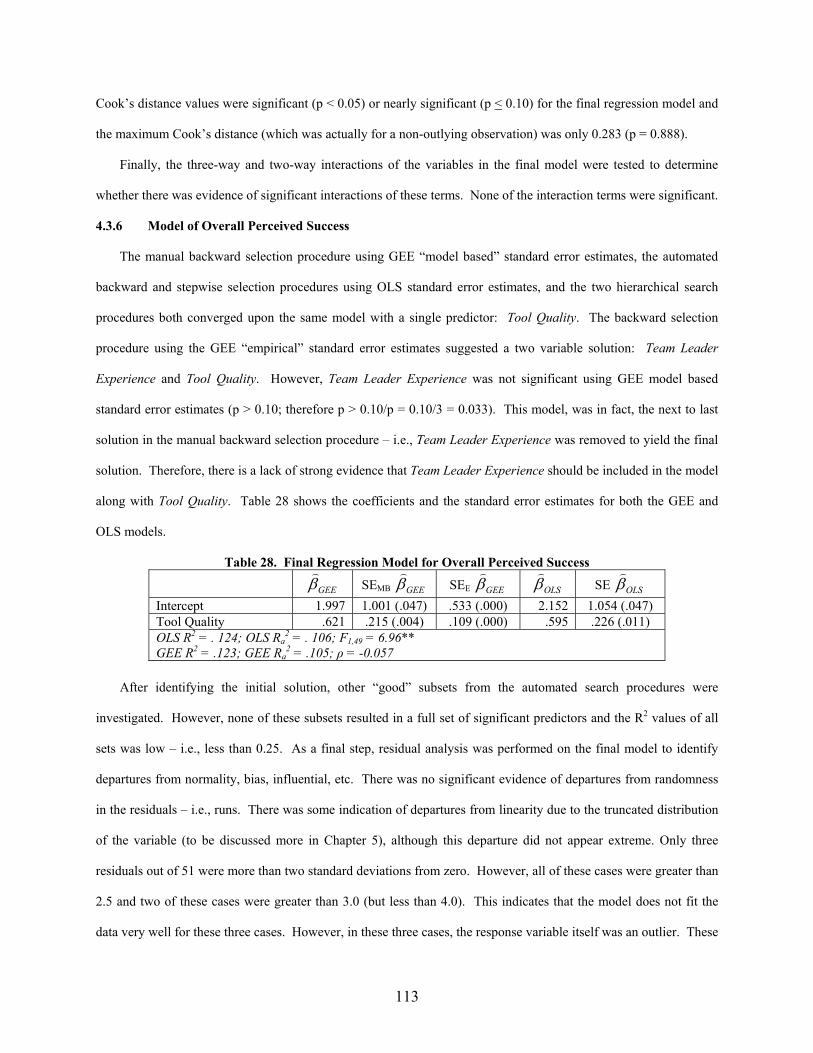
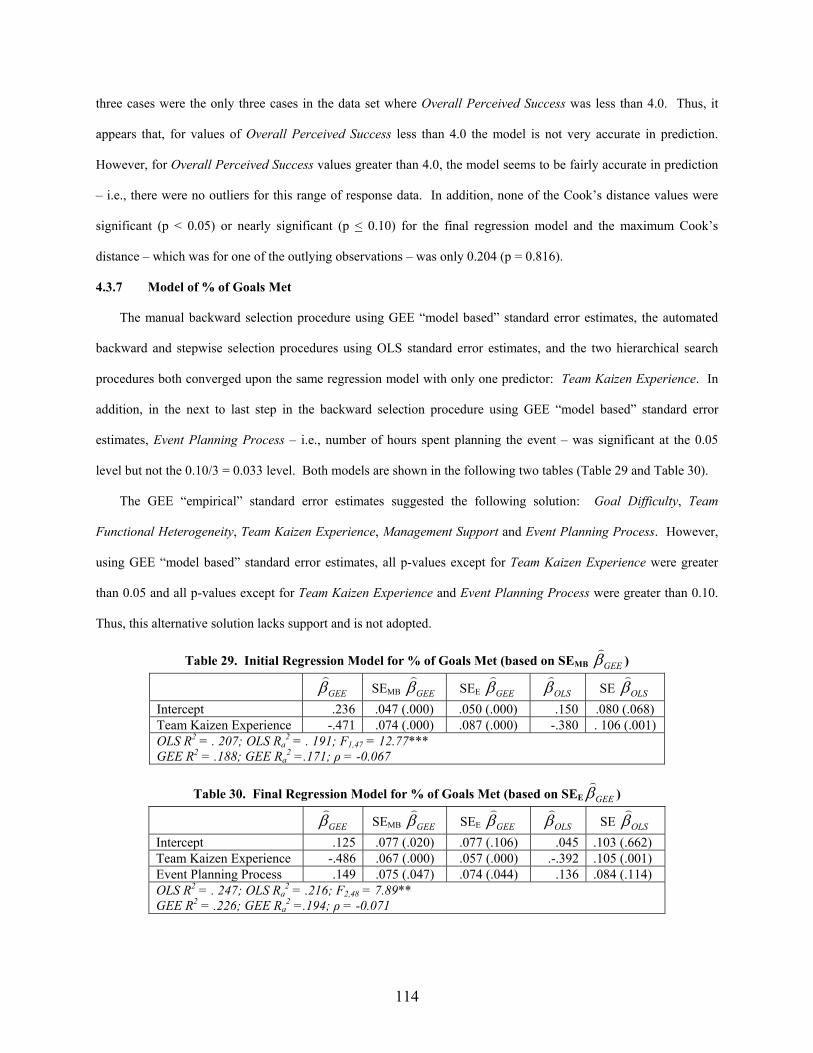
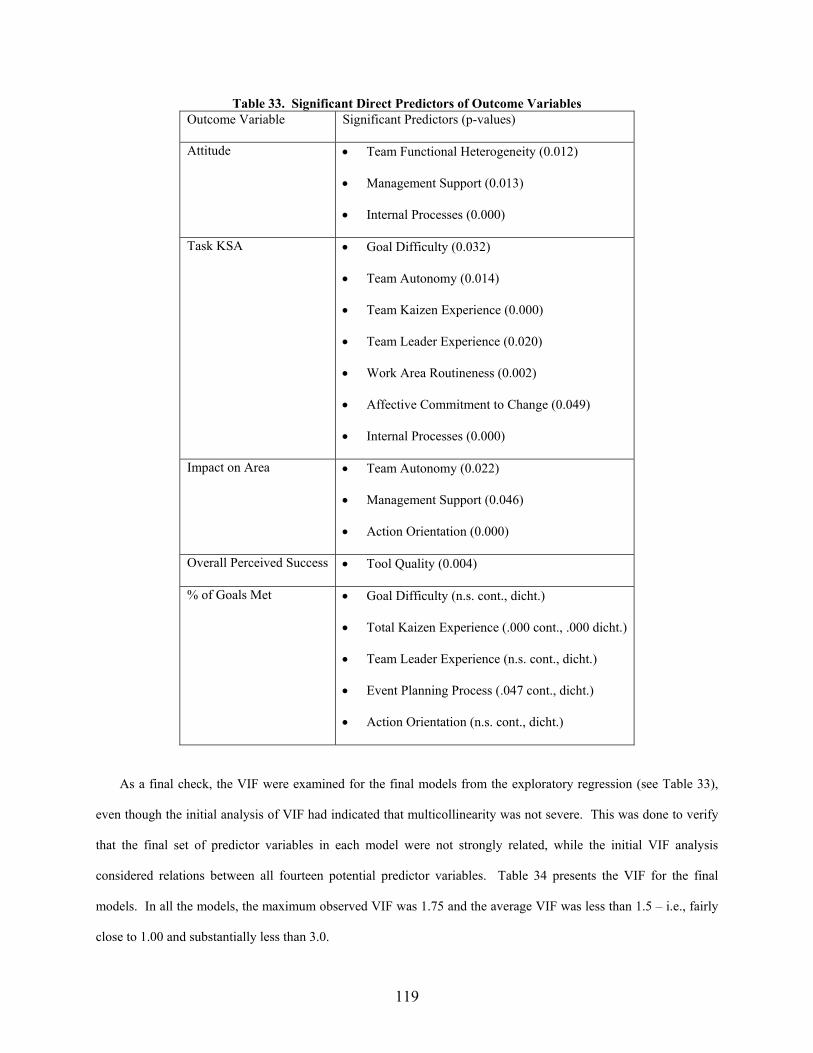
4.3.2 Model Building Process ..................................................................................................................99 4.3.3 Model of Attitude..........................................................................................................................104 4.3.4 Model of Task KSA ......................................................................................................................108 4.3.5 Model of Impact on Area ..............................................................................................................111 4.3.6 Model of Overall Perceived Success.............................................................................................113 4.3.7 Model of % of Goals Met .............................................................................................................114 4.3.8 Summary of Final Regression Models ..........................................................................................118
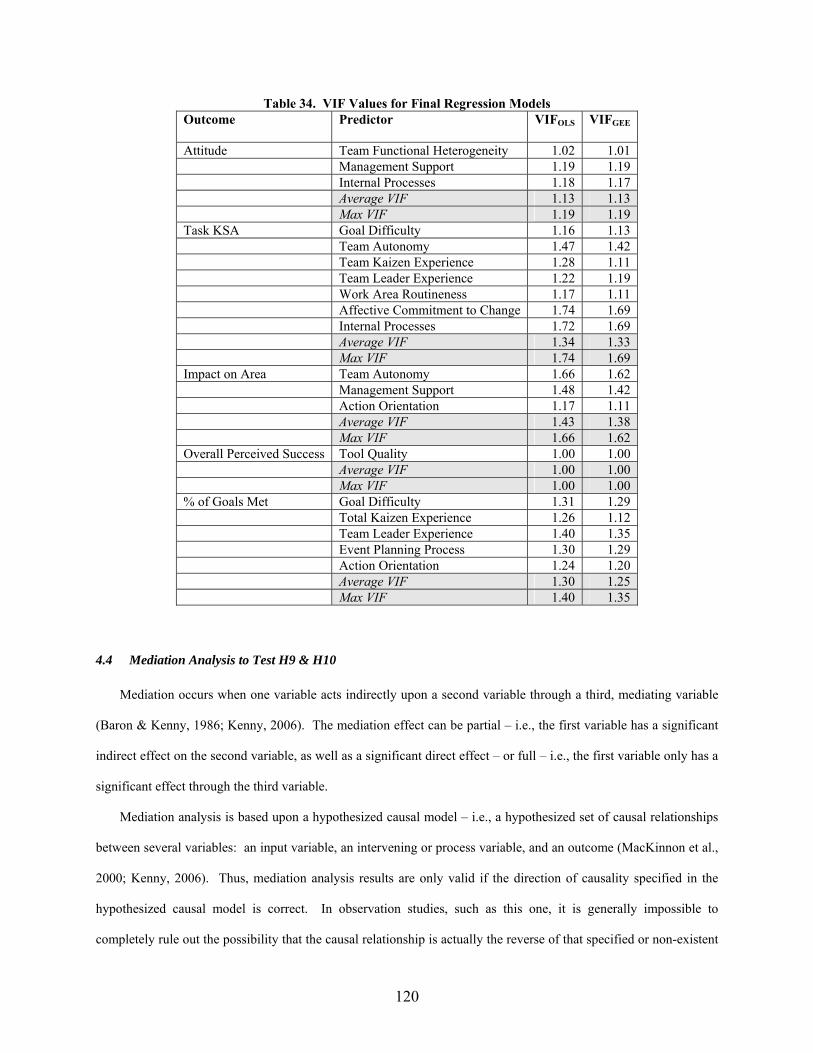
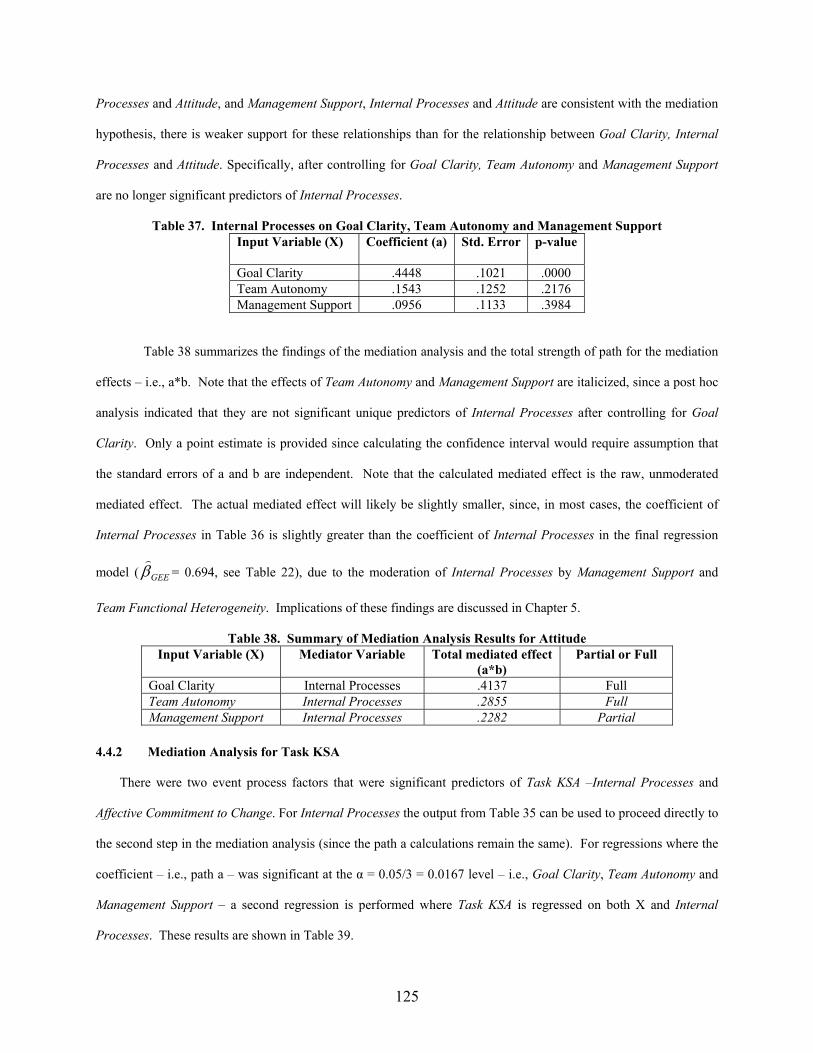
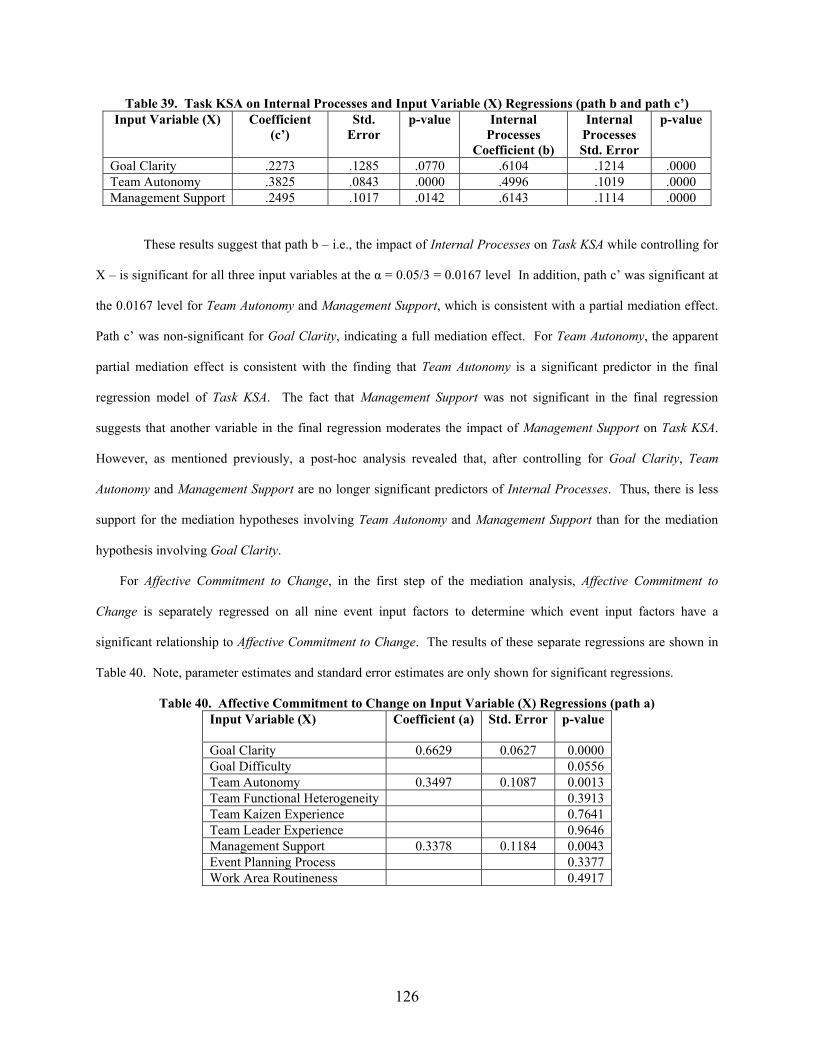
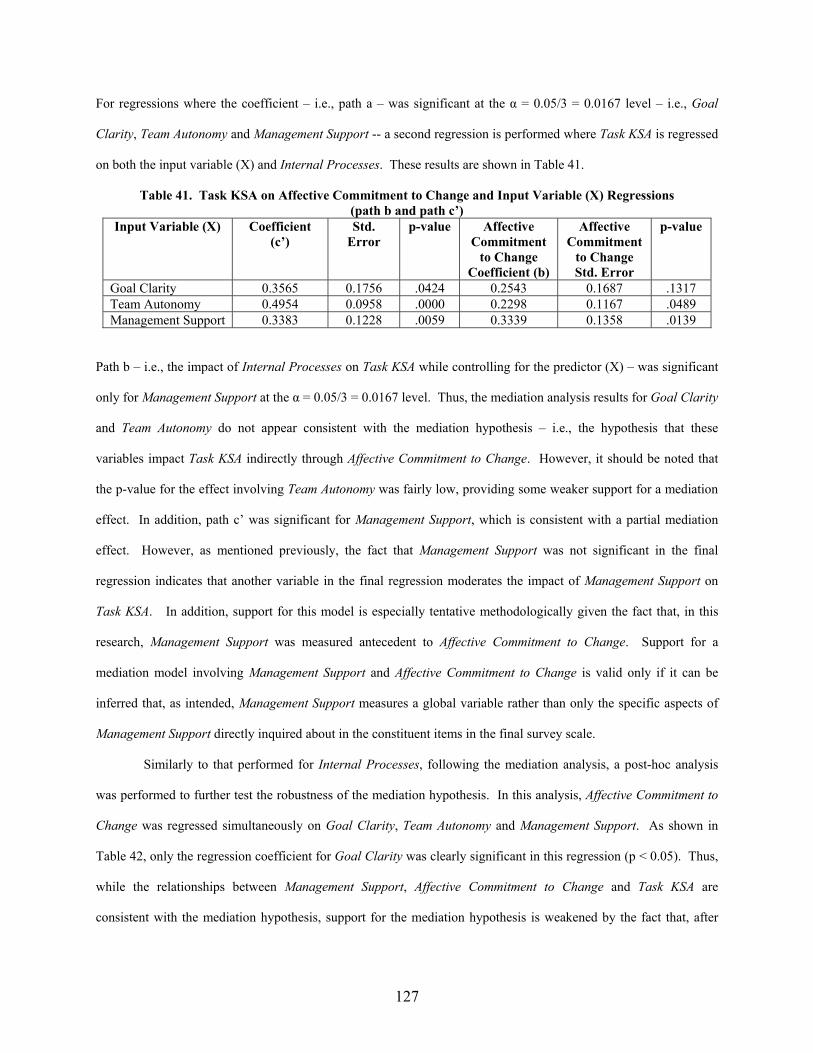
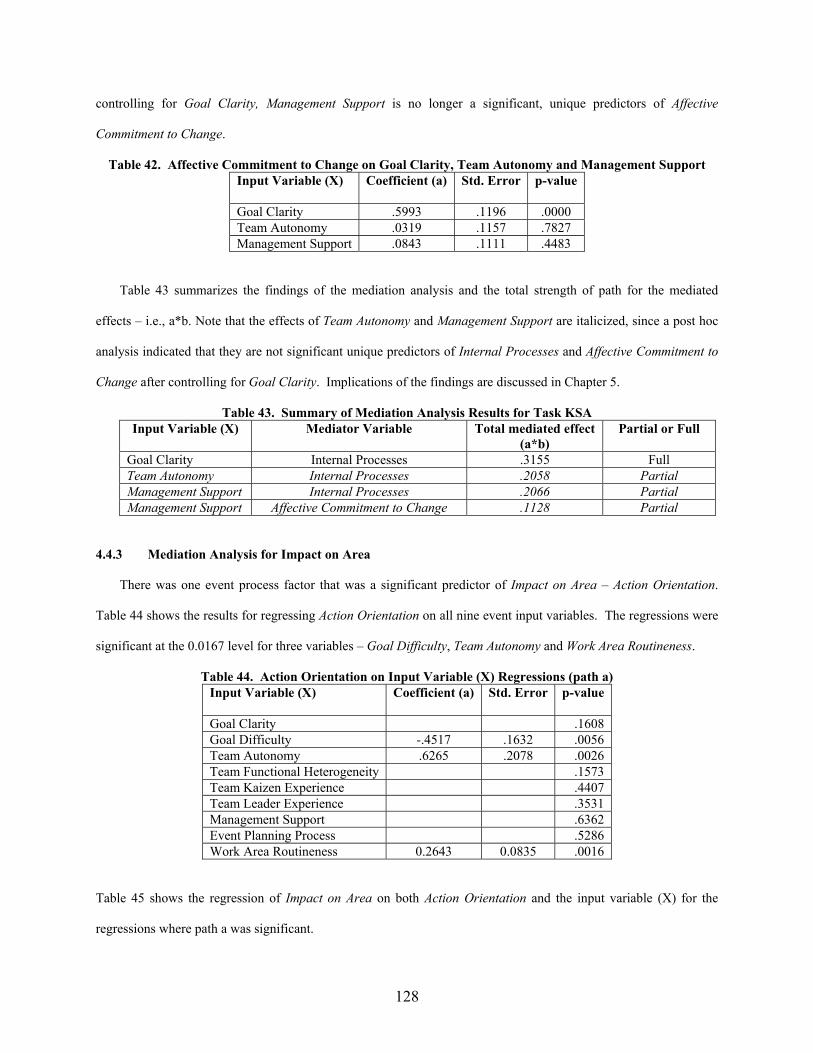
4.4 Mediation Analysis to Test H9 & H10 ...................................................................................................120 4.4.1 Mediation Analysis for Attitude....................................................................................................123 4.4.2 Mediation Analysis for Task KSA................................................................................................125 4.4.3 Mediation Analysis for Impact on Area........................................................................................128 4.4.4 Mediation Analysis for Overall Perceived Success ......................................................................130 4.4.5 Mediation Analysis for % of Goals Met .......................................................................................131
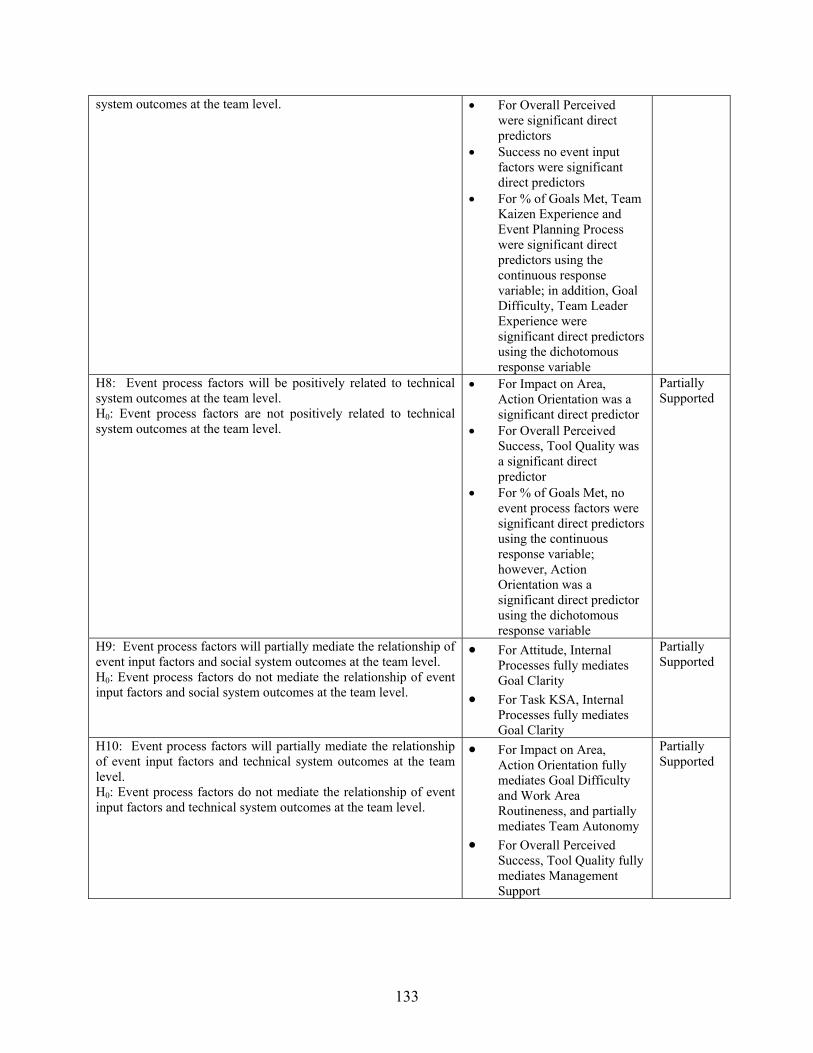
4.5 Summary of Results of Hypothesis Tests ...............................................................................................132 4.6 Post-Hoc Control Variable Analyses......................................................................................................134
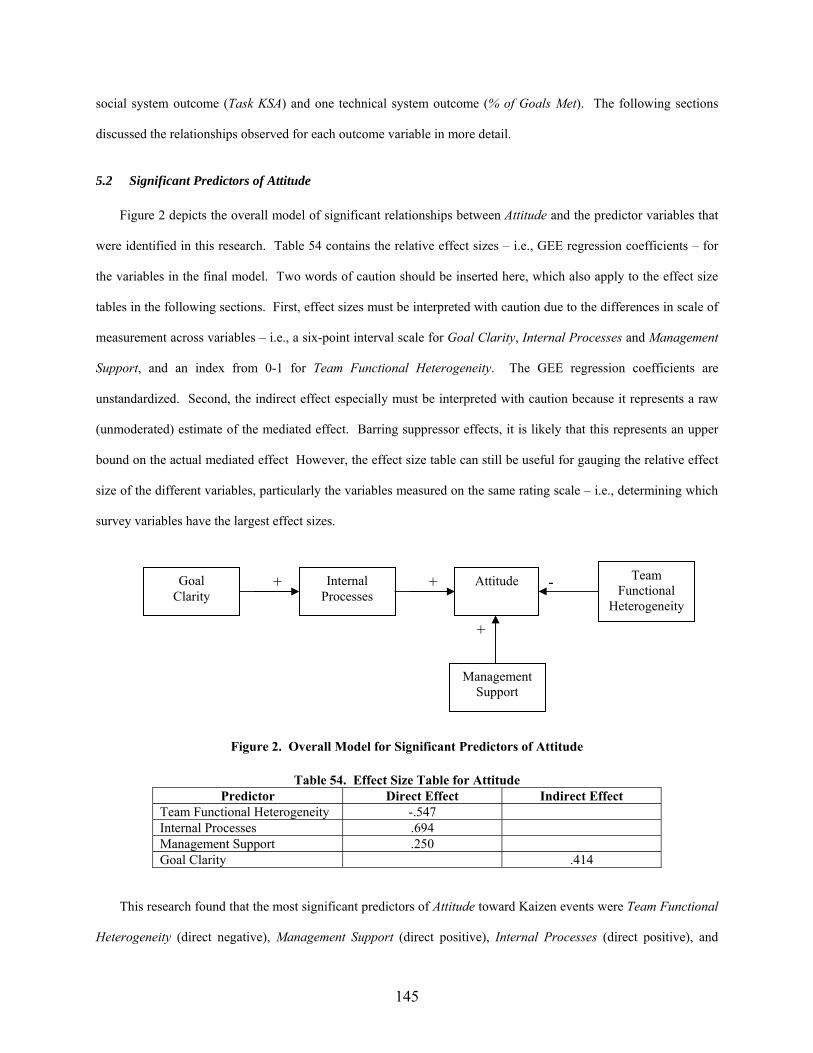
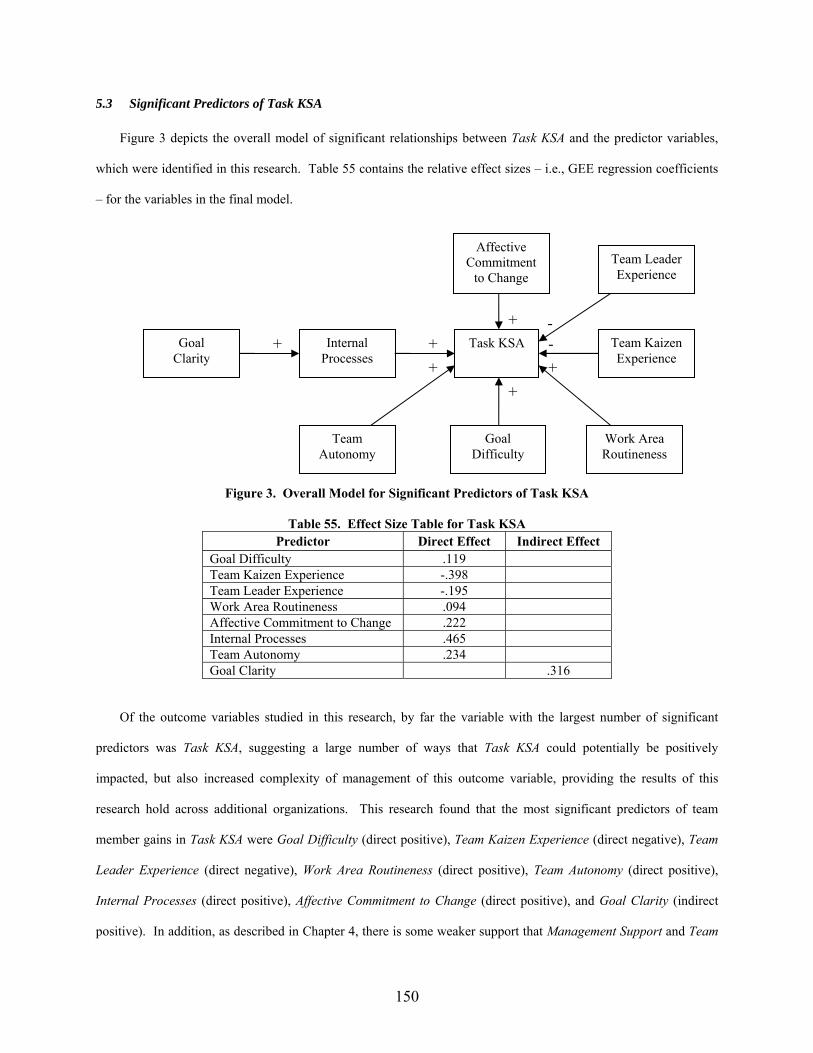
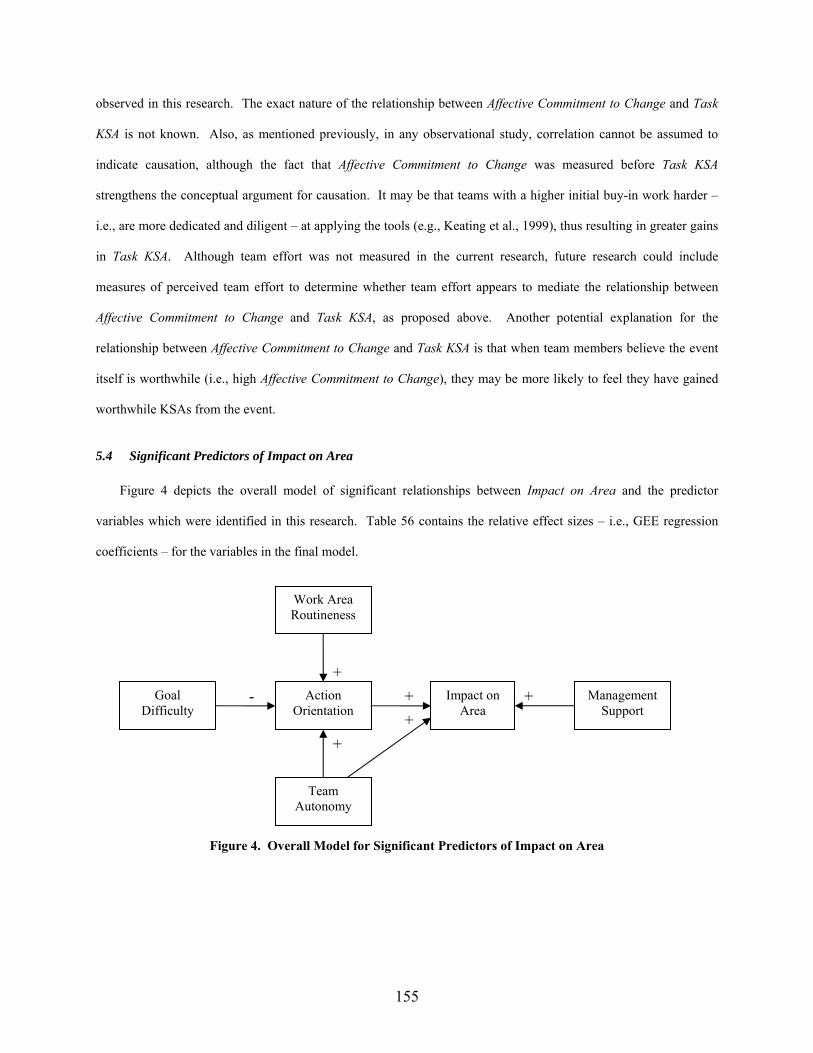
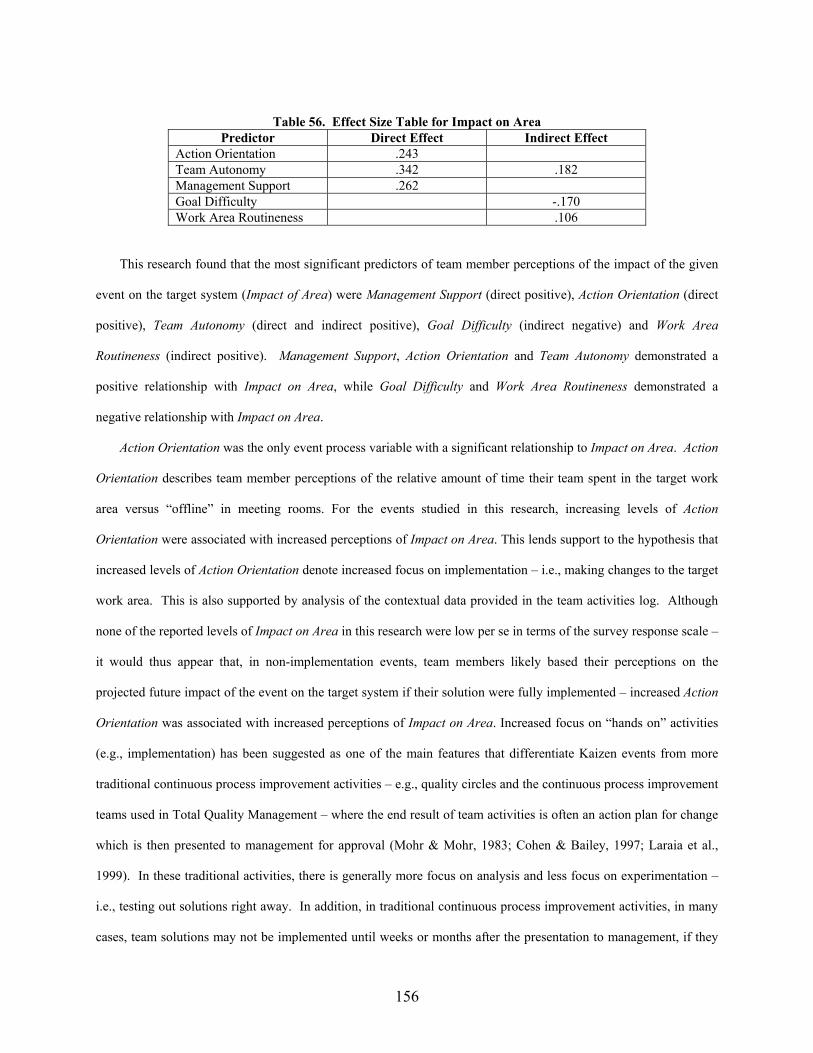
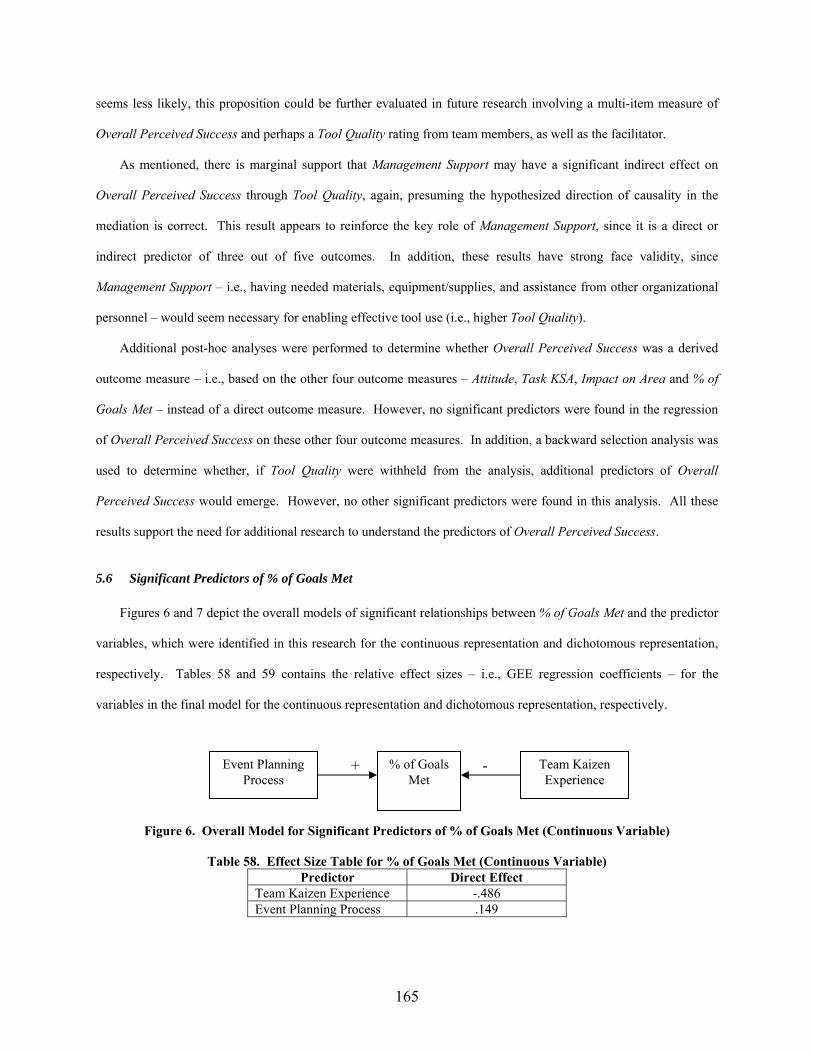
5.1 Relationship between Kaizen Event Outcomes ......................................................................................139 5.2 Significant Predictors of Attitude ...........................................................................................................145 5.3 Significant Predictors of Task KSA .......................................................................................................150 5.4 Significant Predictors of Impact on Area ...............................................................................................155 5.5 Significant Predictors of Overall Perceived Success ..............................................................................162 5.6 Significant Predictors of % of Goals Met...............................................................................................165 5.7 Limitations of the Present Research .......................................................................................................169
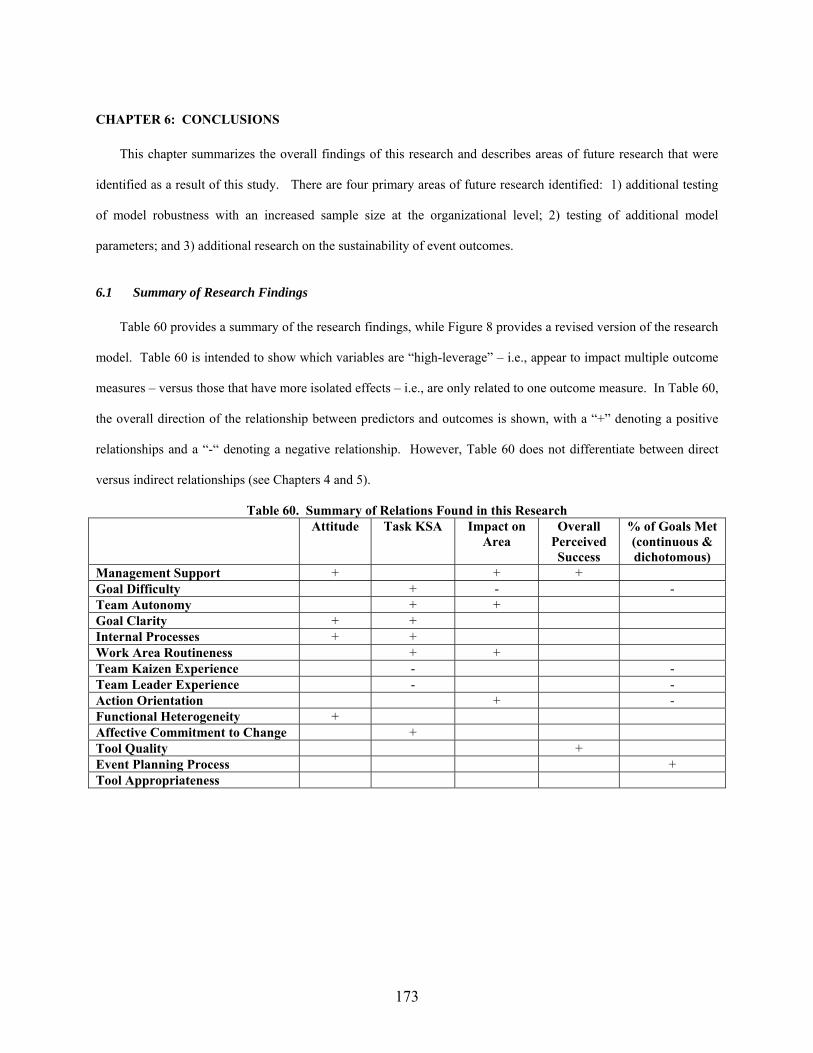
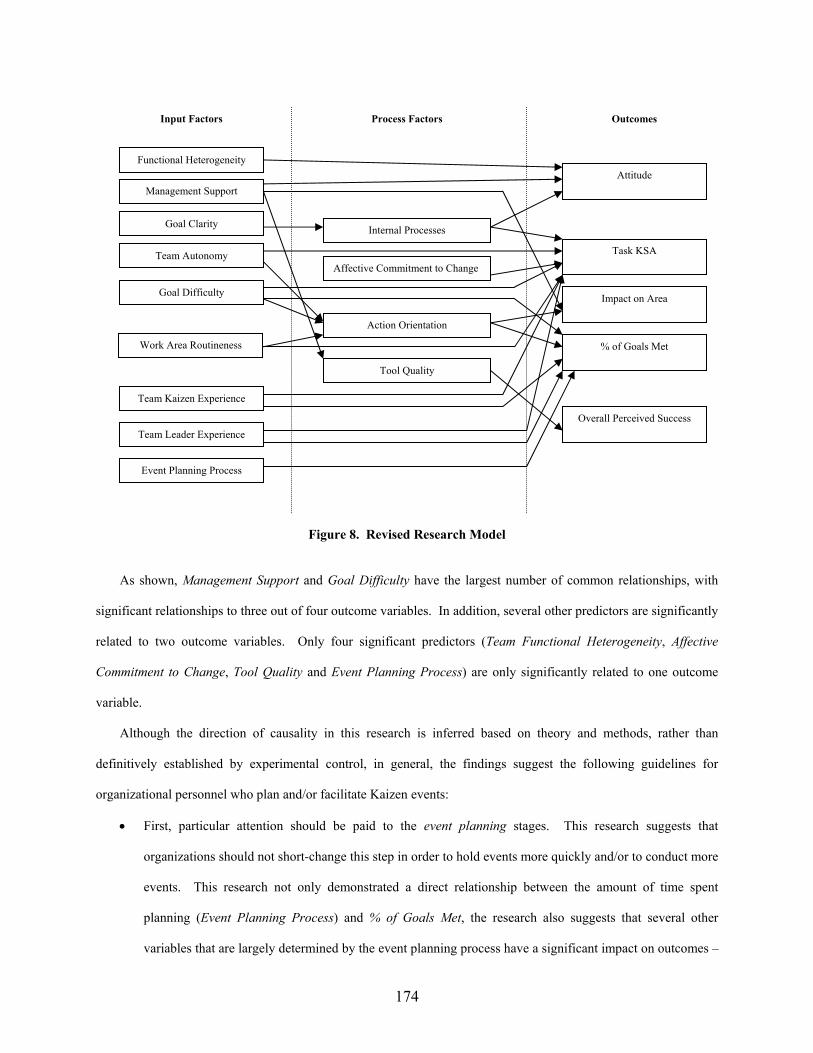
6.1 Summary of Research Findings..............................................................................................................173 6.2 Additional Testing of Model Robustness ...............................................................................................178 6.3 Testing of Additional Model Parameters................................................................................................179 6.4 Research on Sustainability of Event Outcomes......................................................................................180
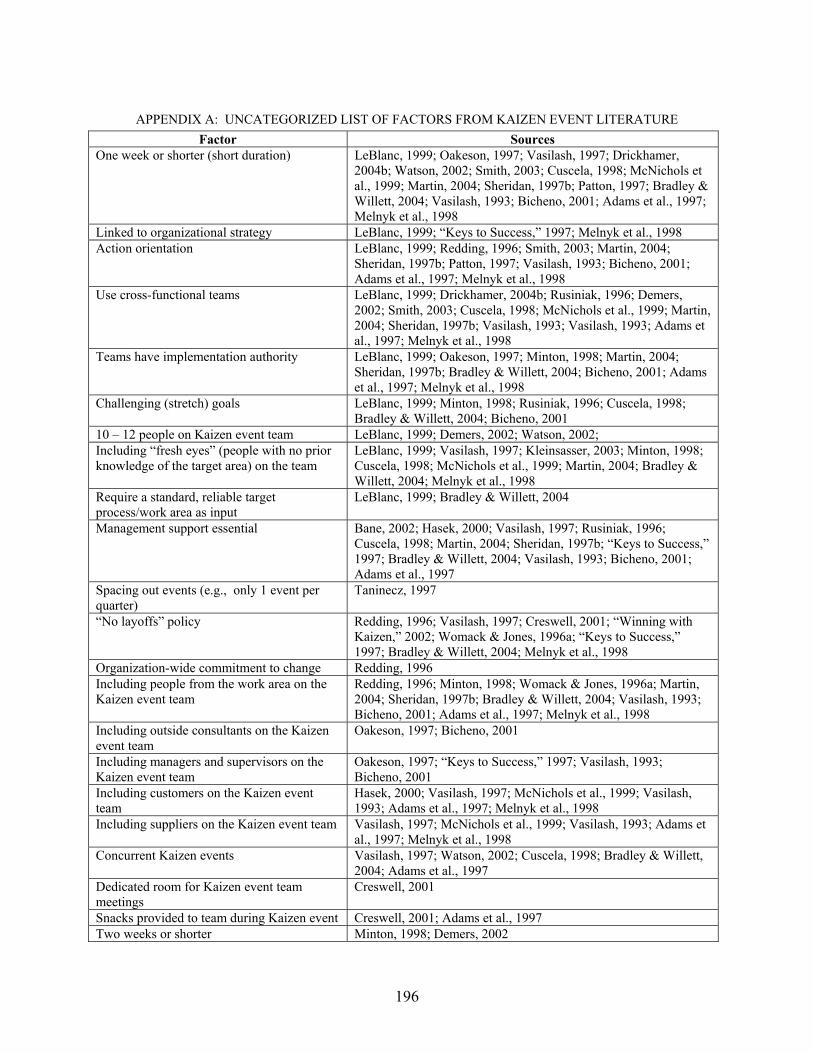
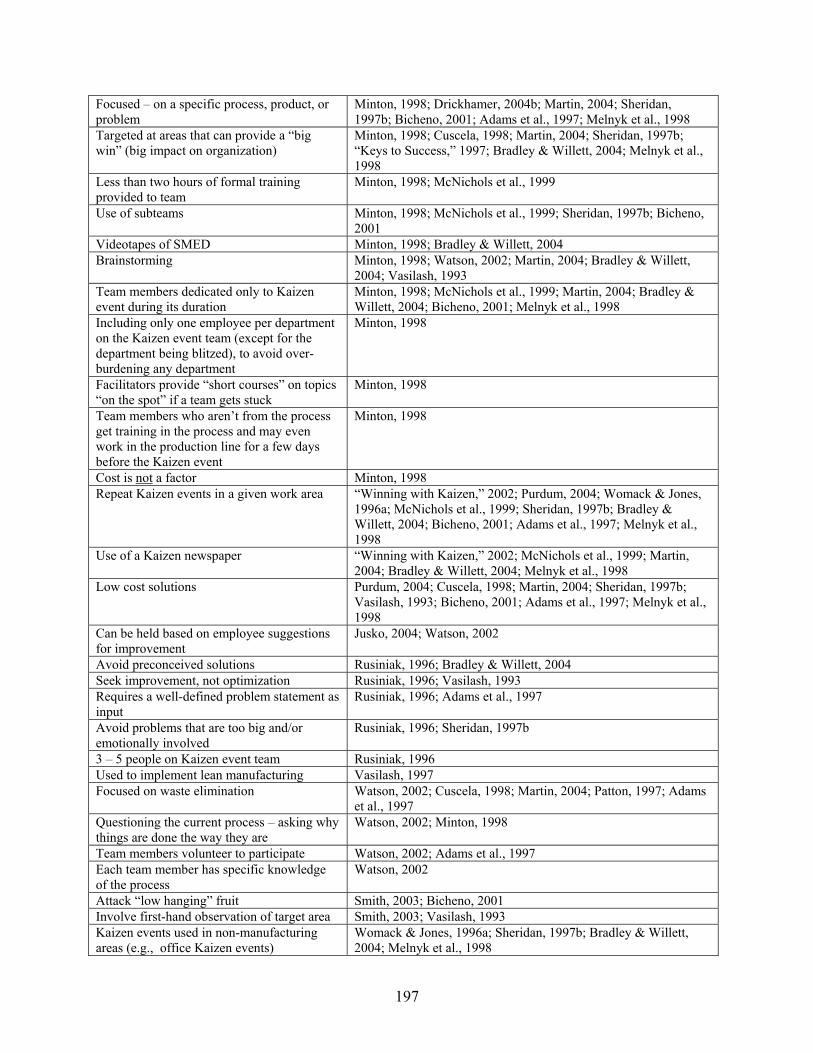
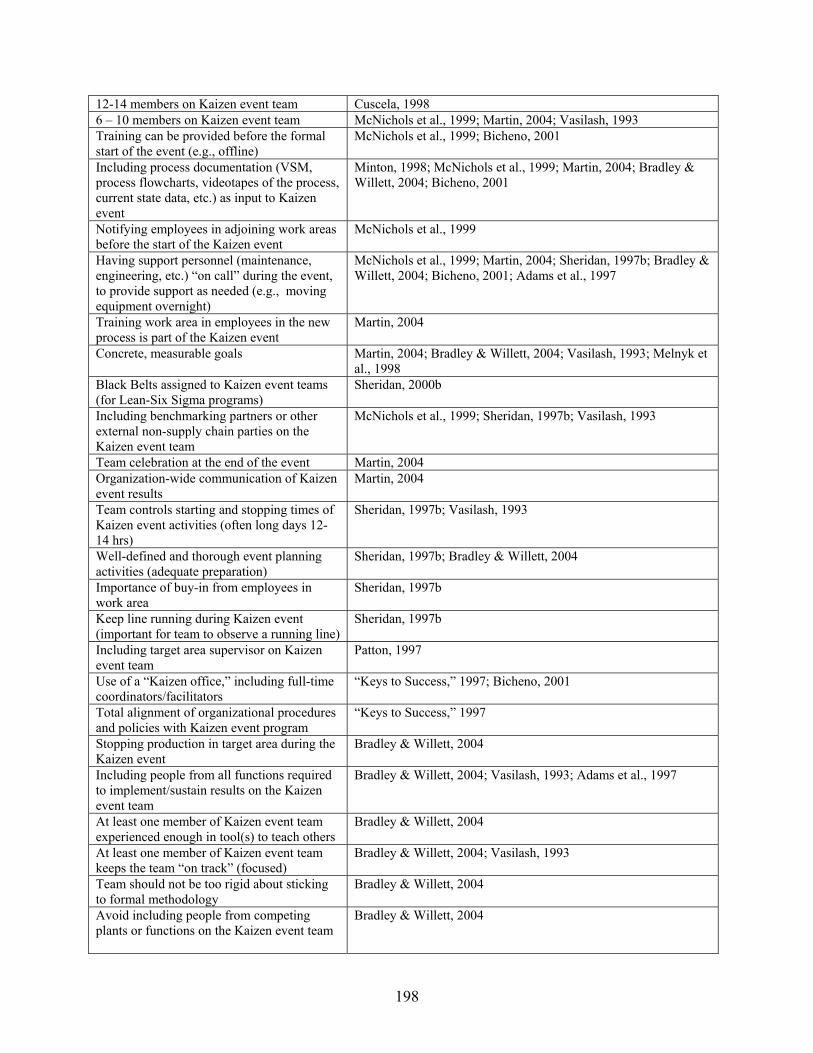
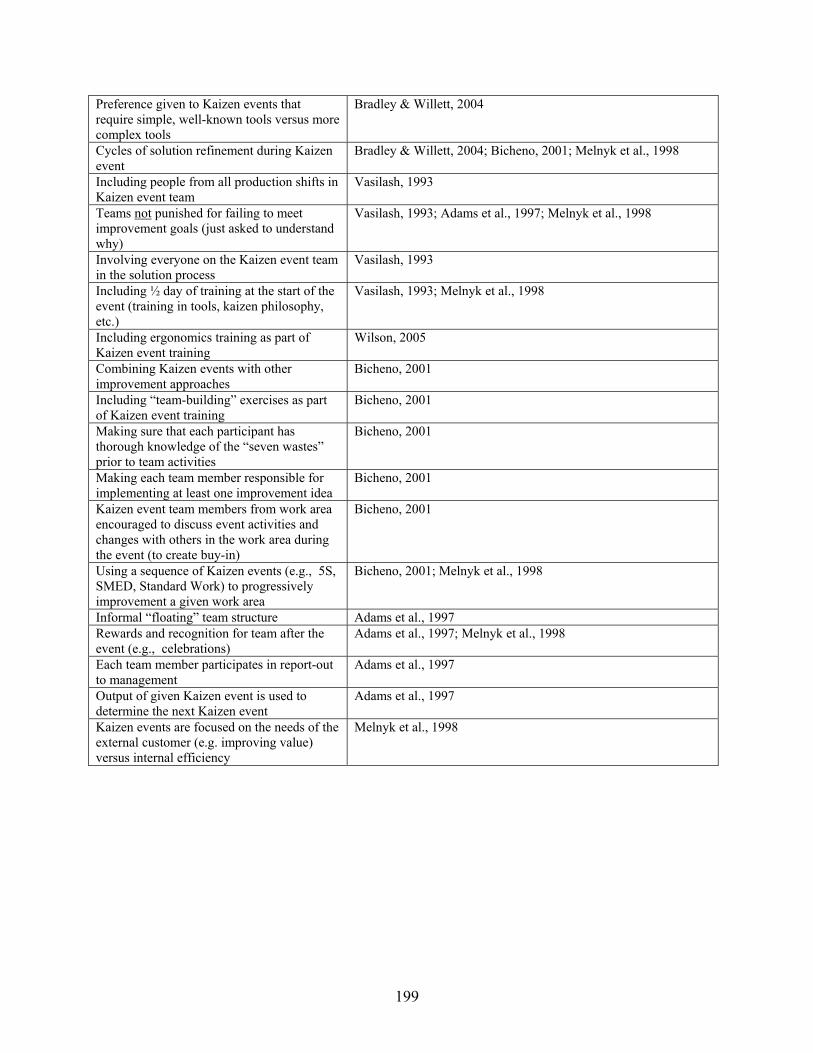
APPENDIX A: UNCATEGORIZED LIST OF FACTORS FROM KAIZEN EVENT LITERATURE .................196
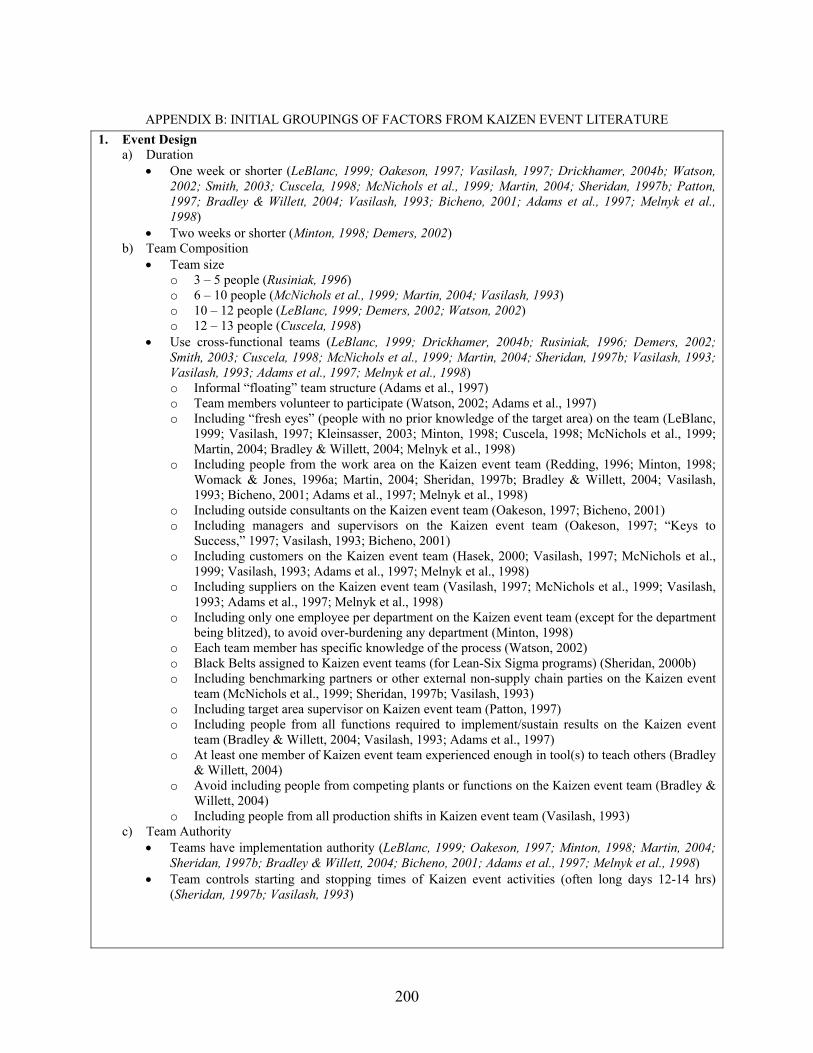
APPENDIX B: INITIAL GROUPINGS OF FACTORS FROM KAIZEN EVENT LITERATURE.......................200
APPENDIX C: CATEGORIES OF FACTORS FROM KAIZEN EVENT LITERATURE.....................................204
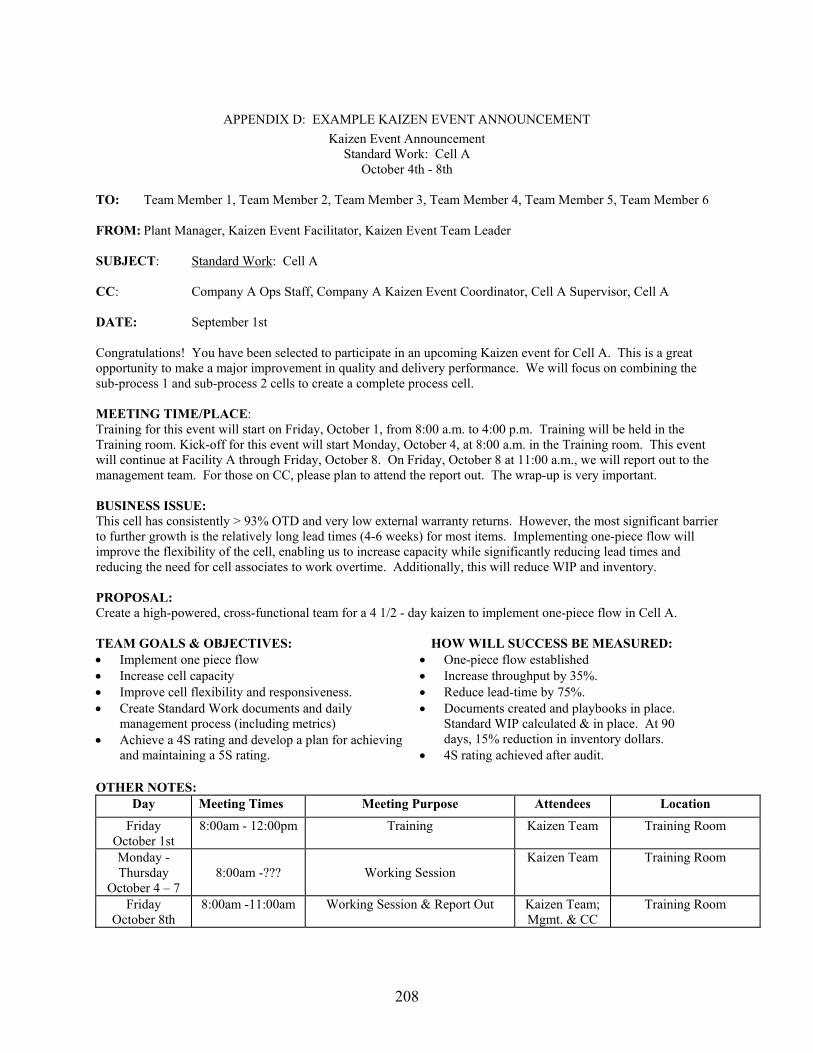
APPENDIX D: EXAMPLE KAIZEN EVENT ANNOUNCEMENT .....................................................................208
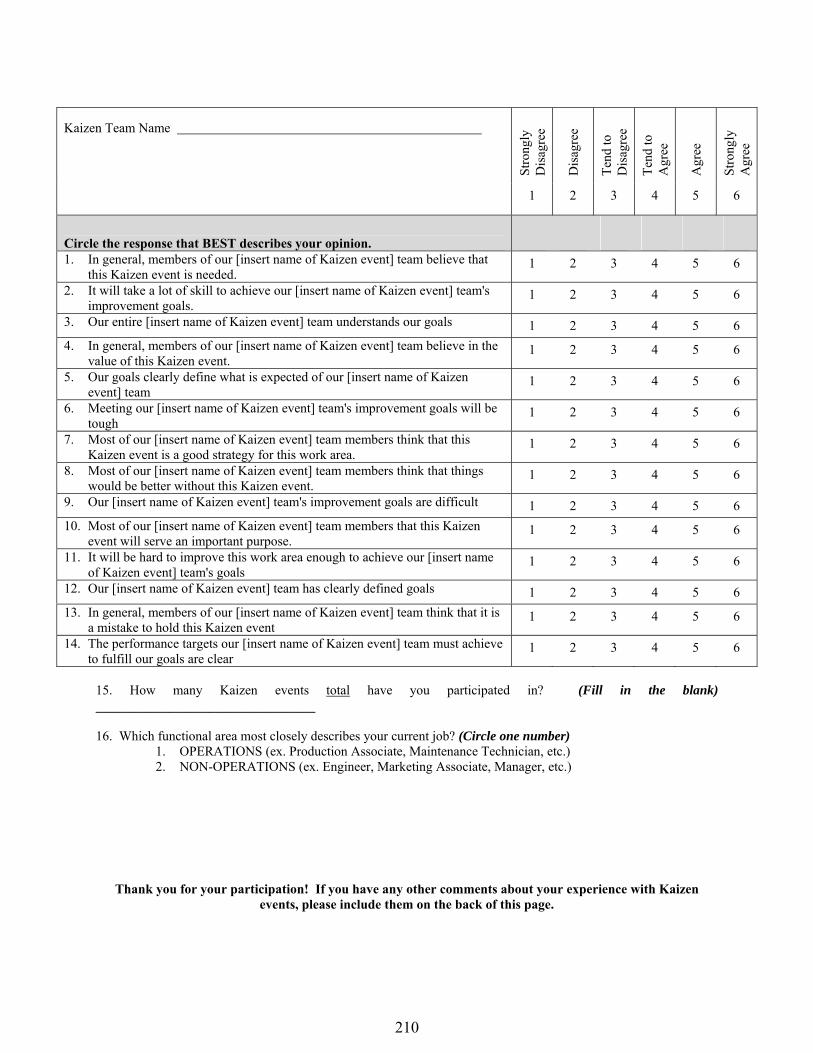
APPENDIX E: PILOT VERSION OF KICKOFF SURVEY ..................................................................................209
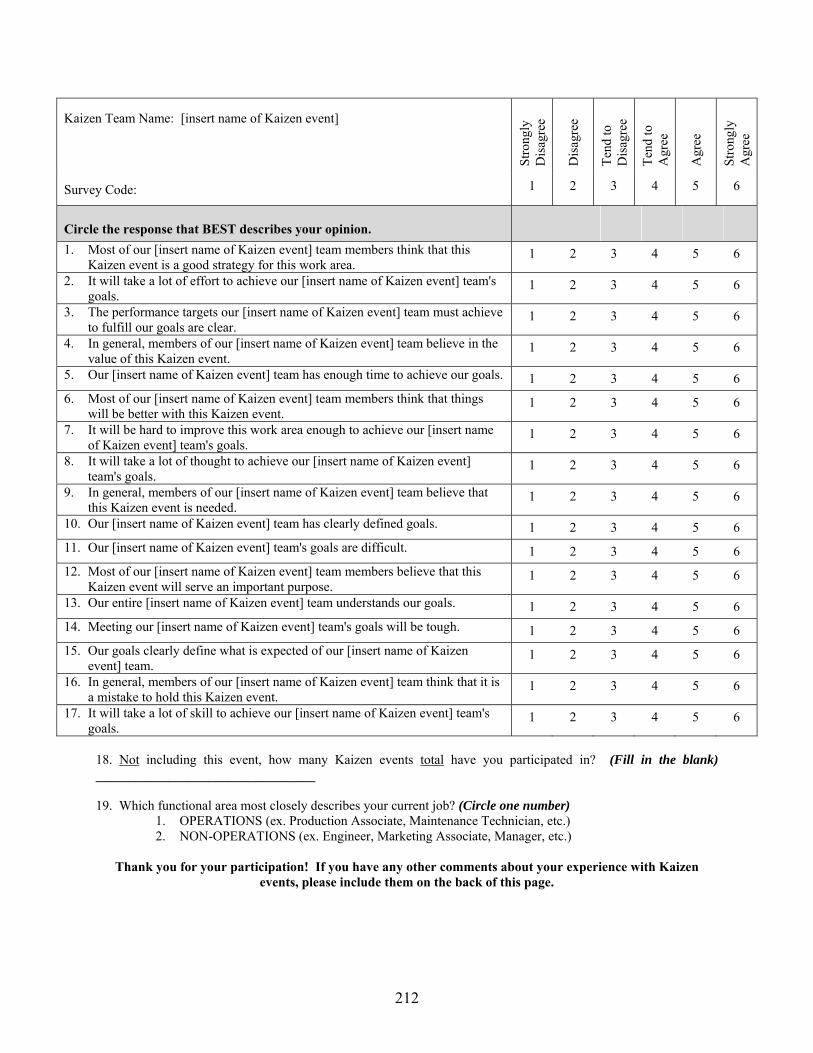
APPENDIX F: FINAL VERSION OF KICKOFF SURVEY ..................................................................................211
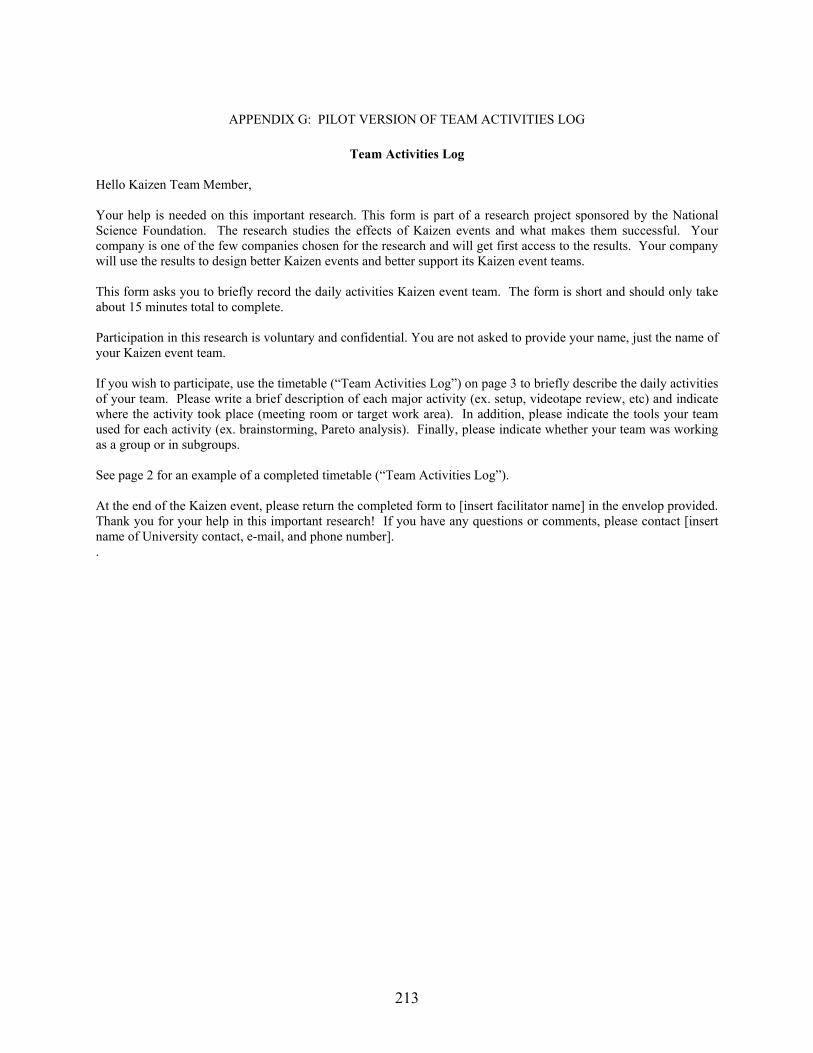
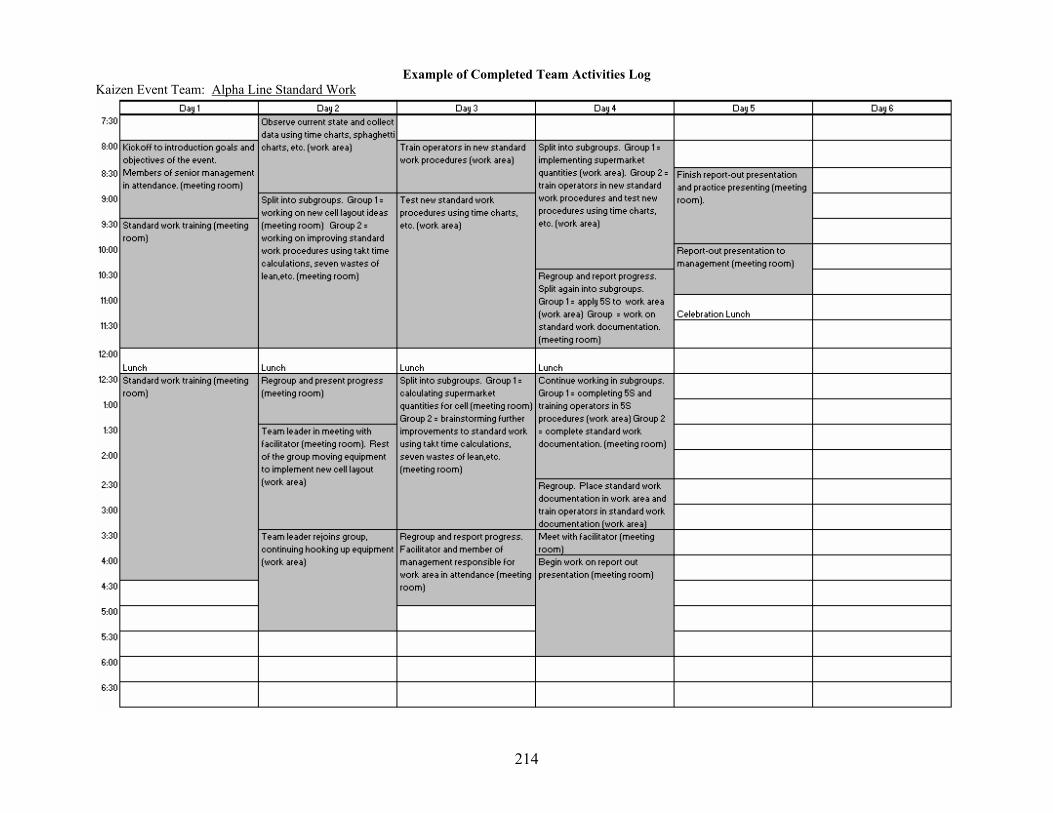
APPENDIX G: PILOT VERSION OF TEAM ACTIVITIES LOG.........................................................................213
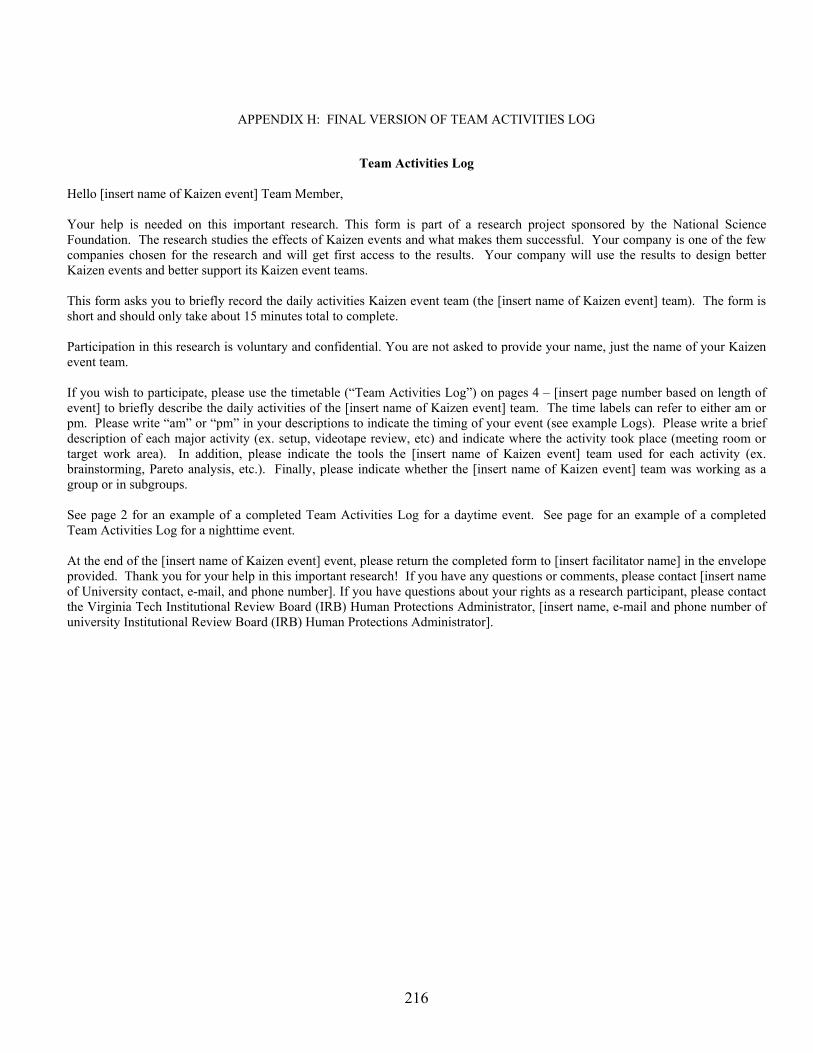
APPENDIX H: FINAL VERSION OF TEAM ACTIVITIES LOG ........................................................................216
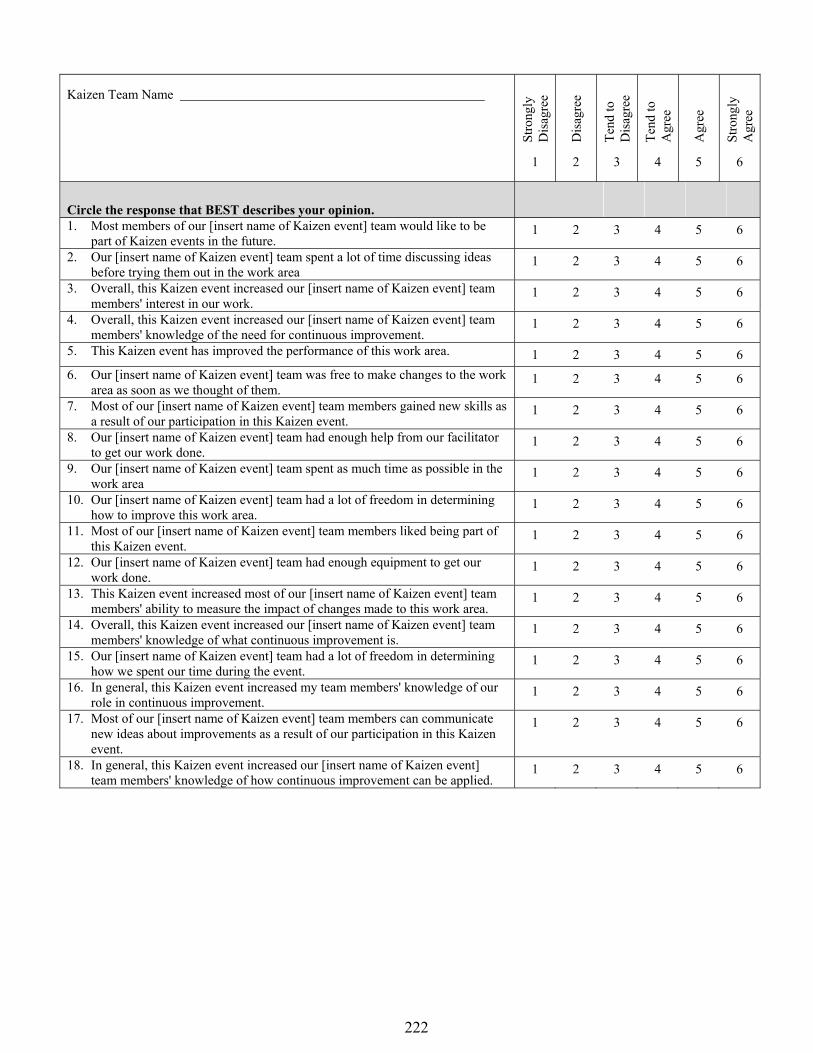
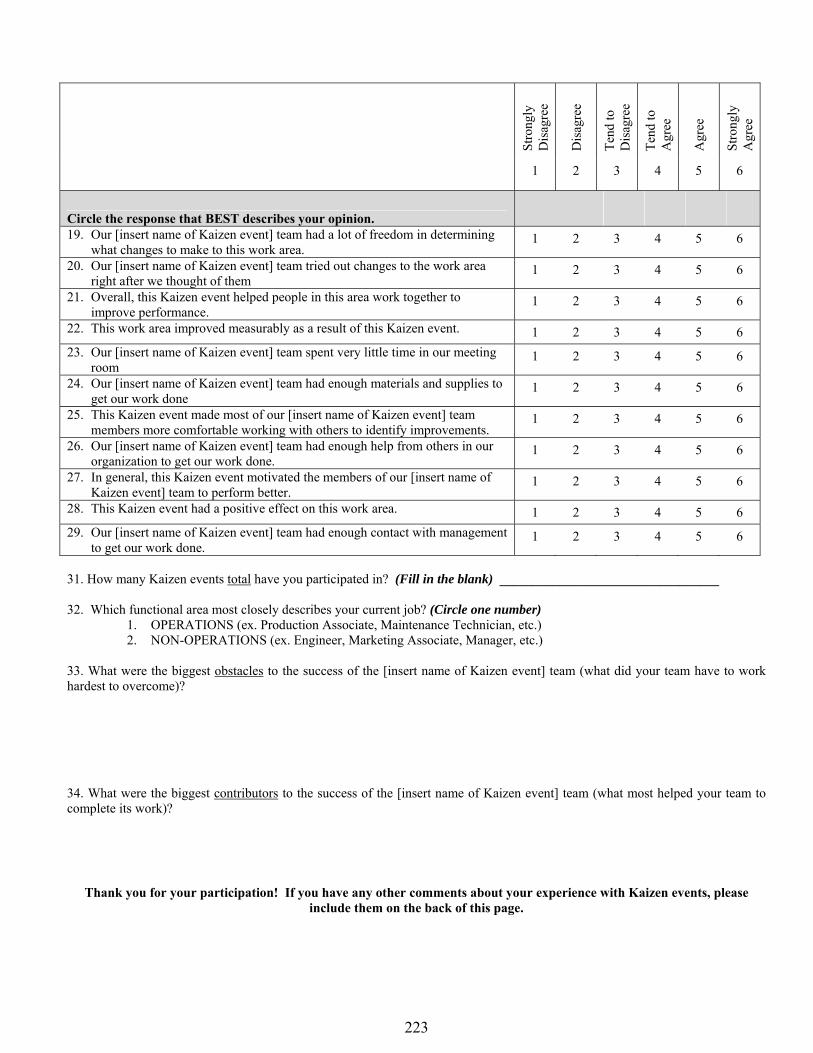
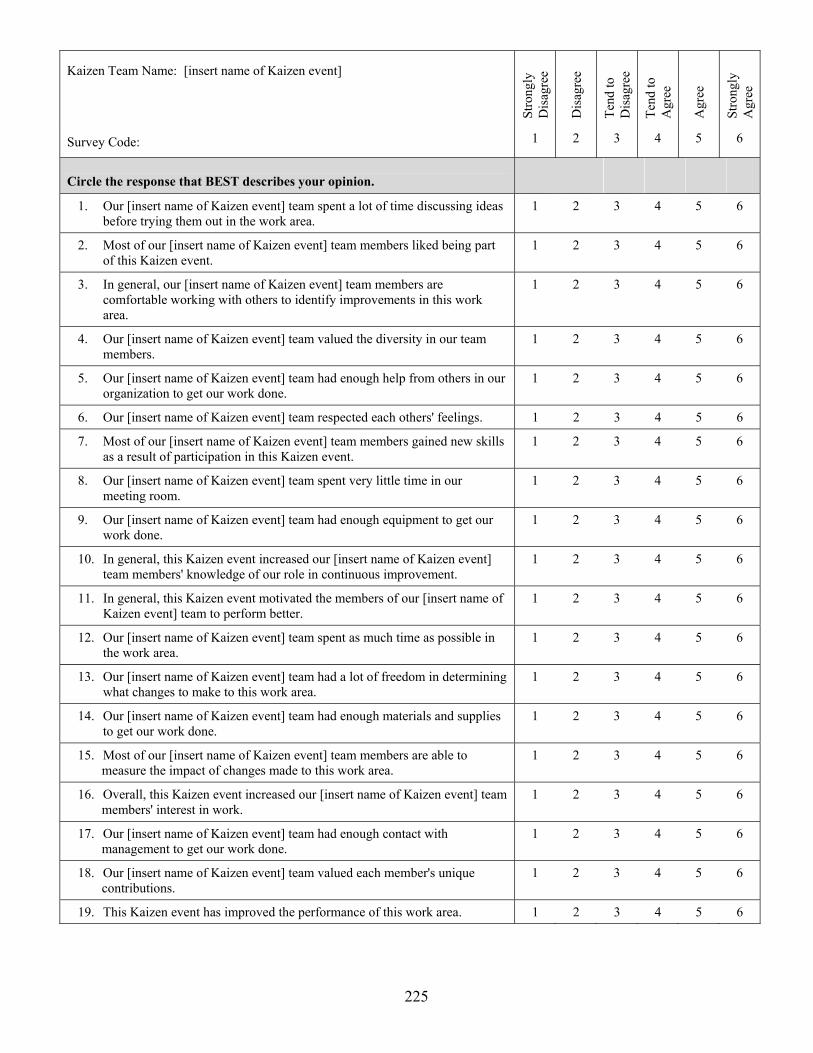
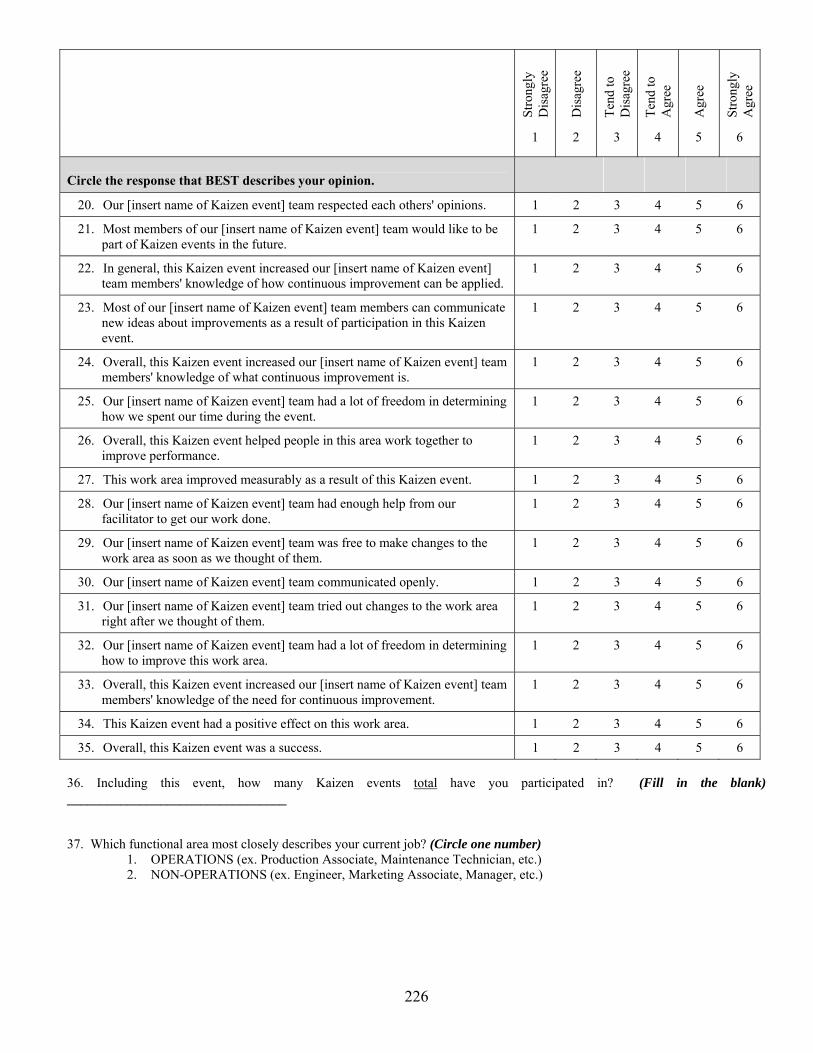
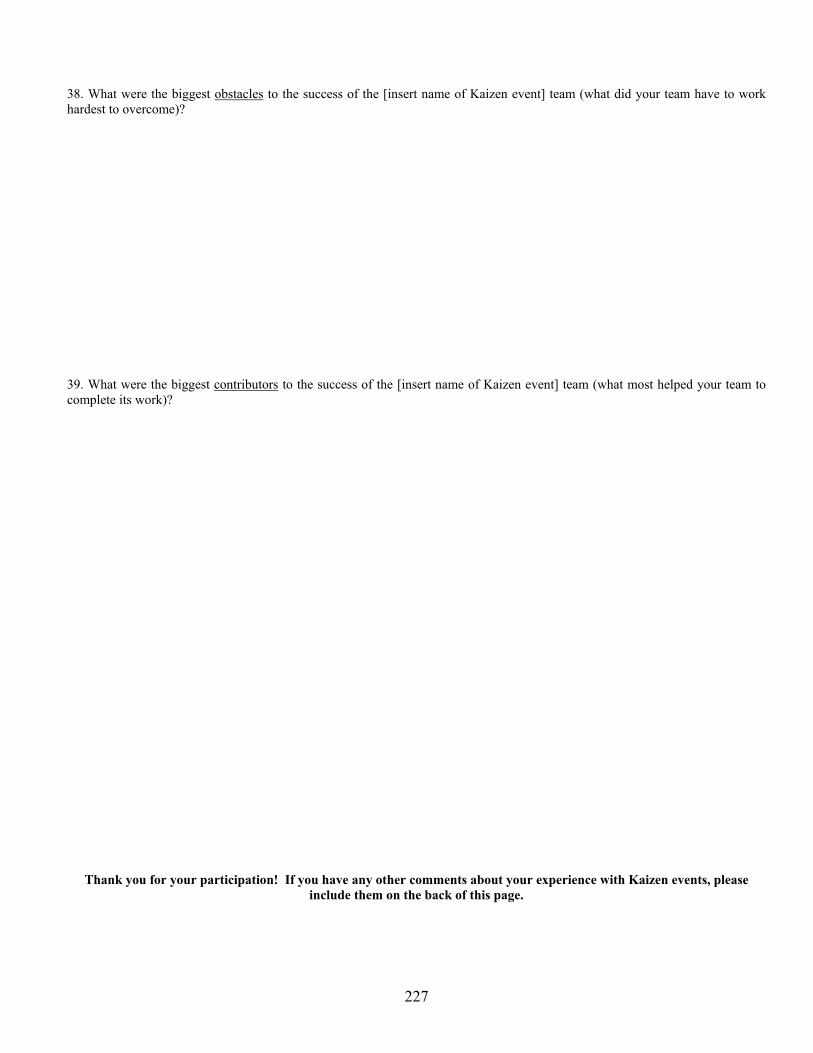
APPENDIX I: PILOT VERSION OF REPORT OUT SURVEY ............................................................................221
APPENDIX J: FINAL VERSION OF REPORT OUT SURVEY............................................................................224
v
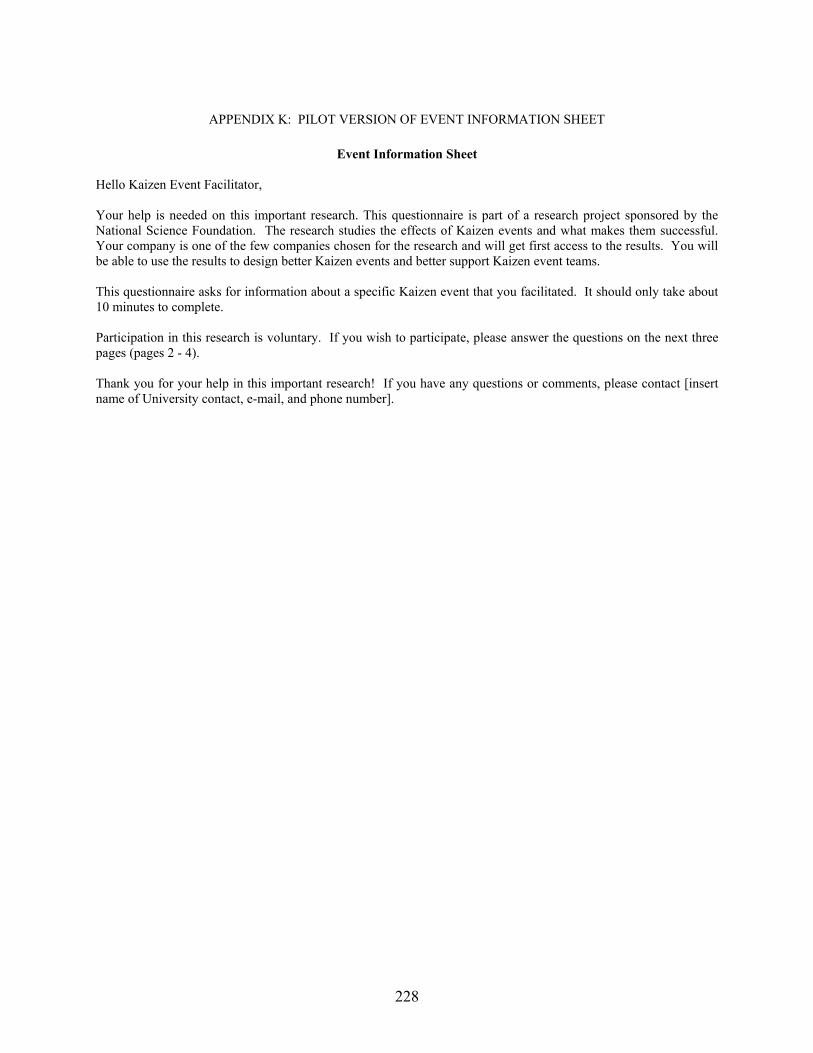
APPENDIX K: PILOT VERSION OF EVENT INFORMATION SHEET.............................................................228
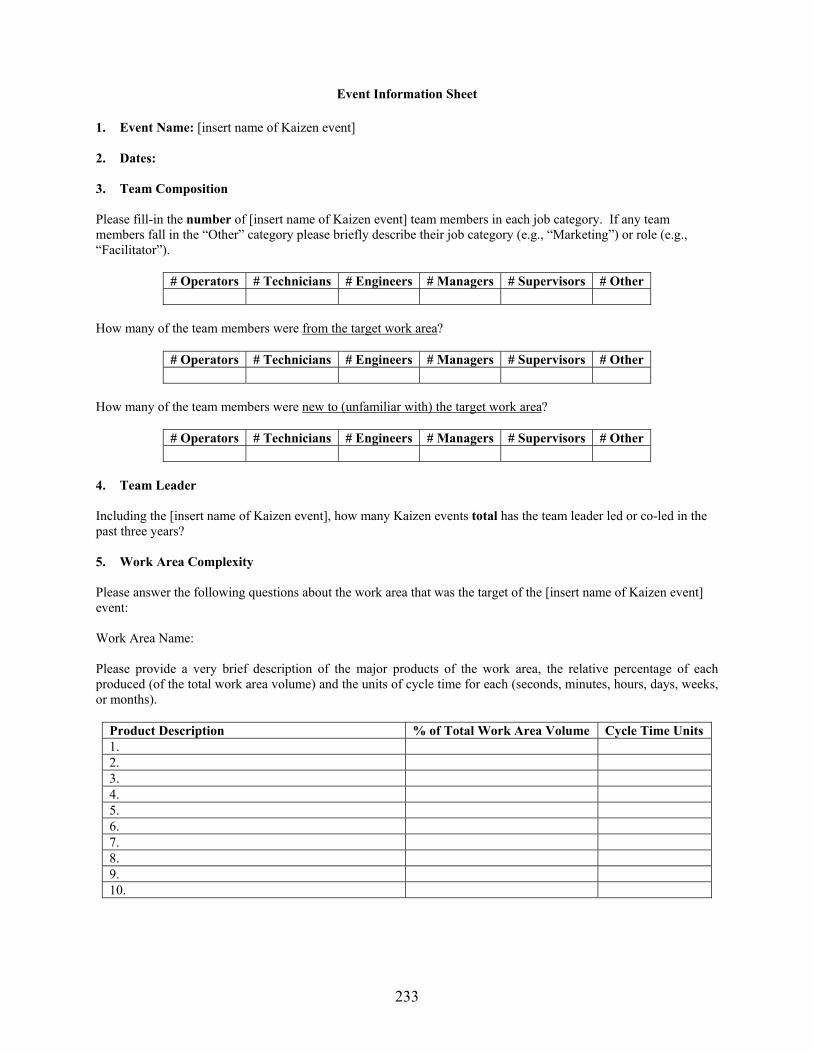
APPENDIX L: FINAL VERSION OF EVENT INFORMATION SHEET.............................................................232
APPENDIX M: PILOT VERSION OF KAIZEN EVENT PROGRAM INTERVIEW GUIDE..............................239
APPENDIX N: PILOT VERSION OF KAIZEN EVENT PROGRAM INTERVIEW GUIDE – WRITTEN
STATEMENT FOR PARTICIPANTS......................................................................................................................242
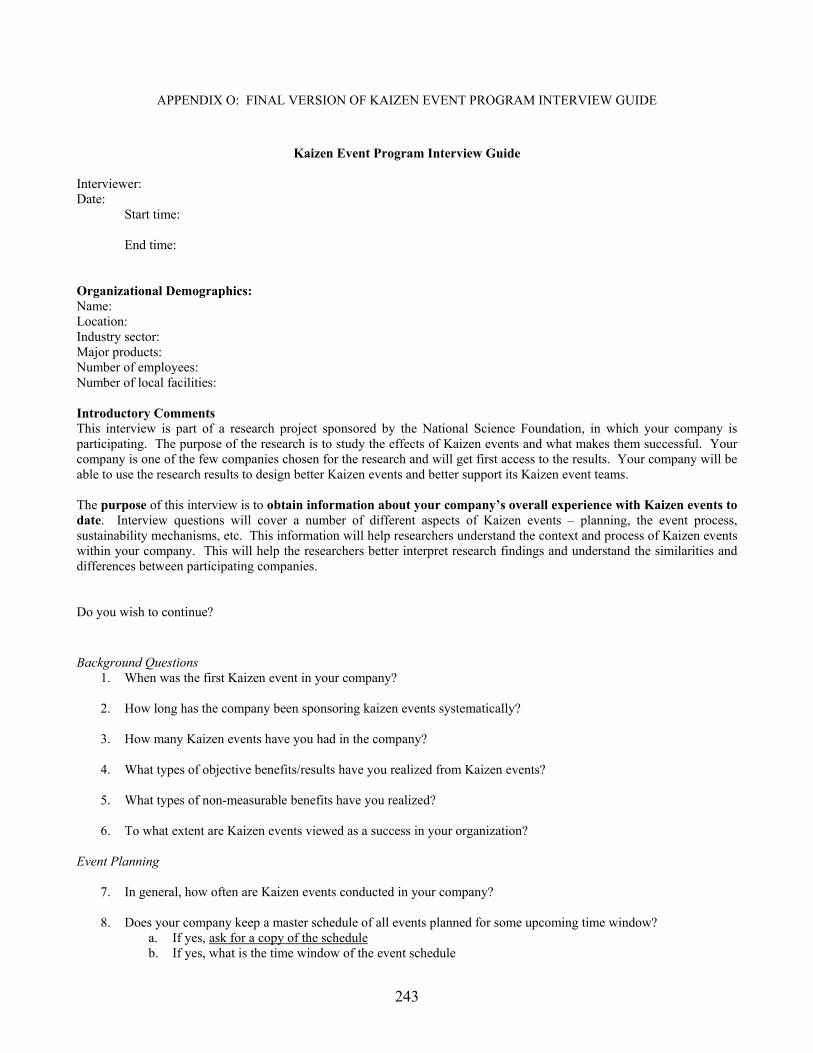
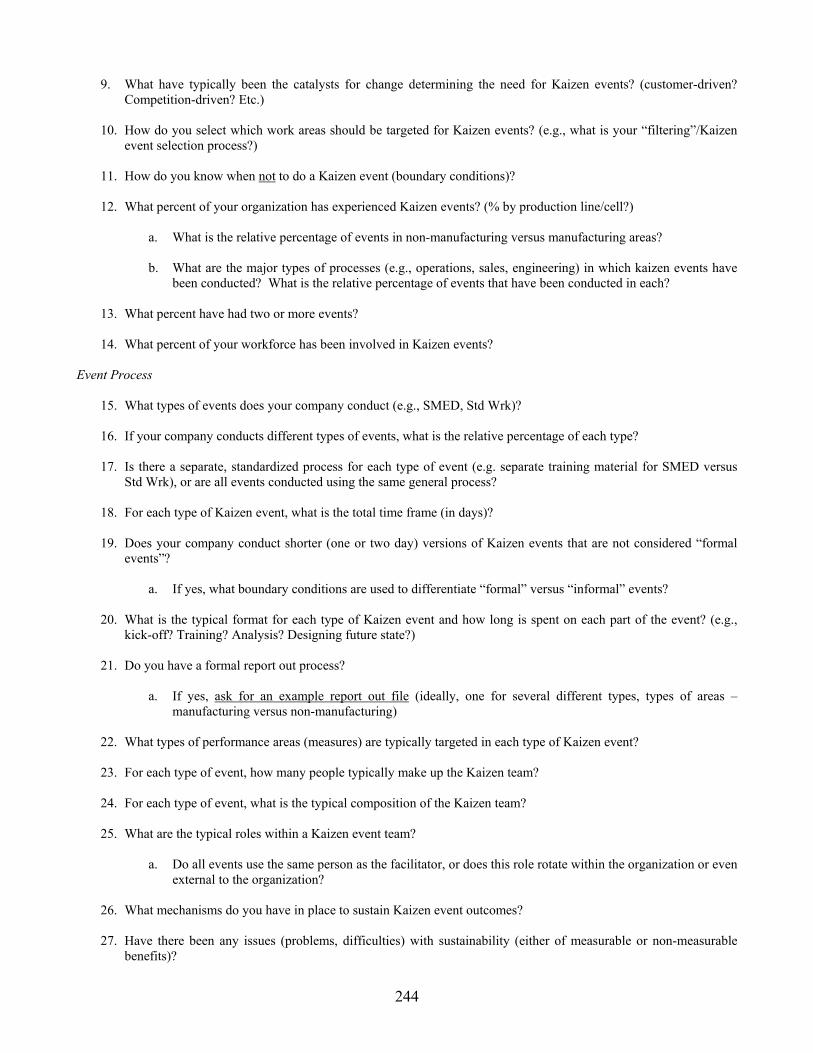
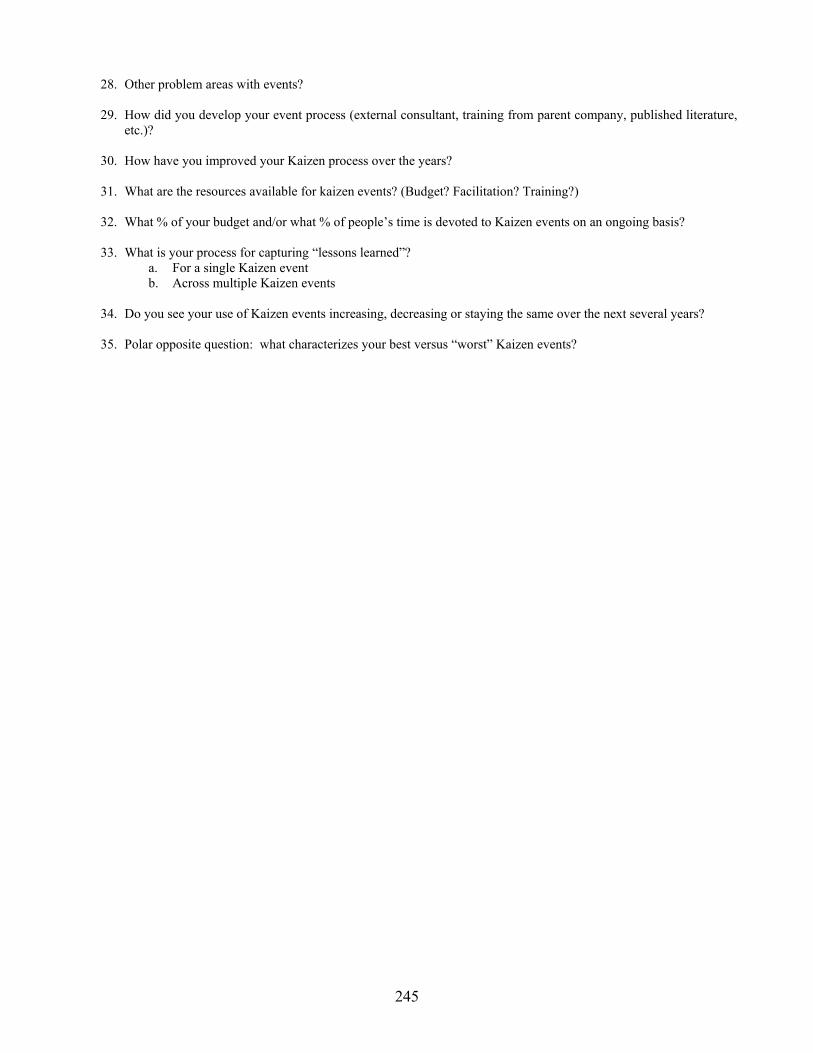
APPENDIX O: FINAL VERSION OF KAIZEN EVENT PROGRAM INTERVIEW GUIDE..............................243
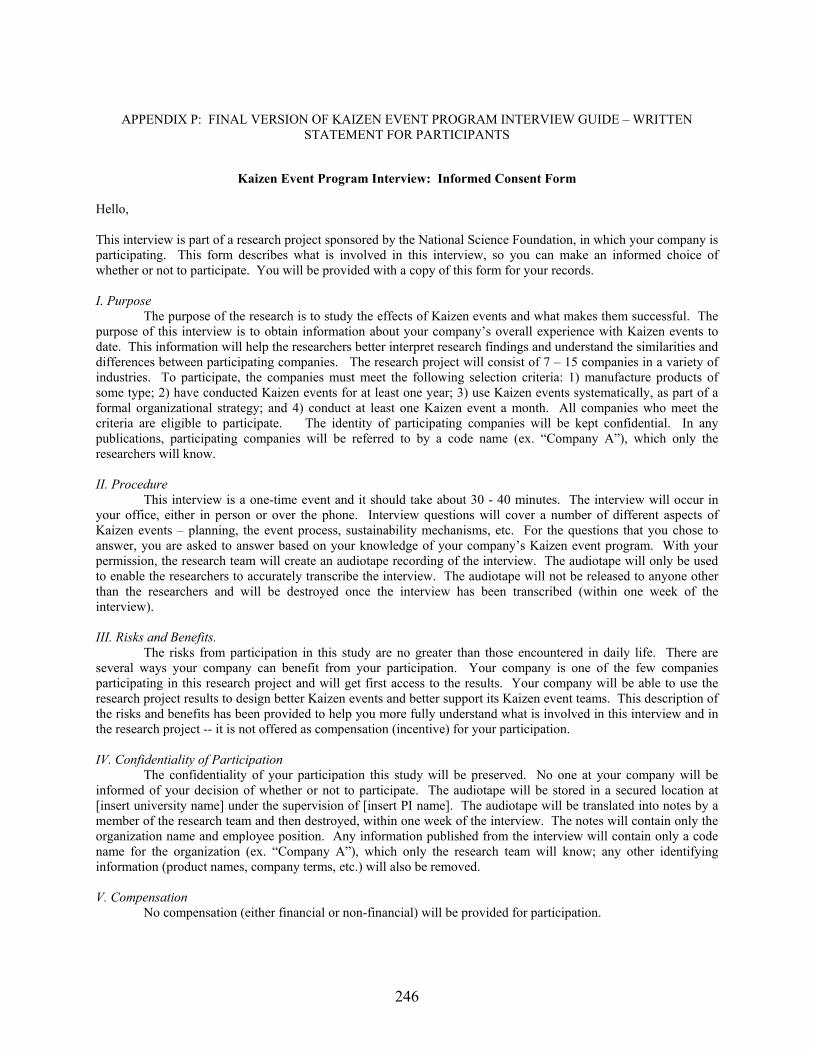
APPENDIX P: FINAL VERSION OF KAIZEN EVENT PROGRAM INTERVIEW GUIDE – WRITTEN
STATEMENT FOR PARTICIPANTS......................................................................................................................246
APPENDIX Q: ADMINISTRATION AND TRAINING TOOLS FOR ORGANIZATIONAL FACILITATORS 248
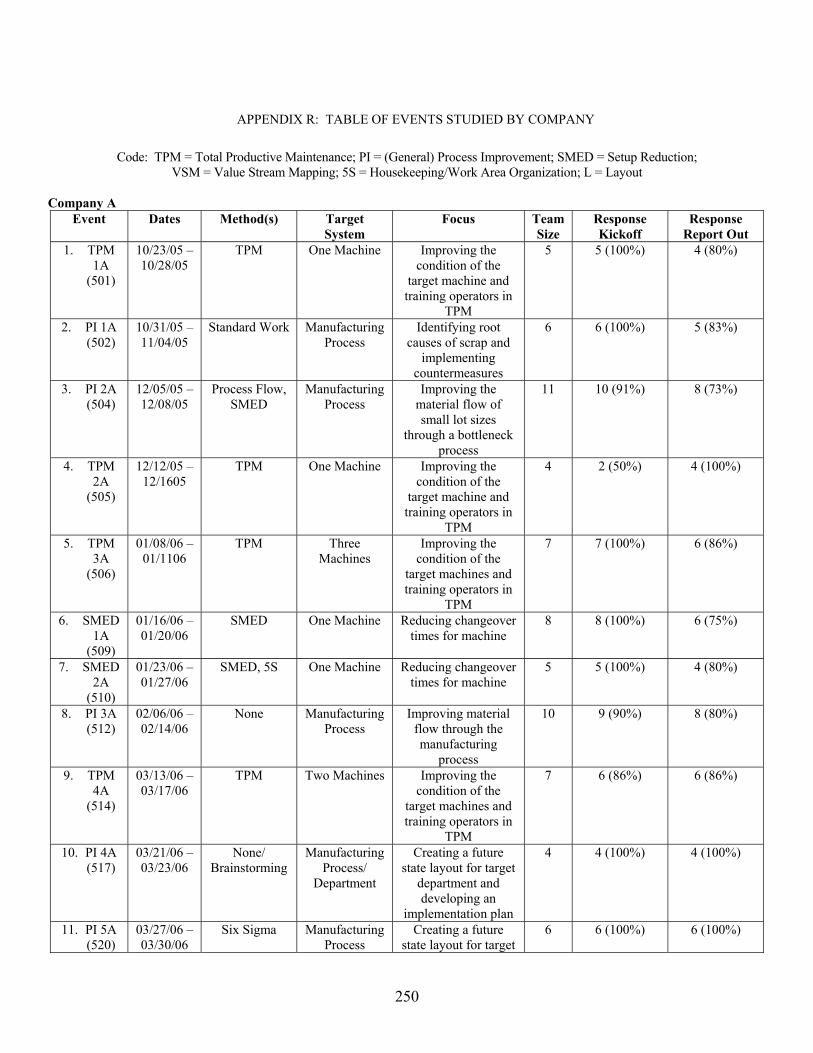
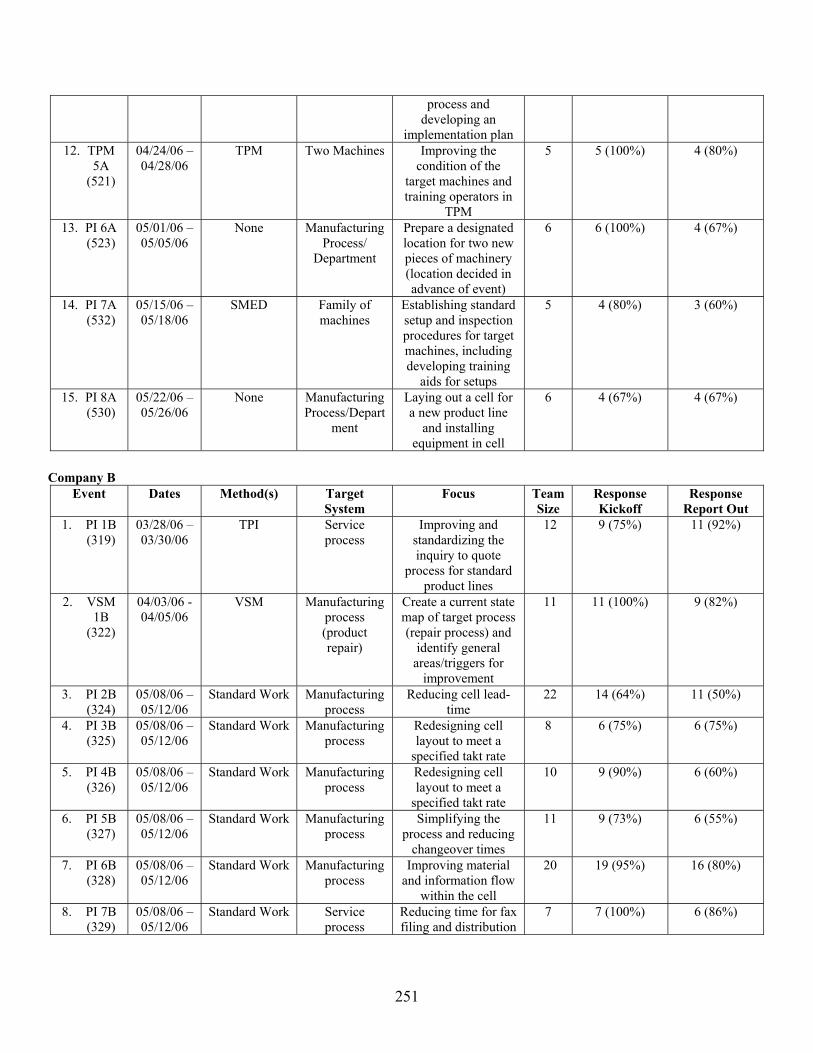
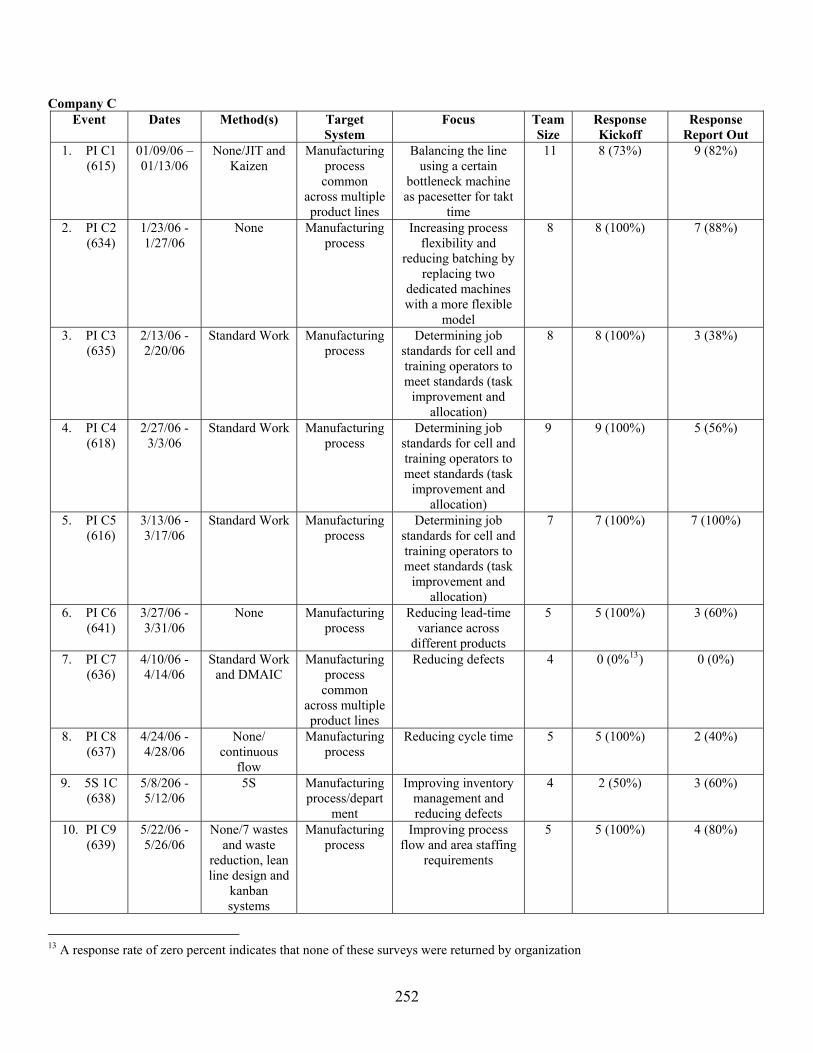
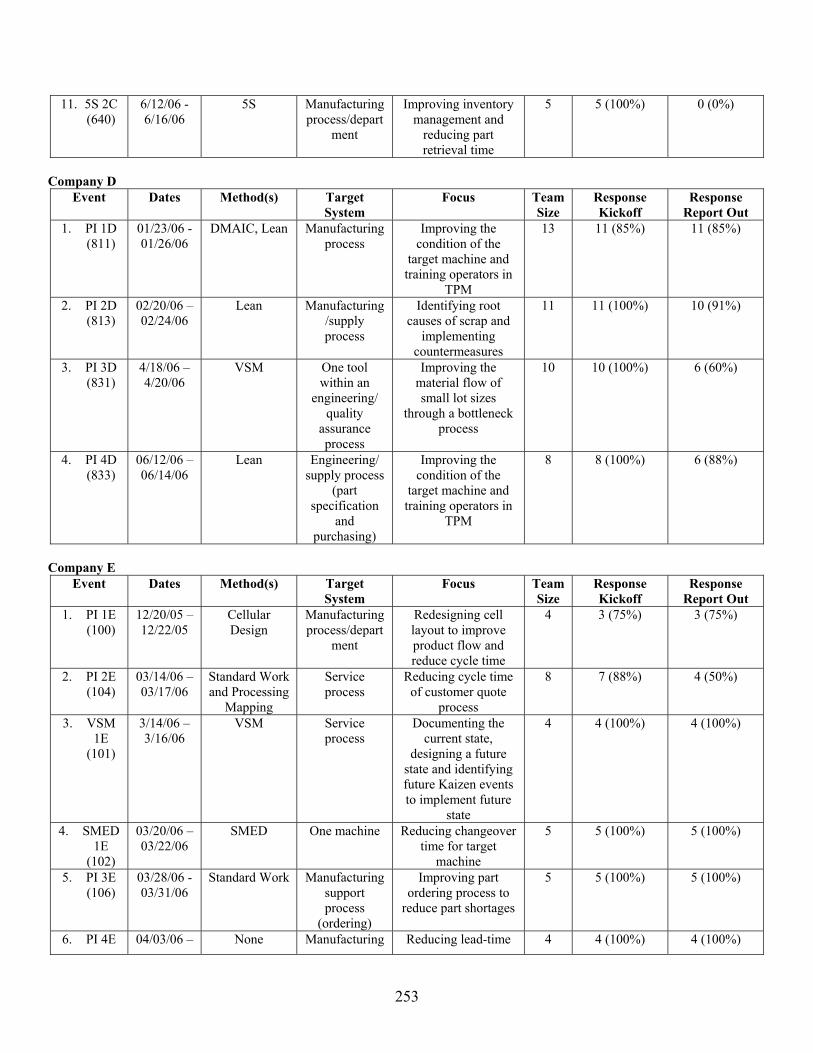
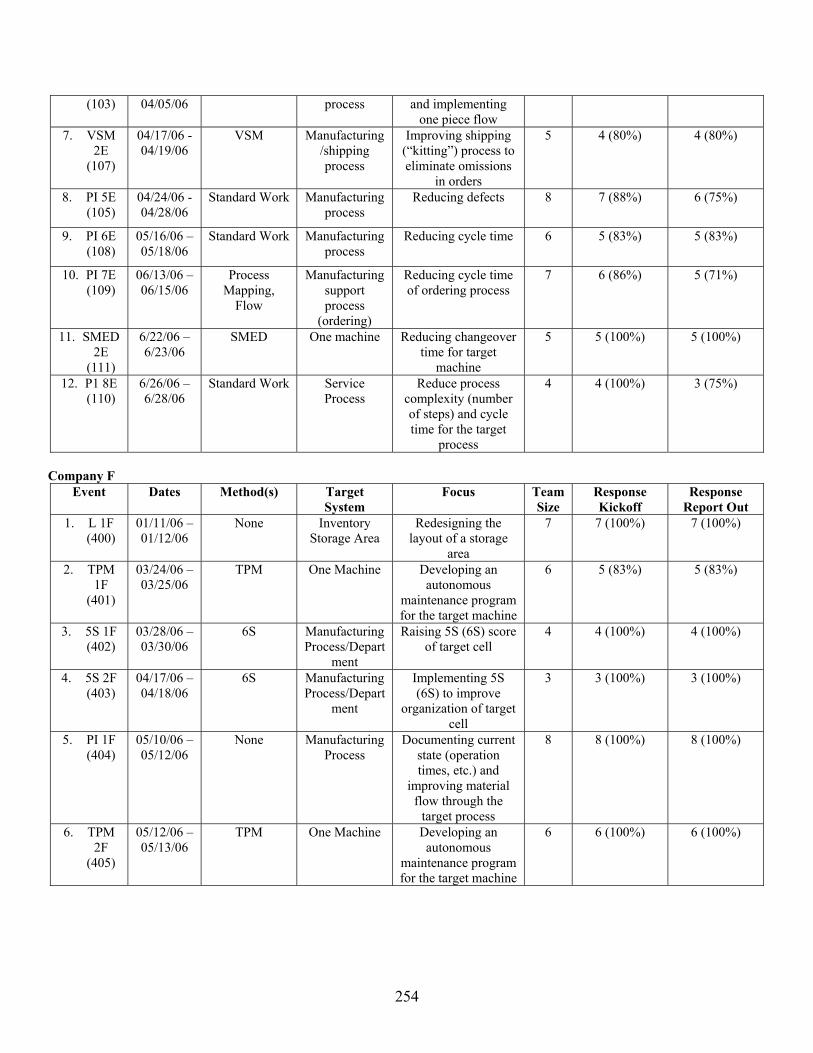
APPENDIX R: TABLE OF EVENTS STUDIED BY COMPANY ........................................................................250
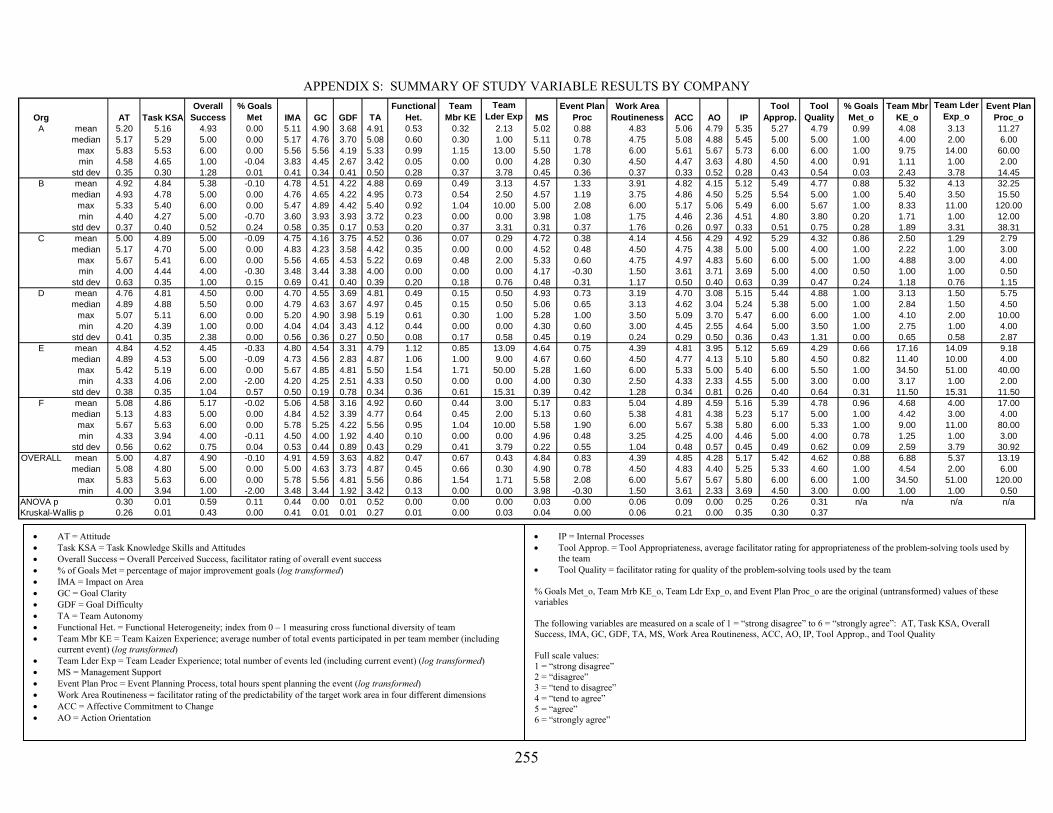
APPENDIX S: SUMMARY OF STUDY VARIABLE RESULTS BY COMPANY..............................................255
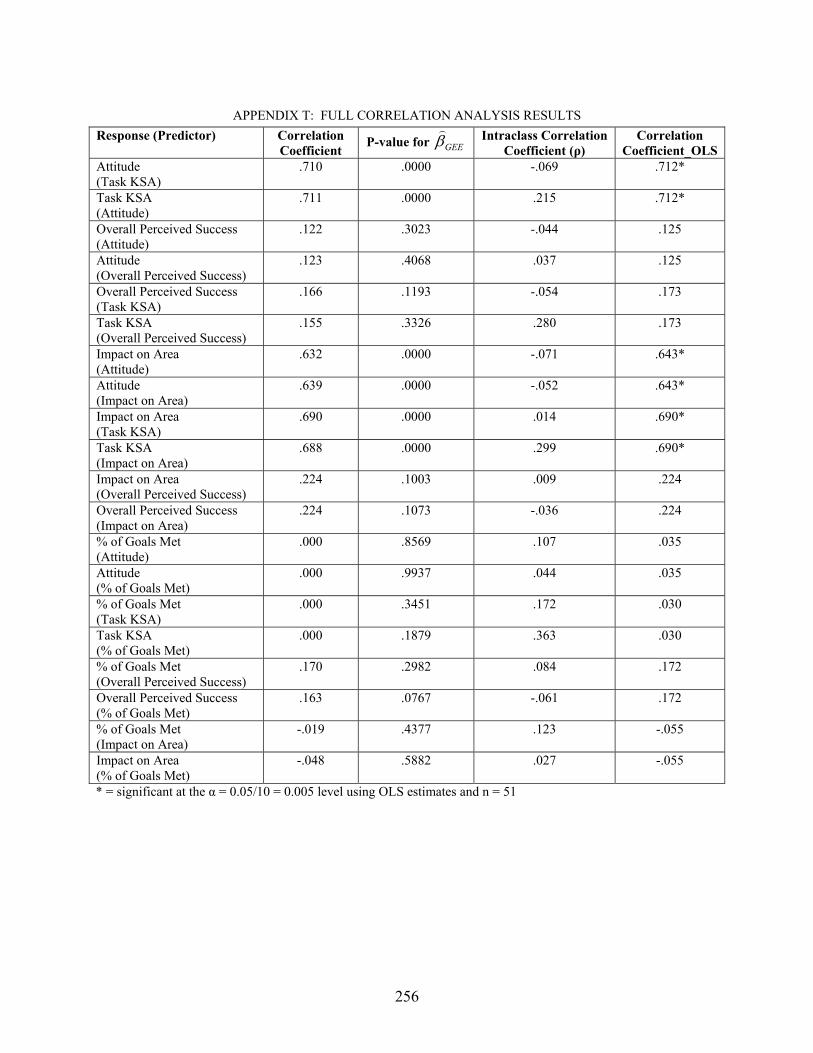
APPENDIX T: FULL CORRELATION ANALYSIS RESULTS ...........................................................................256
vi
LIST OF FIGURES
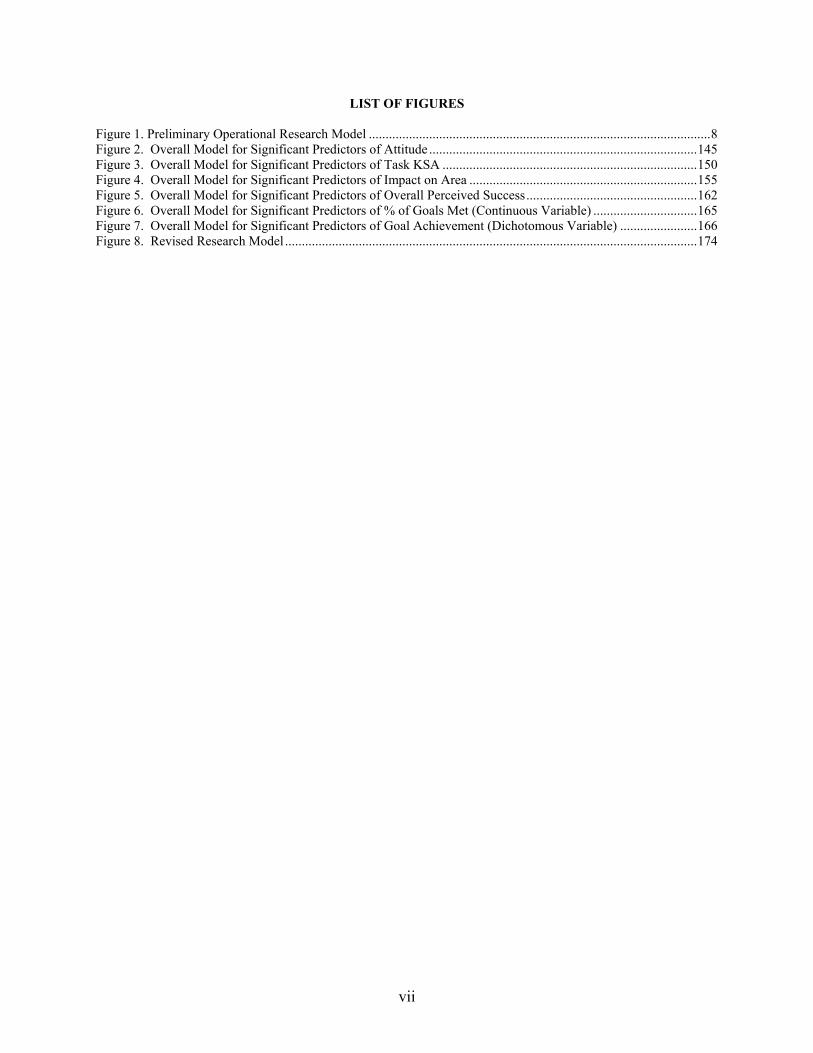
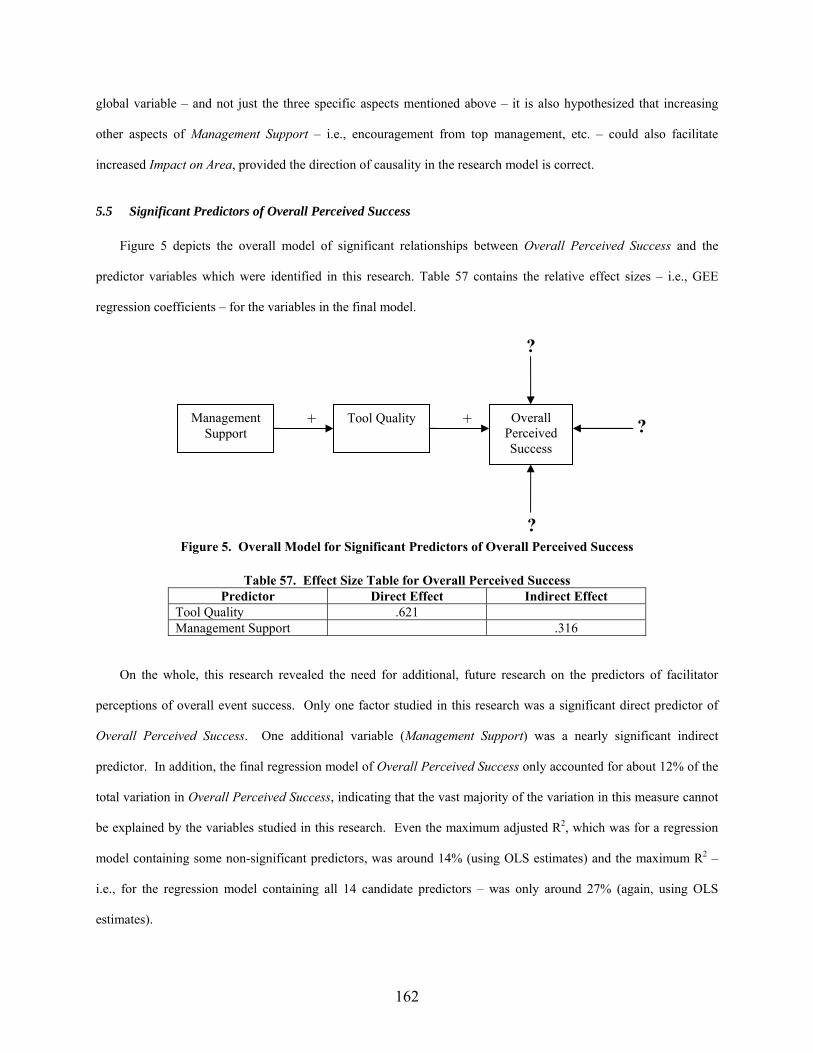
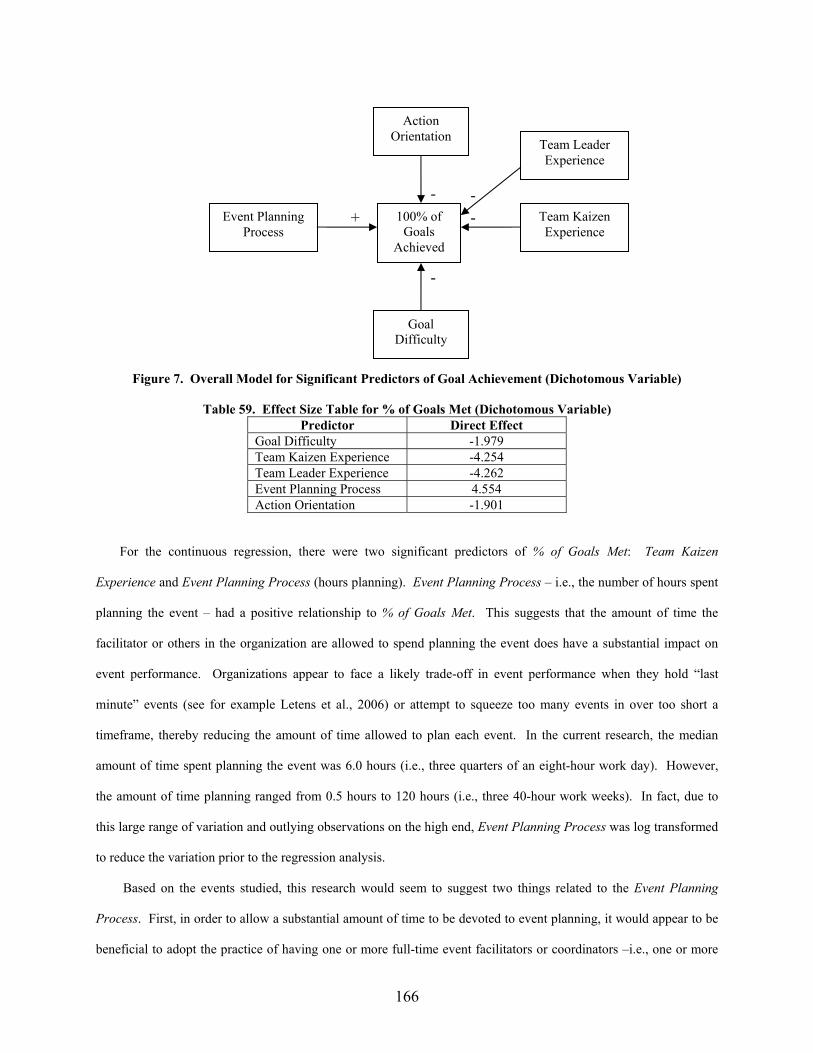
Figure 1. Preliminary Operational Research Model ......................................................................................................8 Figure 2. Overall Model for Significant Predictors of Attitude ................................................................................145 Figure 3. Overall Model for Significant Predictors of Task KSA ............................................................................150 Figure 4. Overall Model for Significant Predictors of Impact on Area ....................................................................155 Figure 5. Overall Model for Significant Predictors of Overall Perceived Success...................................................162 Figure 6. Overall Model for Significant Predictors of % of Goals Met (Continuous Variable) ...............................165 Figure 7. Overall Model for Significant Predictors of Goal Achievement (Dichotomous Variable) .......................166 Figure 8. Revised Research Model ...........................................................................................................................174
vii
LIST OF TABLES
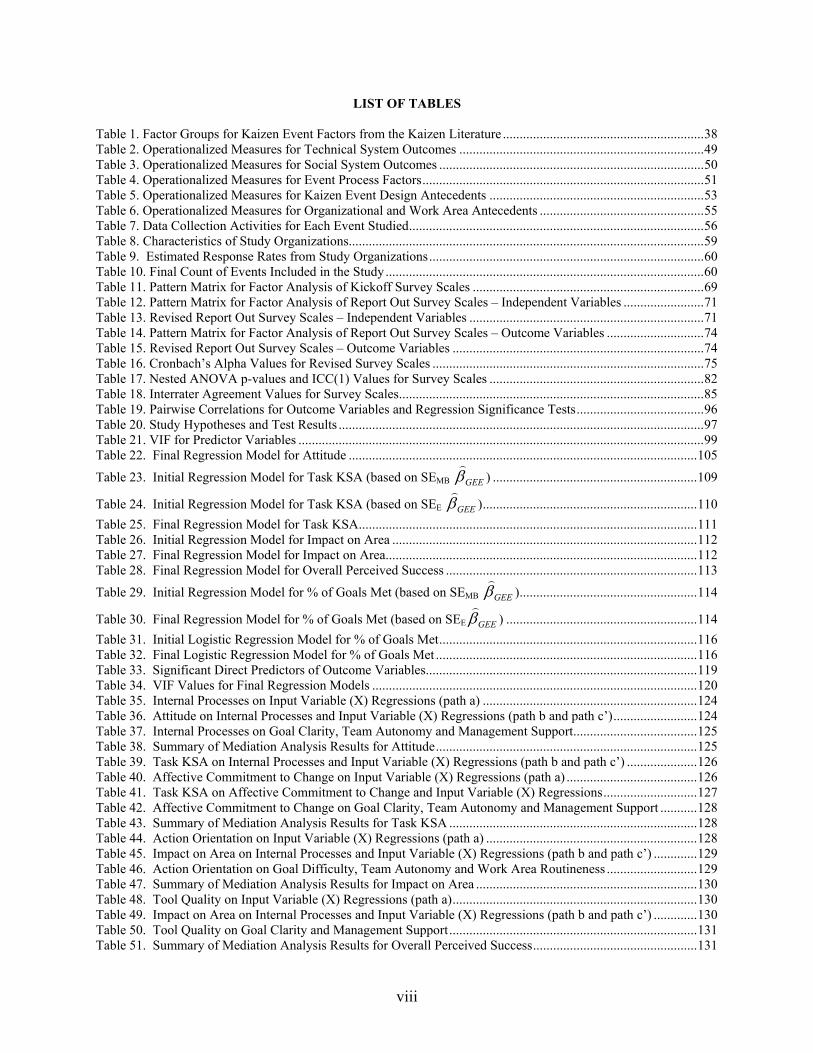
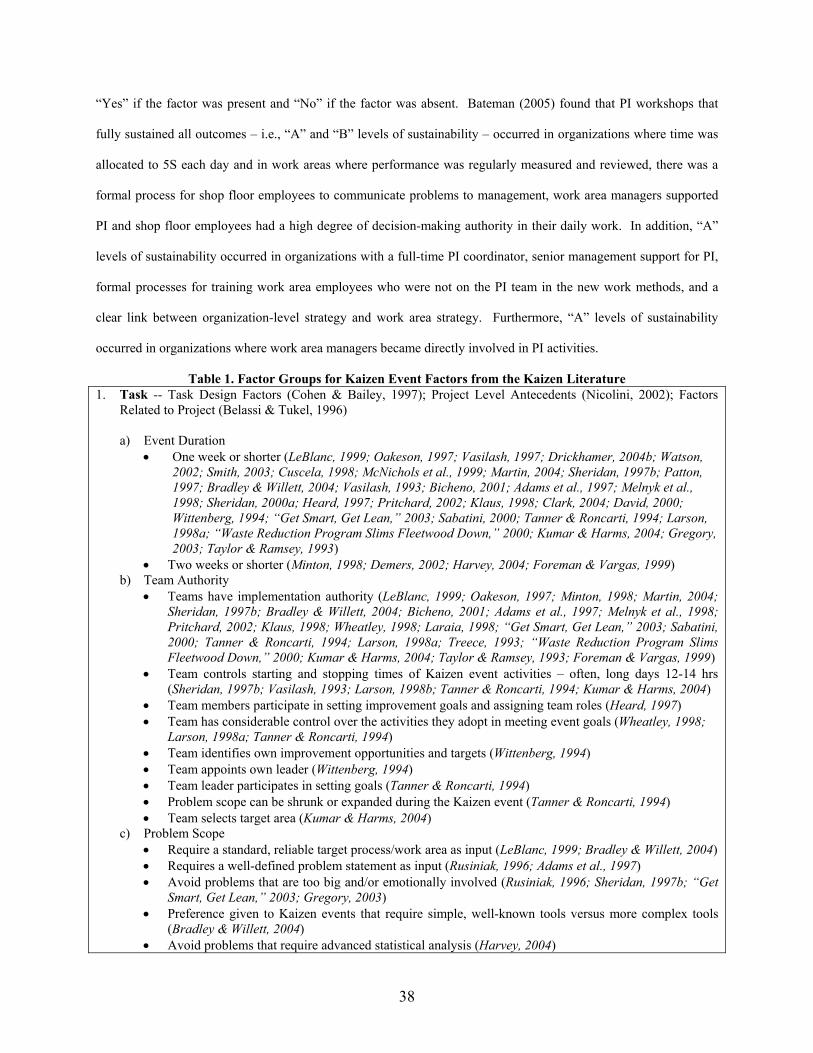
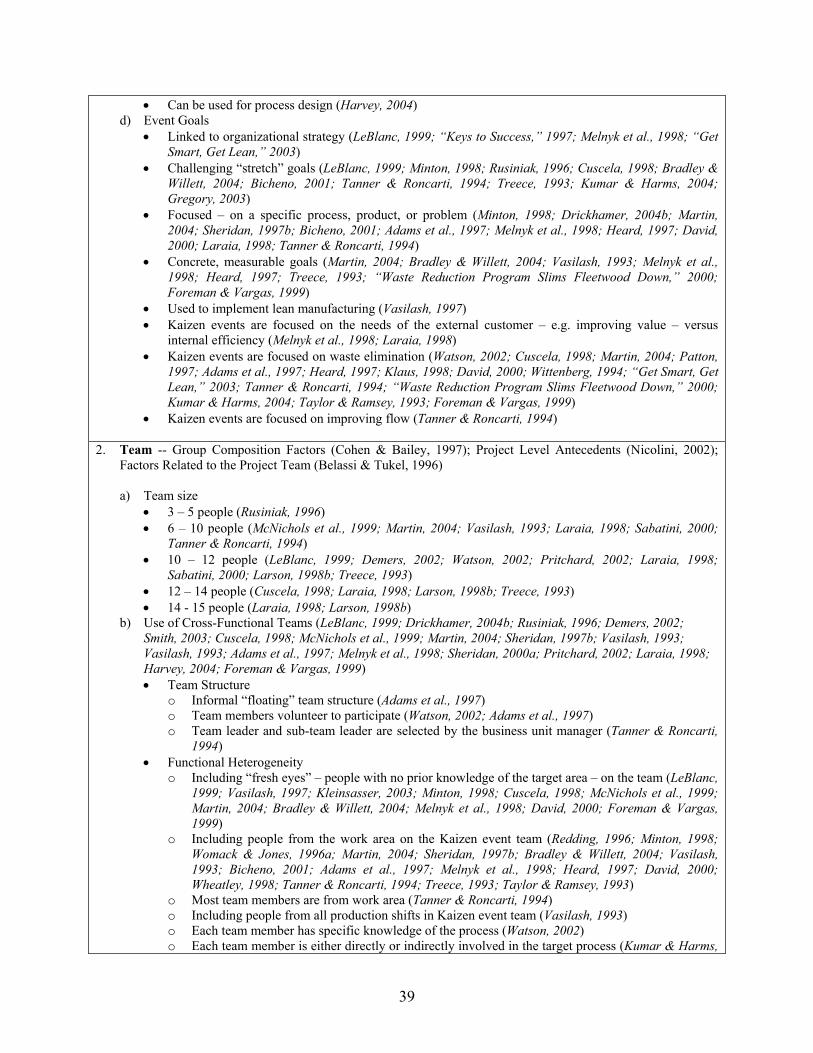
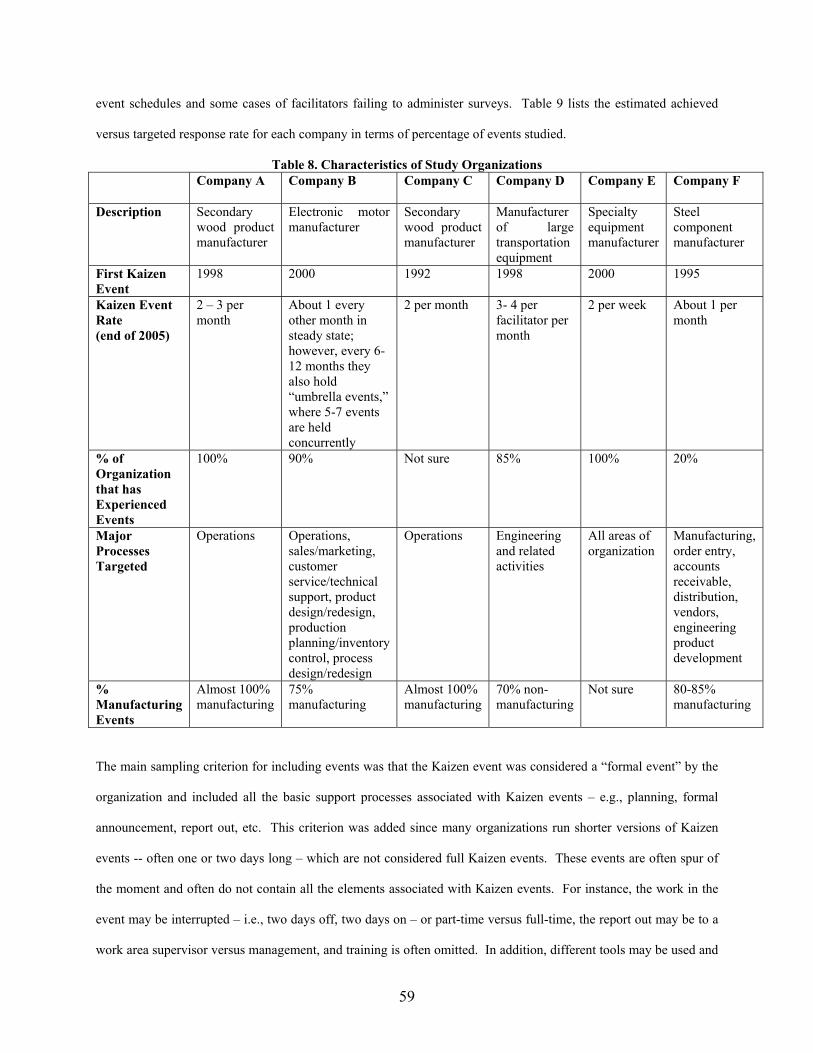
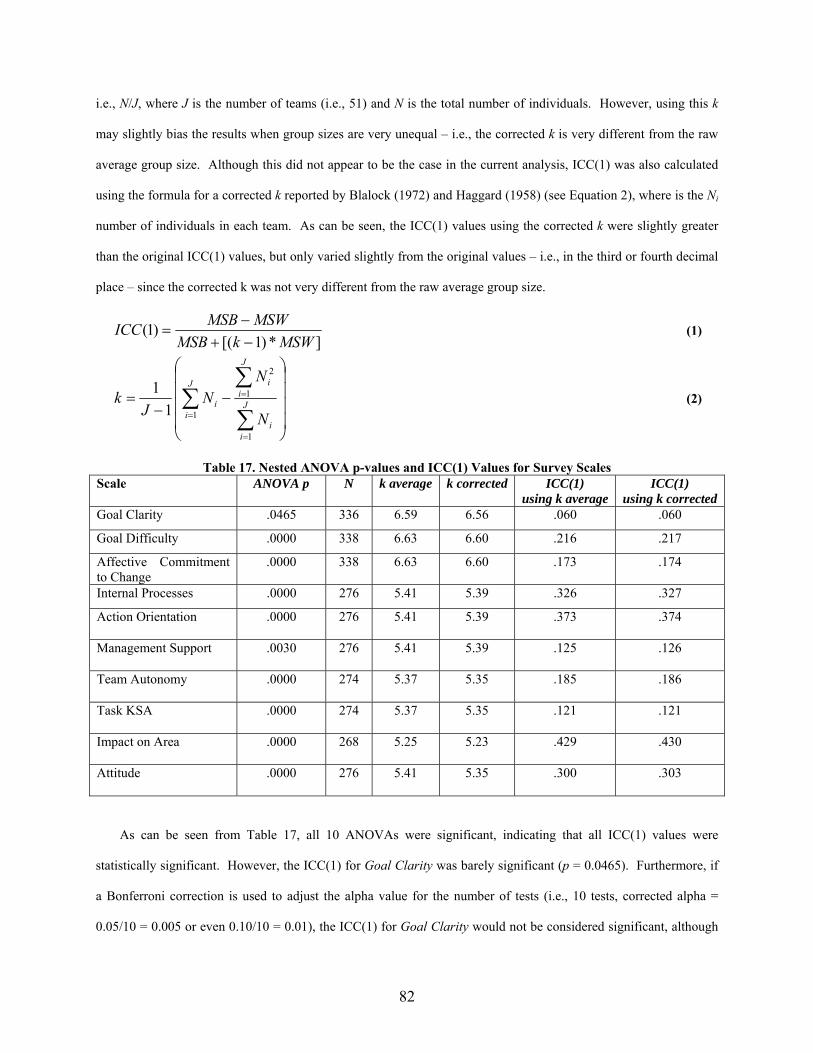
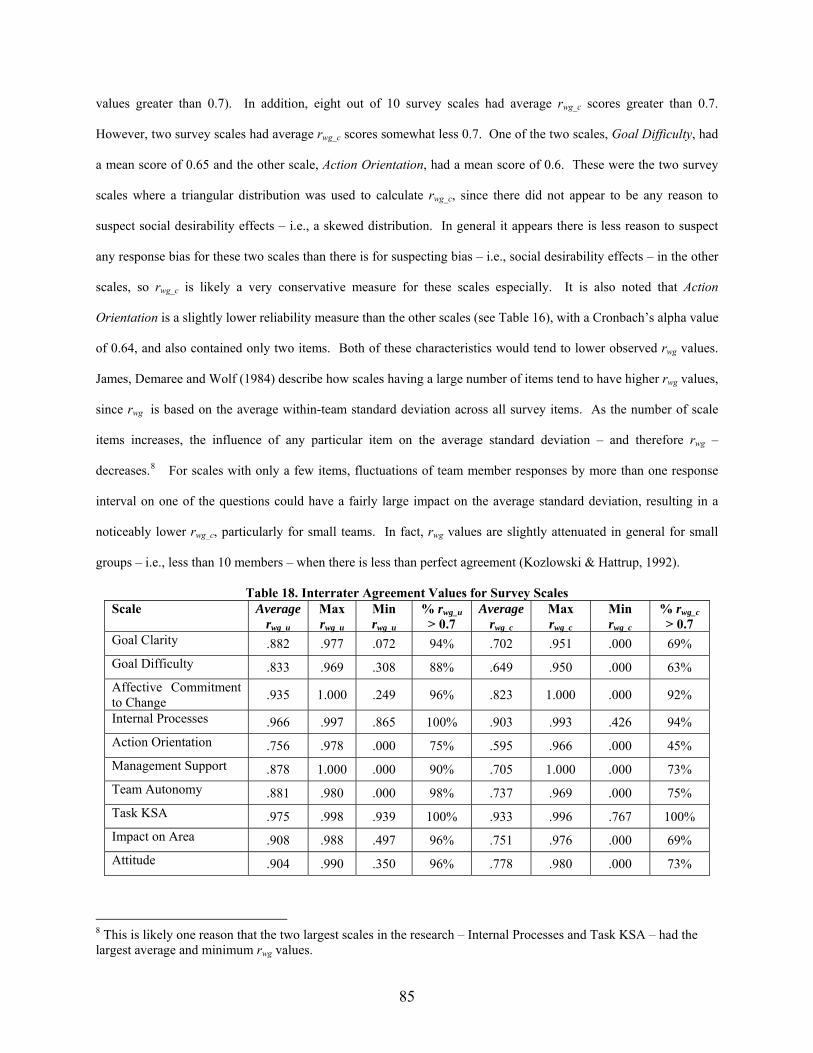
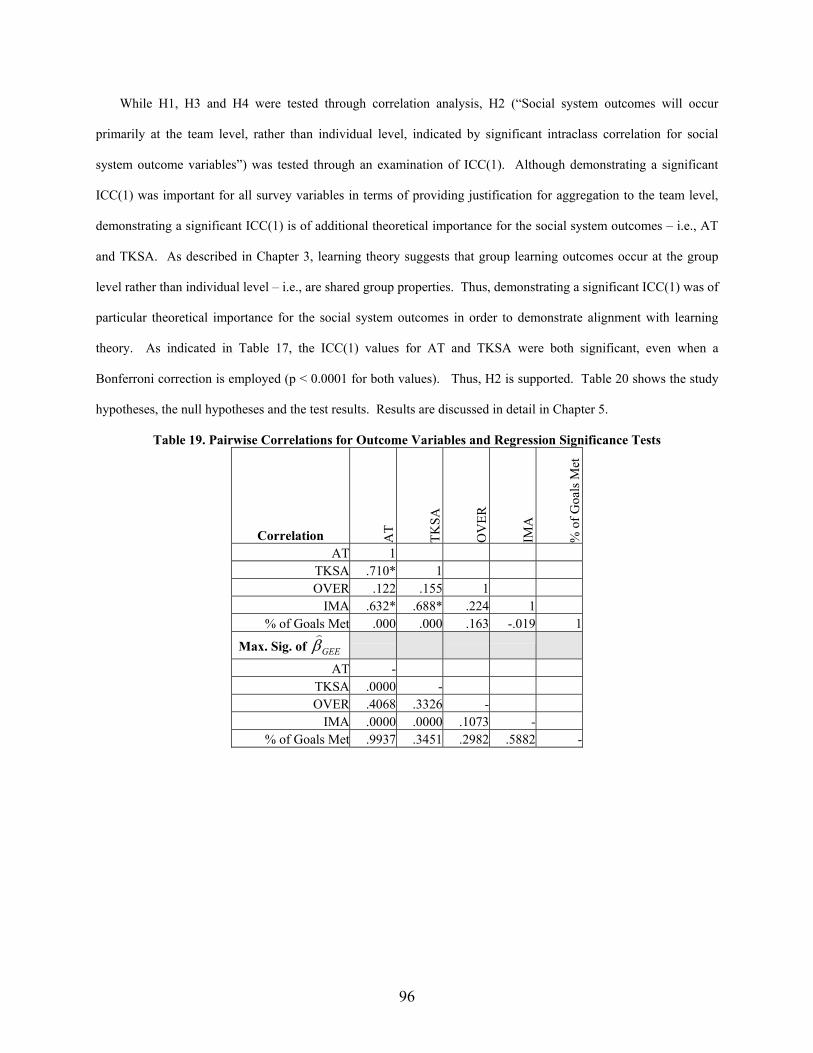
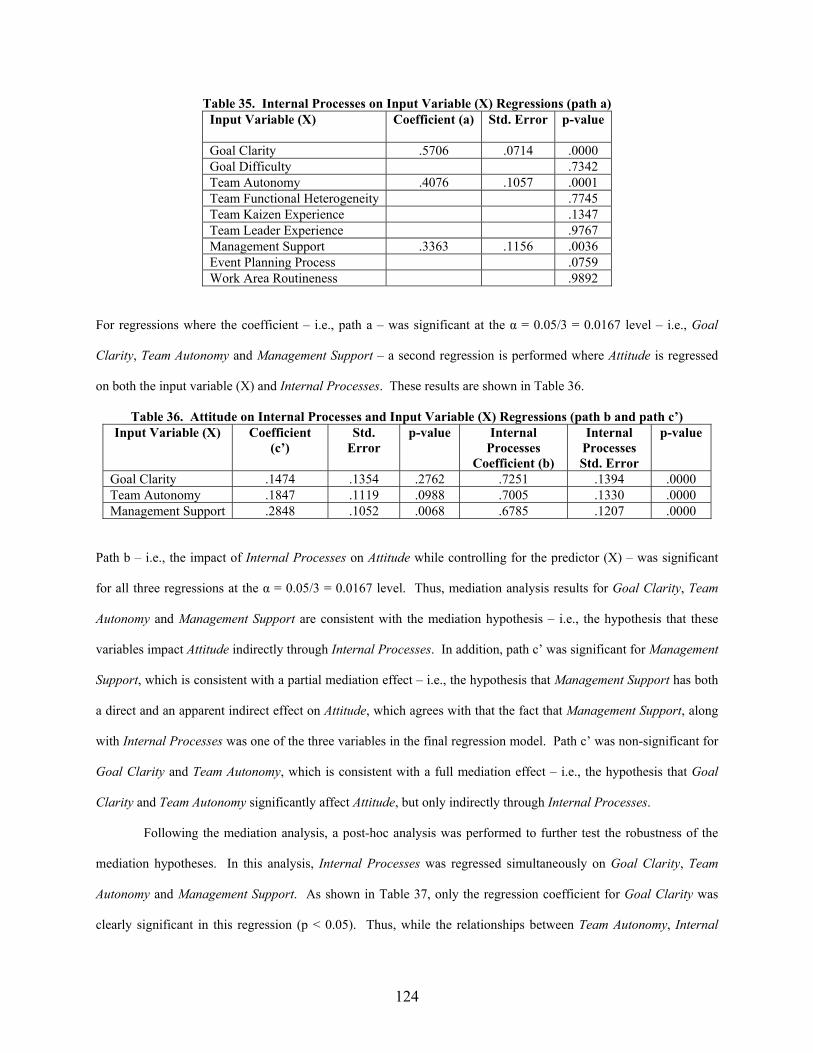
Table 1. Factor Groups for Kaizen Event Factors from the Kaizen Literature ............................................................38 Table 2. Operationalized Measures for Technical System Outcomes .........................................................................49 Table 3. Operationalized Measures for Social System Outcomes ...............................................................................50 Table 4. Operationalized Measures for Event Process Factors....................................................................................51 Table 5. Operationalized Measures for Kaizen Event Design Antecedents ................................................................53 Table 6. Operationalized Measures for Organizational and Work Area Antecedents .................................................55 Table 7. Data Collection Activities for Each Event Studied........................................................................................56 Table 8. Characteristics of Study Organizations..........................................................................................................59 Table 9. Estimated Response Rates from Study Organizations..................................................................................60 Table 10. Final Count of Events Included in the Study...............................................................................................60 Table 11. Pattern Matrix for Factor Analysis of Kickoff Survey Scales .....................................................................69 Table 12. Pattern Matrix for Factor Analysis of Report Out Survey Scales – Independent Variables ........................71 Table 13. Revised Report Out Survey Scales – Independent Variables ......................................................................71 Table 14. Pattern Matrix for Factor Analysis of Report Out Survey Scales – Outcome Variables .............................74 Table 15. Revised Report Out Survey Scales – Outcome Variables ...........................................................................74 Table 16. Cronbach’s Alpha Values for Revised Survey Scales .................................................................................75 Table 17. Nested ANOVA p-values and ICC(1) Values for Survey Scales ................................................................82 Table 18. Interrater Agreement Values for Survey Scales...........................................................................................85 Table 19. Pairwise Correlations for Outcome Variables and Regression Significance Tests......................................96 Table 20. Study Hypotheses and Test Results .............................................................................................................97 Table 21. VIF for Predictor Variables .........................................................................................................................99 Table 22. Final Regression Model for Attitude ........................................................................................................105
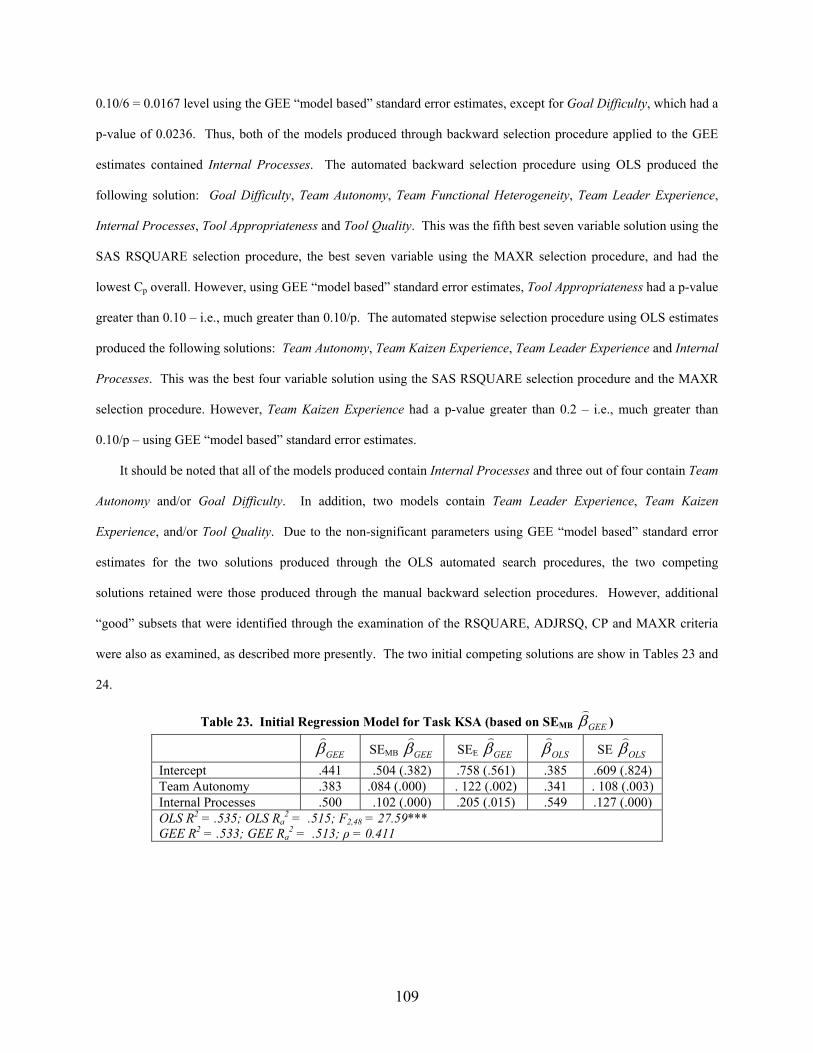
Table 23. Initial Regression Model for Task KSA (based on SEMB GEEβ)
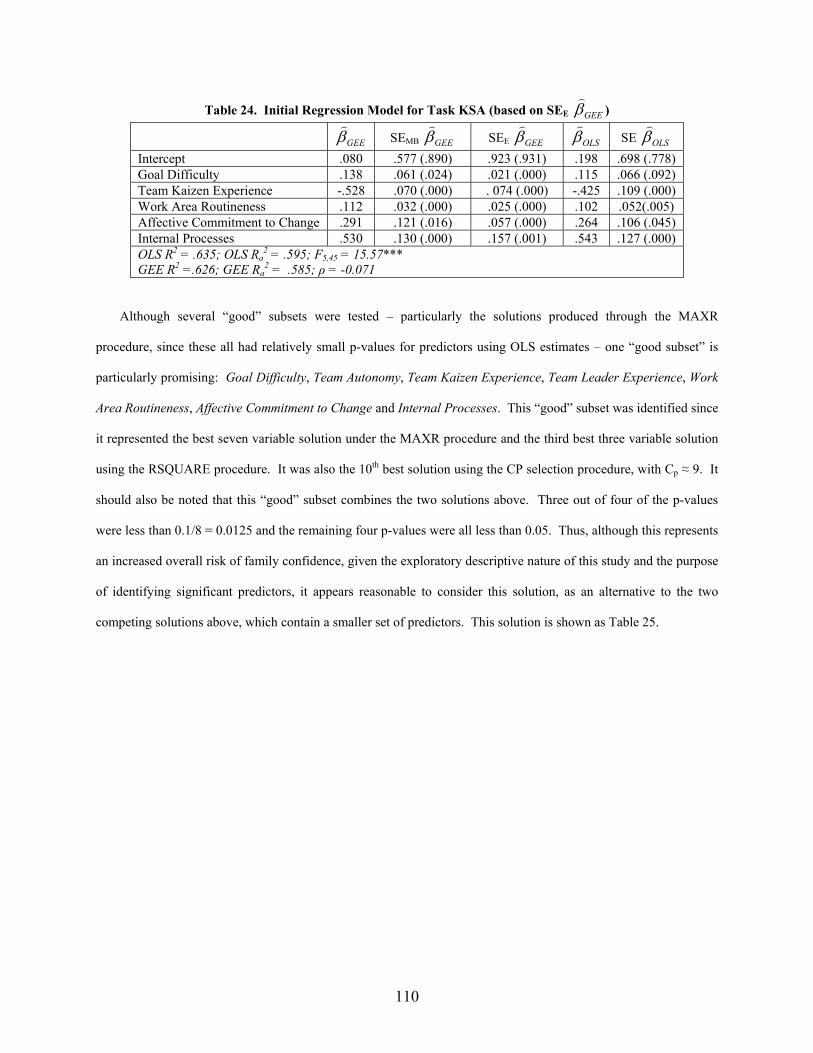
Table 24. Initial Regression Model for Task KSA (based on SEE GEEβ)
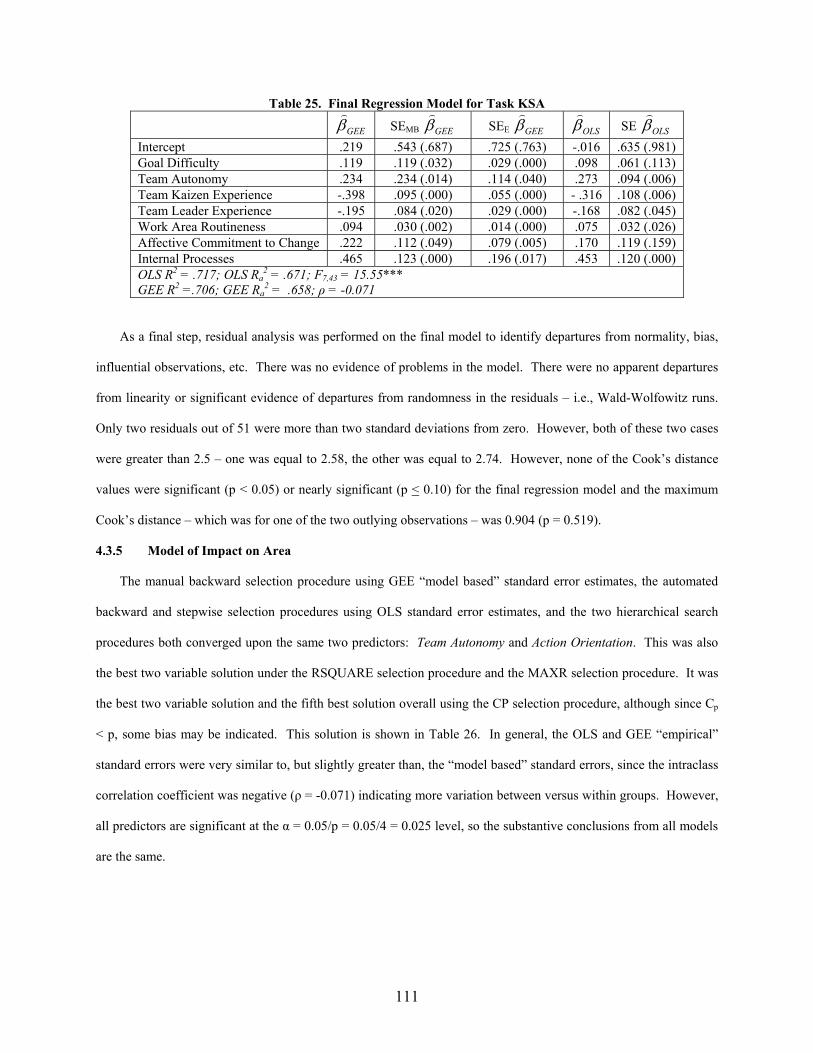
)................................................................110 Table 25. Final Regression Model for Task KSA.....................................................................................................111 Table 26. Initial Regression Model for Impact on Area ...........................................................................................112 Table 27. Final Regression Model for Impact on Area.............................................................................................112 Table 28. Final Regression Model for Overall Perceived Success ...........................................................................113
Table 29. Initial Regression Model for % of Goals Met (based on SEMB GEEβ)
Table 30. Final Regression Model for % of Goals Met (based on SEE GEEβ)
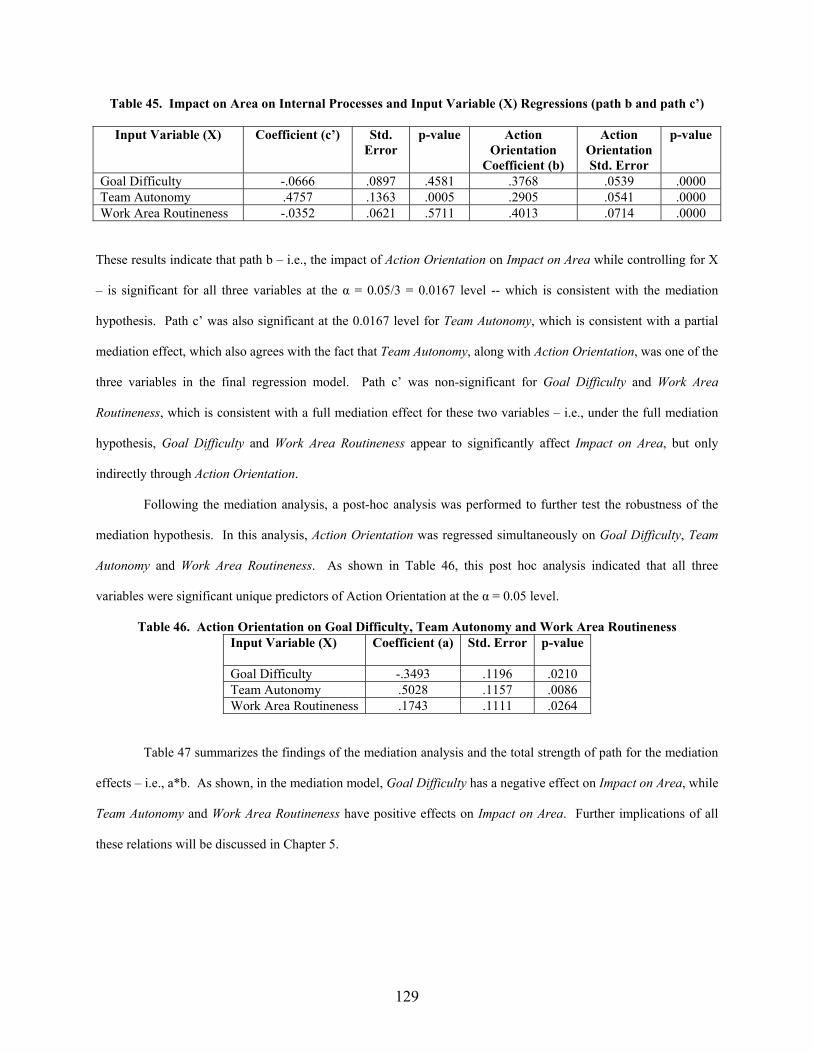
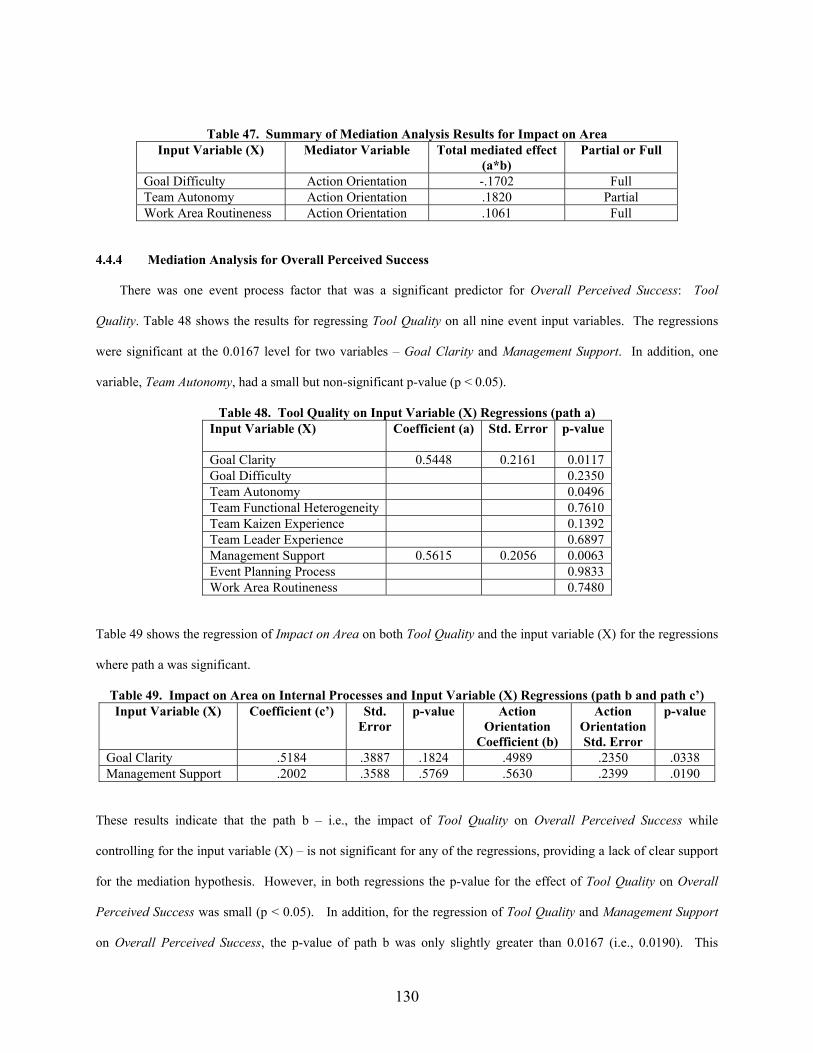
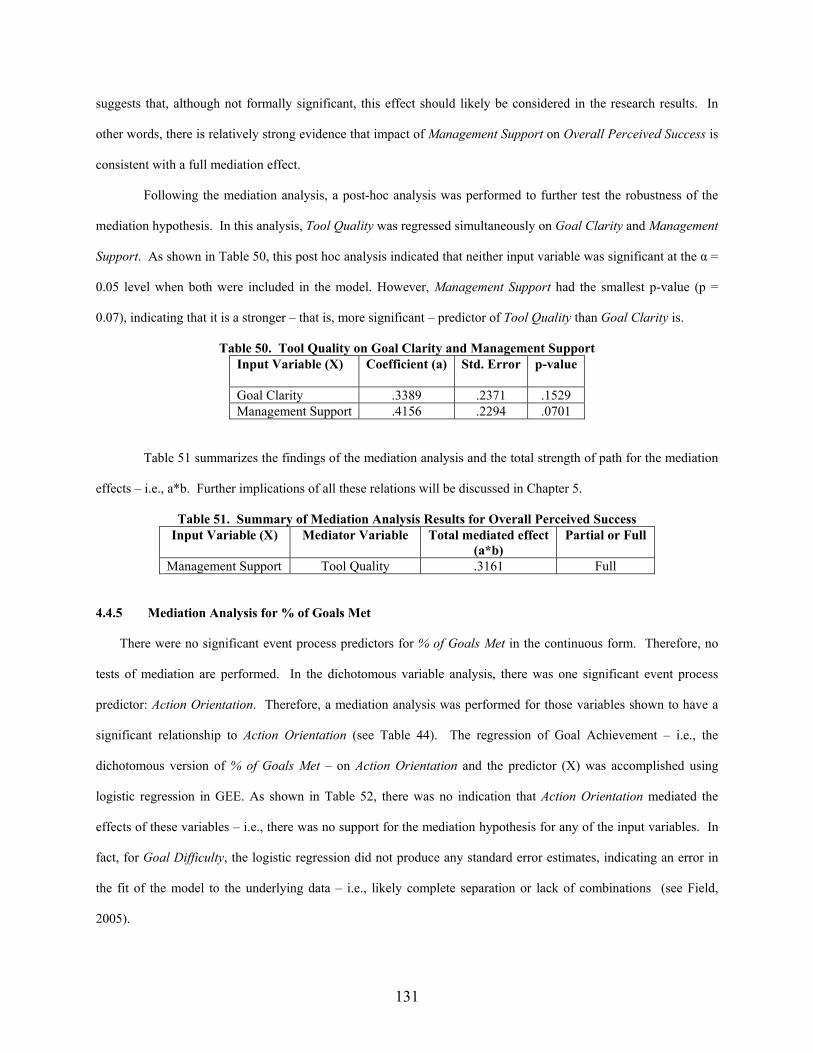
) .........................................................114 Table 31. Initial Logistic Regression Model for % of Goals Met.............................................................................116 Table 32. Final Logistic Regression Model for % of Goals Met ..............................................................................116 Table 33. Significant Direct Predictors of Outcome Variables.................................................................................119 Table 34. VIF Values for Final Regression Models .................................................................................................120 Table 35. Internal Processes on Input Variable (X) Regressions (path a) ................................................................124 Table 36. Attitude on Internal Processes and Input Variable (X) Regressions (path b and path c’).........................124 Table 37. Internal Processes on Goal Clarity, Team Autonomy and Management Support.....................................125 Table 38. Summary of Mediation Analysis Results for Attitude..............................................................................125 Table 39. Task KSA on Internal Processes and Input Variable (X) Regressions (path b and path c’) .....................126 Table 40. Affective Commitment to Change on Input Variable (X) Regressions (path a) .......................................126 Table 41. Task KSA on Affective Commitment to Change and Input Variable (X) Regressions............................127 Table 42. Affective Commitment to Change on Goal Clarity, Team Autonomy and Management Support ...........128 Table 43. Summary of Mediation Analysis Results for Task KSA ..........................................................................128 Table 44. Action Orientation on Input Variable (X) Regressions (path a) ...............................................................128 Table 45. Impact on Area on Internal Processes and Input Variable (X) Regressions (path b and path c’) .............129 Table 46. Action Orientation on Goal Difficulty, Team Autonomy and Work Area Routineness ...........................129 Table 47. Summary of Mediation Analysis Results for Impact on Area ..................................................................130 Table 48. Tool Quality on Input Variable (X) Regressions (path a).........................................................................130 Table 49. Impact on Area on Internal Processes and Input Variable (X) Regressions (path b and path c’) .............130 Table 50. Tool Quality on Goal Clarity and Management Support..........................................................................131 Table 51. Summary of Mediation Analysis Results for Overall Perceived Success.................................................131
viii
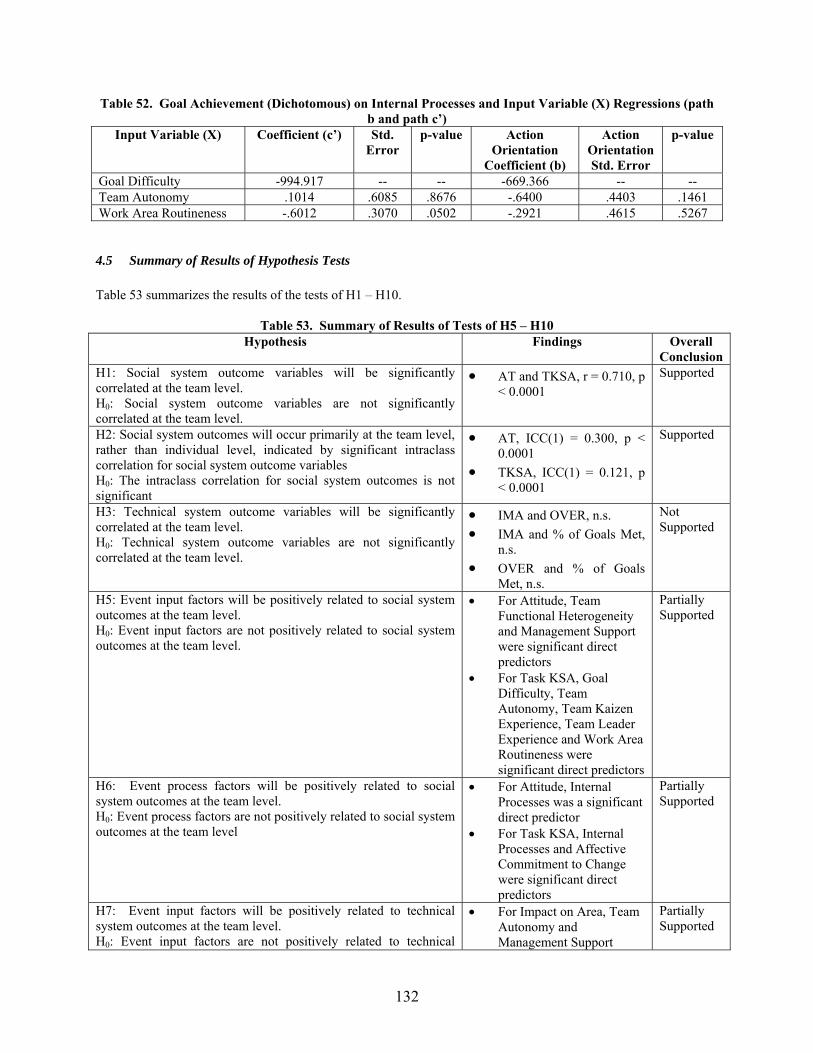
Table 52. Goal Achievement (Dichotomous) on Internal Processes and Input Variable (X) Regressions (path b and path c’).......................................................................................................................................................................132 Table 53. Summary of Results of Tests of H5 – H10...............................................................................................132 Table 54. Effect Size Table for Attitude...................................................................................................................145 Table 55. Effect Size Table for Task KSA ...............................................................................................................150 Table 56. Effect Size Table for Impact on Area .......................................................................................................156 Table 57. Effect Size Table for Overall Perceived Success......................................................................................162 Table 58. Effect Size Table for % of Goals Met (Continuous Variable) ..................................................................165 Table 59. Effect Size Table for % of Goals Met (Dichotomous Variable) ...............................................................166 Table 60. Summary of Relations Found in this Research.........................................................................................173
ix
An Empirical Investigation of Kaizen Event Effectiveness: Outcomes and Critical Success Factors
CHAPTER 1: INTRODUCTION
1.1 Research Motivation
A “Kaizen event” is a short-term, team-based improvement project focused on eliminating waste in and
increasing the performance of a specific process or product line, through low cost, creativity-based solutions (e.g.,
Melnyk et al., 1998; Bicheno, 2001). Kaizen events are often associated with the implementation of lean
production practices (Vasilash, 1997; Kirby & Greene, 2003) and often employ lean concepts and tools – such as
single minute exchange of die (SMED), value stream mapping (VSM), work standardization and 5S (Bodek, 2002;
Melnyk et al., 1998; Oakeson, 1997). For more information on lean concepts and tools see Monden, 1983;
Womacket al., 1990; and Womack and Jones, 1996b.
From the current Kaizen event body of knowledge, it appears that the intended impact of any given Kaizen
event is twofold: first, to substantially improve the performance of the targeted work area, process, or product; and
second, to develop the underlying human resource capabilities – the employee knowledge, skills and attitudes
(KSAs) – needed to create an organizational culture focused on continuous improvement in the long-term (Sheridan,
1997b; Melnyk et al., 1998; Laraia et al., 1999). A Kaizen event contains both a technical system – i.e., tasks,
equipment, and target work area, process, or product – and a social system – i.e., personnel and workforce
coordination policies. Thus, a Kaizen event can be studied under the sociotechnical systems (STS) framework
(Pasmore & King, 1978). In addition, the improvements intended to be achieved through Kaizen events occur both
in the technical system – e.g., improvements in cycle times, WIP, etc. in the target work area – and the social system
– e.g., positive changes in employee knowledge, skills and attitudes, etc.
Published accounts of Kaizen event activities, while anecdotal in nature, suggest that Kaizen events can produce
rapid and substantial improvement in the technical systems of the work area, processes and products targeted. For
instance, one company reported an 885% increased in productivity within one work area (Sheridan, 1997b). Many
other organizations have reported significant improvements – often 50% or greater – in key operating measures such
as lead-time, floor space, work in process (WIP), throughput/cycle time, productivity, on-time delivery rate, and
• Team controls starting and stopping times of Kaizen event activities – often, long days 12-14 hrs (Sheridan, 1997b; Vasilash, 1993; Larson, 1998b; Tanner & Roncarti, 1994; Kumar & Harms, 2004)
• Team members participate in setting improvement goals and assigning team roles (Heard, 1997) • Team has considerable control over the activities they adopt in meeting event goals (Wheatley, 1998;
Larson, 1998a; Tanner & Roncarti, 1994) • Team identifies own improvement opportunities and targets (Wittenberg, 1994) • Team appoints own leader (Wittenberg, 1994) • Team leader participates in setting goals (Tanner & Roncarti, 1994) • Problem scope can be shrunk or expanded during the Kaizen event (Tanner & Roncarti, 1994) • Team selects target area (Kumar & Harms, 2004)
c) Problem Scope • Require a standard, reliable target process/work area as input (LeBlanc, 1999; Bradley & Willett, 2004) • Requires a well-defined problem statement as input (Rusiniak, 1996; Adams et al., 1997) • Avoid problems that are too big and/or emotionally involved (Rusiniak, 1996; Sheridan, 1997b; “Get
Smart, Get Lean,” 2003; Gregory, 2003) • Preference given to Kaizen events that require simple, well-known tools versus more complex tools
• Used to implement lean manufacturing (Vasilash, 1997) • Kaizen events are focused on the needs of the external customer – e.g. improving value – versus
internal efficiency (Melnyk et al., 1998; Laraia, 1998) • Kaizen events are focused on waste elimination (Watson, 2002; Cuscela, 1998; Martin, 2004; Patton,
b) Use of Cross-Functional Teams (LeBlanc, 1999; Drickhamer, 2004b; Rusiniak, 1996; Demers, 2002; Smith, 2003; Cuscela, 1998; McNichols et al., 1999; Martin, 2004; Sheridan, 1997b; Vasilash, 1993; Vasilash, 1993; Adams et al., 1997; Melnyk et al., 1998; Sheridan, 2000a; Pritchard, 2002; Laraia, 1998; Harvey, 2004; Foreman & Vargas, 1999) • Team Structure
o Informal “floating” team structure (Adams et al., 1997) o Team members volunteer to participate (Watson, 2002; Adams et al., 1997) o Team leader and sub-team leader are selected by the business unit manager (Tanner & Roncarti,
1994) • Functional Heterogeneity
o Including “fresh eyes” – people with no prior knowledge of the target area – on the team (LeBlanc, 1999; Vasilash, 1997; Kleinsasser, 2003; Minton, 1998; Cuscela, 1998; McNichols et al., 1999; Martin, 2004; Bradley & Willett, 2004; Melnyk et al., 1998; David, 2000; Foreman & Vargas, 1999)
o Including people from the work area on the Kaizen event team (Redding, 1996; Minton, 1998; Womack & Jones, 1996a; Martin, 2004; Sheridan, 1997b; Bradley & Willett, 2004; Vasilash, 1993; Bicheno, 2001; Adams et al., 1997; Melnyk et al., 1998; Heard, 1997; David, 2000; Wheatley, 1998; Tanner & Roncarti, 1994; Treece, 1993; Taylor & Ramsey, 1993)
o Most team members are from work area (Tanner & Roncarti, 1994) o Including people from all production shifts in Kaizen event team (Vasilash, 1993) o Each team member has specific knowledge of the process (Watson, 2002) o Each team member is either directly or indirectly involved in the target process (Kumar & Harms,
39
2004) o Including people from all functions required to implement/sustain results on the Kaizen event
team (Bradley & Willett, 2004; Vasilash, 1993; Adams et al., 1997) o Including subject matter experts (SMEs) – e.g., quality engineers. Maintenance – on the team
(David, 2000; Treece, 1993; Taylor & Ramsey, 1993) o Including only one employee per department on the Kaizen event team, except for the department
being blitzed, to avoid over-burdening any department (Minton, 1998) o Including managers and supervisors on the Kaizen event team (Oakeson, 1997; “Keys to
o Including target area supervisor on Kaizen event team (Patton, 1997) o Including customers on the Kaizen event team (Hasek, 2000; Vasilash, 1997; McNichols et al.,
1999; Vasilash, 1993; Adams et al., 1997; Melnyk et al., 1998; Heard, 1997; Larson, 1998b; Treece, 1993)
o Including suppliers on the Kaizen event team (Vasilash, 1997; McNichols et al., 1999; Vasilash, 1993; Adams et al., 1997; Melnyk et al., 1998; Heard, 1997; “Get Smart, Get Lean,” 2003; Tanner & Roncarti, 1994; Larson, 1998b)
o Including benchmarking partners or other external non-supply chain parties on the Kaizen event team (McNichols et al., 1999; Sheridan, 1997b; Vasilash, 1993; “Get Smart, Get Lean,” 2003)
o Including people from other sister plants or corporate headquarters on the team (Sabatini, 2000; Tanner & Roncarti, 1994)
o Avoid including people from competing plants or functions on the Kaizen event team (Bradley & Willett, 2004)
• Team Member Problem-Solving Abilities o Black Belts assigned to Kaizen event teams for Lean-Six Sigma programs (Sheridan, 2000b) o At least one member of Kaizen event team experienced enough in tool(s) to teach others (Bradley
& Willett, 2004) o Including outside consultants on the Kaizen event team, particularly for the first few Kaizen
2002); Factors Related to the Organization (Belassi & Tukel, 1996)
a) Management Support/Buy-In (Bane, 2002; Hasek, 2000; Vasilash, 1997; Rusiniak, 1996; Cuscela, 1998; Martin, 2004; Sheridan, 1997b; “Keys to Success,” 1997; Bradley & Willett, 2004; Vasilash, 1993; Bicheno, 2001; Adams et al., 1997; Heard, 1997; Laraia, 1998; Tanner & Roncarti, 1994; Treece, 1993; “Waste Reduction Program Slims Fleetwood Down,” 2000; Kumar & Harms, 2004; Taylor & Ramsey, 1993) • Plant manufacturing director temporarily moves his/her office to Kaizen event room during event
(Tanner & Roncarti, 1994) • Business unit managers divide their time between the shop floor and the Kaizen event room during the
event (Tanner & Roncarti, 1994) b) Resource Support
• Team members dedicated only to Kaizen event during its duration (Minton, 1998; McNichols et al., 1999; Martin, 2004; Bradley & Willett, 2004; Bicheno, 2001; Melnyk et al., 1998; Heard, 1997; Harvey, 2004; Kumar & Harms, 2004; Gregory, 2003; Foreman & Vargas, 1999)
• Having support personnel – e.g., maintenance, engineering, etc. – “on call” during the event, to provide support as needed – e.g., moving equipment overnight (McNichols et al., 1999; Martin, 2004; Sheridan, 1997b; Bradley & Willett, 2004; Bicheno, 2001; Adams et al., 1997; Wittenberg, 1994; Tanner & Roncarti, 1994; Gregory, 2003; Taylor & Ramsey, 1993)
Bicheno, 2001; Adams et al., 1997; Melnyk et al., 1998; Klaus, 1998; Tanner & Roncarti, 1994; Larson, 1998a; Treece, 1993; Taylor & Ramsey, 1993)
• Cost is not a factor (Minton, 1998) • Dedicated room for Kaizen event team meetings (Creswell, 2001; Tanner & Roncarti, 1994) • Snacks provided to team during Kaizen event (Creswell, 2001; Adams et al., 1997) • Stopping production in target area during the Kaizen event (Bradley & Willett, 2004) • Priority given to Kaizen team requests (Kumar & Harms, 2004) • Use of a Kaizen cart containing tools and supplies that serves as a mobile office for the Kaizen event
team during the event (Taylor & Ramsey, 1993) c) Rewards/Recognition
• Rewards and recognition for team after the event – e.g., celebrations (Adams et al., 1997; Melnyk et al., 1998; Martin, 2004; Tanner & Roncarti, 1994; Larson, 1998b; Taylor & Ramsey, 1993; Foreman & Vargas, 1999)
d) Communication • Importance of buy-in from employees in work area (Sheridan, 1997b) • Kaizen event team members from work area encouraged to discuss event activities and changes with
others in the work area during the event to create buy-in (Bicheno, 2001) • Discussion of changes with employees in the work area during the Kaizen event (Wittenberg, 1994;
Sabatini, 2000; Gregory, 2003) e) Event Planning Process
• Including process documentation – e.g., VSM, process flowcharts, videotapes of the process, current state data, etc. – as input to Kaizen event (Minton, 1998; McNichols et al., 1999; Martin, 2004; Bradley & Willett, 2004; Bicheno, 2001; David, 2000; Kumar & Harms, 2004; Gregory, 2003)
• Notifying employees in adjoining work areas before the start of the Kaizen event – e.g., publicizing the event (McNichols et al., 1999; Gregory, 2003)
• Use of a Kaizen mandate – e.g., Kaizen event announcement – to clearly define and communicate event goals (Heard, 1997; Foreman & Vargas, 1999)
• Tools/problem solving method to be used are identified by the facilitator (Heard, 1997) • Team leader prepares a briefing package with historical performance data, layout drawings, staffing
data and customer requirements data before the event, which is given to the rest of the team on the first day of the event (Tanner & Roncarti, 1994)
• Development of an “event schedule” – i.e., a high-level road map of activities – before the event (Foreman & Vargas, 1999)
f) Training • Less than two hours of formal training provided to team (Minton, 1998; McNichols et al., 1999) • Including ½ day of training at the start of the event – i.e., training in tools, kaizen philosophy, etc.
• Including 1 day of training at the start of the event – i.e., training in tools, kaizen philosophy, etc. (Wittenberg, 1994; “Get Smart, Get Lean,” 2003; Larson, 1998b; “Waste Reduction Program Slims Fleetwood Down,” 2000; Taylor & Ramsey, 1993; Foreman & Vargas, 1999)
• Facilitators provide “short courses” on topics “on the spot” if a team gets stuck (Minton, 1998) • Team members who aren’t from the process get training in the process and may even work in the
production line for a few days before the Kaizen event (Minton, 1998) • Including ergonomics training as part of Kaizen event training (Wilson, 2005) • Including “team-building” exercises as part of Kaizen event training (Bicheno, 2001; Foreman &
Vargas, 1999) • Making sure that each participant has thorough knowledge of the “seven wastes” prior to team
activities (Bicheno, 2001) • Training can be provided before the formal start of the event – i.e., offline (McNichols et al., 1999;
Bicheno, 2001; Gregory, 2003)
41
4. Event Process -- Internal Process Factors (Cohen & Bailey, 1997); Processes (Nicolini, 2002); Project Manager’s Performance on the Job (Belassi & Tukel, 1996)
• Keep line running during Kaizen event, because it is important for the team to observe a running line (Sheridan, 1997b; Sabatini, 2000; Larson, 1998a; Tanner & Roncarti, 1994; Kumar & Harms, 2004)
• Cycles of solution refinement during Kaizen event (Bradley & Willett, 2004; Bicheno, 2001; Melnyk et al., 1998; Clark, 2004; “Waste Reduction Program Slims Fleetwood Down,” 2000; Taylor & Ramsey, 1993)
• Training work area in employees in the new process is part of the Kaizen event (Martin, 2004; Heard, 1997)
b) Problem Solving Tools/Techniques • Videotapes of setups (Minton, 1998; Bradley & Willett, 2004) • Brainstorming (Minton, 1998; Watson, 2002; Martin, 2004; Bradley & Willett, 2004; Vasilash, 1993;
Pritchard, 2002; Laraia, 1998; Kumar & Harms, 2004; Taylor & Ramsey, 1993) • Avoid preconceived solutions (Rusiniak, 1996; Bradley & Willett, 2004) • Seek improvement, not optimization (Rusiniak, 1996; Vasilash, 1993) • Question the current process – ask why things are done the way they are (Watson, 2002; Minton, 1998;
Taylor & Ramsey, 1993) • Team should not be too rigid about sticking to formal methodology (Bradley & Willett, 2004) • Creating a video report-out (Sabatini, 2000) • Decisions are driven by hard/quantitative data (Tanner & Roncarti, 1994; Gregory, 2003) • Tools used depend on event goals – e.g., SMED, 5S, etc. (Tanner & Roncarti, 1994)
c) Team Coordination • At least one member of Kaizen event team keeps the team “on track” – i.e., focused (Bradley &
Willett, 2004; Vasilash, 1993; Wheatley, 1998; Foreman & Vargas, 1999) • Use of subteams (Minton, 1998; McNichols et al., 1999; Sheridan, 1997b; Bicheno, 2001; Sabatini,
2000; Treece, 1993; Foreman & Vargas, 1999) • Use of a Kaizen newspaper/30-day action item list to capture needed actions that cannot be
implemented during the Kaizen event (“Winning with Kaizen,” 2002; McNichols et al., 1999; Martin, 2004; Bradley & Willett, 2004; Melnyk et al., 1998; Heard, 1997; Larson, 1998a; Treece, 1993; Tanner & Roncarti, 1994; Gregory, 2003)
• Team reviews current progress to plan next day’s activities (Wheatley, 1998; Sabatini, 2000) • Every 2 – 3 hours, team reassembles in Kaizen event room to review progress and then returns to the
target work area (Tanner & Roncarti, 1994) • Posting team actions, metrics, concepts and data around the team meeting room during the event
(Foreman & Vargas, 1999) • Kaizen event team gives daily updates to management, where managers hear the team’s plans and give
input (Foreman & Vargas, 1999) d) Participation
• Involving everyone on the Kaizen event team in the solution process (Vasilash, 1993) • Making each team member responsible for implementing at least one improvement idea (Bicheno,
2001) • Each team member participates in report-out to management (Adams et al., 1997; Larson, 1998b)
42
5. Broader Context (Kaizen Event Program Characteristics)
a) Kaizen Event Deployment • Spacing out events – e.g., only one event per quarter (Taninecz, 1997) • Concurrent Kaizen events (Vasilash, 1997; Watson, 2002; Cuscela, 1998; Bradley & Willett, 2004;
Adams et al., 1997; Wittenberg, 1994; Tanner & Roncarti, 1994; Gregory, 2003) • Targeted at areas that can provide a “big win” – i.e., provide a big impact on the organization (Minton,
• Repeat Kaizen events in a given work area (“Winning with Kaizen,” 2002; Purdum, 2004; Womack & Jones, 1996a; McNichols et al., 1999; Sheridan, 1997b; Bradley & Willett, 2004; Bicheno, 2001; Adams et al., 1997; Melnyk et al., 1998)
• Can be held based on employee suggestions for improvement (Jusko, 2004; Watson, 2002; Heard, 1997)
• Kaizen events used in non-manufacturing areas – e.g., office Kaizen events (Womack & Jones, 1996a; Sheridan, 1997b; Bradley & Willett, 2004; Melnyk et al., 1998; Klaus, 1998; Baker, 2005; Clark, 2004; Foreman & Vargas, 1999)
• Combining Kaizen events with other improvement approaches (Bicheno, 2001) • Using a sequence of related Kaizen events – e.g., 5S, SMED, Standard Work – to progressively
improvement a given work area (Bicheno, 2001; Melnyk et al., 1998; Laraia, 1998; Treece, 1993) • Attack “low hanging fruit” (Smith, 2003; Bicheno, 2001; Heard, 1997; Clark, 2004) • Output of given Kaizen event is used to determine the next Kaizen event (Adams et al., 1997) • Using Kaizen events sparingly, as method of achieving breakthrough change and overturning current
paradigms (Sheridan, 2000a) • Holding Kaizen events across different areas of the organization or value stream (Heard, 1997) • Daily team leader meetings for concurrent Kaizen events (Wittenberg, 1994; Sabatini, 2000; Tanner &
Roncarti, 1994) • First Kaizen event targeted at highest volume, most important product (Larson, 1998a) • Use of shorter, informal or “mini” Kaizen events (Tanner & Roncarti, 1994; “Waste Reduction
Program Slims Fleetwood Down,” 2000) • Concurrent Kaizen event teams are co-located – i.e., share the same meeting room (Tanner &
Roncarti, 1994) • Using Kaizen events to address areas of concern in value stream maps (VSM) (Gregory, 2003) • Concurrent Kaizen event teams brief each other two times each event day (Gregory, 2003)
b) Organizational Policies/Procedures • “No layoffs” policy (Redding, 1996; Vasilash, 1997; Creswell, 2001; “Winning with Kaizen,” 2002;
• Organization-wide commitment to change (Redding, 1996) • Total alignment of organizational procedures and policies with Kaizen event program (“Keys to
Success,” 1997; Tanner & Roncarti, 1994) • Organization-wide communication of the philosophies behind and importance of Kaizen events
(Kumar & Harms, 2004) c) Kaizen Program Support
• Use of a “Kaizen office,” including full-time coordinators/facilitators (Heard, 1997; “Keys to Success,” 1997; Bicheno, 2001; Foreman & Vargas, 1999)
• Keeping a central database of employee Kaizen event participation, past Kaizen event results, ideas for future Kaizen events, training materials, etc. (Heard, 1997)
• 30 days sustainability reviews for Kaizen events (Heard, 1997) • Offline training in new processes for employees not trained during the event – i.e., second shift, etc.
(Heard, 1997) • Use of a consultant to get the Kaizen event program started – i.e., to help set up the Kaizen event
promotion office, etc. (Heard, 1997; Martin, 2004)
43
• Emphasis on follow-up – e.g., consultants stayed on for 5 –10 days after the event to help standardize achievements (Kumar & Harms, 2004; Gregory, 2003)
• Follow-up Kaizen events with “traditional” kaizen (CPI) activities (Gregory, 2003) • Kaizen event team continues to meet regularly after the event to track open action items (Foreman &
Vargas, 1999)
2.3 Research Model Specification
Justification for measuring both technical system and social system outcomes is provided in the Kaizen event
literature, STS theory and project management and team effectiveness theory. As will be described in more detail in
the next chapter, the technical system measures chosen for study represent both objective performance measures and
perceptual measures. The social system measures chosen for study include a range of employee KSAs that are
aligned with continuous improvement. These variables were chosen to reflect some of the major human resource
benefits cited in the Kaizen event practitioner literature. The KSA framework is an established framework from the
I/O psychology literature (Muchinsky, 2000).
Overall, the specification of the event input and event process factors to be studied in the research was more
difficult than the specification of outcome measures. Due to the large number of potential factors in the Kaizen
event literature, as well as project management and team effectiveness theory, it was necessary to identify a smaller
set of key variables for study. A major goal of this refining process was to identify at least one factor related to each
of the four relevant factor groups identified in the review of the Kaizen event literature: 1) task design; 2) team
design; 3) organizational support; and 4) event process. Definitions of the specified variables were provided in
Chapter 1. However the following paragraphs provide detail on the specification of event input and event process
factor.
In the specification of initial research model, task and team design factors (see Table 1) are grouped together as
Kaizen Event Design Antecedents, since both sets of factors describe aspects of the design of a given Kaizen event –
e.g., its goals, team composition, etc. The Kaizen event design antecedent factors chosen for study in the research
are:
• Goal Clarity – A task design factor that reflects the clarity of event goal characteristics (see Table 1).
• Goal Difficulty – A task design factor that reflects team perceptions of goal difficulty (see Table 1).
• Team Kaizen Experience – A team design factor that reflects team compositional characteristics (see Table 1) –
specifically, the experience of Kaizen team members with Kaizen events.
44
• Team Functional Heterogeneity – A team design factor that reflects team compositional characteristics (see
Table 1) – specifically, the diversity of functional expertise for Kaizen team members.
• Team Autonomy – A task design factor that reflects Kaizen event team authority (see Table 1).
• Team Leader Experience – While not generally emphasized in the Kaizen event literature, this team design
factor is emphasized in the Nicolini model (2002), Belassi and Tukel model (1996), and practitioner-oriented
texts on designing Kaizen events (Mika, 2002).
Organizational and Work Area Antecedents include organizational factors identified in the Kaizen event
practitioner literature (see Table 1), as well as characteristics of the target work area. Including characteristics of the
work area, as well as the organization, is important since both appear to be drivers of Kaizen event design
antecedents, as well as the Kaizen event process and outcomes. For instance, the complexity of the target system
could directly influence team composition, as well as team activities. The organizational and work area antecedents
selected for study in the research are:
• Management Support – An organizational design factor (see Table 1). Management support may also contain
certain aspects of rewards/recognition – another organizational design factor (see Table 1). For instance, the
event budget may contain funds for a team celebratory lunch immediately following the event.
• Event Planning Process – An organizational design factor (see Table 1). Event planning process may also
contain aspects of communication — another organizational design factor (see Table 1). For instance,
planning may include a meeting with work area employees to announce the event and gain buy-in.
• Work Area Routineness – A work area factor (see Figure 5) that also relates to event scope (see Table 1).
Kaizen Event Process Factors include process factors from Table 1. The factors in this category are:
• Action Orientation (see Table 1) – This particular variable was also chosen for study since it is one of the
distinguishing factors of Kaizen events – e.g., one of the most frequently cited differences between Kaizen
events and “traditional” CPI activities. In addition, team effectiveness theory also suggests that this variable
could have an important impact on Kaizen event outcomes. Action Orientation also reflects aspects of team
coordination, since it describes how the team managed its time.
• Affective Commitment to Change – While this appeared to be perceived more as an input factor than as a
process factor in the Kaizen event literature, the Nicolini (2002) model and the Cohen and Bailey (1997) model
45
suggest that this factor is more properly categorized as a process factor – e.g., a factor arising from the Kaizen
event design, organizational and work area antecedents, and/or team activities.
• Tool Appropriateness (see Table 1) – Based on the Kaizen event literature and pilot research, it appears that
most Kaizen event teams use some form of structured problem solving tools and techniques – e.g.,
brainstorming, spaghetti diagramming, SMED, etc. However, the tools/techniques used appear to vary by the
type event goals – e.g., setup reduction events use SMED, while standard work events use spaghetti
diagramming, etc. Thus the selection and use of appropriate problem solving tools is expected to be an
important factor in Kaizen event team effectiveness. In addition to collecting ratings on tool appropriateness,
the current research also collected a list of problem-solving tools used. Thus, differences based on tools used
could be investigated in future post-hoc analysis.
• Tool Quality (see Table 1) – Quality of tool use must be measured separately from tool appropriateness, since
it would be possible for a team to make a poor selection of tools, but do a good job actually applying the tools,
or to select the right tools but do a poor job of applying them. Both scenarios – and any in between – could be
expected to have different effects on event outcomes.
• Internal Processes – this construct relates both to Team Coordination and Participation (see Table 1). It
describes the extent to which team interactions were harmonious, including open communication and respect
for each individual’s contribution.
One variable that was not ultimately included in the current research, but may be of interest in future research is
Training (see Table 1). The current research classified Training as an organizational and work area antecedent,
since it is a precursor to event problem-solving activities and may not even be conducted for the given event, if all
team members have participated in similar events. However, Training could also be considered part of the event
process. Based on the practitioner literature and the pilot research, it seems likely that all organizations provide
training for new members of the Kaizen event team. However, this training may be provided “offline” if other
members of the Kaizen event team have previously participated in similar events (McNichols et al., 1999; Bicheno,
2001). Thus, the binary variable of whether or not team members ultimately receive some form training is not likely
to vary across events or organizations. However, whether the training occurs as part of the event, the length of
training, topics covered and perceived effectiveness of training may vary across events and/or organizations. In the
current research, contextual information on training length, training topics and whether training was conducted as a
46
formal part of the event was collected through the Team Activities Log and the Event Information Sheet. Some of
these factors could therefore be investigated in future post-hoc analysis. In addition, each organization’s general
approach to Kaizen event training was conducted through the interview data describing the organizations overall
approach to conducting Kaizen events. However, collection of additional data related to training – such as the
perceived adequacy of training by Kaizen event team members, could be of interest in future research. As will be
discussed more in Chapter 6, studying the perceived adequacy of training may be difficult, since it could easily be
confounded with employee perceptions of the overall outcomes of the event on their KSAs.
47
CHAPTER 3: RESEARCH METHODS
The following sections describe the research design in terms of the ways in which the factors of interest were
measured, the way the data were collected, and the way the data were prepared for hypothesis testing – i.e., data
screening and initial data analyses to describe the factor structure, confirm scale reliability and support aggregation.
The general research design is a multi-site field study using a cross-sectional design. Kaizen events within study
organizations were sampled and measures were taken on the factors of interest, allowing the statistical analysis of
the relationships between event input factors, event process factors, technical system outcomes and social system
outcomes – i.e., the empirical testing of the working theory of Kaizen event effectiveness (see Chapter 1 and
Chapter 2).
3.1 Operationalized Measures for Study Factors
The following section summarizes the variables to be studied in the research. For each event input factor, event
process factor, and outcome, an operationalized measure was developed. Definitions of these measures were
provided in Chapter 1. The following sections describe the input data collected to calculate each measure, the
instrument used to collect the input data, the measurement timing and the data source – i.e., Kaizen event team
members or the event facilitator. The operationalized measures represent a mixture of objective and perceptual
measures. Operationalized measures were developed using factor descriptions from the literature review. Wherever
possible, survey questionnaire measures were based on existing survey scales. However, actual item wording was
modified to reflect the specific context of the current research. In addition, the first two events studied in this
research were considered a pilot phase and study instruments and methods were analyzed and refined based on this
additional pilot testing.
Two data sources were used to collect the data – the Kaizen event team members and the Kaizen event
facilitator. The Kaizen event facilitator is the individual who coordinates event planning and provides guidance to
the team during the event. Often, the Kaizen event facilitator is a member of management, a technical expert or a
person who facilitates events as their full-time job. The facilitator is not considered a part of the event team, but
rather acts as a support resource or coach. The facilitator typically delivers training to the team on the first day of
the event, and may provide guidance on how to use tools during the event and/or help keep team discussions “on
track.” The facilitator also helps the team procure needed resources, including meeting space, equipment, approval
48
for changes, etc. However, event decisions are made by team members and typically one of the team members acts
as the team leader.
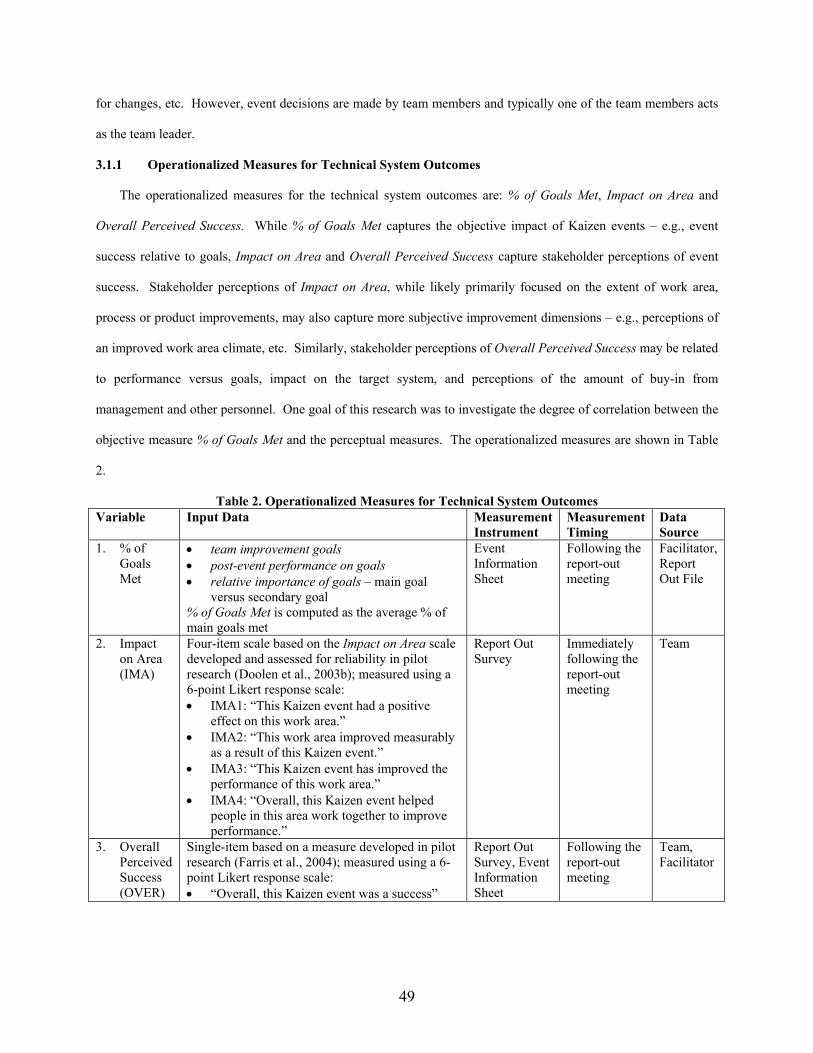
3.1.1 Operationalized Measures for Technical System Outcomes
The operationalized measures for the technical system outcomes are: % of Goals Met, Impact on Area and
Overall Perceived Success. While % of Goals Met captures the objective impact of Kaizen events – e.g., event
success relative to goals, Impact on Area and Overall Perceived Success capture stakeholder perceptions of event
success. Stakeholder perceptions of Impact on Area, while likely primarily focused on the extent of work area,
process or product improvements, may also capture more subjective improvement dimensions – e.g., perceptions of
an improved work area climate, etc. Similarly, stakeholder perceptions of Overall Perceived Success may be related
to performance versus goals, impact on the target system, and perceptions of the amount of buy-in from
management and other personnel. One goal of this research was to investigate the degree of correlation between the
objective measure % of Goals Met and the perceptual measures. The operationalized measures are shown in Table
2.
Table 2. Operationalized Measures for Technical System Outcomes Variable Input Data Measurement
Instrument Measurement Timing
Data Source
1. % of Goals Met
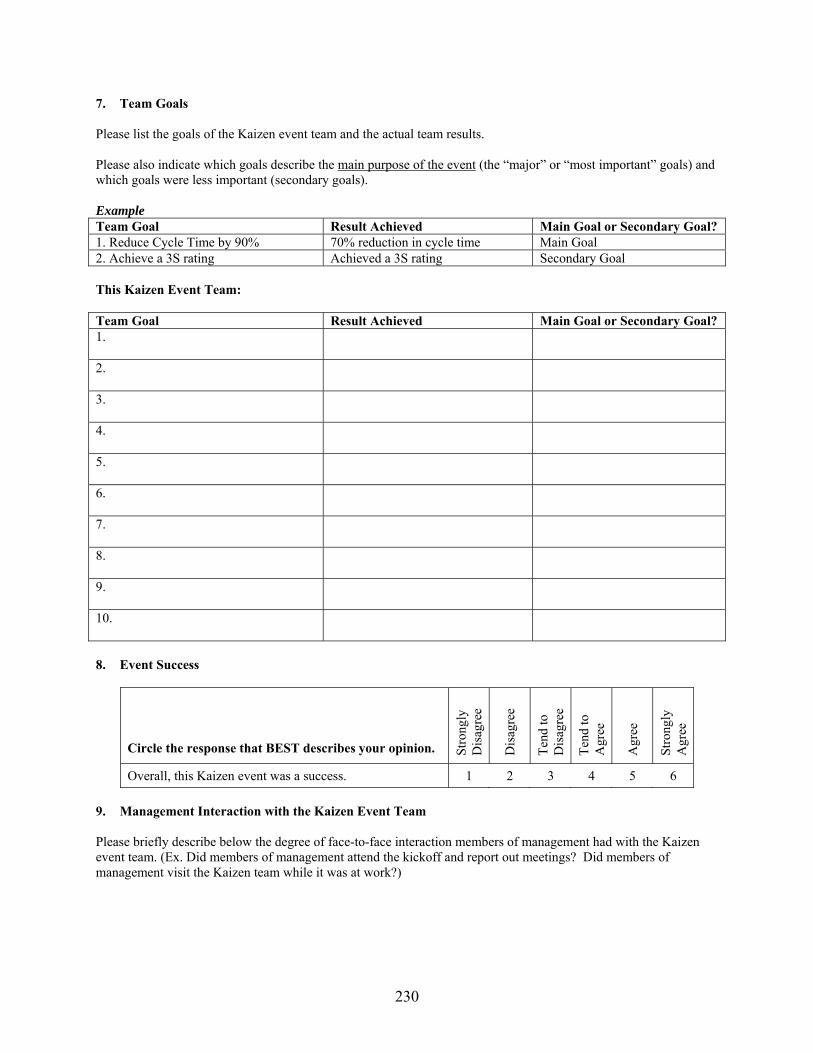
• team improvement goals • post-event performance on goals • relative importance of goals – main goal
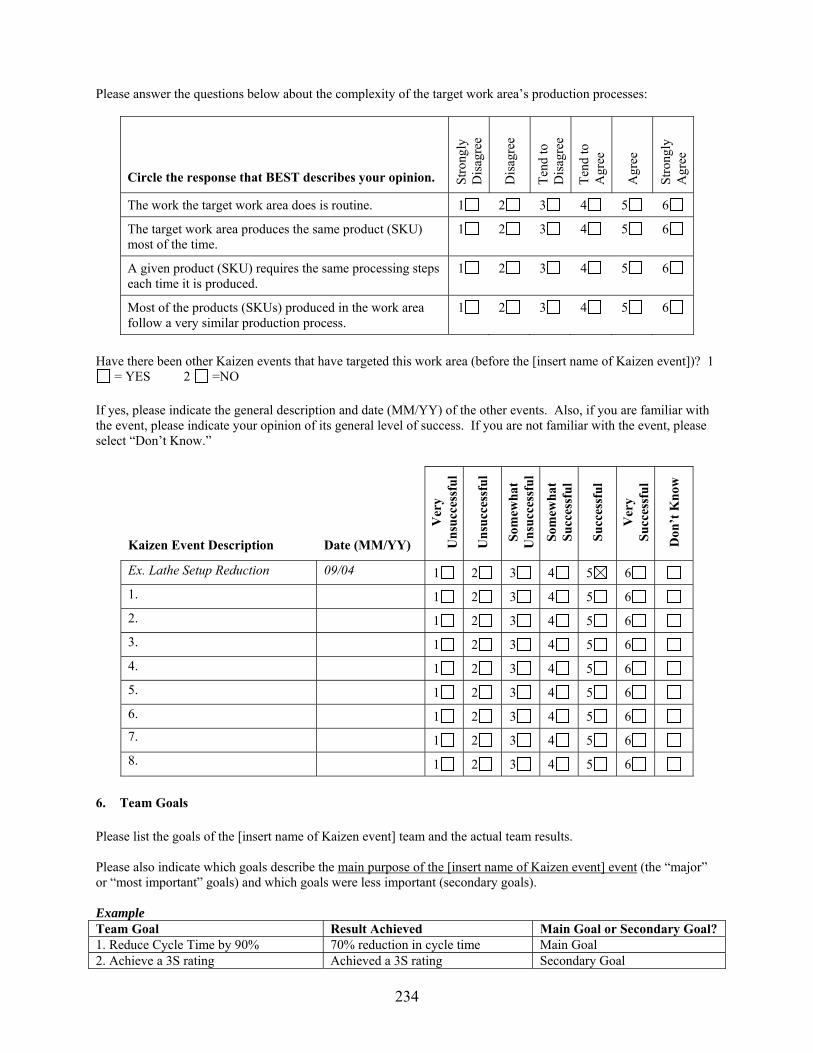
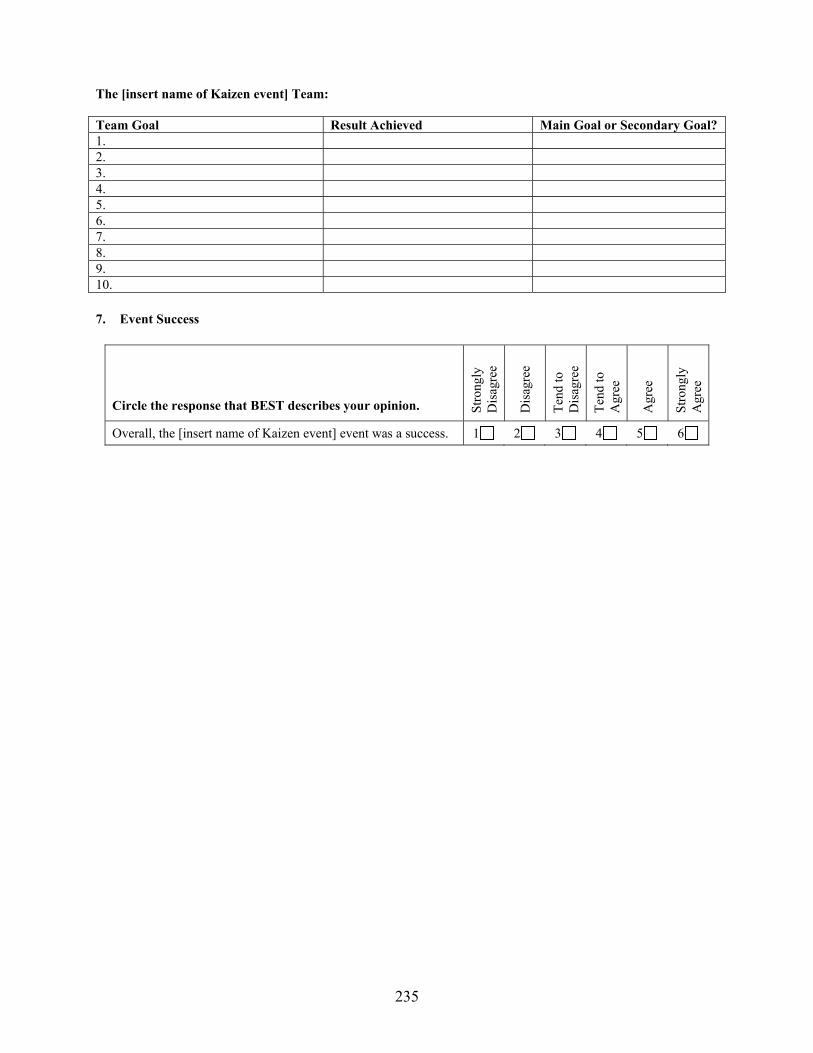
versus secondary goal % of Goals Met is computed as the average % of main goals met
Event Information Sheet
Following the report-out meeting
Facilitator, Report Out File
2. Impact on Area (IMA)
Four-item scale based on the Impact on Area scale developed and assessed for reliability in pilot research (Doolen et al., 2003b); measured using a 6-point Likert response scale: • IMA1: “This Kaizen event had a positive
effect on this work area.” • IMA2: “This work area improved measurably
as a result of this Kaizen event.” • IMA3: “This Kaizen event has improved the
performance of this work area.” • IMA4: “Overall, this Kaizen event helped
people in this area work together to improve performance.”
Report Out Survey
Immediately following the report-out meeting
Team
3. Overall Perceived Success (OVER)
Single-item based on a measure developed in pilot research (Farris et al., 2004); measured using a 6-point Likert response scale: • “Overall, this Kaizen event was a success”
Report Out Survey, Event Information Sheet
Following the report-out meeting
Team, Facilitator
49
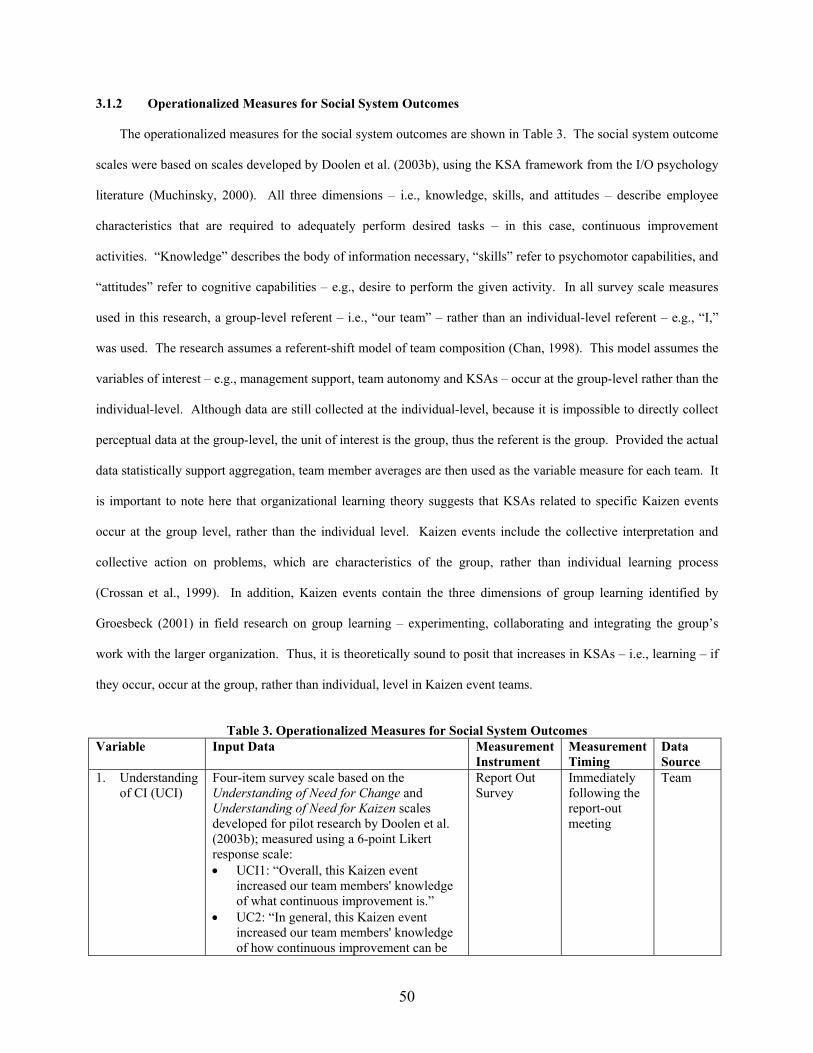
3.1.2 Operationalized Measures for Social System Outcomes
The operationalized measures for the social system outcomes are shown in Table 3. The social system outcome
scales were based on scales developed by Doolen et al. (2003b), using the KSA framework from the I/O psychology
literature (Muchinsky, 2000). All three dimensions – i.e., knowledge, skills, and attitudes – describe employee
characteristics that are required to adequately perform desired tasks – in this case, continuous improvement
activities. “Knowledge” describes the body of information necessary, “skills” refer to psychomotor capabilities, and
“attitudes” refer to cognitive capabilities – e.g., desire to perform the given activity. In all survey scale measures
used in this research, a group-level referent – i.e., “our team” – rather than an individual-level referent – e.g., “I,”
was used. The research assumes a referent-shift model of team composition (Chan, 1998). This model assumes the
variables of interest – e.g., management support, team autonomy and KSAs – occur at the group-level rather than the
individual-level. Although data are still collected at the individual-level, because it is impossible to directly collect
perceptual data at the group-level, the unit of interest is the group, thus the referent is the group. Provided the actual
data statistically support aggregation, team member averages are then used as the variable measure for each team. It
is important to note here that organizational learning theory suggests that KSAs related to specific Kaizen events
occur at the group level, rather than the individual level. Kaizen events include the collective interpretation and
collective action on problems, which are characteristics of the group, rather than individual learning process
(Crossan et al., 1999). In addition, Kaizen events contain the three dimensions of group learning identified by
Groesbeck (2001) in field research on group learning – experimenting, collaborating and integrating the group’s
work with the larger organization. Thus, it is theoretically sound to posit that increases in KSAs – i.e., learning – if
they occur, occur at the group, rather than individual, level in Kaizen event teams.
Table 3. Operationalized Measures for Social System Outcomes
Variable Input Data Measurement Instrument
Measurement Timing
Data Source
1. Understanding of CI (UCI)
Four-item survey scale based on the Understanding of Need for Change and Understanding of Need for Kaizen scales developed for pilot research by Doolen et al. (2003b); measured using a 6-point Likert response scale: • UCI1: “Overall, this Kaizen event
increased our team members' knowledge of what continuous improvement is.”
• UC2: “In general, this Kaizen event increased our team members' knowledge of how continuous improvement can be
Report Out Survey
Immediately following the report-out meeting
Team
50
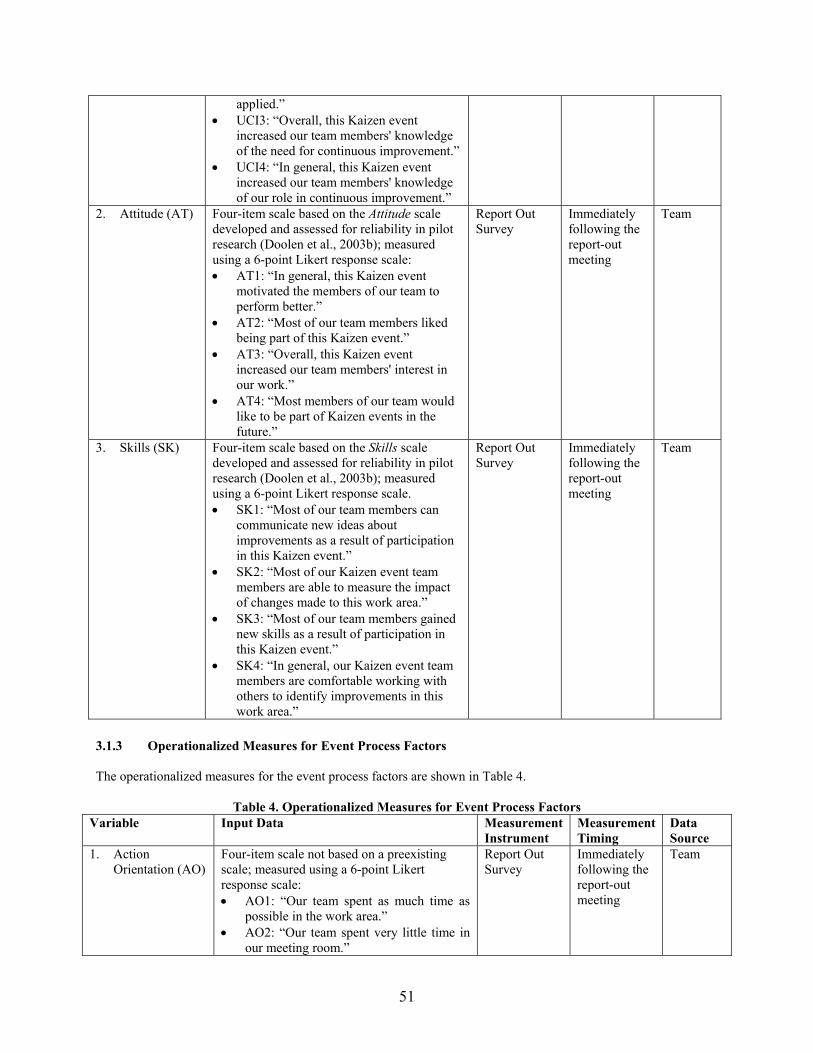
applied.” • UCI3: “Overall, this Kaizen event
increased our team members' knowledge of the need for continuous improvement.”
• UCI4: “In general, this Kaizen event increased our team members' knowledge of our role in continuous improvement.”
2. Attitude (AT) Four-item scale based on the Attitude scale developed and assessed for reliability in pilot research (Doolen et al., 2003b); measured using a 6-point Likert response scale: • AT1: “In general, this Kaizen event
motivated the members of our team to perform better.”
• AT2: “Most of our team members liked being part of this Kaizen event.”
• AT3: “Overall, this Kaizen event increased our team members' interest in our work.”
• AT4: “Most members of our team would like to be part of Kaizen events in the future.”
Report Out Survey
Immediately following the report-out meeting
Team
3. Skills (SK) Four-item scale based on the Skills scale developed and assessed for reliability in pilot research (Doolen et al., 2003b); measured using a 6-point Likert response scale. • SK1: “Most of our team members can
communicate new ideas about improvements as a result of participation in this Kaizen event.”
• SK2: “Most of our Kaizen event team members are able to measure the impact of changes made to this work area.”
• SK3: “Most of our team members gained new skills as a result of participation in this Kaizen event.”
• SK4: “In general, our Kaizen event team members are comfortable working with others to identify improvements in this work area.”
Report Out Survey
Immediately following the report-out meeting
Team
3.1.3 Operationalized Measures for Event Process Factors
The operationalized measures for the event process factors are shown in Table 4.
Table 4. Operationalized Measures for Event Process Factors Variable Input Data Measurement
Instrument Measurement Timing
Data Source
1. Action Orientation (AO)
Four-item scale not based on a preexisting scale; measured using a 6-point Likert response scale: • AO1: “Our team spent as much time as
possible in the work area.” • AO2: “Our team spent very little time in
our meeting room.”
Report Out Survey
Immediately following the report-out meeting
Team
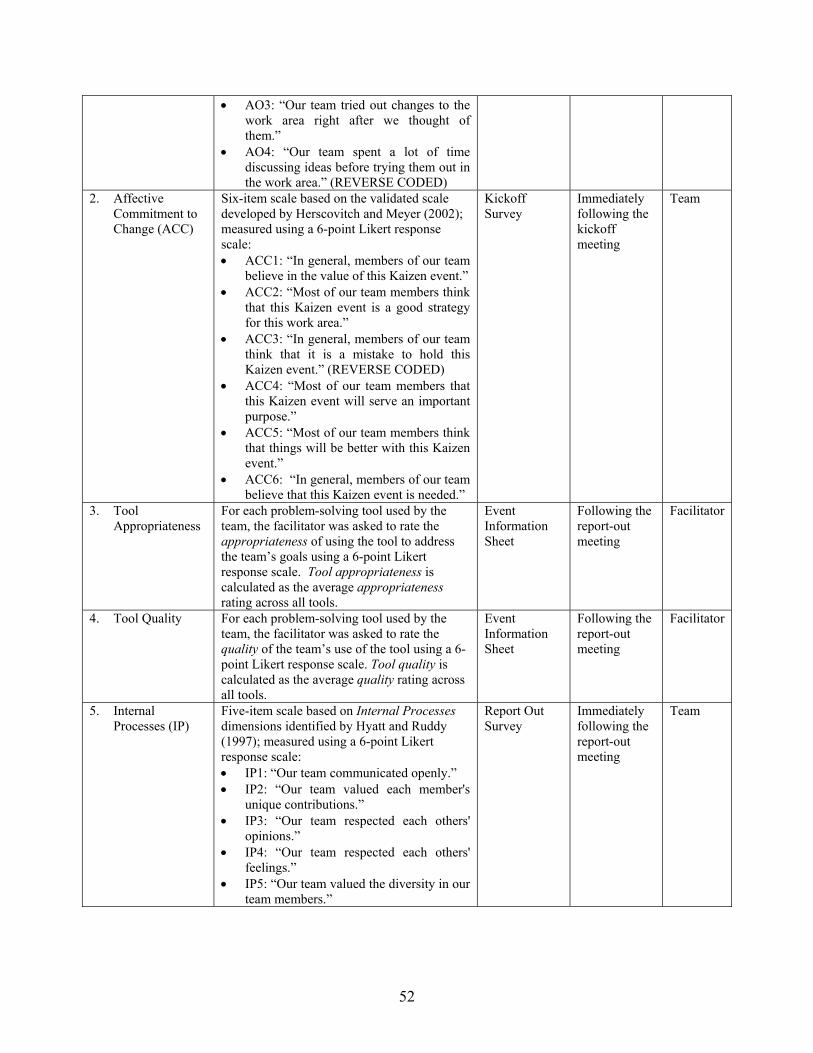
51
• AO3: “Our team tried out changes to the work area right after we thought of them.”
• AO4: “Our team spent a lot of time discussing ideas before trying them out in the work area.” (REVERSE CODED)
2. Affective Commitment to Change (ACC)
Six-item scale based on the validated scale developed by Herscovitch and Meyer (2002); measured using a 6-point Likert response scale: • ACC1: “In general, members of our team
believe in the value of this Kaizen event.” • ACC2: “Most of our team members think
that this Kaizen event is a good strategy for this work area.”
• ACC3: “In general, members of our team think that it is a mistake to hold this Kaizen event.” (REVERSE CODED)
• ACC4: “Most of our team members that this Kaizen event will serve an important purpose.”
• ACC5: “Most of our team members think that things will be better with this Kaizen event.”
• ACC6: “In general, members of our team believe that this Kaizen event is needed.”
Kickoff Survey
Immediately following the kickoff meeting
Team
3. Tool Appropriateness
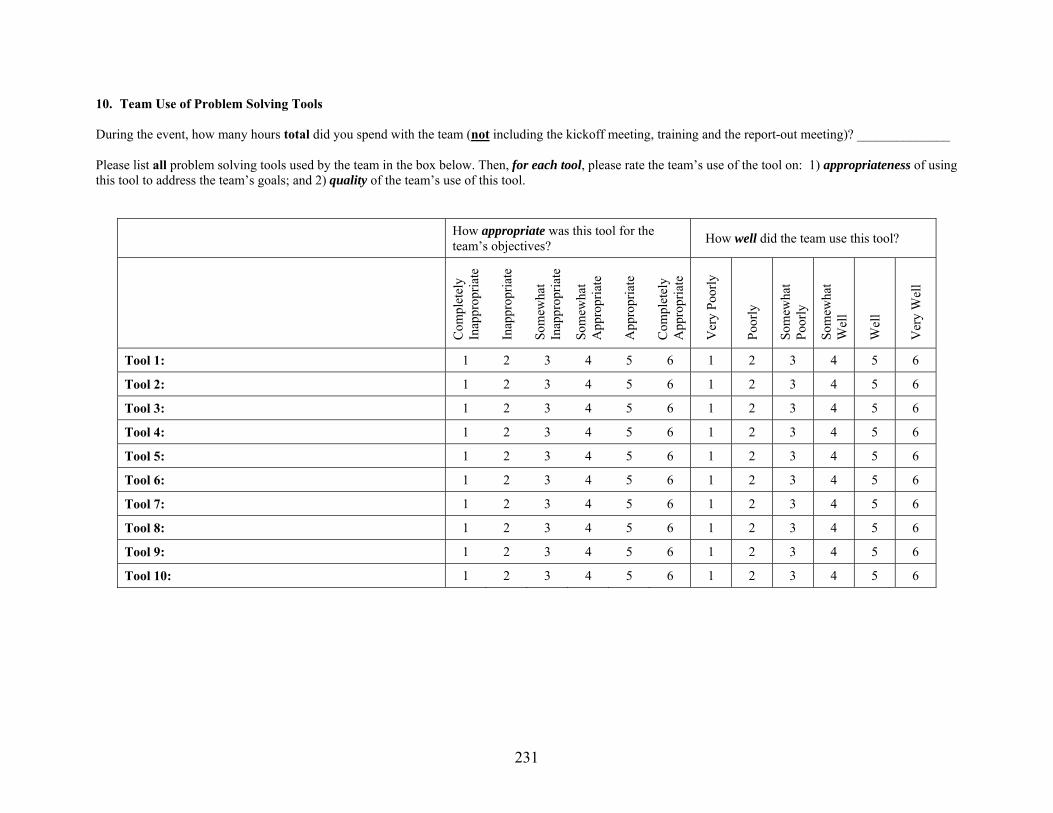
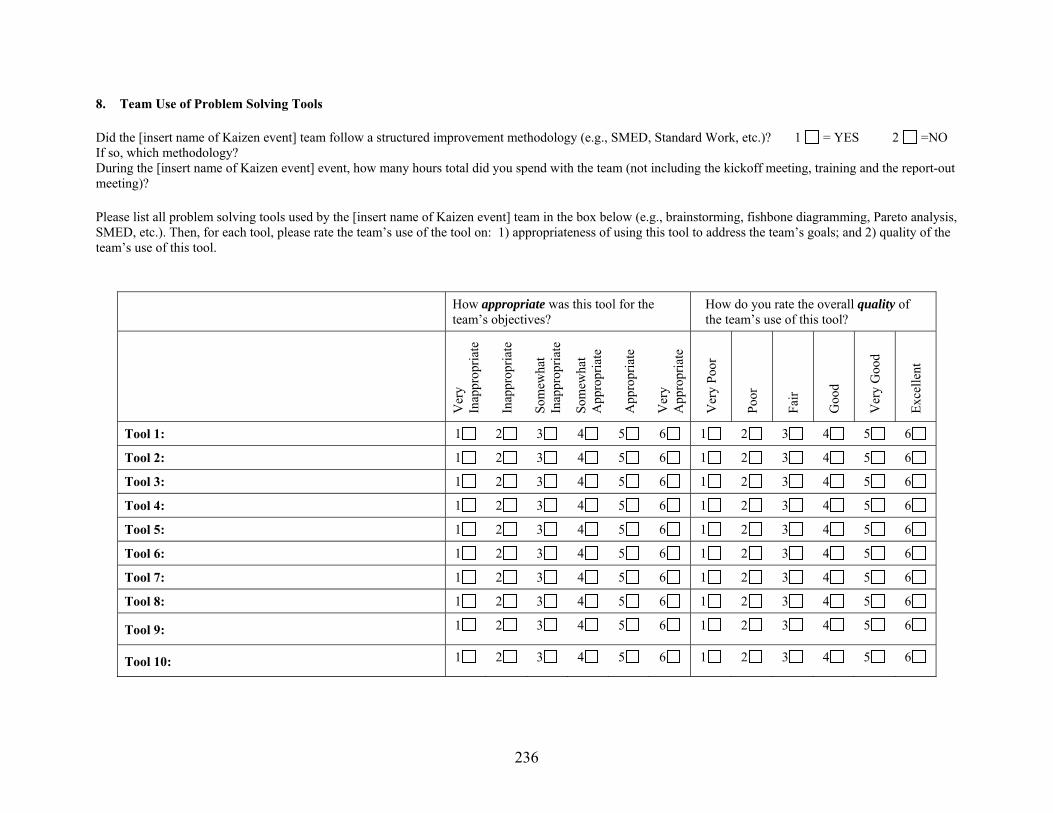
For each problem-solving tool used by the team, the facilitator was asked to rate the appropriateness of using the tool to address the team’s goals using a 6-point Likert response scale. Tool appropriateness is calculated as the average appropriateness rating across all tools.
Event Information Sheet
Following the report-out meeting
Facilitator
4. Tool Quality For each problem-solving tool used by the team, the facilitator was asked to rate the quality of the team’s use of the tool using a 6-point Likert response scale. Tool quality is calculated as the average quality rating across all tools.
Event Information Sheet
Following the report-out meeting
Facilitator
5. Internal Processes (IP)
Five-item scale based on Internal Processes dimensions identified by Hyatt and Ruddy (1997); measured using a 6-point Likert response scale: • IP1: “Our team communicated openly.” • IP2: “Our team valued each member's
unique contributions.” • IP3: “Our team respected each others'
opinions.” • IP4: “Our team respected each others'
feelings.” • IP5: “Our team valued the diversity in our
team members.”
Report Out Survey
Immediately following the report-out meeting
Team
52
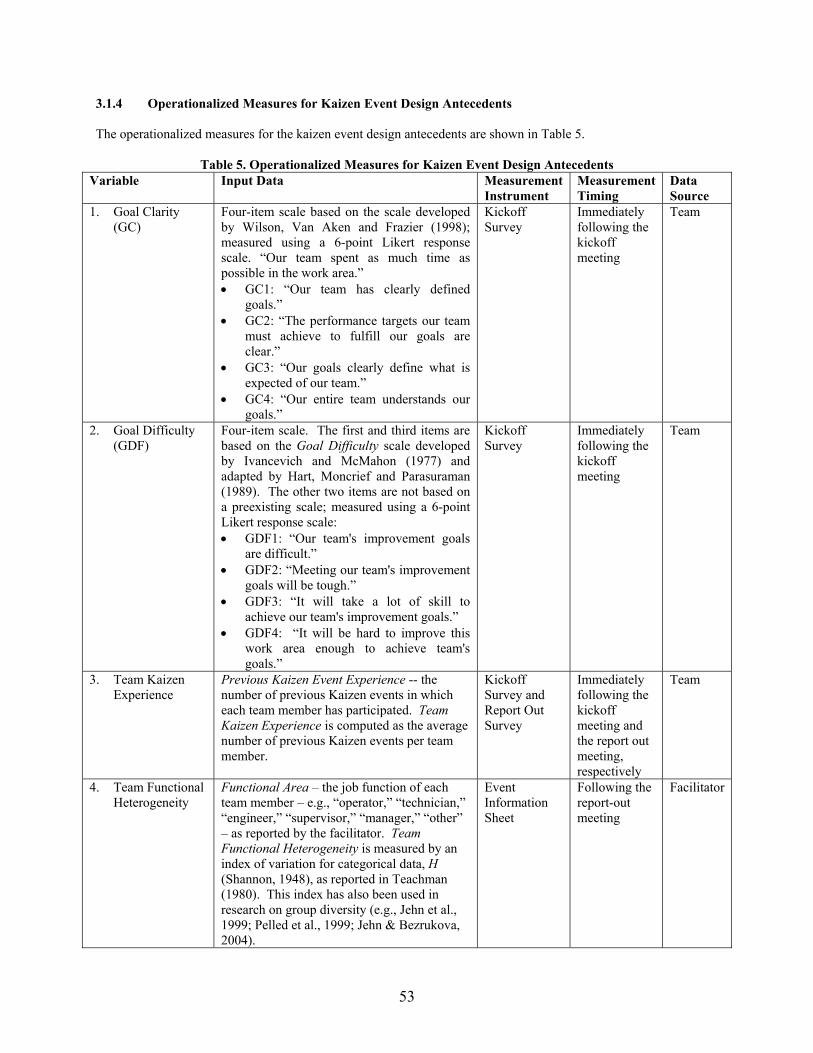
3.1.4 Operationalized Measures for Kaizen Event Design Antecedents
The operationalized measures for the kaizen event design antecedents are shown in Table 5.
Table 5. Operationalized Measures for Kaizen Event Design Antecedents Variable Input Data Measurement
Instrument Measurement Timing
Data Source
1. Goal Clarity (GC)
Four-item scale based on the scale developed by Wilson, Van Aken and Frazier (1998); measured using a 6-point Likert response scale. “Our team spent as much time as possible in the work area.” • GC1: “Our team has clearly defined
goals.” • GC2: “The performance targets our team
must achieve to fulfill our goals are clear.”
• GC3: “Our goals clearly define what is expected of our team.”
• GC4: “Our entire team understands our goals.”
Kickoff Survey
Immediately following the kickoff meeting
Team
2. Goal Difficulty (GDF)
Four-item scale. The first and third items are based on the Goal Difficulty scale developed by Ivancevich and McMahon (1977) and adapted by Hart, Moncrief and Parasuraman (1989). The other two items are not based on a preexisting scale; measured using a 6-point Likert response scale: • GDF1: “Our team's improvement goals
are difficult.” • GDF2: “Meeting our team's improvement
goals will be tough.” • GDF3: “It will take a lot of skill to
achieve our team's improvement goals.” • GDF4: “It will be hard to improve this
work area enough to achieve team's goals.”
Kickoff Survey
Immediately following the kickoff meeting
Team
3. Team Kaizen Experience
Previous Kaizen Event Experience -- the number of previous Kaizen events in which each team member has participated. Team Kaizen Experience is computed as the average number of previous Kaizen events per team member.
Kickoff Survey and Report Out Survey
Immediately following the kickoff meeting and the report out meeting, respectively
Team
4. Team Functional Heterogeneity
Functional Area – the job function of each team member – e.g., “operator,” “technician,” “engineer,” “supervisor,” “manager,” “other” – as reported by the facilitator. Team Functional Heterogeneity is measured by an index of variation for categorical data, H (Shannon, 1948), as reported in Teachman (1980). This index has also been used in research on group diversity (e.g., Jehn et al., 1999; Pelled et al., 1999; Jehn & Bezrukova, 2004).
Event Information Sheet
Following the report-out meeting
Facilitator
53
))/1(log(∑=i
ii ppH
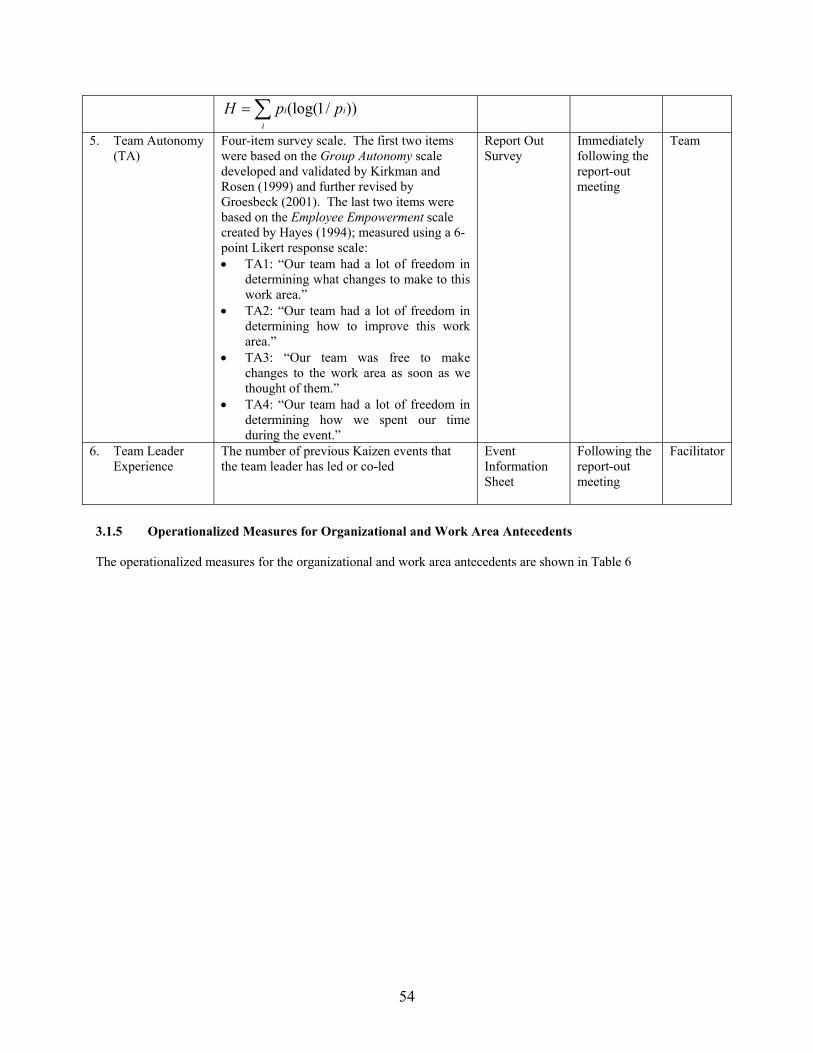
5. Team Autonomy (TA)
Four-item survey scale. The first two items were based on the Group Autonomy scale developed and validated by Kirkman and Rosen (1999) and further revised by Groesbeck (2001). The last two items were based on the Employee Empowerment scale created by Hayes (1994); measured using a 6-point Likert response scale: • TA1: “Our team had a lot of freedom in
determining what changes to make to this work area.”
• TA2: “Our team had a lot of freedom in determining how to improve this work area.”
• TA3: “Our team was free to make changes to the work area as soon as we thought of them.”
• TA4: “Our team had a lot of freedom in determining how we spent our time during the event.”
Report Out Survey
Immediately following the report-out meeting
Team
6. Team Leader Experience
The number of previous Kaizen events that the team leader has led or co-led
Event Information Sheet
Following the report-out meeting
Facilitator
3.1.5 Operationalized Measures for Organizational and Work Area Antecedents
The operationalized measures for the organizational and work area antecedents are shown in Table 6
54
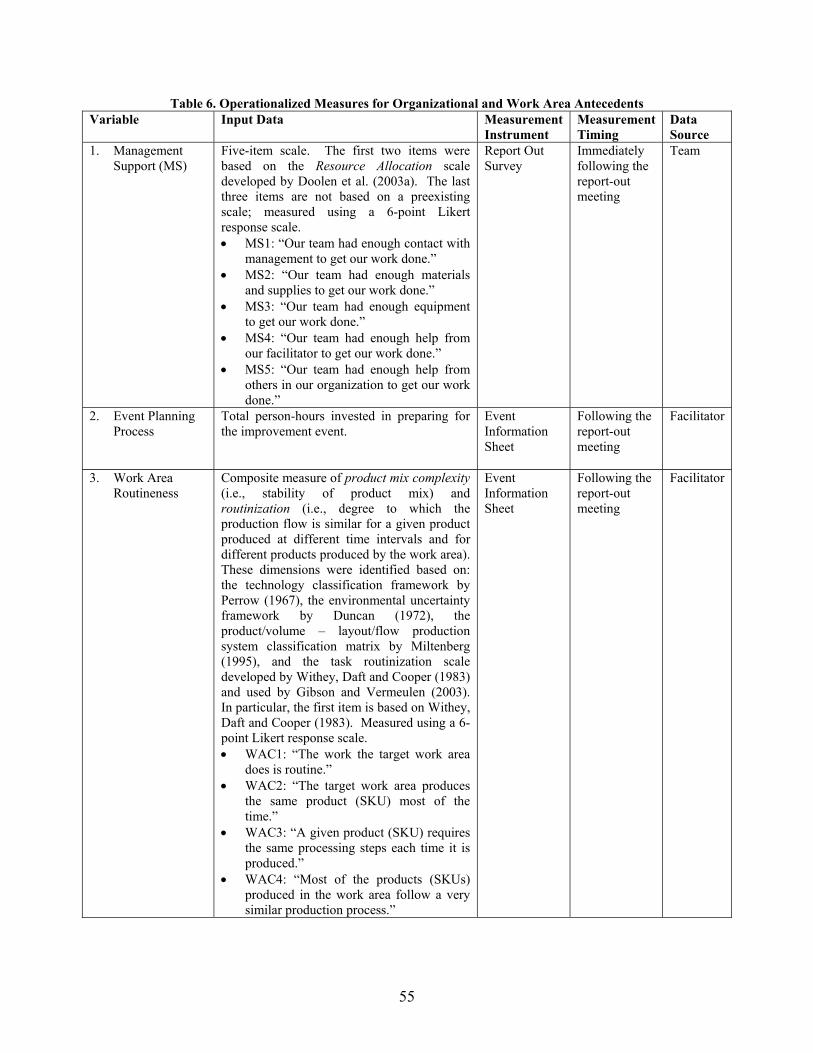
Table 6. Operationalized Measures for Organizational and Work Area Antecedents Variable Input Data Measurement
Instrument Measurement Timing
Data Source
1. Management Support (MS)
Five-item scale. The first two items were based on the Resource Allocation scale developed by Doolen et al. (2003a). The last three items are not based on a preexisting scale; measured using a 6-point Likert response scale. • MS1: “Our team had enough contact with
management to get our work done.” • MS2: “Our team had enough materials
and supplies to get our work done.” • MS3: “Our team had enough equipment
to get our work done.” • MS4: “Our team had enough help from
our facilitator to get our work done.” • MS5: “Our team had enough help from
others in our organization to get our work done.”
Report Out Survey
Immediately following the report-out meeting
Team
2. Event Planning Process
Total person-hours invested in preparing for the improvement event.
Event Information Sheet
Following the report-out meeting
Facilitator
3. Work Area Routineness
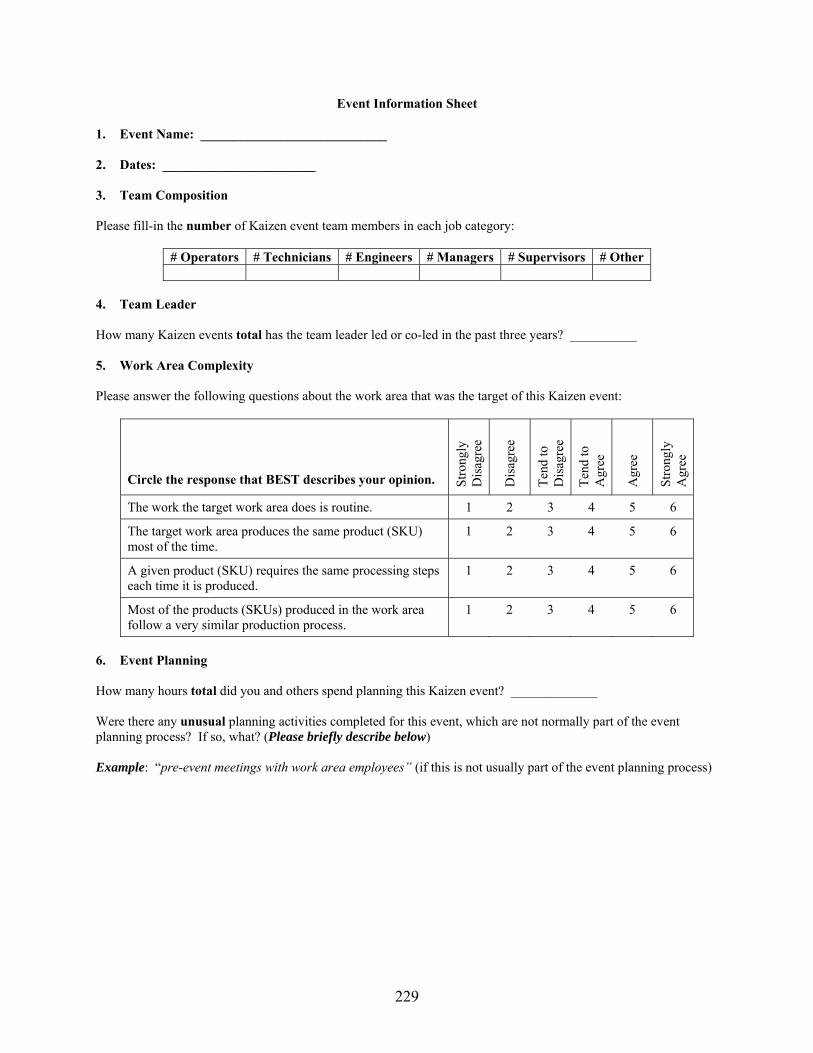
Composite measure of product mix complexity (i.e., stability of product mix) and routinization (i.e., degree to which the production flow is similar for a given product produced at different time intervals and for different products produced by the work area). These dimensions were identified based on: the technology classification framework by Perrow (1967), the environmental uncertainty framework by Duncan (1972), the product/volume – layout/flow production system classification matrix by Miltenberg (1995), and the task routinization scale developed by Withey, Daft and Cooper (1983) and used by Gibson and Vermeulen (2003). In particular, the first item is based on Withey, Daft and Cooper (1983). Measured using a 6-point Likert response scale. • WAC1: “The work the target work area
does is routine.” • WAC2: “The target work area produces
the same product (SKU) most of the time.”
• WAC3: “A given product (SKU) requires the same processing steps each time it is produced.”
• WAC4: “Most of the products (SKUs) produced in the work area follow a very similar production process.”
Event Information Sheet
Following the report-out meeting
Facilitator
55
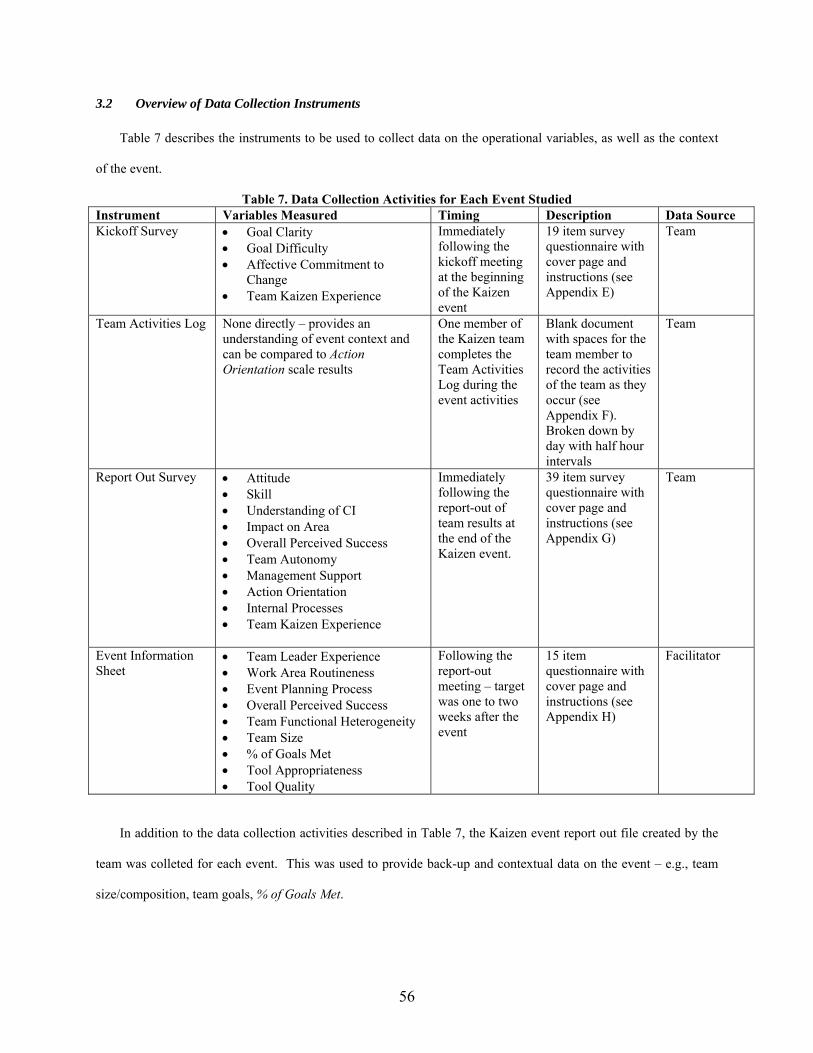
3.2 Overview of Data Collection Instruments
Table 7 describes the instruments to be used to collect data on the operational variables, as well as the context
of the event.
Table 7. Data Collection Activities for Each Event Studied Instrument Variables Measured Timing Description Data Source Kickoff Survey • Goal Clarity
• Goal Difficulty • Affective Commitment to
Change • Team Kaizen Experience
Immediately following the kickoff meeting at the beginning of the Kaizen event
19 item survey questionnaire with cover page and instructions (see Appendix E)
Team
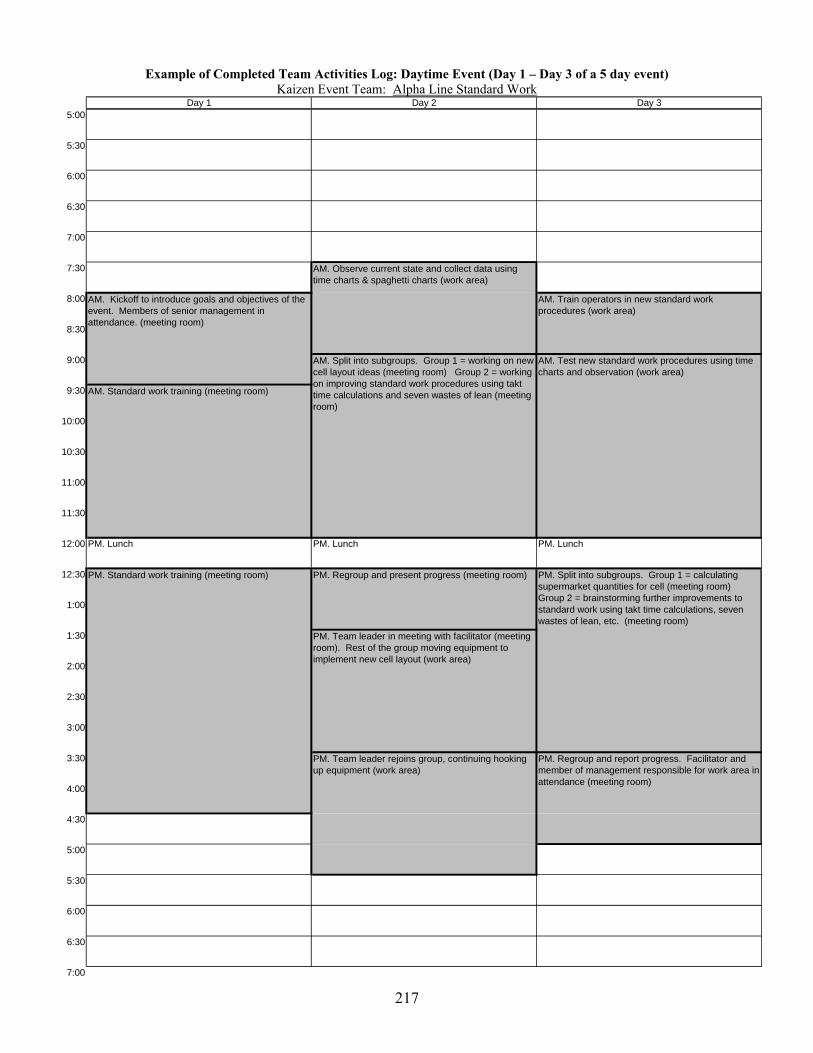
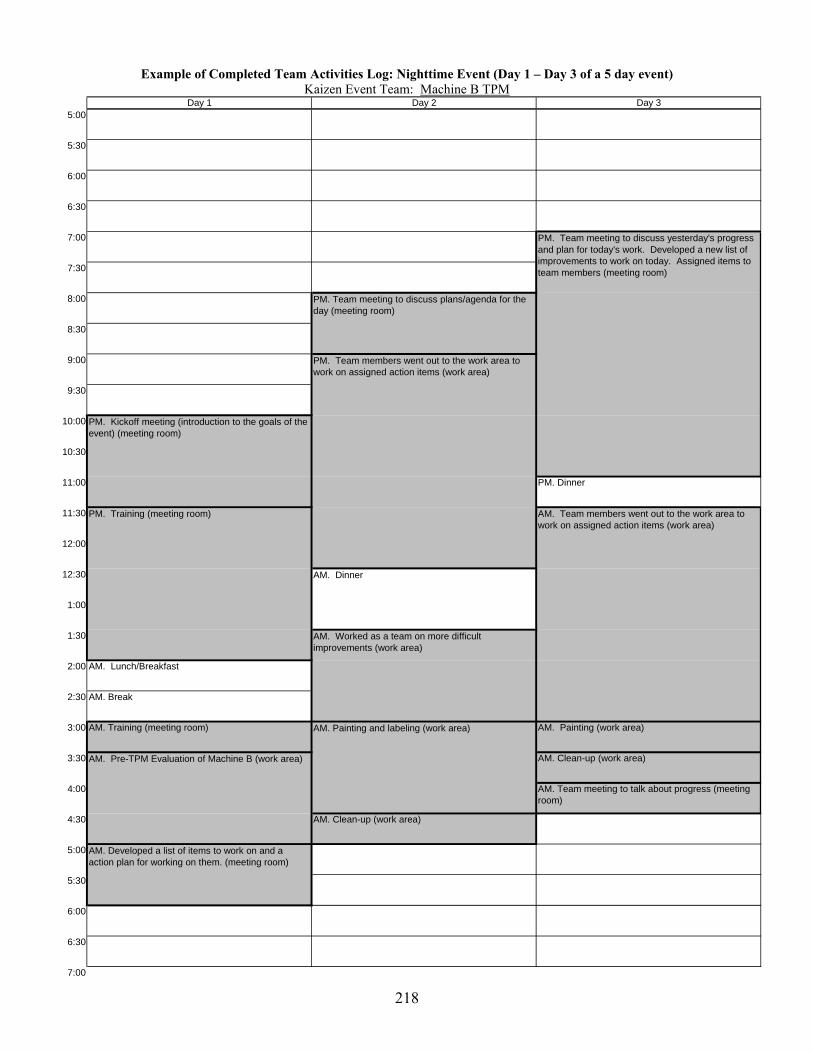
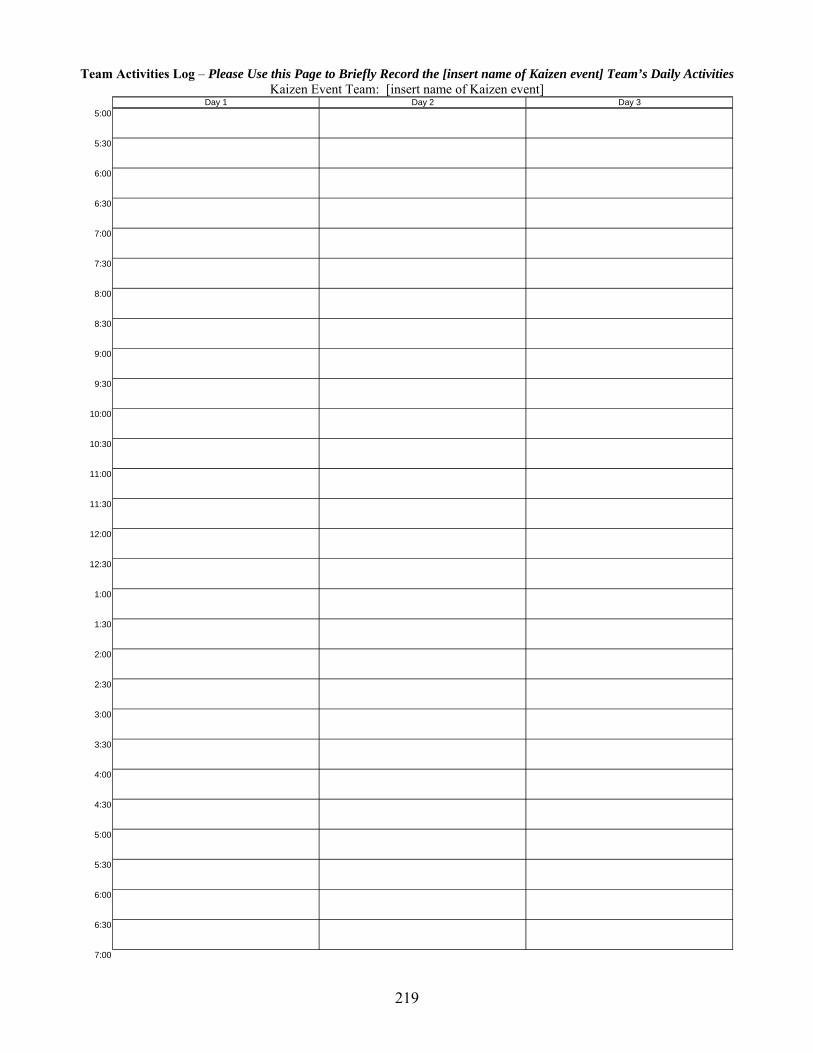
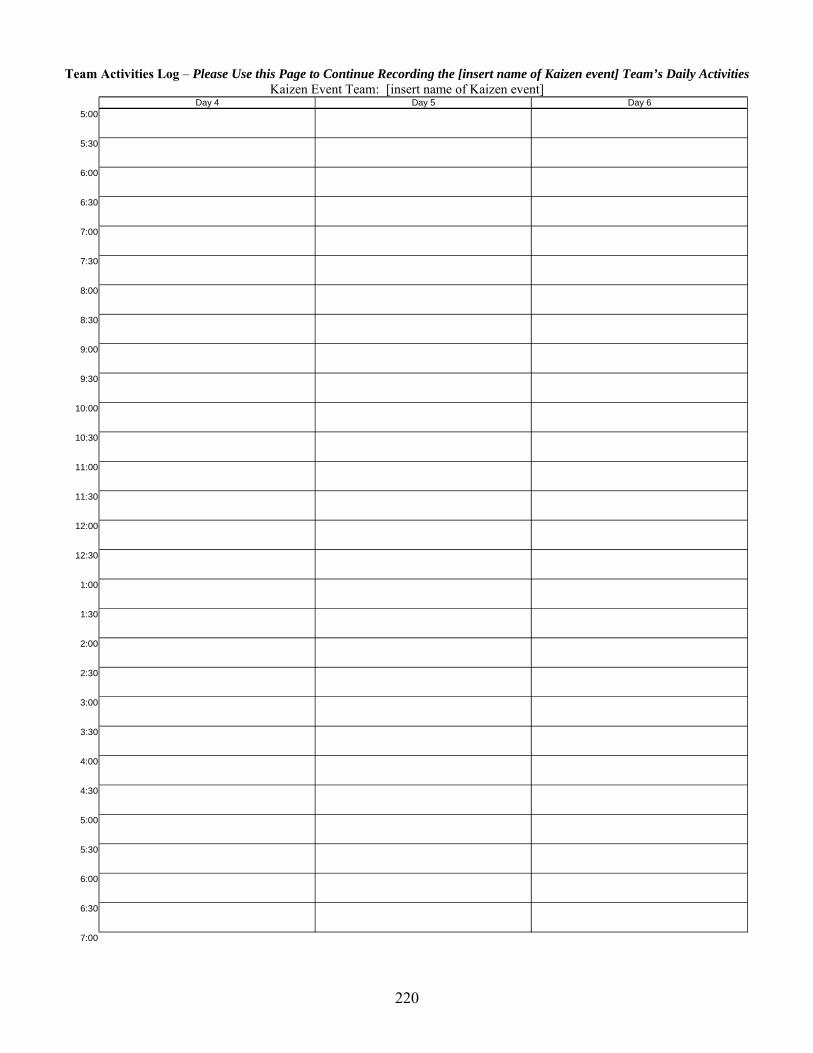
Team Activities Log None directly – provides an understanding of event context and can be compared to Action Orientation scale results
One member of the Kaizen team completes the Team Activities Log during the event activities
Blank document with spaces for the team member to record the activities of the team as they occur (see Appendix F). Broken down by day with half hour intervals
Team
Report Out Survey • Attitude • Skill • Understanding of CI • Impact on Area • Overall Perceived Success • Team Autonomy • Management Support • Action Orientation • Internal Processes • Team Kaizen Experience
Immediately following the report-out of team results at the end of the Kaizen event.
39 item survey questionnaire with cover page and instructions (see Appendix G)
Team
Event Information Sheet
• Team Leader Experience • Work Area Routineness • Event Planning Process • Overall Perceived Success • Team Functional Heterogeneity • Team Size • % of Goals Met • Tool Appropriateness • Tool Quality
Following the report-out meeting – target was one to two weeks after the event
15 item questionnaire with cover page and instructions (see Appendix H)
Facilitator
In addition to the data collection activities described in Table 7, the Kaizen event report out file created by the
team was colleted for each event. This was used to provide back-up and contextual data on the event – e.g., team
size/composition, team goals, % of Goals Met.
56
In addition to the collection of the data for each Kaizen event studied, the researcher collected the following
data on basic organizational characteristics that may impact the generalizability of study results:
• Basic organizational demographic data – location, industry sector, major products, number of employees,
number of local facilities.
• Information on the history of the Kaizen event program – e.g., how long the organization has been conducting
Kaizen events, types of results experienced, difficulties experienced, basic methodology for conducting Kaizen
events – selecting, planning, implementing and sustaining events, etc.
This second type of organizational information was collected using a semi-structured interview guide – the
Kaizen Event Program Interview Guide (see Appendix I) – which was developed and pilot tested as part of the
broader effort to understand Kaizen events.
3.3 Data Collection Procedures
3.3.1 Sample Selection
The final sample consisted of six organizations who were also participating in the broader OSU – VT initiative
to understand Kaizen events. To provide some basis for comparison across organizations and to reduce unwanted –
“nuisance” – variability across organizations, the following boundary conditions were used to select organizations to
participate in this research:
• The organizations manufacture products of some type – e.g., no purely service or knowledge-work
organizations were included. This ensured that organizations have some baselines similarities in focus,
fundamental processes and metrics used to measure performance. However, organizations across different
industries were recruited to increase generalizability of results.
• The organizations must have been conducting Kaizen events for at least one year prior to the start of the
study. This criterion was intended to eliminate the organizational learning start-up curve from
organizations that are just starting to implement Kaizen events. This allows the study of Kaizen events in
organizations that are fairly “mature” in the use of events, providing a “best practice” sample for studying
Kaizen event effectiveness. Additional research on Kaizen events within organizations just beginning to
use this mechanism may be of interest in future research.
57
• The organizations must use Kaizen events systematically, as part of a formal organizational improvement
strategy, rather than as “single use” change mechanisms. Again, this is intended to provide a “mature,”
“best practice” sample by including companies that embrace the philosophical and strategic roots of
Kaizen events, rather than companies that view Kaizen events primarily as an ad-hoc problem-solving tool
and only use them sporadically.
• The organizations must conduct Kaizen events relatively frequently – i.e., at least one event per month on
average. This was intended to allow an adequate sample size of Kaizen events within each organization.
Through information gained from colleagues, industrial partners, conference presentations and
trade/scholarly publications, the research team sought out organizations known to fit these boundary conditions,
across a fairly broad spectrum of industries. These organizations were provided with a short description of the
research and the expected benefits from participation, and were invited to participate. Thus, the sample at the
organizational level was not randomly selected; however, the necessity of utilizing the boundary conditions made
the selection of a random sample infeasible, if not impossible. However, participation in the overall OSU – VT
study of Kaizen events is open to all organizations that fit the boundary conditions. While not part of the sample
used in this research, additional calls for participation in the broader study were included in conference presentations
and meetings, as well as in trade journals and in manufacturing and industrial engineering society newsletters. Two
additional organizations have signed on to participate in future research that is part of the broader study.
Seven organizations originally agreed to participate. However, one organization withdrew after only providing
data for one Kaizen event. Therefore, the final sample size was six at the organizational level. Table 8 summarizes
the characteristics of the participating organizations.
Within each organization, Kaizen events were randomly selected for study. The original objective was to
sample all the Kaizen events conducted within the sample timeframe – i.e., approximately January 2006 – August
2006. Three organizations – Company A, Company B and Company C – agreed to this sampling frequency.
However, certain organizations requested a lower sampling frequency – Company D, Company E and Company F.
In these organizations, a systematic sampling procedure was adopted (Scheaffer, et al., 1996). Where the average
number of events in the company per month was some number n, a k was selected between one and n, such that
every kth event was targeted for study. Overall, the actual frequency of events studied was generally lower than the
target frequency of events studied, due to some cases of non-response from the organizations regarding their current
58
event schedules and some cases of facilitators failing to administer surveys. Table 9 lists the estimated achieved
versus targeted response rate for each company in terms of percentage of events studied.
Table 8. Characteristics of Study Organizations Company A Company B Company C Company D Company E Company F
Description Secondary wood product manufacturer
Electronic motor manufacturer
Secondary wood product manufacturer
Manufacturer of large transportation equipment
Specialty equipment manufacturer
Steel component manufacturer
First Kaizen Event
1998 2000 1992 1998 2000 1995
Kaizen Event Rate (end of 2005)
2 – 3 per month
About 1 every other month in steady state; however, every 6-12 months they also hold “umbrella events,” where 5-7 events are held concurrently
2 per month 3- 4 per facilitator per month
2 per week About 1 per month
% of Organization that has Experienced Events
100% 90%
Not sure 85% 100% 20%
Major Processes Targeted
Operations Operations, sales/marketing, customer service/technical support, product design/redesign, production planning/inventory control, process design/redesign
Operations Engineering and related activities
All areas of organization
Manufacturing, order entry, accounts receivable, distribution, vendors, engineering product development
% Manufacturing Events
Almost 100% manufacturing
75% manufacturing
Almost 100% manufacturing
70% non-manufacturing
Not sure 80-85% manufacturing
The main sampling criterion for including events was that the Kaizen event was considered a “formal event” by the
organization and included all the basic support processes associated with Kaizen events – e.g., planning, formal
announcement, report out, etc. This criterion was added since many organizations run shorter versions of Kaizen
events -- often one or two days long – which are not considered full Kaizen events. These events are often spur of
the moment and often do not contain all the elements associated with Kaizen events. For instance, the work in the
event may be interrupted – i.e., two days off, two days on – or part-time versus full-time, the report out may be to a
work area supervisor versus management, and training is often omitted. In addition, different tools may be used and
59
different problems/goals addressed. Although these shorter informal events are interesting – and may be of
particular interest in future research (i.e., comparing formal versus informal events) – they appeared to be different
enough from formal events to avoid including them in this initial study.
Table 9. Estimated Response Rates from Study Organizations Organization # Events % Studied Target % Study Window
Company A 15 100% 100% October 2005 – May 2006
Company B 8 56% 100% March 2006 – May 2006
Company C 11 100% 100% January 2006 – June 2006
Company D 4 13% 25% - 33% January 2006 – June 2006
Company E 12 33% 50% January 2006 – June 2006
Company F 6 24% 60% January 2006 – May 2006
Total Events 56
Appendix R summaries the characteristics of the events studied in the participating organizations. In some cases,
events could not be included due to missing data – i.e., a response rate lower than 50% on either the Kickoff Survey
and/or Report Survey. In addition, following the factor analysis of the survey scales (described later in this chapter),
a sixth team was excluded due to insufficient sample size at a variable. Table 10 summarizes the final number of
events per company that were included in the study. A total of 51 events out of the original 56 sampled were
included in the final analysis.
Table 10. Final Count of Events Included in the Study Organization # Events
Company A 15
Company B 8
Company C 7
Company D 4
Company E 11
Company F 6
Total Events 51
60
3.3.2 Mechanics of the Data Collection Procedures and Data Management
The following section provides an overview of the data management procedures. The author developed an
Excel spreadsheet (“Data Collection Checksheet”) to track the data collection activities for each event. Raw data
were inputted into a second Excel spreadsheet. Completed surveys and other hard copies of data collection
instruments were stored within a secure location at Virginia Tech – i.e. a file cabinet in the researcher’s office.
Electronic data were stored by the author on secure computers – i.e. the author’s office computers provided and
monitored by the ISE department, and a personally owned laptop computer.
The data collection procedures were designed to be as stand-alone as possible, both to avoid instrumentation
error, and to facilitate the collection of data at remote sites. Because this research studied Kaizen events occurring
concurrently at multiple organizations, many of which occurred on the west coast, it would not have been possible
for the researcher to personally administer the survey questionnaires during team report-out meetings – because
most organizations schedule report-out meetings for Fridays, this would have literally required the researcher to be
in two places at once. In addition, building the data collection procedures into the normal Kaizen event process in
the study organizations reduced the potential for bias from an external person attending the meetings – i.e., allowed
for more naturalistic data. All data collection tools were designed to be self-administered The Kaizen event
facilitators served as the data collection coordinators for their organizations, and were trained using standard
instructions for administering and collecting the questionnaires (see Appendix Q for some of the administration and
training tools used to train facilitators in the data collection process). The facilitators mailed completed Kickoff
Surveys, Report Out Surveys and Team Activities Logs back to the OSU-VT research team at the end of the event.
The Event Information Sheet was completed electronically. In addition, the OSU-VT research team created a secure
website to allow organizational contacts – e.g., Kaizen event facilitators – to upload supporting files – e.g., Kaizen
than 0.500, where all cross-loadings are less than 0.300 – are shown in bold. In general, the factor loadings support
the construct validity of the four survey scales; however, the factor loadings did result in the removal of some items
that did not load highly enough onto the intended scale or displayed high cross-loadings on other scales. Although
most items loaded highly on one scale only, some items displayed primary loadings less than 0.500 and/or cross-
loadings greater than 0.300.
All five Internal Processes (IP) items loaded highly onto a single factor (minimum observed loading = 0.591;
maximum observed cross loading was 0.201). Three out of five of the Management Support (MS) items loaded
together (minimum observed loading = 0.655; maximum observed cross-loading = 0.148). These three items –
1 Negative cross-loadings are due to the orientation of the axes from the factor rotation. They do not (necessarily) indicate that the question has a negative relationship to the construct of interest -- particularly in cases such as the GC scale where all the high loadings were negative.
69
MS2, MS3 and MS5 – relate to sufficiency of materials and supplies, equipment and help from others in the
organization. MS4, which is related to sufficiency of help from the facilitator, nearly loaded onto the Team
Autonomy (TA) factor (0.481), while MS1, which relates to sufficiency contact with senior management did not load
meaningfully onto a single factor. Instead, MS1 displayed high cross-loadings – i.e., greater than 0.300 – on both
MS and TA. This result is logical; however, MS1 should be excluded from further analysis because it does not load
clearly onto one scale.
Only two of the Action Orientation (AO) items loaded together (minimum observed loading = 0.733; maximum
observed cross-loading = 0.223). This result makes sense, because these two items (AO1 and AO2) were the most
similar in focus of the items in the AO scale: AO1 = “Our Kaizen event team spent as much time as possible in the
work area” and AO2 = “Our Kaizen event team spent very little time in our meeting room.” Of the remaining items,
AO4 (“Our Kaizen event team spent a lot of time discussing ideas before trying them out in the work area”) nearly
loaded onto the IP factor (0.423), which makes sense since this item relates to team processes – i.e., discussion.
However, due to the relatively low loading, AO4 will be excluded from further analysis. AO3 (“Our Kaizen event
team tried out changes to the work area right after we thought of them”) displayed a high loading on the TA factor
(0.763) but also displayed a high cross-loading on the AO factor (0.301). Again, this result makes sense, since this
item refers both to the act of making changes immediately versus waiting (AO) and the ability to do so (TA).
Finally, three of the Team Autonomy (TA) items loaded together (TA1, TA2 and TA3). The fourth TA item
(TA4) did not load highly enough to be included (0.479). In addition, as previously mentioned, AO3 had a high
loading on the TA scale (0.763), but also displayed a high cross-loading on the AO scale (0.301), as well as a
moderate cross-loading on the MS (0.235). Although the magnitude of the primary loading on TA was high, the
relatively high cross-loadings indicate that the item does not load cleanly onto a single scale – i.e., it displays
relatively strong links to two additional constructs. Thus, despite the high primary loading on the TA scale, a
conservative approach is taken and AO3 is excluded from further analysis. Finally, as mentioned, MS4 nearly
loaded onto the TA factor (0.481). The most logical explanation for the near loading of MS4, which relates to the
sufficiency of help from the facilitator, onto the TA factor appears to be that the facilitation process is tightly linked
to enabling team autonomy.
The revised survey scales, based on the factor analysis results, are presented in Table 12.
70
Table 12. Pattern Matrix for Factor Analysis of Report Out Survey Scales – Independent Variables Component
Extraction Method: Principal Component Analysis. Rotation Method: Oblimin with Kaiser Normalization.
Rotation converged in 13 iterations.
Table 13. Revised Report Out Survey Scales – Independent Variables Scale Revised Item List
Internal Processes • IP1: “Our team communicated openly.” • IP2: “Our team valued each member's unique contributions.” • IP3: “Our team respected each others' opinions.” • IP4: “Our team respected each others' feelings.” • IP5: “Our team valued the diversity in our team members.”
Action Orientation • AO1: “Our team spent as much time as possible in the work area.” • AO2: “Our team spent very little time in our meeting room.”
Management
Support
• MS2: “Our team had enough materials and supplies to get our work done.” • MS3: “Our team had enough equipment to get our work done.” • MS5: “Our team had enough help from others in our organization to get our work
done.” Team Autonomy • TA1: “Our team had a lot of freedom in determining what changes to make to this work
area.” • TA2: “Our team had a lot of freedom in determining how to improve this work area.” • TA3: “Our team was free to make changes to the work area as soon as we thought of
them.”
As mentioned, since the next highest eigenvalue not extracted for this factor analysis was relatively close to 1.0 (i.e.,
0.914), a five factor solution was examined as a follow-up to the initial, four factor solution. The results support the
robustness of the initial, four factor solution. The fifth factor that emerged was a trivial factor, consisting only of
71
AO4. The other items loaded as in the four factor solution, except for IP1, where the loading fell below 0.5 due to
cross-loading with the AO4 factor (both items relate to team discussion), and TA1, which displayed a cross-loading
of 0.301 on the MS factor. However, IP1 and TA1 were retained due to conceptual relationships to the rest of their
scale, high scale reliability and lack of support for the five factor solution versus the four factor solution – i.e., the
trivial fifth factor.
3.5.3 Factor Analysis of Report Out Survey Scales – Outcome Variables
Table 14 shows the loadings of the outcome variables measured in the Report Out Surveys – i.e., Overall
Perceived Success, KSAs and Impact on Area. Meaningful loadings – i.e., greater than 0.500, where all cross-
loadings are less than 0.300 – are shown in bold. In general, the construct validity of the survey scales was
supported, with the exception of the Understanding of CI and Skills scales, which were not found to be empirically
distinct. In addition, although most items loaded highly on one scale only, some individual items displayed primary
loadings less than 0.500 and/or cross-loadings greater than 0.300, and thus were excluded from further analyses.
Three out of four Impact on Area (IMA) items loaded together (minimum observed loading = 0.794; maximum
observed cross-loading = 0.213) – IMA1, IMA2 and IMA3. The fourth IMA item (IMA4) loaded onto a separate
factor. This result makes sense due to the linguistic construction of IMA4, which will be discussed shortly.
In addition, two items from the Attitude (AT) scale loaded highly onto one factor – AT4, AT2 (minimum
observed loading = 0.669; maximum observed cross-loading = 0.246), along with one item from the SK scale (SK4).
This supports team member attitudes (AT) as a unique dimension of event impact. However, although the Attitude
scale was originally designed as an overall measure of impact on two types of attitudes – affect for Kaizen events
and employee attitudes toward work – the factor analysis suggests that the two types of attitudes are distinct and
should be considered separately in the analyses. The two items loading highly onto the AT factor – AT2 and AT4 –
directly describe enjoyment of Kaizen event activities. In addition, SK4 similarly describes a variable directly
related to liking for Kaizen activities – the degree to which Kaizen event team members are comfortable working
with others to identify improvements. However, the other AT items (AT1 and AT3), which loaded onto a different
factor, describe the impact of the Kaizen event on participating employees’ general attitudes toward work – i.e., task
motivation.
Finally, the Knowledge of Continuous Improvement (UCI) and Skills (SK) items did not load onto separate
factor, but instead most of these items loaded onto a single factor, which appears to be measuring employee gains in
72
task-related – i.e., Kaizen process-related – KSAs (TKSA). While “knowledge” and “skills” are conceptually
distinct in the literature, it appears that in practice they are very highly related. Both refer more to “technical”
aspects of problem-solving capabilities, as distinct from affective attitudinal response toward Kaizen events. Thus,
it is not surprising that these items loaded together. The only exceptions were SK2 and SK4. SK4 loaded onto the
AT factor, as previously discussed. SK2 displayed high cross-loadings – i.e., greater than 0.400 – on both the TKSA
factor and the IMA factor. This result makes sense since this particular item seeks to ascertain the extent to which
team members have the ability to measure the impact of changes to the target work area – thus, this item addresses
both an ability and perceived technical impact (IMA). In addition, AT1 and AT3, which relate to employees’ work
– i.e., task – motivation also loaded onto the TKSA factor. Finally, IMA4 also loaded onto the TKSA factor. IMA4
says: “Overall, this Kaizen event helped people in this area work together to improve performance.” Thus, it
appears that this item may actually be measuring employee gains in the ability to work in problem-solving – i.e.,
Kaizen event – teams, as specific TKSA.
Interestingly, the overall perceived success item (OVER) did not load cleanly onto the “technical success”
measure IMA, but instead displayed a high cross-loading on the AT factor. This result makes sense and adds
support to the proposition that the overall success of a Kaizen event is dependent on both technical and social system
impact.
The revised survey scales, based on the factor analysis results, are presented in Table 15.
73
Table 14. Pattern Matrix for Factor Analysis of Report Out Survey Scales – Outcome Variables
Extraction Method: Principal Component Analysis. Rotation Method: Oblimin with Kaiser Normalization.
Rotation converged in 6 iterations.
Table 15. Revised Report Out Survey Scales – Outcome Variables Scale Revised Item List
Task KSA • UCI1: “Overall, this Kaizen event increased our team members' knowledge of what continuous improvement is.”
• UC2: “In general, this Kaizen event increased our team members' knowledge of how continuous improvement can be applied.”
• UCI3: “Overall, this Kaizen event increased our team members' knowledge of the need for continuous improvement.”
• UCI4: “In general, this Kaizen event increased our team members' knowledge of our role in continuous improvement.”
• SK1: “Most of our team members can communicate new ideas about improvements as a result of participation in this Kaizen event.”
• SK3: “Most of our team members gained new skills as a result of participation in this Kaizen event.”
• AT1: “In general, this Kaizen event motivated the members of our team to perform better.” • AT3: “Overall, this Kaizen event increased our team members' interest in our work.” • IMA4: “Overall, this Kaizen event helped people in this area work together to improve
performance.” Impact on
Area
• IMA1: “This Kaizen event had a positive effect on this work area.” • IMA2: “This work area improved measurably as a result of this Kaizen event.” • IMA3: “This Kaizen event has improved the performance of this work area.”
Attitude • AT2: “Most of our team members liked being part of this Kaizen event.” • AT4: “Most members of our team would like to be part of Kaizen events in the future.” • SK4: “In general, our Kaizen event team members are comfortable working with others to
identify improvements in this work area.”
74
3.6 Reliability of Revised Scales
Cronbach’s alpha was calculated to assess the reliability of the revised survey scales. Cronbach’s alpha is a
measure of internal consistency – i.e., the degree to which items in a given scale are correlated (Cronbach, 1951).
Only individuals who responded to all the items in a given scale were including in calculating Cronbach’s alpha for
that scale. Table 16 presents the resulting values. In addition to the calculation of Cronbach’s alpha, the researcher
also conducted analyses to determine the effects of deleting individual items on scale reliability. Although, in a few
cases, very slightly apparent improvement resulted, none of these changes were deemed large enough to justify
eliminating items. Except for the Action Orientation, all scales had values well above the suggested threshold of
0.700 (Nunnally, 1978). Seven of the 10 scales had values of 0.800 or greater and one scale had a value greater than
0.900. The Action Orientation scale was somewhat problematic since it contained only two items and had an alpha
value of 0.640. Although this is less than the desired threshold, some sources suggest that a slightly lower alpha
threshold – i.e., 0.600 – can be used for newly developed scales, such as the Action Orientation scale (DeVellis,
1991). Thus, the decision was made to retain Action Orientation in the present analysis, but to seek to develop
additional Action Orientation scale items for future research.
Table 16. Cronbach’s Alpha Values for Revised Survey Scales Scale Cronbach’s Alpha Largest Increase if Item Deleted
Goal Clarity .860 .871 (GC2)
Goal Difficulty .810 .790 (GDF4)
Affective Commitment to Change .859 .858 (ACC3)
Internal Processes .856 .846 (IP5)
Action Orientation .640 n/a
Management Support .802 .807 (MS5)
Team Autonomy .791 .732 (TA3)
Task KSA .929 .930 (SK3)
Impact on Area .866 .857 (IMA2)
Attitude .738 .721 (SK4)
Following the calculation of Cronbach’s alpha, scale averages for each individual in the data set were calculated
using the revised scales. In addition, at this point the decision was made to substitute the averages of the other items
in the scale for missing values in cases where individuals were missing only one item in a given scale. This allowed
the calculation of a scale value for that individual, with minimum risk to data integrity, given the high inter-item
75
correlation – i.e., Cronbach’s alpha values – between items in the scale. This within-person replacement approach –
also called a “person-mean” approach (Roth & Switzer, 1999) – has been demonstrated to be superior to other
approaches for replacing missing data in terms of minimizing bias while maintaining power (Roth et al., 1999).
However, it is important to note that, in general, most approaches to replacing item-level missing data – e.g.,
replacement with the item mean across all cases, regression from the other items in the scale, replacement with the
within-person mean of other items in the scale, etc. – seem to only introduce a small amount of bias, unless a large
percentage of the data is missing (Roth el al., 1999). Conversely, considerable power could be lost if pairwise or
listwise deletion were practiced in cases where only single-items within a scale are missing. In cases where
individuals skipped multiple questions in a given scale, the scale average was not calculated, since the risk to data
integrity was deemed too great. These individual-level scale averages were used for additional exploratory analyses
in preparation for hypothesis testing.
At this point, one additional team – Team 101 from Company E – was dropped from the analysis due to the fact
that there was only one scale average for each of the three Kickoff Survey scales. Only one individual fully
completed the Kickoff Survey while others skipped multiple questions. This problem was noted during initial
screening; however, this team was retained until the completion of the factor analysis and the calculation of
Cronbach’s alpha, because it was not absolutely clear earlier what final set of variables and questions would be
retained – i.e., the Kickoff Survey scales could have been significantly modified or even potentially removed if scale
reliability were very low.
3.7 Aggregation of Survey Data to Team-Level
Following the analysis of the construct validity of the survey scales, calculation of the reliability of the revised
scales, and the calculation of new individual-level scale averages, the next step in preparing the data for modeling
was analyzing whether the data could justifiably be aggregated to the team level. The intended unit of analysis in
this research is the team. However, since the data were collected on perceptual measures, it was necessary to collect
data at the individual-level – i.e., individuals within teams. Measures were designed to reflect group-level attributes,
thus the group was used as the referent in all survey questions. This is a called a “referred shift” composition model
(Chan, 1998). If the measures work as designed – i.e., are really measuring shared group properties – there should
be more variation across teams than within teams – i.e., the one-way ANOVA with team as a main effect should be
significant – and there should be a relatively high degree of consensus within the team, measured by analyzing the
76
extent of interrater agreement. If these criteria are met, this suggests that individual level data can be averaged such
that the group mean score reflects the group value for the variable of interest. If the variable of interest is truly
shared at a group level, the group mean will represent a more reliable measure than the individual values (Bliese,
2000).
Thus, in the current research, it was necessary to empirically demonstrate support for aggregation through
statistical analysis of the data collected. As described by Bliese (2000), measures used to evaluate support for
aggregation fall into two basic types: 1) measures that compare observed within-group variance to a theoretical
random variance – i.e., agreement indices; and 2) measures that compare observed within-group variance to
The most commonly used measure of within-group agreement is rwg – or more properly, rwg(j), where j is the
number of items in the scale (James et al., 1993, 1984) . However, the general term rwg is more commonly used and
will be used be used throughout this work to refer to the multi-item within-group agreement index for a given scale.
The rwg statistic has been widely used (Van Mierlo et al., 2006), including recent uses in team applications as the
sole justification for aggregation (e.g., see Passos and Caetano, 2003). The rwg statistic measures the consistency of
ratings within a group – i.e., team – by comparing the within-group variance (sx2) to a theoretical expected random
variance (σE2). Generally, the uniform distribution is used to estimate σE
2, since this reflects the expected response
distribution for an interval scale with absolutely no response bias (e.g., no social desirability effects, central
tendency, etc.). However, other distributions may be used for σE2 to account for the possibility of response bias
(James et al., 1984). Values for rwg range from zero to one, reflecting the extent to which sx2 differs from σE
2. The
maximum rwg value of 1.0 is achieved when sx2 is zero – i.e., there is perfect within-group agreement. The minimum
value occurs when sx2 equals or exceeds σE
2. James Demaree, and Wolf (1993) and (1984) prescribe that when sx2
exceeds σE2, rwg be set equal to zero for interpretation purposes.3 Thus, when the within-group variance (sx
2) is
much smaller than σE2 a relatively large rwg value occurs. Generally, 0.7 is used as a threshold value to justify
aggregation (George, 1990; Klein & Kozlowski, 2000; Van Mierlo et al., 2006). Although statistical tests of the
2 Reliability and non-independence indices use the same formulations – e.g.., ICC(1), ICC(2) – and thus measure the same attributes. However, the term “reliability” is often used when a dependent variable is being analyzed, while the term “non-independence” is often used when an independent variable is being analyzed (Bliese, 2000). Throughout the rest of this work, the term “reliability” is used to refer to these types of indices. 3 The actual rwg values in this case can be negative or, conversely, greater than one, if the observed variance is much greater than the theoretical variance such that there are negative terms in both the numerator and denominator of the rwg calculation – see Equation 3
77
significance of rwg can be performed, in the current research these tests would be subject to errors from the presumed
error structure of the data – i.e., teams within organizations.
One limitation of rwg as used in some studies is that, in many cases, the uniform distribution may not be the best
choice for the theoretical expected random distribution, due to phenomena such as central tendency in response or
social desirability effects, which may artificially restrict the range of responses, resulting in overly liberal values of
rwg. Thus, the values achieved for rwg using the uniform distribution provide a practical “upper bound” on rwg
(Bliese, 2000). In addition to calculating rwg using the uniform distribution, the researcher can estimate a more
conservative practical “lower bound” value for rwg by selecting a second theoretical expected distribution that
accounts for the likely type of response bias. For questions where a social desirability bias is likely, a skewed
distribution can be used to estimate rwg. For questions where a central tendency bias is likely, a triangular
distribution can be used to estimate rwg (James et al., 1984). Another conservative technique for estimating rwg is
random group resampling (RGR) (Bliese et al., 1994), an estimation technique based on bootstrapping, in which
within-group variance of actual groups is compared to the within-group variance of randomly formed pseudo-
groups. This technique was not used in the present research due to concerns about potential bias in the pseudo-
group variance estimates due to the nested structure of the data – i.e., teams within organizations. Finally, although
rwg can be useful as an index of within-group agreement, rwg does not demonstrate whether the variable of interest
varies across groups (Bliese, 2000). Although nothing conceptually requires group-level measures to vary across the
groups in the sample in order to be “group-level,” variables that demonstrate zero variance across groups are not
useful in analysis. This is why the calculation of reliability measures can be especially helpful in evaluating study
variables.
Another, relatively new, measure of interrater agreement is the average deviation index (AD) (Burke et al.,
1999; Burke & Dunlap, 2002; Dunlap et al., 2003). More precisely, AD measures the extent of disagreement among
raters – i.e., the average deviation from the mean response among a group of raters. Although AD has some
conceptual differences from rwg – specifically, AD is expressed in the same units as the underlying scale, while rwg is
unitless, ranging from 0 to 1 – AD has been found to be highly correlated with rwg ( r = -0.91) (Burke et al., 1999).
In addition, similar to rwg, the interpretation of AD is based on comparing the observed value of AD to the expected
value of AD under a uniform response distribution (Burke & Dunlap, 2002). However, AD is currently less flexible
than rwg in modeling other expected response distributions. No formulas or heuristic thresholds appear to have been
78
developed for comparing the observed AD to its expected value under other response distributions. Thus, in the
current research, rwg will be used instead of AD since they provide similar information and, in addition, rwg will
allow the substitution of additional expected response distributions for the uniform distribution in order to examine
the practical “lower bound” of interrater agreement.
One reliability measure used to evaluate support for aggregation is the intraclass correlation coefficient (1), or
ICC(1). ICC(1) is a measure of the amount of lower-level variance that can be explained by group membership
(Bliese, 2000). There are actually two ICC(1) measures in use in organizational research, both of which are,
confusingly, referred to only as ICC(1). The first, is the classic ICC(1) measure that has been historically used in
statistics and social sciences research, particularly in applied psychology (e.g., Bartko, 1976; Kenny & La Voie,
1985). This measure is calculated from the mean squares resulting from ANOVA and ranges from -1 to 1.4 In this
formulation, ICC(1) values are negative when within-group variance exceeds between group variance, such that
ICC(1) is really a measure of the difference between the between-group mean square and within-group mean square
from ANOVA. The second ICC(1) measure is calculated from the variance components resulting from an
unconditional – i.e., means only – random effects model5, and is commonly used in conjunction with hierarchical
linear modeling (HLM) (Raudenbush & Byrk, 2002). This ICC(1) is a more direct calculation of the proportion of
total level-specific variation – i.e., between-group variation plus within-group variation for the given level of
analysis (Raudenbush & Byrk, 2002) – that can be accounted for by group membership. This is similar to the
interpretation of the eta-squared measure in the one-way ANOVA, which will be discussed more presently.
Although both formulations essentially measure the same attribute, they use different scales. The variance
component formulation ranges from 0 to 1 only. In the variance components formulation, a value of zero is only
attained when there is no between group variance. The ICC(1) value will still be positive even when total within-
group variance exceeds between-group variance.
In both formulations, larger ICC(1) values indicate greater homogeneity within groups on the measure of
interest. Although there are no clear limits for when ICC(1) is large enough to justify aggregation (Schneider et al.,
1998), as a rule of thumb, values greater than 0.1 are often taken to indicate justification for aggregation (James, 4 The range is actually -1 to 1 for dyads and -1/(k-1) to 1 for groups larger than dyads, where k is the average group size (Kenny & Judd, 1986)
5 In the variance component formulation ICC(1) = 22
2
WB
B
σσσ+
where σB2 is the variance between groups and σw
2 is
the variance within groups. The mean square formulation of ICC(1) is shown as Equation 1.
79
1982; Schneider et al., 1998; Molleman, 2005). Although this rule of thumb is applied equally to both formulations,
it obviously reflects a more stringent test of association for the means squares formulation of ICC(1). An ICC(1) of
0.20 has been suggested as demonstrating a strong group-level association (Molleman, 2005), and again, this rule of
thumb is applied to both formulations, even though it reflects a different strength of association for each measure.
Another method used to justify aggregation is by testing the significance of ICC(1), which can be used to test either
formulation. In the mean square formulation of ICC(1), a statistically significant ANOVA with group as the main
effect indicates that ICC(1) is significant (Bliese, 2000; Klein and Kozlowski, 2000), providing justification for
aggregation. Testing the significance of ICC(1) is widely used in organizational research to justify aggregation
(e.g., Van Mierlo et al., 2006; Sarin and McDermott, 2003).
Another technique used to evaluate support for aggregation is within-and-between analysis I (WABA I)
(Dansereau et al., 1984). In addition to a statistical significance tests using ANOVA, a formal WABA I approach
also uses a “practical significance test,” which is based on the between group eta-squared value from one-way
ANOVA6. Similar to ICC(1), the eta-squared value used in the practical significance test is a measure of the
amount of lower-level variance that can be explained by group membership (Klein & Kozlowski, 2000). In fact,
when group sizes are large (i.e., larger than 25), eta-squared values are approximately equal to ICC(1) values
calculated using the variance component formulation. However, unlike ICC(1), eta-squared is affected by group
size, and when group sizes are small, eta-squared overestimates between-group variance, resulting in inflated (i.e.,
biased) eta-squared values (Bliese & Halverson, 1998). Although Bliese and Halverson (1998) show that eta-
squared values can be substantially biased for groups as large as 25, they are strongly upwardly biased for groups of
10 or less. Because all of the Kaizen events in this research had team sizes smaller than 25 and most were even
smaller than 10, a formal WABA approach using direct examination of eta-squared values and/or practical
significance tests was not used. 6 Specifically, the practical significance test is based on the expected ratio of the between-group eta-correlation, which is the square root of eta-squared, to the within-group eta-correlation (Dansereau et al., 1984) under different theoretical relationships – i.e., wholes, parts, equivocal, inexplicable/null (see Dansereau et al., 1984 for more details on each of these conditions). ηB
2= SSB/SSTO, while ηw2 = SSW/SSTO = SSE/SSTO. Thus, the eta-squared values
are interdependent in that they sum to 1.0, if only one main effect – group – is being examined at a time. Through both mathematical substitution and simulation, Bliese and Halverson (1998) demonstrate that the expected between-group eta-squared values under the conditions of a known amount of between group variance – i.e., a known group effect – differ as a function of average group size. Thus, the expected ratio of the between eta-correlation and within eta-correlation, given a certain type of relationship, also differs as function of group size, and the suggested practical significance “confidence intervals” (Dansereau et al., 1984) for determining what type of relationship exists are only useful for dyads (see Bliese & Halverson, 1998 for more details). In addition, as described more above, direct examination of ηB
2 can also be misleading due to this group size effect.
80
This research used both the classic, mean square formulation of ICC(1) and rwg as justification for aggregation.
The primary intent here is to analyze whether, as designed, the measures do appear to result in less variation within
versus across groups and can be aggregated for further analyses to test study hypotheses. Thus, it appears that the
mean square formulation is better for these purposes, because it more directly contrasts the between-group and
within-group mean squares. For each survey variable, the absolute magnitude of ICC(1) was calculated and the
significance tests from ANOVA was examined to evaluate the extent to which there appears to be greater variation
within versus across groups. As previously described, ICC(1) is essentially a measure of the proportion of
individual-level variation that can be explained by group membership. In essence, this amounts to a measure of the
extent to which individuals belonging to the same team are more similar to one another in their ratings than to
individuals in others teams (Kenny & La Voie, 1985). Typically, if there is only one level of nesting – e.g.,
individuals within teams – a one-way ANOVA with group as a main effect can be used both to calculate ICC(1) and
to test its significance. As Equation 1 shows, ICC(1) is calculated using the group effect mean square and error –
i.e., within group – mean square from ANOVA output. However, in the current research there are two levels of
nesting – individuals within groups and groups within organizations. Therefore, a traditional one-way ANOVA with
group as the main effect cannot be used, since this will result in inaccurate mean square estimates, if, as suspected,
there is correlation between groups within organizations (Kenny & Judd, 1986). To control for organizational-level
effects and to correctly partition the variance – i.e., correctly calculate mean squares – it was necessary to use a
nested ANOVA where both organization effects and group (organization) effects were included in the model (e.g.
DeCoster, 2002). Although the approach of using a nested ANOVA to calculate the mean square derivation of
ICC(1) does not appear to have been used much to date in team research, nested ANOVA has been used to examine
group effects in the presence of multiple levels of nesting in other fields, such as experimental psychology (e.g.,
DeCoster, 2002; Jeten et al., 2002), biology (e.g., Poulsen, 2002) and physical anthropology (see Smith, 1994 for an
overview of the approach and citations of other studies).
The model was executed using the SPSS “Mixed Models” procedure in SPSS 11.0. Table 17 presents the p
value for the nested ANOVA and the ICC(1) values as calculated using the ANOVA output in the formula from
Bartko (1976) (Equation 1), where k is the average group size and MSB and MSW are the outputs from the ANOVA
with group – i.e., team – nested within organization. For rigor, two approaches presented in the literature were used
for estimating k in the ICC(1) calculations. The first and simplest approach is to use the raw average group size –
81
i.e., N/J, where J is the number of teams (i.e., 51) and N is the total number of individuals. However, using this k
may slightly bias the results when group sizes are very unequal – i.e., the corrected k is very different from the raw
average group size. Although this did not appear to be the case in the current analysis, ICC(1) was also calculated
using the formula for a corrected k reported by Blalock (1972) and Haggard (1958) (see Equation 2), where is the Ni
number of individuals in each team. As can be seen, the ICC(1) values using the corrected k were slightly greater
than the original ICC(1) values, but only varied slightly from the original values – i.e., in the third or fourth decimal
place – since the corrected k was not very different from the raw average group size.
]*)1[()1(
MSWkMSBMSWMSBICC
−+−
= (1)
⎟⎟⎟⎟
⎠
⎞
⎜⎜⎜⎜
⎝
⎛
−−
= ∑∑
∑=
=
=J
iJ
ii
J
ii
i
N
NN
Jk
1
1
1
2
11
(2)
Table 17. Nested ANOVA p-values and ICC(1) Values for Survey Scales
Scale ANOVA p N k average k corrected ICC(1) using k average
ICC(1) using k corrected
Goal Clarity .0465 336 6.59 6.56 .060 .060
Goal Difficulty .0000 338 6.63 6.60 .216 .217
Affective Commitment to Change
.0000 338 6.63 6.60 .173 .174
Internal Processes .0000 276 5.41 5.39 .326 .327
Action Orientation .0000 276 5.41
5.39 .373 .374
Management Support .0030 276 5.41
5.39 .125 .126
Team Autonomy .0000 274 5.37
5.35 .185 .186
Task KSA .0000 274 5.37
5.35 .121 .121
Impact on Area .0000 268 5.25
5.23 .429 .430
Attitude .0000 276 5.41
5.35 .300 .303
As can be seen from Table 17, all 10 ANOVAs were significant, indicating that all ICC(1) values were
statistically significant. However, the ICC(1) for Goal Clarity was barely significant (p = 0.0465). Furthermore, if
a Bonferroni correction is used to adjust the alpha value for the number of tests (i.e., 10 tests, corrected alpha =
0.05/10 = 0.005 or even 0.10/10 = 0.01), the ICC(1) for Goal Clarity would not be considered significant, although
82
all other ICC(1) values would be considered significant. This indicates that the justification for aggregation for
Goal Clarity is weaker than for the other nine variables in terms of the ICC(1) values – i.e., the contrast of between-
group and within-group mean squares. In addition, except for Goal Clarity, all ICC(1) values were greater than the
recommended rule of thumb value of 0.1. In addition, five ICC(1) values were greater than 0.2, which is a rule of
thumb value indicating strong intraclass correlation. However, in addition to having a relatively high p-value, the
ICC(1) value for Goal Clarity was somewhat lower than 0.1 – i.e., 0.060.
In addition to calculating ICC(1), the rwg for each team was calculated for each survey scale. Two approaches
were used to calculate rwg, using the basic formula from James, Demaree and Wolf (1984) (Equation 3). First, the
uniform distribution was used for σE2 in order to estimate rwg for situations with no response bias. As mentioned,
this provides a practical “upper bound” on rwg. Next, to estimate a practical “lower bound” on rwg, a second
distribution was substituted for σE2 to reflect the likely direction of any response bias. For most of the survey
constructs, one might posit a moderate skew due to social desirability – i.e., more responses on the positive –
“agree” – side of the survey scale. This distribution is chosen based both on theoretical reasoning, as well as
empirical observation of the range of data collected – i.e., initial screening of the data revealed that respondents were
using the full six point scale for most questions, although the observed question distributions were negatively
skewed. However, for two scales, Goal Difficulty and Action Orientation, it seems like a central tendency bias may
be more likely, since there is no reason to suspect social desirability bias on these scales. Thus, a moderately
skewed distribution was used for Goal Clarity, Affective Commitment to Change, Internal Processes, Management
Support, Team Autonomy, Task KSA, Impact on Area, and Attitude, and a triangular distribution was used for Goal
Difficulty and Action Orientation.
)/()]/(1[
)]/(1[2222
22
ExjExj
Exjwg
ssJ
sJr
σσ
σ
+−
−= (3)
Where J = the number of items in scale and sxj2 = the average of the within-team variances for each of the J items in
the scale.
For the uniform distribution, σE2 = σEU
2 = (A2 – 1)/12, which is the expected variance of the uniform distribution
on a scale with A response intervals. Since all the scales in this research have six response intervals, σEU2 = 2.92.
83
For the moderately skewed distributions, the probability values for each interval (1 = 0.01, 2 = 0.09, 3 = 0.15, 4
= 0.25, 5 = 0.35, 6 = 0.15) were adapted from Kozlowksi and Hults (1987). These proportions are also similar to
those used in a recent investigation of interrater agreement measures (Burke et al., 1999). However, the weightings
assigned to the intervals were redistributed slightly from the original values, since it appears that Kozlowksi and
Hults (1987) overestimate the proportion of responses expected in the lowest interval of the six point scale.7 For
the skewed distributed, σE2 = E([X – E(X)]2 (James et al., 1984). E(X) can be calculated as: = 1(0.1) + . . .
Table 18 lists the average, maximum and minimum observed values for team rwg for each survey scale, as well
as the percentage of teams with values greater than 0.7 for the scale. In Table 18, rwg_u denotes the rwg values
calculated using the uniform distribution as the expected response distribution, which, as noted, may represent an
practical “upper bound” on rwg if there is cause to suspect response bias in the data. The second set of values rwg_c,
denote the values calculated using the theoretical expected null distribution that represents the hypothesized
direction of response bias, should it occur (see the discussion above). It should be noted here that in instances where
the observed variance exceeded the expected variance rwg was set to 0.0, as prescribed by James, Demaree and Wolf
(1993, 1984).
As can be seen from Table 18, for all survey scales, the majority of team rwg_u scores exceeded 0.7, which is the
commonly accepted threshold for demonstrating within group agreement (George, 1990; Klein & Kozlowski, 2000;
Van Mierlo et al., 2006) and the average rwg_u scores were also greater than 0.7. In addition, for eight out of the 10
survey scales, more than 90% of team rwg_u values also exceeded 0.7. The two remaining scales, Goal Difficulty and
Action Orientation, had 88% and 75% of team rwg_u values greater than 0.7, respectively.
The rwg_c scores are, as expected, noticeably lower than the rwg_u scores, but still, in general, support aggregation.
This suggests that the conclusion to aggregate based on interrater agreement is fairly robust. All survey scales
except for one had a majority of rwg_c scores greater than 0.70 (the other scale, Action Orientation, had 45% of team
7 The original proportions in Kozlowksi and Hults (1987) are as follows: 1= 0.1, 2 = 0.1, 3 = 0.1, 4 = 0.2, 5 = 0.3, 6 = 0.2. As Kozlowski and Hults (1987) note, an infinite number of theoretical skewed null distributions could be posited; however, except for the overweighting of the lowest two intervals, the distribution Kozlowski and Hults (1987) seems to match well what might be expected under a moderate social desirability bias.
84
values greater than 0.7). In addition, eight out of 10 survey scales had average rwg_c scores greater than 0.7.
However, two survey scales had average rwg_c scores somewhat less 0.7. One of the two scales, Goal Difficulty, had
a mean score of 0.65 and the other scale, Action Orientation, had a mean score of 0.6. These were the two survey
scales where a triangular distribution was used to calculate rwg_c, since there did not appear to be any reason to
suspect social desirability effects – i.e., a skewed distribution. In general it appears there is less reason to suspect
any response bias for these two scales than there is for suspecting bias – i.e., social desirability effects – in the other
scales, so rwg_c is likely a very conservative measure for these scales especially. It is also noted that Action
Orientation is a slightly lower reliability measure than the other scales (see Table 16), with a Cronbach’s alpha value
of 0.64, and also contained only two items. Both of these characteristics would tend to lower observed rwg values.
James, Demaree and Wolf (1984) describe how scales having a large number of items tend to have higher rwg values,
since rwg is based on the average within-team standard deviation across all survey items. As the number of scale
items increases, the influence of any particular item on the average standard deviation – and therefore rwg –
decreases.8 For scales with only a few items, fluctuations of team member responses by more than one response
interval on one of the questions could have a fairly large impact on the average standard deviation, resulting in a
noticeably lower rwg_c, particularly for small teams. In fact, rwg values are slightly attenuated in general for small
groups – i.e., less than 10 members – when there is less than perfect agreement (Kozlowski & Hattrup, 1992).
Table 18. Interrater Agreement Values for Survey Scales Scale Average
8 This is likely one reason that the two largest scales in the research – Internal Processes and Task KSA – had the largest average and minimum rwg values.
85
Overall, the high rwg values, combined with significant ICC(1) values, strengthen the argument for aggregation
for the survey scales. Although the average rwg_c values for Goal Difficulty and Action Orientation were somewhat
less than 0.70, both of these variables had significant and “large” ICC(1) values – i.e., greater than 0.2 – and average
rwg_u values greater than 0.7, indicating strong support for aggregation in terms of ICC(1) and rwg_u. In addition, as
noted the rwg_c values are intended to provide a practical “lower bound” on true agreement and are likely quite
conservative for these two measures in particular (see discussion above).
In the case of the Goal Clarity variable, the rwg values – both rwg_c and rwg_c – clearly support aggregation due to
the similarity of ratings between individuals within the same team – i.e., both the average rwg_u and the average rwg_c
are greater than 0.7. As previously described, the ICC(1) results for Goal Clarity are less supportive of aggregation.
The ICC(1) value for Goal Clarity was significant only before a Bonferroni correction and ICC(1) was slightly less
than 0.1, which is a recommended rule of thumb threshold justifying aggregation. Overall, these results indicate that
Goal Clarity does not appear to vary as much between versus within teams as other variables. As mentioned
previously, nothing theoretically requires a variable that is group-level – i.e., a true characteristics of the group,
rather than individuals in the group – to vary between the groups in a given sample. However, such variables would
not be useful in the analysis. Although the decision was made to aggregate Goal Clarity to the team-level based on
the high rwg scores and the relatively low p-value for ICC(1), one might posit that it is less likely to be a significant
predictor in the regression analyses (see Chapter 4), due to the more limited variation between groups.
Following the conclusion that team-level aggregation was justified for the survey scales, team-level averages
were calculated for each survey scale. At this time, in addition to examining the distribution of rwg scores for each
variable, each team was also examined to determine whether any teams displayed low rwg scores – i.e., less than 0.7
– on all or most variables, which might suggest the team be excluded from further analyses due to lack of within-
team consensus – i.e., reliable average measures. For this analysis, the more traditional rwg_u measure was used,
since rwg_c provides a conservative “lower bound” on agreement and it is desirable to avoid losing information by
spuriously removing teams, including information provided through additional variables not measured through the
survey scales. None of the teams displayed low agreement on more than half of the variables. Most teams had zero
or one variables with low rwg_u scores – i.e., less than 0.7. Three teams had two variables with rwg_u scores less than
0.7, one team had three variables with rwg_u scores less than 0.7, and one team had five variables with rwg_u scores
less than 0.7. The researcher considered excluding the team with low agreement on five variables – i.e., 50% of the
86
survey scales – from further analyses, since this was close to the cutoff criterion of more than half of the variables.
However, based on the high agreement on the other five survey variables and the fact that this research includes
several additional non-survey measures – thus the five affected survey variables were a minority of the total
variables studied – the decision was made to retain this team for further analyses. It must be recognized, however,
that for the five affected variables, the mean for this team is a less reliable representation of group-level opinion than
it is for most of the other teams in the study.
3.8 Screening of Aggregated Variables
The final step in the data screening analysis, before testing the study hypotheses, was to analyze the
distributions of the team-level variables, to determine whether the variables appeared to be normally distributed.
Although parametric analysis methods are relatively robust to violations of the assumption of normality (Neter et al.,
1996), variables that are strongly non-normal need to be transformed or analyzed using non-parametric methods.
This analysis included not only the aggregated survey variables – Goal Clarity, Goal Difficulty, Affective
Commitment to Change, Internal Processes, Action Orientation, Management Support, Team Autonomy, Task KSA,
Impact on Area, Attitude – but also the variables collected only at the team-level via the Event Information Sheet –
Team Leader Experience, Work Area Routineness, Event Planning Process, Overall Perceived Success, Team
Functional Heterogeneity, % of Goals Met, Tool Appropriateness and Tool Quality.
Most of the survey variables appeared to be relatively normally distributed, and for all but three – Goal
Difficulty, Action Orientation and Internal Processes – formal tests of normality were not rejected. Despite the
rejection of the formal normality test, Action Orientation also appeared to be fairly symmetrically distributed,
although negatively skewed (i.e., toward the lower end of the scale). Internal Processes appeared to be very
symmetrically distributed, but had one low outlier. Similarly, Goal Difficulty was also fairly symmetrically
distributed but skewed toward the low end of the survey scale with two low outliers. Thus, it appears that, in the
case of these three variables, the departures from normality are not extreme and parametric analysis methods can be
used. It should be noted, however, that the outliers on Goal Difficulty and Internal Processes may end up being
influential cases in the analyses.
Of the non-survey measures, Team Functional Heterogeneity was the only variable where formal tests of
normality were not rejected. Several other variables demonstrated only mild departures from normality. The
distribution of Overall Perceived Success was relatively symmetric, but negatively skewed (i.e., toward the low end
87
of the response scale) with three low outlier values. Work Area Routineness and Tool Appropriateness were
similarly negatively skewed. Tool Quality was negatively skewed and also appeared more noticeably truncated
than the other skewed distributions (i.e., a visual examination of the distribution suggests that, in an unconstrained
response situation, the high tail of the distribution would have carried on beyond the maximum response scale value
of 6.0). In general though, since departures from normality did not appear to be extreme, parametric analysis
methods were used for the hypothesis tests.
However, four of the non-survey variables -- % of Goals Met, Team Leader Experience, Team Kaizen
Experience and Event Planning Process – were more severely non-normal (i.e., severely skewed) and required
transformation. A logarithmic (base ten) transformation was used and resulted in much more symmetric
distribution, although in most cases, formal tests of normality were still rejected (Team Kaizen Experience was the
exception). For Event Planning Process and Team Kaizen Experience, the transformation resulted in a variable that
was fairly symmetrically distributed, although still somewhat positively skewed (i.e., toward high values),
particularly for Event Planning Process. However, for % of Goals Met and Team Leader Experience, the
distribution tightened but still remained highly skewed, since the mode for each of these variables was equal to the
maximum or minimum value of the response continuum. In the case of Team Leader Experience, which measures
the total number of Kaizen events the team leader has led or co-led, the mode was equal to the minimum response
value (i.e., 1 or zero in the transformed version). Similarly, % of Goals Met had a mode equal to the maximum
response value of 1.0 (i.e., 100%) in the untransformed scale and zero in the transformed scale. Since, for one team,
the original % of Goals Met value was 0%, a small value (i.e., 1%) was used to replace this value in the log
transformation, since the log of zero is undefined.
See Appendix S for a summary of the mean, median, maximum, minimum and standard deviation of the final
set of study variables.
88
CHAPTER 4: RESULTS
4.1 Overview of Models Used to Test Study Hypotheses
The modeling process used to test the study hypotheses was as follows:
1. To test H1, H3 and H4, regression analyses were performed using generalized estimating equations (GEE)
to account for (potentially) correlated residuals within organizations. The regression models were used to
calculate the correlation coefficient for each variable pair of interest and testing the correlation for
significance.
2. H2 was tested using ICC(1).
3. To test H5 – H8, regression analyses were performed using generalized estimating equations (GEE) to
account for (potentially) correlated residuals within organizations. The regression models were used to
determine which event input factors and event process factors had the most significant impact on each
outcome in the overall population.
4. To test H9 – H10, for each outcome variable, mediation models were analyzed for any significant event
process predictors. The purpose of the mediation analysis was to determine whether any event input
predictors exhibited relationships with both the event process predictor and the outcome variable that are
consistent with the mediation hypothesis – i.e., the hypothesis that the event input factor had an indirect
effect on the outcome variable through the process predictor.
The relationships between event input factors, event process factors and outcomes were analyzed using
regression modeling. As has already been mentioned, the current research includes two levels of nested data – i.e.,
lower-level units (teams) hierarchically nested within higher-level units (organizations). Thus, it is likely that lower-
level observations within the same higher-level unit – i.e., teams within a given organization – may be correlated
due to contextual factors.
In hierarchically nested data, within-group correlations – i.e., correlated residuals – can result in errors in the
estimation of the standard errors of regression parameters in ordinary least squares (OLS) regression modeling,
although the parameter estimates themselves remain asymptotically unbiased (Hox, 1994; Lawal, 2003). In
particular, within-group correlation can result in substantial underestimation of standard errors – and thus an
increase in Type I error for tests of regression parameters – if correlation within groups is strong and variation
89
between groups is large. Thus, as in other modeling situations involving correlated error terms, if the correlation
between groups is not taken into account, inference errors can result.
Hierarchical linear modeling (Raudenbush & Byrk, 2002), also referred to as “multilevel modeling,” “mixed
effects models,” and “random coefficient modeling” (Davison et al., 2002) is one appropriate analysis technique for
studies with nested data. Unlike OLS regression modeling, which assumes fixed intercepts and slopes across
groups, HLM allows researchers to decompose the residual variance into variance components due to variance in
intercepts across groups, variance in slopes across groups, and individual-level residual variance within-groups,
(Bliese & Hanges, 2004), thus accounting for group effects within the residuals – i.e., correlated error terms. These
variance components can then be tested for significance. Significant results indicate the need to include additional
group-level variables – a classification variable for group can be used to model differences in intercepts, whereas
additional group-level predictors will be necessary to account for differences in slopes. HLM allows researchers to
develop a series of equations with predictors at each additional, higher-level to test cross-level effects.
HLM relies on the ability to model random, as well as fixed effects, and can be executed in SPSS using the
“Mixed Models” procedure (see Peugh & Enders, 2005 for a tutorial on how HLM may be executed in SPSS), SAS
using PROC MIXED (see Singer, 1998 for a tutorial on how HLM may be executed in SAS) or a number of
specialty software packages (see Bliese & Hanges, 2004 for examples). However, HLM requires a fairly large
sample size both across and within groups (James & Williams, 2000). Like most modeling methodologies, there are
no absolute rules for the minimum sample size. Raudenbush and Byrk (2002) suggest roughly 10 observations per
predictor per level – i.e., for a model with one predictor, 10 groups and 10 individuals within each group would be
sufficient. However, for lower-level models – i.e., models with individual-level predictors only – the sample size
requirement depends the suspected intraclass correlation – slightly fewer higher level observations can needed for
testing lower level predictors if the intraclass correlation is expected to be small. Other sources have suggested 30
groups with 30 individuals each as a sufficient sample size for testing cross-level effects (Bassiri, 1998; Van der
Leeden & Busing, 1994). The group (organizational) sample size in the present research was not large – i.e., six
organizations – and the number of individuals (teams) studied within each organization varied from four to 15.
Thus, it appeared that the current sample size both across and within organizations would be insufficient to support
HLM. Indeed, test team-level (“level-1”) HLM models were executed in both SAS PROC MIXED and SPSS
90
“Mixed Models” and the maximum likelihood algorithm failed to converge, indicating that concerns about sample
size were well-founded.
Another approach that is commonly used to correct for correlation between observations is generalized
estimating equations (GEE) (Liang and Zeger, 1986). GEE is a robust estimation procedure specifically designed to
account for correlated error terms – i.e. non-independence between rows – in regression. GEE is used with
generalized linear models – i.e., regression models where the response variable can be specified as coming from any
distribution within the exponential family (Horton & Lipsitz, 1999). GEE calculates parameter and standard error
estimates based on the marginal distribution of the response variable by incorporating a correlation matrix to model
the association between observations – e.g. measurement times, individuals, teams – within a given higher-level
group or cluster – e.g., subjects, households, organizations. GEE uses an iterative generalized least squares
approach to update parameter estimates based on observed correlations between residuals until convergence is
achieved (Lawal, 2003). GEE generally results in very similar parameter estimates to OLS, since both estimation
methods are asymptotically unbiased – i.e., they both approach the same value. The major difference is generally in
the estimates of standard errors produced by the two methods. As mentioned above, the standard error estimates
using OLS are biased when there is correlation between residuals for observations within the same group (Hanley et
al., 2003). One difference from HLM is that GEE cannot accommodate differences in both slopes and intercepts
across organizations – i.e., it is a single-level analysis method rather than a multi-level analysis method (Hanley et
al., 2003). By incorporating the correlation between observations (teams) within a given cluster (organization), GEE
effectively models differences in intercepts across cluster. If an exchangeable correlation structure is assumed, GEE
is equivalent to a random effects model with a random intercept per cluster (Horton & Lipsitz, 1999). However,
these random intercepts are not reported in GEE output, although the observed intraclass correlation is.
The GEE procedure requires the user to specify a form for the working correlation matrix used to develop
estimates of parameter standard errors. GEE can be used to produce two sets of standard error estimates. One set of
standard error estimates is “model based” – i.e., based on the working correlation matrix in the final iteration of the
estimation. The second set of standard errors is “empirical” – i.e., based on a “robust” estimation procedure which
employs a “sandwich” estimator. (Note, the actual parameter estimates are identical for the two standard error
estimation procedures). If samples are relatively large – i.e. larger than twenty clusters – the “robust” or “empirical”
standard error estimates produced by GEE are robust to misspecification of the working correlation matrix (Chang,
91
2000), and different specifications produce similar standard error estimates. This is due to the “robust” or
“sandwich” variance estimator used to estimate the standard errors of regression parameters (Pan & Wall, 2002).
(Drum and McCullagh (1993) point out that this variance estimator is actually more consistent than “robust” in the
usual sense). However, in samples involving a relatively small number of clusters, the “empirical” estimates of
parameter standard errors are less stable (Breslow, 1990; Drum & McCullagh, 1993; Cologne et al., 1993; Pan &
Wall, 2002; Lawal, 2003; Hanley et al., 2003). In particular, the reported “empirical” standard errors may
underestimate the true variance of the parameters – i.e., result in Type I error (Pan & Wall, 2002). For small
samples at the cluster level, GEE standard error estimates can suffer from similar types of Type I error problems to
those created through unmodeled residual correlation – i.e., use of OLS in the presence of correlated residuals. The
inflated Type I error rate is somewhat problematic for the test of individual regression parameters using GEE
“empirical” standard errors. However, it is much more problematic for the Wald test often applied to test the overall
significance of the regression. For instance, a simulation study by Pan and Wall (2002) found that, for 10 groups
with 20 individuals each, Type I error rates were roughly twice the nominal alpha for tests of individual regression
parameters using the “empirical” standard error estimates (when applied to a logistic regression model with one
predictor); however, they were roughly five times the nominal alpha for the Wald test applied to simultaneously test
the significance of three predictors, again using the “empirical” standard error estimates. In general, for smaller
overall samples, Type I error rates are more problematic for smaller cluster-level samples of larger clusters than for
larger cluster-level samples of smaller clusters (Lawal, 2003).
Several approaches have been proposed to correct for inflated Type I error for the GEE “empirical” standard
error estimates in smaller samples, either through direct modification of the sandwich estimator or modification of
the significance test (e.g., Pan & Wall, 2002; Pan, 1999; Emrich & Piedmonte, 1992; Gunsolley et al., 1995).
However, these approaches are computationally difficult – i.e., they are not implemented in mainstream statistical
software and require direct manipulation of the sandwich estimator variance matrix, Vs – relatively new – i.e., do not
appear to have been extensively used in applied research, and have been developed within the framework of logistic
regression (although they appear equally applicable to other types of regression – see Breslow, 1990). Another
commonly proposed approach for dealing with Type I error is examination of the “model based” standard errors as
well as the “empirical,” or “robust,” standard errors. If the correlation structure – i.e., the working correlation
matrix – has been correctly specified, the model based standard errors should provide more accurate estimates of the
92
significance of the regression coefficients for small samples (Prentice, 1988). For instance, Lawal (2003) suggests
that, if the number of clusters is less than 25, the analyst should focus on correctly specifying the working
correlation matrix structure and report the “model based” standard errors, since the “empirical” standard errors do
not provide a good estimate (Lawal (2003) cites unpublished course materials by Lipsitz (1999)). Similarly, for
studies with fewer than 20 clusters, Horton & Lipsitz (1999) recommend using the “model based” standard errors
instead of the “empirical” standard errors. Finally, Drum and McCullagh (1993) recommend examining and
comparing results from both “model based” and “empirical” standard error estimates for small samples. It should be
noted here that “correct” specification of the correlation matrix does not require the analyst to numerically specify
the level of correlation between observations within a cluster – this is automatically and iteratively calculated
through the GEE procedure. What is required is that the analyst specify a reasonable overall structure for the pattern
of correlation within clusters – i.e., exchangeable/compound symmetry, unstructured, autoregressive, independence,
etc.
In the current model, compound symmetry – i.e., an exchangeable matrix – appears to be the most reasonable
assumption for the working correlation structure. Compound symmetry assumes that the correlation between all
observations (teams) within a given cluster (organization) are equal, and the same correlation structure is applied to
all clusters (Hardin & Hilbe, 2003). This structure is recommended for studies where there appears to be no natural
orderings of observations (Horton & Lipsitiz, 1999; Hardin & Hilbe, 2003). In the context of the current study, the
use of an exchangeable correlation matrix is equivalent to assuming that there will be some intraclass correlation
between observations (teams) within a given cluster (organization) due to contextual effects.
Other options for modeling the correlation structure included autoregressive (and similar time-based structures),
unstructured and independence. Autoregressive structures assume that observations that are closer together in time
have stronger correlations than observations that are further apart in time. In the current research, some argument
could be made for treating the correlation structure as time ordered, because each event is associated with specific
calendar dates. However, upon closer examination, time effects are not expected to be a particularly strong source
of correlation between observations. First, since the boundary criteria for selecting organizations specified that the
organizations had been conducting Kaizen events for at least one year prior to enrolling in the study, large
correlations between outcomes for adjacent observations due to an organizational learning curve are not expected.
Second, the time window between observations is generally so small that observations can be considered
93
functionally concurrent in terms of organizational climate and culture variables – i.e. contextual variables – which
only vary on a much greater time scale. In fact, in one organization, some of the events were actually concurrent,
occurring during the same week. In contrast, the effects of organizational climate and organizational culture
variables are expected to be relatively stable over the relatively short study window – i.e., six to nine months. Third,
the observations are not equally spaced across organizations, thus it seems unlikely that the same pattern of
correlation between adjacent observations would hold across organizations. Finally, it appears that greater than
average similarity between any two observations within a given cluster would be more likely to be due to similarity
of focus – i.e., event design – rather than time effects. Thus it does not appear that autoregressive or other time based
correlation structures would be appropriate.
“Independence” specifies a working correlation matrix in which all pairwise correlations are assumed to be
zero. Although this structure produces appropriate “empirical” standard error estimates when samples are large, it
seems inappropriate for calculating “model based” standard errors in this context, since it assumes no correlation
between observations. Finally, in an unstructured matrix the correlation between each pair of observations would be
estimated separately; however, the same correlation structure would be applied to all clusters (organizations). This
seems more likely to result in error that the compound symmetry assumption, since there is no reason to believe that
the same pattern of unique pairwise correlations holds across clusters (organizations), since the observations are not
equally spaced in time or otherwise equally ordered. In addition, an unstructured correlation matrix may be
problematic for unbalanced data, such as the current research (Hardin & Hilbe, 2003). Thus, as suggested in the
GEE literature, an exchangeable correlation matrix – i.e., assuming that all pairs of observations within a given
cluster are equally correlated – appears the most reasonable assumption for the current research, given the lack of
natural ordering of observation and the expected presence of contextual effects (i.e., intraclass correlation).
4.2 Analysis of H1 - H4
H1, H3 and H4 were tested by: 1) calculating the Pearson correlation coefficient for each variable pair of
interest and 2) testing the associated regression relationship for significance. GEE were used to account for the
nested structure of the data – i.e., teams within organizations. The correlation coefficient was calculated as the
square root of the coefficient of determination for the regression model where one of the two outcomes was
regressed on the other. Due to the nested structure of the data, the correlation coefficients was not tested for
significance directly – i.e., using a t-test – since the degrees of freedom for the test could not be assumed to be
94
correct. Instead, the regression coefficient GEEβ)
was tested for significance, which provides conceptually equivalent
results (Montgomery & Runger, 1999).9 Due to the fact that the correlation coefficients were calculated using GEE
instead of OLS, the correlation coefficients were sometimes slightly different for the regression of Y on X versus X
on Y – whereas in OLS the correlation coefficients are identical for both regressions. Thus, the minimum
correlation coefficient was used as the estimate of the correlation between X and Y. The maximum p-value from the
two regressions (Y on X and X on Y) was used for the significance test, because, under GEE, the significance of the
two regression coefficients can also differ. However, it should be noted that in no cases were the regression
coefficient p-values so different that they would have implied different results. Also, because GEE was used,
regression coefficient p-values do not directly coincide with the magnitudes of the correlation coefficient when
comparing across pairs. When comparing across pairs of variables, a smaller correlation coefficient for one pair
compared to another does not necessarily indicate a smaller p-value for the associated regression.
There are ten pairwise comparisons of interest:
• Social system outcome analysis (two variables, one comparison) -- Attitude (AT) and Task KSA (TKSA)
• Technical system outcome analysis (three variables, three comparisons) -- % of Goals Met and Overall
Perceived Success (OVER), % of Goals Met and Impact on Area (IMA), and OVER and IMA
• Social system and technical system outcome comparison (five variables, six comparisons) – AT with
IMA, AT with OVER, and AT with % of Goals Met; and TKSA with IMA, TKSA with OVER, and
TKSA with % of Goals Met.
Because the total number of pairwise comparisons to be made is large (10), a Bonferroni correction is used to
adjust the alpha value for the number of planned comparisons. Since the desired family confidence level is 0.05, an
alpha value of 0.05/10 = 0.005 is used in the hypothesis tests. Table 19 shows the pairwise correlations for these 10
relationships. The maximum p-values for the two regressions involving the pairwise relationship (Y on X and X on
Y) are shown in the second half of the table, below the correlations. Correlations with an asterisk are associated
with regressions that are significant at a 95% family confidence level. Appendix T displays the full results of the
analysis – i.e., the two regressions and two p-values for each pairwise relationship.
9 In fact, in OLS, testing the regression coefficient for significance provides directly equivalent results to testing the correlation for significance.
95
While H1, H3 and H4 were tested through correlation analysis, H2 (“Social system outcomes will occur
primarily at the team level, rather than individual level, indicated by significant intraclass correlation for social
system outcome variables”) was tested through an examination of ICC(1). Although demonstrating a significant
ICC(1) was important for all survey variables in terms of providing justification for aggregation to the team level,
demonstrating a significant ICC(1) is of additional theoretical importance for the social system outcomes – i.e., AT
and TKSA. As described in Chapter 3, learning theory suggests that group learning outcomes occur at the group
level rather than individual level – i.e., are shared group properties. Thus, demonstrating a significant ICC(1) was of
particular theoretical importance for the social system outcomes in order to demonstrate alignment with learning
theory. As indicated in Table 17, the ICC(1) values for AT and TKSA were both significant, even when a
Bonferroni correction is employed (p < 0.0001 for both values). Thus, H2 is supported. Table 20 shows the study
hypotheses, the null hypotheses and the test results. Results are discussed in detail in Chapter 5.
Table 19. Pairwise Correlations for Outcome Variables and Regression Significance Tests
Correlation AT
TKSA
OV
ER
IMA
% o
f Goa
ls M
et
AT 1 TKSA .710* 1 OVER .122 .155 1
IMA .632* .688* .224 1 % of Goals Met .000 .000 .163 -.019 1
Max. Sig. of GEEβ)
AT -TKSA .0000 -OVER .4068 .3326 -
IMA .0000 .0000 .1073 -% of Goals Met .9937 .3451 .2982 .5882 -
96
Table 20. Study Hypotheses and Test Results Hypothesis Comparisons (α = 0.005) Result
H1: Social system outcome variables will be significantly correlated at the team level. H0: Social system outcome variables are not significantly correlated at the team level.
• AT and TKSA, r = 0.710, p < 0.0001 Supported
H2: Social system outcomes will occur primarily at the team level, rather than individual level, indicated by significant intraclass correlation for social system outcome variables H0: The intraclass correlation for social system outcomes is not significant
• AT, ICC(1) = 0.300, p < 0.0001 • TKSA, ICC(1) = 0.121, p < 0.0001
Supported
H3: Technical system outcome variables will be significantly correlated at the team level. H0: Technical system outcome variables are not significantly correlated at the team level.
• IMA and OVER, n.s. • IMA and % of Goals Met, n.s. • OVER and % of Goals Met, n.s.
Not Supported
H4: Social system outcomes will be significantly correlated with technical system outcomes at the team level. H0: Social system outcomes are not significantly correlated with technical system outcomes at the team level.
• AT and IMA, r = 0.632, p < 0.0001 • TKSA and IMA, r = 0.689, p < 0.0001 • AT and OVER, n.s. • TKSA and OVER, n.s. • AT and % of Goals Met, n.s. • TKSA and % of Goals Met, n.s.
Partially Supported
4.3 Regression Analysis to Test H5 – H8
4.3.1 Screening Analysis Prior to Building Regression Models
The regression to be performed in this research is exploratory in the sense that it is not known which of the 14
measured independent variables are most strongly related to each of the five measured outcomes. Thus, for each
outcome variable, a selection procedure was used to iteratively narrow the set of independent variables to a set of the
most significant predictors. Prior to creating the regression models, the input data – i.e. response/dependent
variables and predictor/independent variables – were examined through a screening process to determine whether
there appear to be any extreme violations of basic assumptions of linear regression, which would impact the results
of the model building procedure. For instance, as described in Chapter 3, an exploratory analysis of the team-level
variables revealed that most of the outcome variables appeared relatively continuously distributed, although this was
less true of % of Goals Met and Overall Perceived Success than the other outcome variables. In the case of non-
continuous outcome variables, regression can still be performed but another response distribution must be used –
e.g., logistic regression. However, given the response variables are at least somewhat continuous, it is preferred to
first attempt to model the % of Goals Met variable as continuous, rather than to lose information by transforming the
variable into a binary or categorical form. Follow-up post-hoc analyses could then be used to examine a binary or
97
categorical version of this variable to determine whether the inferences differ from the model performed using
normal (Gaussian) regression.
In addition to examining the outcome variables, the degree of correlation between the independent (predictor)
variables was examined to determine whether multicollinearity was likely to be a problem in the present research. It
is commonly recognized that multicollinearity – i.e., a high degree of correlation between one or more predictor
variables – can create a number of problems in regression, including instability of the regression solution (i.e., non-
uniqueness of the solution and parameter estimates) and inflated standard error estimates for regression parameters
(Neter et al., 1996).
In OLS, the variance inflation factor (VIF) is interpreted as the extent to which the variance of the regression
parameter for the kth predictor is inflated when the other p – 2 variables10 are in included in the regression (Neter et
al., 1996). In GEE, it is not clear that this interpretation strictly applies, due to different methods of estimating the
standard errors of the parameters, and the GEE estimation procedure in SAS PROC GENMOD does not include an
option for generating VIF. However, the VIF still appears to be an appropriate measure of the extent to which a
given predictor covaries with all the other predictors in the model – i.e., the extent to which the variance of the given
predictor can be predicted by the other predictors – and thus a useful tool for diagnosing multicollinearity. This is
based on the fact that the actual parameter estimates attained through OLS and GEE regression are very similar,
because. both are asymptotically unbiased. Thus, the residuals produced by both models are also very similar. The
VIF is calculated using Equation 4 (Neter et al., 1996), where Rk is the R value that results when a given predictor is
regressed on the other n - p predictor variables:
kk R
VIF−
=1
1 (4)
As Equation 5 shows, R is derived from the residuals –∑ − )ˆ( ii YY – as well as the deviation around the grand
mean -- ∑ − 2)( YYi -- both of which would be similar under OLS and GEE estimation.
∑∑
−
−−=−=== 2
2
2
)(
)ˆ(11
YY
YY
SSTOSSE
SSTOSSRRR
i
ii (5)
10 Note, p represents the total number of parameters being estimated in the model and one of the parameters being estimated is the intercept.
98
Likely due to similar reasoning, other studies using GEE have also examined VIF as an aid for diagnosing
As expected, the regression coefficients are very similar for the GEE estimation versus the OLS estimation,
since both are asymptotically unbiased. In addition, the standard error estimates were quite similar, which is
expected given the fact that the observed intraclass correlation reported by the GEE procedure was only -0.019,
indicating that the correlation within clusters (organizations), given the final set of predictors, was not large. In fact,
105
the fact that the intraclass correlation is actually negative in the final model suggests that more variation occurs
between clusters (organizations) versus within clusters. However, it should also be noted that the intraclass
correlation may not be significantly different from zero. Thus, the GEE model would be expected to give similar
results to a model built under an independence assumption (i.e., OLS). The GEE “empirical” standard error
estimates were, in general, smaller than the “model based” standard error estimates. These results were expected,
since, as previously discussed, the GEE literature indicated that “empirical” standard error estimates might be
downwardly biased due to the small sample size at the organizational level. The only exception was for the standard
error estimates for the Team Functional Heterogeneity coefficient, which was slightly larger for the “empirical”
estimate versus the “model based” estimate. It is important to note that all the regression coefficients in Table 22
would be considered statistically significant at the 0.10/4 = 0.025 level for all models, except for Team Functional
Heterogeneity under the “empirical” standard estimation. Using the “empirical” standard error estimates, 0.025 < p
< 0.05 for the regression coefficient of Team Functional Heterogeneity. The implications of this solution are further
discussed in Chapter 5.
As an analysis of model robustness, additional “good” subsets of predictors from the RSQUARE, ADJRSQ, CP
and/or MAXR results were examined to help evaluate the robustness of the current solution. The underlying logic
applied was as follows. Because the objective of the research was to identify variables with a significant
relationship to outcomes, smaller – i.e., two or one variable – solutions were generally not considered as a
replacement for the model identified through the backward selection procedure. However, some of the most
promising larger – i.e., four or five variable – solutions were examined to determine whether all predictor variables
were significant using GEE “model based” standard error estimates for any of these solutions. Particular attention
was paid to solutions which contained the original solution found, but included one or two additional variables.
No larger solution where all predictors had p-value less than 0.05 were found.11 However, one four factor
solution nearly consisted of predictors that all had p-value less than 0.05. In the regression consisting of Team
Functional Heterogeneity, Management Support, Action Orientation and Internal Processes, the p-values for all
variables except for Action Orientation were less than or equal to 0.025. The p-value for Action Orientation was
slightly greater than 0.07. This was the second best four variable solution using the RSQUARE and CP selection
procedures. In addition, in both hierarchical selection procedures, Action Orientation represented the last variable 11 Given the 14 predictor variables, an exhaustive search of all possible solutions was infeasible. Thus, there is always some chance that a “better” solution has been missed.
106
removed in the final stages of model refinement. In the first hierarchical procedure, Action Orientation could not be
added to the specified model – Team Functional Heterogeneity, Management Support, and Internal Processes –
because the p-value exceeded the established threshold of 0.10/p (p = 0.07). In the second hierarchical procedure,
Action Orientation was removed from the model in the final stage of model refinement (again, due to p = 0.07),
leaving Function Heterogeneity, Management Support and Internal Processes as the final set of predictors in the
model. Finally, Team Functional Heterogeneity, Management Support, Action Orientation and Internal Processes
was also the solution in the next to last step in the manual backward selection procedure using the GEE “model
based” standard error estimates – i.e., Action Orientation was removed to yield the final solution – and represents a
merging of the solutions from the “model based” and “empirical” standard error estimate selection procedures.
Thus, it appears that there is some, albeit relatively weak, evidence that Action Orientation also has a small, positive
effect on Attitude ( GEEβ)
= 0.088). However, due to the fact that the p-value for Action Orientation was greater than
0.05, this alternate solution was not ultimately adopted.
Following the selection of the final subset of model variables – Team Functional Heterogeneity, Management
Support and Internal Processes – additional aspects of the model fit were examined to determine whether there
appeared to be any serious errors of model specification. First, the residuals from both the GEE and OLS models
were plotted against predicted values, and partial regression plots were also created. Similarly to OLS regression,
residual analysis is recommended for regression models using GEE to detect effects such as nonlinearity, omitted
variables, etc. (Chang, 2000; Hardin & Hilbe, 2003). None of the plots suggested any significant problems, such as
departures from linearity, etc. In addition to the residual plots, an initial analysis of the residual distribution was
conducted to determine whether the observed pattern of residuals appeared to be random. Chang (2000) suggests
that, when GEE is used, in addition to the examination of residual plots, a non-parametric Wald-Wolfowitz run test
should also be employed to determine whether there any patterns of systematic departure – i.e., bias – in the
residuals. In an unbiased model, after GEE has been employed to account for the correlation structure, a random
pattern of negative and positive residuals should be observed. There should not be many (long) series of
consecutive positive or negative residuals. The Wald-Wolfowitz test calculates to what extent the number of series
of positive versus negative residuals appears to depart from a random distribution – i.e., a significant result suggests
a non-random pattern. The Wald-Wolfowitz test is specifically recommended for longitudinal, within-subject data
to help determine whether the specification of the correlation structure is reasonable but also appears to be
107
applicable to non time-dependent clustered data – e.g., teams within organizations. To conduct the run test,
observations are ordered by organization – i.e., the same order that they were originally entered into SAS to create
the GEE models. The Wald-Wolfowitz test was used on both the GEE-based and OLS-based residuals. The
distribution of the OLS residuals was also examined using the cumulative normal probability plot generating using
the SPSS “Linear Regression” procedure. Neither of the sets of residuals appears to depart significantly from
normality (for both, p = 0.20).
Residuals were also analyzed to determine whether there were any influential cases – i.e., outliers. All
standardized residuals were less than 3.0, indicating that there was no strong evidence of influential cases. In fact,
all but three of the standardized residuals were less than 2.0. The standardized residual with the largest absolute
value was –2.58. Other measures of influence were examined. For the OLS models, Cook’s distance was
examined. Cook’s distance is a measure of the amount of influence a particular case exerts on the regression
parameters (Neter et al., 1996) and can be evaluated through the F statistic with p and n-p numerator and
denominator degrees of freedom, respectively. None of the Cook’s distance values were significant (p < 0.05) or
nearly significant (p < 0.10) for the final regression model, and the maximum Cook’s distance was only 0.191 (p =
0.942).
Finally, the three-way and two-way interactions of the variables in the final mode were tested to determine
whether there was evidence of significant interactions of these terms. None of the interaction terms were significant.
4.3.4 Model of Task KSA
In general, fitting the regression model of Task KSA was more complex than for the other two survey outcome
measures – i.e., Attitude and Impact on Area. This could be due to the fact that Task KSA is a “large” variable
measured by 10 different items and therefore many different event input and event process variables may be
somewhat related to Task KSA, particularly when levels of other variables are held constant – i.e., suppressor effects
(Field, 2005). However, there were some similarities between the solutions produced through each selection
procedure. The manual backward selection procedure using GEE “model based” standard error estimates and the
two hierarchical search procedures resulted in the following solution: Team Autonomy and Internal Processes. This
was the second best two variable solution using RSQUARE. The manual backward selection procedure GEE
“empirical” standard errors produced the following solution: Goal Difficulty, Team Kaizen Experience, Work Area
Routineness, Affective Commitment to Change and Internal Processes. These variables were all significant at the
108
0.10/6 = 0.0167 level using the GEE “model based” standard error estimates, except for Goal Difficulty, which had a
p-value of 0.0236. Thus, both of the models produced through backward selection procedure applied to the GEE
estimates contained Internal Processes. The automated backward selection procedure using OLS produced the
following solution: Goal Difficulty, Team Autonomy, Team Functional Heterogeneity, Team Leader Experience,
Internal Processes, Tool Appropriateness and Tool Quality. This was the fifth best seven variable solution using the
SAS RSQUARE selection procedure, the best seven variable using the MAXR selection procedure, and had the
lowest Cp overall. However, using GEE “model based” standard error estimates, Tool Appropriateness had a p-value
greater than 0.10 – i.e., much greater than 0.10/p. The automated stepwise selection procedure using OLS estimates
produced the following solutions: Team Autonomy, Team Kaizen Experience, Team Leader Experience and Internal
Processes. This was the best four variable solution using the SAS RSQUARE selection procedure and the MAXR
selection procedure. However, Team Kaizen Experience had a p-value greater than 0.2 – i.e., much greater than
0.10/p – using GEE “model based” standard error estimates.
It should be noted that all of the models produced contain Internal Processes and three out of four contain Team
Autonomy and/or Goal Difficulty. In addition, two models contain Team Leader Experience, Team Kaizen
Experience, and/or Tool Quality. Due to the non-significant parameters using GEE “model based” standard error
estimates for the two solutions produced through the OLS automated search procedures, the two competing
solutions retained were those produced through the manual backward selection procedures. However, additional
“good” subsets that were identified through the examination of the RSQUARE, ADJRSQ, CP and MAXR criteria
were also as examined, as described more presently. The two initial competing solutions are show in Tables 23 and
24.
Table 23. Initial Regression Model for Task KSA (based on SEMB GEEβ)
As can be seen from Tables 29 through 32, there is some similarity to the solution that modeled % of Goals Met
as a continuous variable. Again, Team Kaizen Experience and Event Planning Process (hours planning) are
significant predictors, and the direction of the signs are the same. In addition, the logistic regression models
identified three additional predictors that differentiate more (100%) versus less (less than 100%) successful events:
Goal Difficulty, Team Leader Experience and Action Orientation. Since, in the five variable solution – i.e., Goal
Difficulty, Team Kaizen Experience, Team Leader Experience, Event Planning Process and Action Orientation – all
116
variables were significant at the 0.05 level and all but two variables were significant at the 0.10/p = 0.10/5 = 0.02
level, the five variable solution appears to be slightly preferred over the three variable solution. It should be noted
that this five variable solution is also quite similar to the solution implied through the “empirical” standard error
estimates in the Gaussian regression. The interpretation of these results is discussed in Chapter 5.
As always, the final model was further tested for “goodness-of-fit” through residual analysis. There was no
significant evidence of departures from randomness in the residuals – i.e., runs. It addition, the predicted versus
observed classifications of cases was observed. In SPSS model without the GEE correction, using a cutoff
probability of 0.5 (the default in SPSS), nine total cases were misclassified. Four events that met 100% of their goals
(i.e., had a goal achievement value of 1) were incorrectly classified as 0’s. Five events that met less than 100% of
their goals (i.e., had a goal achievement value of 0) were incorrectly classified as 1’s. However, when a plot of the
observed groups and predicted probabilities was examined, it was noted that all four of the 1’s that had been
misclassified had a predicted probability very close to the cutoff probability – i.e., greater than 0.45. Thus, shifting
the cutoff value slightly downward would have resulted in no misclassification for events with a goal achievement
score of 1. In addition, this shift would not have caused any additional events with a goal achievement score of 0 to
be misclassified. The five events with a goal achievement score of 0 that were misclassified as 1’s all had actual %
of Goals Met values greater than 50%. However, one of the events had a % of Goals Met value that was only
slightly greater than 50% (51.1%). The other four events had a % of Goals Met value greater than 75% (the
minimum value was 77.6%). A similar breaking point was observed using the GEE regression results – by lowering
the cutoff probability somewhat, some of the misclassified 1’s would have been correctly classified, without
resulting in additional errors in the classification of zeros. However, one event with a goal achievement value of 1
would have remained misclassified using GEE model results – i.e., the cutoff probability could not be lowered far
enough to include this event in group 1 without introducing classification errors in group 0. Thus, overall it seems
that the model is fairly successful at predicting group membership for events that achieved 100% of their goals, but
less successful at predicting group membership for events that did not achieve 100% of their goals. However,
roughly two thirds of these events – 11 out of 16 using SPSS results and 10 out of 16 using GEE results – were still
correctly classified.
Only two residuals out of 51 were more than two standard deviations from zero. One of these residuals was
only slightly greater than 2.0 (2.11). However, the second residual was greater than 5.0 (5.58). These were two
117
different cases than the outliers for the continuous distribution – i.e., Gaussian -- model. Although this case was
classified as a 0 due to failure to meet 100% of the event goals, this team met 95% of the goals. This was highest
level of % of Goals Met for all events that were less than 100% successful. Thus, it makes sense that this event may
actually be more similar – i.e., share more common characteristics – with more versus less successful characteristics,
and therefore have been misclassified as a 1. None of the Cook’s distance values were significant (p < 0.05) or
nearly significant (p < 0.10).
4.3.8 Summary of Final Regression Models
Table 33 summarizes the significant direct predictors for each outcome variable.
118
Table 33. Significant Direct Predictors of Outcome Variables Outcome Variable Significant Predictors (p-values)
Attitude • Team Functional Heterogeneity (0.012)
• Management Support (0.013)
• Internal Processes (0.000)
Task KSA • Goal Difficulty (0.032)
• Team Autonomy (0.014)
• Team Kaizen Experience (0.000)
• Team Leader Experience (0.020)
• Work Area Routineness (0.002)
• Affective Commitment to Change (0.049)
• Internal Processes (0.000)
Impact on Area • Team Autonomy (0.022)
• Management Support (0.046)
• Action Orientation (0.000)
Overall Perceived Success • Tool Quality (0.004)
% of Goals Met • Goal Difficulty (n.s. cont., dicht.)
• Total Kaizen Experience (.000 cont., .000 dicht.)
• Team Leader Experience (n.s. cont., dicht.)
• Event Planning Process (.047 cont., dicht.)
• Action Orientation (n.s. cont., dicht.)
As a final check, the VIF were examined for the final models from the exploratory regression (see Table 33),
even though the initial analysis of VIF had indicated that multicollinearity was not severe. This was done to verify
that the final set of predictor variables in each model were not strongly related, while the initial VIF analysis
considered relations between all fourteen potential predictor variables. Table 34 presents the VIF for the final
models. In all the models, the maximum observed VIF was 1.75 and the average VIF was less than 1.5 – i.e., fairly
close to 1.00 and substantially less than 3.0.
119
Table 34. VIF Values for Final Regression Models Outcome Predictor VIFOLS VIFGEE
Attitude Team Functional Heterogeneity 1.02 1.01 Management Support 1.19 1.19 Internal Processes 1.18 1.17 Average VIF 1.13 1.13 Max VIF 1.19 1.19 Task KSA Goal Difficulty 1.16 1.13 Team Autonomy 1.47 1.42 Team Kaizen Experience 1.28 1.11 Team Leader Experience 1.22 1.19 Work Area Routineness 1.17 1.11 Affective Commitment to Change 1.74 1.69 Internal Processes 1.72 1.69 Average VIF 1.34 1.33 Max VIF 1.74 1.69 Impact on Area Team Autonomy 1.66 1.62 Management Support 1.48 1.42 Action Orientation 1.17 1.11 Average VIF 1.43 1.38 Max VIF 1.66 1.62 Overall Perceived Success Tool Quality 1.00 1.00 Average VIF 1.00 1.00 Max VIF 1.00 1.00 % of Goals Met Goal Difficulty 1.31 1.29 Total Kaizen Experience 1.26 1.12 Team Leader Experience 1.40 1.35 Event Planning Process 1.30 1.29 Action Orientation 1.24 1.20 Average VIF 1.30 1.25 Max VIF 1.40 1.35
4.4 Mediation Analysis to Test H9 & H10
Mediation occurs when one variable acts indirectly upon a second variable through a third, mediating variable
(Baron & Kenny, 1986; Kenny, 2006). The mediation effect can be partial – i.e., the first variable has a significant
indirect effect on the second variable, as well as a significant direct effect – or full – i.e., the first variable only has a
significant effect through the third variable.
Mediation analysis is based upon a hypothesized causal model – i.e., a hypothesized set of causal relationships
between several variables: an input variable, an intervening or process variable, and an outcome (MacKinnon et al.,
2000; Kenny, 2006). Thus, mediation analysis results are only valid if the direction of causality specified in the
hypothesized causal model is correct. In observation studies, such as this one, it is generally impossible to
completely rule out the possibility that the causal relationship is actually the reverse of that specified or non-existent
120
– i.e., that both outcomes and predictors are correlated with the true, unknown causes of the outcomes but that the
predictor does not determine the level of the cause. (See the extended discussion of causality in observational –
particularly cross-sectional – studies in Chapter 5).
However, mediation analysis is useful for testing theory, since, if a hypothesized mediation relationship is not
demonstrated, this lends support to the conclusion that the hypothesized model is not correct (MacKinnon et al.,
2000). If the hypothesized mediation relationship is demonstrated, this indicates that the proposed causal model
could be correct and warrants further investigation – preferably through additional research designs involving
experimental control. See MacKinnon, Krull and Lockwood (2000) for further discussion of the benefits of
following up initial cross-sectional mediation analyses with replications, preferably involving experimental control.
Mediation is often explained using the two equations (e.g., see Alwin & Hauser, 1975, and Kenny, 2006 for
more descriptions of mediation). Equation 6 depicts a direct, unmediated relationship between X and Y, where c is
the strength of the path. Equation 7 depicts a situation where Z at least partially mediates the relationship between X
and Y, through paths a and b. X may also still have a direct effect on Y, if there exists an additional path c’ (not
shown in Equation 7below) which is significant after controlling for the effect of Z.
YXc→ (6)
YZXba→→ (7)
In the current research, event process factors – i.e., Affective Commitment to Change, Action Orientation,
Internal Processes, Tool Appropriateness and Tool Quality – are hypothesized to serve as at least partial mediators
between event input factors and event outcomes factors. This is expressed in H9 and H10 (see also Figure 1):
• H9: Event process factors will partially mediate the relationship of event input factors and social
system outcomes.
• H10: Event process factors will partially mediate the relationship of event input factors and technical
system outcomes.
Judd and Kenny (1981) and Baron and Kenny (1986) present a four step method of analyzing mediation
relationships that includes the testing of all four paths – a, b, c and c.’ However, Kenny (2006) and Kenny, Kashy,
and Bolger (1998) indicate that there is a more parsimonious method of testing for a mediation effect. Only paths a
and b must be tested to demonstrate mediation. The steps for testing these paths are as follows:
121
1. Regress the mediator variable (Z) on the initial variable (X). This tests whether there is a significant
relationship between X and Z – i.e., whether path a in Equation 7 is significant. In this research, this test is
accomplished by performing simple linear regression using GEE.
2. Next, regress both Z and X on Y. This will indicate whether Z has a significant effect on Y while
controlling for X – i.e.,, whether path b in Equation 7 is significant. In this research, this test is
accomplished by performing multiple linear regression using GEE. If both path a and path b are
significant, the indirect effect of X on Y can then be calculated as a * b (MacKinnon et al., 1995).
3. Optional: Path c’ can also be tested using the output of step 2. If path c’ is significant and paths a and b
are significant this is consistent with a partial mediation hypothesis. If path c’ is not significant and paths a
and b are significant, this is consistent with a full mediation hypothesis.
Although mediation analysis was first performed using OLS regression, it can be performed with other types of
regression analysis, such as logistic regression, structural equations modeling and multilevel modeling – i.e., HLM
or “mixed models” (Kenny, 2006). Although it is not clear whether anyone to date has performed mediation
analysis using GEE, there appears to be no theoretical reason why mediation analysis cannot be performed using
GEE estimates versus OLS or logistic regression estimates, since both are asymptotically unbiased estimates of the
same unknown variables.
As described above, one way to demonstrate significance of the overall hypothesized mediation effect is to
demonstrate the significance of each path being tested – i.e., path a and path b. However, to preserve the overall
Type I error protection of the test, the alpha level must be adjusted for the number of simultaneous tests – i.e., the
number of parameters being tested to test each hypothesized mediation relationship. If the desire is only to test
whether the mediation hypothesis holds, and not to differentiate between a full and partial mediation hypothesis –
i.e., to estimate only path a and path b – a 0.05/2 = 0.025 significance threshold for individual tests will preserve a
0.05 family confidence level. If the intent is to also test whether the hypothesized mediation effect is consistent with
a partial or full hypothesis -- i.e., to estimate path c’ – a 0.05/3 = 0.0167 confidence level is necessary to preserve a
0.05 family confidence level. Since in the current research it is of interest to test whether the mediation is partial or
full, an alpha value of 0.0167 will be used.
In addition to the separate tests of regression parameters, Sobel (1982) proposed a combined test which is
widely used. However, the Sobel test requires that the standard errors of paths a and b are independent, and this
122
assumption appears questionable in the current research due to the hypothesized correlated error structure and the
fact that a common working correlation matrix is used in estimating the regression parameters. Thus, the approach
of separately testing each path with a correction for overall family confidence is used.
In the current research, there are five event process variables – i.e., Affective Commitment to Change, Action
Orientation, Internal Processes, Tool Appropriateness and Tool Quality – and nine event input factors. However,
for each outcome measure, only the event process variables shown to have a significant relationship to the outcome
will be tested for mediation effects. The next five sections describe the tests of mediation effects of the five
outcomes variables. Following each mediation analysis, for any significant mediation effects, the sign, but not the
significance, of the regression coefficient when the relevant outcome variable was regressed on the input variable
only was examined in order to check for suppressor effects. A suppressor effect occurs when the directionality of
the input variable’s relationship to the outcome measure is different for the direct effect versus the mediated, indirect
effect (MacKinnon et al., 2000).
4.4.1 Mediation Analysis for Attitude
As Table 33 demonstrates, there was only one event process factor that was a significant predictor for Attitude –
Internal Processes. Thus, in the first step of the mediation analysis, Internal Processes is separately regressed on all
nine event input factors to determine which event input factors have a significant relationship to Internal Processes.
The results of these separate regressions are shown in Table 35. Note, parameter estimates and standard error
estimates are only shown for significant regressions. The standard error estimates are the GEE “model based”
standard estimates and, as in the regression models used to test the other study hypotheses, an exchangeable
correlation matrix, Gaussian distribution and identity link function are used.
123
Table 35. Internal Processes on Input Variable (X) Regressions (path a) Input Variable (X) Coefficient (a) Std. Error p-value
Goal Clarity .5706 .0714 .0000 Goal Difficulty .7342 Team Autonomy .4076 .1057 .0001 Team Functional Heterogeneity .7745 Team Kaizen Experience .1347 Team Leader Experience .9767 Management Support .3363 .1156 .0036 Event Planning Process .0759 Work Area Routineness .9892
For regressions where the coefficient – i.e., path a – was significant at the α = 0.05/3 = 0.0167 level – i.e., Goal
Clarity, Team Autonomy and Management Support – a second regression is performed where Attitude is regressed
on both the input variable (X) and Internal Processes. These results are shown in Table 36.
Table 36. Attitude on Internal Processes and Input Variable (X) Regressions (path b and path c’) Input Variable (X) Coefficient
These results suggest that path b – i.e., the impact of Internal Processes on Task KSA while controlling for
X – is significant for all three input variables at the α = 0.05/3 = 0.0167 level In addition, path c’ was significant at
the 0.0167 level for Team Autonomy and Management Support, which is consistent with a partial mediation effect.
Path c’ was non-significant for Goal Clarity, indicating a full mediation effect. For Team Autonomy, the apparent
partial mediation effect is consistent with the finding that Team Autonomy is a significant predictor in the final
regression model of Task KSA. The fact that Management Support was not significant in the final regression
suggests that another variable in the final regression moderates the impact of Management Support on Task KSA.
However, as mentioned previously, a post-hoc analysis revealed that, after controlling for Goal Clarity, Team
Autonomy and Management Support are no longer significant predictors of Internal Processes. Thus, there is less
support for the mediation hypotheses involving Team Autonomy and Management Support than for the mediation
hypothesis involving Goal Clarity.
For Affective Commitment to Change, in the first step of the mediation analysis, Affective Commitment to
Change is separately regressed on all nine event input factors to determine which event input factors have a
significant relationship to Affective Commitment to Change. The results of these separate regressions are shown in
Table 40. Note, parameter estimates and standard error estimates are only shown for significant regressions.
Table 40. Affective Commitment to Change on Input Variable (X) Regressions (path a) Input Variable (X) Coefficient (a) Std. Error p-value
Goal Clarity 0.6629 0.0627 0.0000 Goal Difficulty 0.0556 Team Autonomy 0.3497 0.1087 0.0013 Team Functional Heterogeneity 0.3913 Team Kaizen Experience 0.7641 Team Leader Experience 0.9646 Management Support 0.3378 0.1184 0.0043 Event Planning Process 0.3377 Work Area Routineness 0.4917
126
For regressions where the coefficient – i.e., path a – was significant at the α = 0.05/3 = 0.0167 level – i.e., Goal
Clarity, Team Autonomy and Management Support -- a second regression is performed where Task KSA is regressed
on both the input variable (X) and Internal Processes. These results are shown in Table 41.
Table 41. Task KSA on Affective Commitment to Change and Input Variable (X) Regressions (path b and path c’)
Path b – i.e., the impact of Internal Processes on Task KSA while controlling for the predictor (X) – was significant
only for Management Support at the α = 0.05/3 = 0.0167 level. Thus, the mediation analysis results for Goal Clarity
and Team Autonomy do not appear consistent with the mediation hypothesis – i.e., the hypothesis that these
variables impact Task KSA indirectly through Affective Commitment to Change. However, it should be noted that
the p-value for the effect involving Team Autonomy was fairly low, providing some weaker support for a mediation
effect. In addition, path c’ was significant for Management Support, which is consistent with a partial mediation
effect. However, as mentioned previously, the fact that Management Support was not significant in the final
regression indicates that another variable in the final regression moderates the impact of Management Support on
Task KSA. In addition, support for this model is especially tentative methodologically given the fact that, in this
research, Management Support was measured antecedent to Affective Commitment to Change. Support for a
mediation model involving Management Support and Affective Commitment to Change is valid only if it can be
inferred that, as intended, Management Support measures a global variable rather than only the specific aspects of
Management Support directly inquired about in the constituent items in the final survey scale.
Similarly to that performed for Internal Processes, following the mediation analysis, a post-hoc analysis
was performed to further test the robustness of the mediation hypothesis. In this analysis, Affective Commitment to
Change was regressed simultaneously on Goal Clarity, Team Autonomy and Management Support. As shown in
Table 42, only the regression coefficient for Goal Clarity was clearly significant in this regression (p < 0.05). Thus,
while the relationships between Management Support, Affective Commitment to Change and Task KSA are
consistent with the mediation hypothesis, support for the mediation hypothesis is weakened by the fact that, after
127
controlling for Goal Clarity, Management Support is no longer a significant, unique predictors of Affective
Commitment to Change.
Table 42. Affective Commitment to Change on Goal Clarity, Team Autonomy and Management Support Input Variable (X) Coefficient (a) Std. Error p-value
Goal Clarity .5993 .1196 .0000 Team Autonomy .0319 .1157 .7827 Management Support .0843 .1111 .4483
Table 43 summarizes the findings of the mediation analysis and the total strength of path for the mediated
effects – i.e., a*b. Note that the effects of Team Autonomy and Management Support are italicized, since a post hoc
analysis indicated that they are not significant unique predictors of Internal Processes and Affective Commitment to
Change after controlling for Goal Clarity. Implications of the findings are discussed in Chapter 5.
Table 43. Summary of Mediation Analysis Results for Task KSA Input Variable (X) Mediator Variable Total mediated effect
(a*b) Partial or Full
Goal Clarity Internal Processes .3155 Full Team Autonomy Internal Processes .2058 Partial Management Support Internal Processes .2066 Partial Management Support Affective Commitment to Change .1128 Partial
4.4.3 Mediation Analysis for Impact on Area
There was one event process factor that was a significant predictor of Impact on Area – Action Orientation.
Table 44 shows the results for regressing Action Orientation on all nine event input variables. The regressions were
significant at the 0.0167 level for three variables – Goal Difficulty, Team Autonomy and Work Area Routineness.
Table 44. Action Orientation on Input Variable (X) Regressions (path a) Input Variable (X) Coefficient (a) Std. Error p-value
Goal Clarity .1608 Goal Difficulty -.4517 .1632 .0056 Team Autonomy .6265 .2078 .0026 Team Functional Heterogeneity .1573 Team Kaizen Experience .4407 Team Leader Experience .3531 Management Support .6362 Event Planning Process .5286 Work Area Routineness 0.2643 0.0835 .0016
Table 45 shows the regression of Impact on Area on both Action Orientation and the input variable (X) for the
regressions where path a was significant.
128
Table 45. Impact on Area on Internal Processes and Input Variable (X) Regressions (path b and path c’)
Input Variable (X) Coefficient (c’) Std. Error
p-value Action Orientation
Coefficient (b)
Action Orientation Std. Error
p-value
Goal Difficulty -.0666 .0897 .4581 .3768 .0539 .0000 Team Autonomy .4757 .1363 .0005 .2905 .0541 .0000 Work Area Routineness -.0352 .0621 .5711 .4013 .0714 .0000
These results indicate that path b – i.e., the impact of Action Orientation on Impact on Area while controlling for X
– is significant for all three variables at the α = 0.05/3 = 0.0167 level -- which is consistent with the mediation
hypothesis. Path c’ was also significant at the 0.0167 level for Team Autonomy, which is consistent with a partial
mediation effect, which also agrees with the fact that Team Autonomy, along with Action Orientation, was one of the
three variables in the final regression model. Path c’ was non-significant for Goal Difficulty and Work Area
Routineness, which is consistent with a full mediation effect for these two variables – i.e., under the full mediation
hypothesis, Goal Difficulty and Work Area Routineness appear to significantly affect Impact on Area, but only
indirectly through Action Orientation.
Following the mediation analysis, a post-hoc analysis was performed to further test the robustness of the
mediation hypothesis. In this analysis, Action Orientation was regressed simultaneously on Goal Difficulty, Team
Autonomy and Work Area Routineness. As shown in Table 46, this post hoc analysis indicated that all three
variables were significant unique predictors of Action Orientation at the α = 0.05 level.
Table 46. Action Orientation on Goal Difficulty, Team Autonomy and Work Area Routineness Input Variable (X) Coefficient (a) Std. Error p-value
Goal Difficulty -.3493 .1196 .0210 Team Autonomy .5028 .1157 .0086 Work Area Routineness .1743 .1111 .0264
Table 47 summarizes the findings of the mediation analysis and the total strength of path for the mediation
effects – i.e., a*b. As shown, in the mediation model, Goal Difficulty has a negative effect on Impact on Area, while
Team Autonomy and Work Area Routineness have positive effects on Impact on Area. Further implications of all
these relations will be discussed in Chapter 5.
129
Table 47. Summary of Mediation Analysis Results for Impact on Area Input Variable (X) Mediator Variable Total mediated effect
(a*b) Partial or Full
Goal Difficulty Action Orientation -.1702 Full Team Autonomy Action Orientation .1820 Partial Work Area Routineness Action Orientation .1061 Full
4.4.4 Mediation Analysis for Overall Perceived Success
There was one event process factor that was a significant predictor for Overall Perceived Success: Tool
Quality. Table 48 shows the results for regressing Tool Quality on all nine event input variables. The regressions
were significant at the 0.0167 level for two variables – Goal Clarity and Management Support. In addition, one
variable, Team Autonomy, had a small but non-significant p-value (p < 0.05).
Table 48. Tool Quality on Input Variable (X) Regressions (path a) Input Variable (X) Coefficient (a) Std. Error p-value
Goal Clarity 0.5448 0.2161 0.0117 Goal Difficulty 0.2350 Team Autonomy 0.0496 Team Functional Heterogeneity 0.7610 Team Kaizen Experience 0.1392 Team Leader Experience 0.6897 Management Support 0.5615 0.2056 0.0063 Event Planning Process 0.9833 Work Area Routineness 0.7480
Table 49 shows the regression of Impact on Area on both Tool Quality and the input variable (X) for the regressions
where path a was significant.
Table 49. Impact on Area on Internal Processes and Input Variable (X) Regressions (path b and path c’) Input Variable (X) Coefficient (c’) Std.
These results indicate that the path b – i.e., the impact of Tool Quality on Overall Perceived Success while
controlling for the input variable (X) – is not significant for any of the regressions, providing a lack of clear support
for the mediation hypothesis. However, in both regressions the p-value for the effect of Tool Quality on Overall
Perceived Success was small (p < 0.05). In addition, for the regression of Tool Quality and Management Support
on Overall Perceived Success, the p-value of path b was only slightly greater than 0.0167 (i.e., 0.0190). This
130
suggests that, although not formally significant, this effect should likely be considered in the research results. In
other words, there is relatively strong evidence that impact of Management Support on Overall Perceived Success is
consistent with a full mediation effect.
Following the mediation analysis, a post-hoc analysis was performed to further test the robustness of the
mediation hypothesis. In this analysis, Tool Quality was regressed simultaneously on Goal Clarity and Management
Support. As shown in Table 50, this post hoc analysis indicated that neither input variable was significant at the α =
0.05 level when both were included in the model. However, Management Support had the smallest p-value (p =
0.07), indicating that it is a stronger – that is, more significant – predictor of Tool Quality than Goal Clarity is.
Table 50. Tool Quality on Goal Clarity and Management Support Input Variable (X) Coefficient (a) Std. Error p-value
Goal Clarity .3389 .2371 .1529 Management Support .4156 .2294 .0701
Table 51 summarizes the findings of the mediation analysis and the total strength of path for the mediation
effects – i.e., a*b. Further implications of all these relations will be discussed in Chapter 5.
Table 51. Summary of Mediation Analysis Results for Overall Perceived Success Input Variable (X) Mediator Variable Total mediated effect
(a*b) Partial or Full
Management Support Tool Quality .3161 Full
4.4.5 Mediation Analysis for % of Goals Met
There were no significant event process predictors for % of Goals Met in the continuous form. Therefore, no
tests of mediation are performed. In the dichotomous variable analysis, there was one significant event process
predictor: Action Orientation. Therefore, a mediation analysis was performed for those variables shown to have a
significant relationship to Action Orientation (see Table 44). The regression of Goal Achievement – i.e., the
dichotomous version of % of Goals Met – on Action Orientation and the predictor (X) was accomplished using
logistic regression in GEE. As shown in Table 52, there was no indication that Action Orientation mediated the
effects of these variables – i.e., there was no support for the mediation hypothesis for any of the input variables. In
fact, for Goal Difficulty, the logistic regression did not produce any standard error estimates, indicating an error in
the fit of the model to the underlying data – i.e., likely complete separation or lack of combinations (see Field,
2005).
131
Table 52. Goal Achievement (Dichotomous) on Internal Processes and Input Variable (X) Regressions (path b and path c’)
Input Variable (X) Coefficient (c’) Std. Error
p-value Action Orientation
Coefficient (b)
Action Orientation Std. Error
p-value
Goal Difficulty -994.917 -- -- -669.366 -- -- Team Autonomy .1014 .6085 .8676 -.6400 .4403 .1461 Work Area Routineness -.6012 .3070 .0502 -.2921 .4615 .5267
4.5 Summary of Results of Hypothesis Tests
Table 53 summarizes the results of the tests of H1 – H10.
Table 53. Summary of Results of Tests of H5 – H10 Hypothesis Findings Overall
Conclusion H1: Social system outcome variables will be significantly correlated at the team level. H0: Social system outcome variables are not significantly correlated at the team level.
• AT and TKSA, r = 0.710, p < 0.0001
Supported
H2: Social system outcomes will occur primarily at the team level, rather than individual level, indicated by significant intraclass correlation for social system outcome variables H0: The intraclass correlation for social system outcomes is not significant
• AT, ICC(1) = 0.300, p < 0.0001
• TKSA, ICC(1) = 0.121, p < 0.0001
Supported
H3: Technical system outcome variables will be significantly correlated at the team level. H0: Technical system outcome variables are not significantly correlated at the team level.
• IMA and OVER, n.s. • IMA and % of Goals Met,
n.s. • OVER and % of Goals
Met, n.s.
Not Supported
H5: Event input factors will be positively related to social system outcomes at the team level. H0: Event input factors are not positively related to social system outcomes at the team level.
• For Attitude, Team Functional Heterogeneity and Management Support were significant direct predictors
• For Task KSA, Goal Difficulty, Team Autonomy, Team Kaizen Experience, Team Leader Experience and Work Area Routineness were significant direct predictors
Partially Supported
H6: Event process factors will be positively related to social system outcomes at the team level. H0: Event process factors are not positively related to social system outcomes at the team level
• For Attitude, Internal Processes was a significant direct predictor
• For Task KSA, Internal Processes and Affective Commitment to Change were significant direct predictors
Partially Supported
H7: Event input factors will be positively related to technical system outcomes at the team level. H0: Event input factors are not positively related to technical
• For Impact on Area, Team Autonomy and Management Support
Partially Supported
132
system outcomes at the team level. • For Overall Perceived were significant direct predictors
• Success no event input factors were significant direct predictors
• For % of Goals Met, Team Kaizen Experience and Event Planning Process were significant direct predictors using the continuous response variable; in addition, Goal Difficulty, Team Leader Experience were significant direct predictors using the dichotomous response variable
H8: Event process factors will be positively related to technical system outcomes at the team level. H0: Event process factors are not positively related to technical system outcomes at the team level.
• For Impact on Area, Action Orientation was a significant direct predictor
• For Overall Perceived Success, Tool Quality was a significant direct predictor
• For % of Goals Met, no event process factors were significant direct predictors using the continuous response variable; however, Action Orientation was a significant direct predictor using the dichotomous response variable
Partially Supported
H9: Event process factors will partially mediate the relationship of event input factors and social system outcomes at the team level. H0: Event process factors do not mediate the relationship of event input factors and social system outcomes at the team level.
• For Attitude, Internal Processes fully mediates Goal Clarity
• For Task KSA, Internal Processes fully mediates Goal Clarity
Partially Supported
H10: Event process factors will partially mediate the relationship of event input factors and technical system outcomes at the team level. H0: Event process factors do not mediate the relationship of event input factors and technical system outcomes at the team level.
• For Impact on Area, Action Orientation fully mediates Goal Difficulty and Work Area Routineness, and partially mediates Team Autonomy
• For Overall Perceived Success, Tool Quality fully mediates Management Support
Partially Supported
133
4.6 Post-Hoc Control Variable Analyses
Following the development of the final regression models, post-hoc analyses were performed to determine
whether any of the variation not accounted for in the final regression models could be accounted for by the inclusion
of one or more “control” variables. These “control” variables were measured during data collection, but were not
explicitly tested in the main analysis – i.e., as event input factors and event process factors – because they were not
believed to be key variables influencing event outcomes (see Figure 1). However, it is likely that these “control”
variables may be related to some of the event input and event process factors studied. The output of these post-hoc
analyses are used to evaluate the robustness of the final regression models – i.e., stability under different levels of
the “control” variables – and to evaluate whether any of the “control” variables appear promising for future research
– i.e., as potential event input or event process predictor variables.
As is common in team research, one post-hoc analysis focused on determining whether Team Size had a
significant direct effect in the final regression models. As mentioned, it was hypothesized that Team Size would not
have a significant direct effect in the final regression models. A second post-hoc analysis was similarly used to
determine whether Event Duration had a significant direct effect in the final regression models. It was hypothesized
that Event Duration would not be one of the key variables influencing event outcomes, although it may be
interrelated with some of the studied variables – e.g., team perceptions of Goal Difficulty, Action Orientation, etc. A
third post-hoc analysis was used to determine whether the categorical variable Event Type – i.e., “implementation”
versus “non-implementation” – had any significant effects on outcomes that were not accounted for by the final set
of predictor variables in each model. It seems likely that “implementation” versus “non-implementation” events
might have differed on some of the independent variables studied in this research – e.g., Action Orientation.
However, the goal of this post hoc analysis was to determine whether there were any unmeasured variables related
to Event Type that had significant relationships to the outcomes after controlling for the final set of predictors in
each regression model. It should also be noted here that a related post-hoc analysis that was considered was
examining the effects of a second categorical variable, Event Methodology – i.e., general process improvement,
SMED, VSM, 5S, TPM. However, while there were 35 events in the general process improvement category, there
were five or fewer events in each of the other four categories, and the VSM category only had two events.
Therefore, there was insufficient sample size to complete a post-hoc analysis based on Event Methodology.
However, this analysis is of interest in future research.
134
The fourth post-hoc analysis focused on testing the effect of Team Kaizen Experience Heterogeneity in the
final regression models. Team Kaizen Experience (average team member experience with Kaizen events) was
tested as a predictor variable in the current research; however, Team Kaizen Experience Heterogeneity was not.
This analysis was used to evaluate the decision not to include Team Kaizen Experience Heterogeneity in the initial
research model, as well as to evaluate whether studying Team Kaizen Experience Heterogeneity in future research
would be of interest. The final (fifth and sixth) post-hoc analyses focused on the Number of Main Goals and the
total Number of Goals, respectively. These analyses focused on determining whether these variables had significant
relationships to outcomes after controlling for the final sets of predictors in the regression models. These analyses
were of particular interest since the quantity of goals could (theoretically) be one measure of overall event scope and
might potentially help explain some of the unexpected results for % of Goals Met – i.e., the negative relationship
between Team Kaizen Experience and Team Leader Experience and % of Goals Met. The following paragraphs
describe the results of the post-hoc analyses.
In the first post-hoc analysis, Team Size was not significant in any of the regression models using either the
GEE “model based” standard error estimates or the OLS standard error estimates. For two of the models – Impact
on Area and % of Goals Met in continuous form – the GEE “empirical” standard error estimates would suggest that
Team Size had a significant direct effect. However, as mentioned earlier in this chapter, there is reason to believe
that the GEE “empirical” standard error estimates are downwardly biased due to the small sample size at the
organizational level. In both models, the reported effect of Team Size was negative and small ( GEEβ)
= -0.015 for
both models). Overall, this post-hoc analysis suggests that Team Size does not have a significant direct effect on any
of the outcome variables that is not accounted for by the variables already in the final regression models. In
particular, Team Size does not appear to have a significant direct relationship to either of the two social system
outcome variables.
In the second post-hoc analysis, Event Duration was not significant for any of the models using the GEE
“model based” standard error estimates or the OLS standard error estimates. However, the p-value for the reported
effect of Event Duration on Task KSA was fairly small (p = 0.066), using the GEE “model based” standard error
estimates. Similarly, the GEE “empirical” standard error estimates would have been significant only for Task KSA.
The sign of the reported effect of Event Duration on Task KSA was positive and relatively small ( GEEβ)
= 0.054).
135
Overall, the post-hoc analysis suggests that Event Duration does not have a strong, significant effect on any of the
outcome variables that is not accounted for by the variables already in the final regression models. However, there
is some weak support for the proposition that Event Duration has a unique, direct relationship to Task KSA. This
relationship is logical. It is theoretically sound to suppose that longer events result in greater incremental gains in
Task KSA, all else being equal, due increased length of exposure to problem-solving tools and concepts. This
analysis suggests that perhaps Event Duration should continue to be analyzed in future research, particularly when
Task KSA is the outcome variable of interest.
In the third post-hoc analysis, Event Type was not significant for any of the models using the GEE “model
based” standard error estimates, the GEE “empirical” standard error estimates or the OLS standard error estimates.
However, the p-value for the reported effect of Event Type on Overall Perceived Success was fairly small (p =
0.079), using the GEE “model based” standard error estimates. The sign of the reported effect of Event Type on
Task KSA was positive and relatively large ( GEEβ)
= 0.532), however with a large standard error. Overall, the post-
hoc analysis suggests that Event Type does not have a significant effect on any of the outcome variables that is not
accounted for by the variables already in the final regression models. However, there is some weaker support for the
proposition that Event Type has a unique, direct relationship to Task KSA. The direction of the effect would suggest
that implementation events are, in general, rated as more successful than non-implementation events. Therefore
although the effect is not significant even for Overall Perceived Success, this analysis suggests that perhaps Event
Type should continue to be analyzed in future research, particularly when Overall Perceived Success is the outcome
variable of interest. This seems especially important since so little is known about the predictors of Overall
Perceived Success.
In the fourth post-hoc analysis, Team Kaizen Experience Heterogeneity was not significant for any of the
models using the GEE “model based” standard error estimates, the GEE “empirical” standard error estimates or the
OLS standard error estimates. Overall, this post-hoc analysis suggests that Team Kaizen Experience Heterogeneity
does not have a significant effect on any of the outcome variables that is not accounted for by the variables already
in the final regression models. This supports the initial modeling decision not to consider Team Kaizen Experience
Heterogeneity as a predictor variable – i.e., an event input factor.
In the final (fifth and sixth) post-hoc analyses, the GEE “model based” standard error estimates and OLS
standard error estimates were not significant for either Number of Main Goals or Number of Goals in any of the
136
regression models. However, the p-value for the reported effect of total Number of Goals on Overall Perceived
Success was fairly small (p = 0.064), using the GEE “model based” standard error estimates. In addition, the GEE
“empirical” standard error estimates would have been significant for the reported effect of total Number of Goals on
both Overall Perceived Success (p = 0.000) and % of Goals Met in the continuous regression (p = 0.030). The sign
of the reported effect of Number of Goals on Overall Perceived Success was positive and relatively small ( GEEβ)
=
0.088), while the sign of the reported effect of Number of Goals on % of Goals Met was positive and small ( GEEβ)
=
0.015). Overall, these post-hoc analyses suggest that Number of Main Goals and total Number of Goals do not have
significant effects on any of the outcome variables that are not accounted for by the variables already in the final
regression models. However, given the fairly small p-value for the effect of Number of Goals on Overall Perceived
Success (p < 0.10), Number of Goals may be of continuing interest in future research on factors related to Overall
Perceived Success. The direction of the effect indicates that events with a larger total Number of Goals had a higher
Overall Perceived Success. Perhaps having a clear division between different objectives (i.e. more specific goals)
helped the teams formulate better (i.e. more effective) problem-solving strategies. Or, perhaps a larger total Number
of Goals meant that the facilitator had more explicitly defined facilitator (and/or management) expectations for the
team, and thus had a more defined framework against which to measure Overall Perceived Success, as well as
increased ability to help the team develop effective strategies (due to increased understanding of event objectives).
Although Goal Clarity was measured in the current research, Goal Clarity measures the degree to which the team
objectives were understandable, not the degree to which the team objectives comprehensively defined (all)
stakeholder expectations.
Thus, none of the post-hoc analyses indicated clearly significant effects. However, some post-hoc analyses
suggested avenues for future research. For instance, Event Type and Number of Goals might possibly be related to
Overall Perceived Success and this potential relationship should be examined more extensively in future research.
137
CHAPTER 5: DISCUSSION
The following chapter provides more interpretation of the study results. First, the observed relationships
between outcome variables are discussed. Next, the results of the regression modeling processes are discussed to
refine hypotheses about the relationships between event input factors, event process factors and event outcomes.
Both direct effects and indirect effects are discussed. Finally, the chapter concludes with discussion of the
limitations of the present research.
One general note of caution is inserted here prior to discussing results as it applies to all the results discussed
below. Due to the observational, cross-sectional nature of this study, the direction of causality is hypothesized,
based on theory and the nature of the measures – e.g., the fact that the outcome measures specifically reference the
impact of “this Kaizen event” – not conclusively proven empirically, which would require a controlled experiment.
This is particularly true of the mediation models, which require a theoretical, hypothesized direction of causality for
two sets of relationships. However, the argument for the hypothesized direction of causality is noticeably
strengthened for variables measured through the Kickoff Survey (Goal Clarity, Goal Difficulty, and Affective
Commitment to Change), since this measurement was taken before the Report Out Survey, and for the objective
variables measured through the surveys or the Event Information Sheet (Team Functional Heterogeneity, Team
Kaizen Experience, Team Leader Experience, and Event Planning Process). In the case of these variables,
particularly the objective measures, it is difficult to argue for reverse causality – i.e., that the outcomes in fact caused
the measured values of these “independent” variables – unless the outcomes are assumed to be pre-existent to the
event and global – i.e., known and shared by the facilitator or other organizational employee planning the event.
While this argument cannot be entirely ruled out due to the non-experimental nature of the study, both the timing of
the measurements and the nature of the outcome measures – i.e., reference to the specific Kaizen event – make this
proposition highly unlikely. Although the argument that the perceptual variables measured through the Report Out
Survey and the Event Information Survey are also antecedent to outcomes is relatively strong theoretically, there is
more potential for contamination of causality effects for these measures, due to the fact that they are perceptual
measures that were measured concurrently with the outcomes. Finally, it should also be noted that, in observational
studies, there is also always some risk that the statistical relationship exists because both outcomes and predictors
138
are correlated with the true, unknown causes of the outcomes, but that the predictor variable does not in any way
determine the level of that cause.
5.1 Relationship between Kaizen Event Outcomes
Although not specified as testable hypotheses, two of the questions of interest in this research focus on
measuring the outcomes of Kaizen events (see the first two research questions in Section 1.2 and the first two
research purposes in Section 1.3), since the range of Kaizen event outcomes within and across organizations is rarely
reported in the Kaizen event practitioner literature. Part of this objective was accomplished by defining and testing
appropriate measures of event outcomes, particularly social system outcomes – i.e., Attitude and Task KSA. A
related investigation is the examination of the range of response for each dependent variable in the study. Finally,
these research questions can also be addressed through the investigation of the interrelationships between social
system outcomes and the interrelationships between technical system outcomes.
The events studied in this research cannot be considered a true random sample. Although the events studied
within each organization were randomly selected, the organizations were not randomly selected. Thus, the results
observed here cannot be taken as estimates of the expected results from all organizations conducting Kaizen events –
i.e., true population estimates. In addition, the boundary criteria employed to select organizations were intended to
identify organizations that were fairly mature in their Kaizen event program and had been conducting Kaizen events
for some time. However, although not a population estimate, the range of outcomes identified in this research lends
support to the hypothesis that even organizations that are mature in their Kaizen event programs experience some
variation in outcomes. The overall outcomes from the participating organizations are presented in Appendix S.
For the participating organizations, Kaizen event teams reported consistently positive perceptions of human
resource (social system) outcomes from Kaizen events. The mean team response was 5.00 (“agree”) for Attitude and
4.87 for Task KSA. In addition, the minimum observed response was close to 4.0 ( “tend to agree”) for both Attitude
and Task KSA. The overall range of response for Attitude was 4.00 – 5.83, while the overall range of response for
Task KSA was 3.94 – 5.63. These results suggest that, for the organizations in the study, Kaizen events were
associated with positive employee perceptions of the impact of the events on their Attitude toward (liking for)
Kaizen events and their Task KSA. However, it should also be noted here that, although the Kaizen events studied in
this research were randomly selected for inclusion, organizations appear to use a non-random process in selecting
team members for Kaizen events – based on employee personality, technical expertise, etc. Thus, there may be
139
some unmeasured factor(s) that may have caused the team members to be more likely to report positive outcomes
than other employees in the organizations, and therefore there is a possibility that the results may not generalize to a
team composed of randomly selected employees. As indicated in Appendix S, there was no significant difference
across participating organizations in terms of Attitude (p = 0.305), although there was a significant difference in
terms of Task KSA (p = 0.009). (Note, this effect is not significant if a Bonferroni correction is employed).
Similarly, for the participating organizations, Kaizen event teams reported positive perceptions of the impact of
their activities on the target work system (technical system impact). The mean team response for Impact on Area
was 4.91. In addition, the minimum observed response was slightly less than 3.5, which is the midpoint of the
survey scale (a neutral response range). The overall range of response for Impact on Area was 3.48 – 5.78. This
range suggests that, for the organizations in the study, Kaizen events were generally associated with positive
employee perceptions of the impact of the events on the target system. However, as described previously, due to the
non-random team selection processes within the participating organizations, it is possible that some unmeasured
characteristic made these employees more likely to report positive results that other employees in the organizations.
As indicated in Appendix S, there was no significant difference across participating organizations in terms of Impact
on Area (p = 0.436).
In addition, for the participating organizations, Kaizen event facilitators reported positive perceptions of overall
event success (Overall Perceived Success). However, there was a wider range of variation in response. The median
response was 5.0 (“agree”); however, the minimum response was 1.0 (“strongly disagree”), indicating that the data
set did contain some events that were viewed as substantially less successful from the facilitator’s perspective. In
total, three out of the 51 events studied were viewed as less successful, receiving a rating of 1.0 or 2.0 on the six-
point response scale. The overall range of responses was 1.0 - 6.0. These results indicate that, for the participating
organizations, Kaizen event facilitators viewed most, although not all, of the events in the data set as at least
somewhat successful. As indicated in Appendix S, there was no significant difference across participating
organizations in terms of Overall Perceived Success (p = 0.588).
% of Goals Met was more variable than the other four outcomes measures. Most of the Kaizen event teams in
the sample (35) were successful in meeting 100% of their main goals. However, for the remaining minority of
events, success was more variable. Eight teams (approximately 16% of the sample) achieved 50% or less of their
goals. In addition to the eight teams that achieved 50% or less of their goals, an additional five teams achieved
140
between 50-85% of their goals. Thus, while the majority of the teams were completely successful in meeting their
specified goals (at least in terms of short-term results), a substantial minority fell noticeably short of their specified
goals. As mentioned, these results are quite different than most of the published, anecdotal accounts, where
primarily successful teams are highlighted. These results indicate that, for the participating organizations, which
were relatively experienced in using Kaizen events, success was still variable in terms of goals achievement.
Slightly more than 25% of the events studied fell noticeably short of completely achieving their specified goals --
i.e., had a goal achievement of 85% of less. Due to the nature of the study, these results cannot be directly
extrapolated to other organizations, but they do support the hypothesis that some variability in goal achievement
exists even within organizations that are relatively more mature in their Kaizen event programs. Additional research
will be needed to discover whether similar results exist for other organizations.
Observing the levels of outcome variables, while related to the objectives of this research, does not represent a
set of testable hypotheses. Instead, the testable hypotheses specified in this research (H1, H2, H3 and H4) focused
on the interrelationships between outcome variables. As hypothesized (see H1), and suggested in the Kaizen event
practitioner literature (see Chapter 2), employee affect toward participation in Kaizen events (Attitude) and
employee belief that the Kaizen event strengthened their continuous improvement knowledge, skills and work
motivation (Task KSA) were highly related (see Table 19). However, the relationship was not perfect – only about
50% of the variance is shared (see Table 19). This supports the hypothesis that the two variables should be managed
separately by organizations seeking to create these favorable human resource outcomes. Further supporting this
point, Attitude and Task KSA were found to have a unique set of predictors (see Table 33 and Figures 2 and 3).
There were some common predictors of both outcomes – namely Internal Processes (direct for both) and Goal
Clarity (indirect for both). However, Attitude had two unique predictors not shared with Task KSA: Team
Functional Heterogeneity (direct) and Management Support (direct). In addition, Goal Difficulty, Team Autonomy,
Team Kaizen Experience, Team Leader Experience, Work Area Routineness, and Affective Commitment to Change
were significant (direct) predictors for Task KSA but not for Attitude. Finally, both variables were found to occur at
the group level, rather than individual level, supporting the hypothesis that learning in Kaizen events occurs at the
group level (H2), which is consistent with learning theory.
Contrary to the study hypotheses (H3), there were no significant relationships between the different measures of
technical success – Impact on Area (an event impact rating provided by the team), Overall Perceived Success (rated
141
by the event facilitator), and actual % of Goals Met. This result is somewhat unexpected, although not perhaps as
counterintuitive as it initially appears, due to the (intended) differences in the focus of the measures. Impact on Area
focused on the extent to which employees believed the event had resulted in improvement in the target system --
i.e., work area. Since this measure does not directly address goal achievement, it is possible that an event which
failed to achieve its goals – e.g., if the goals were very ambitious – could still have resulted in clear and measurable
improvement in the target system, resulting in a relatively high team score for Impact on Area. However, the same
event evaluated on the % of Goals Met measure could have looked much less favorable in terms of technical success
– perhaps even as a complete failure). Meanwhile, a team could achieve its goals without resulting in (much) visible
improvement in the target work area, potentially resulting in the reverse situation.
Overall Perceived Success, rated by the facilitator, reflects the facilitator’s holistic expert judgment about the
overall effectiveness of the event.12 For given event, this could be based on a weighting of several factors, which
could be different across events and across facilitators. From qualitative comments provided in the Event
Information Sheet, it appears that one influential factor is likely facilitator perceptions of stakeholder satisfaction –
i.e., top management approval of the team’s solution. This was illustrated by the case of one event in the data set
where % of Goals Met and Impact on Area were both high and the facilitator rating of Overall Perceived Success
was extremely low (1 = “strongly disagree”) (see Farris et al., 2006 for more details). The facilitator stated in the
Event Information Sheet comments that this was due to the fact that top management had rejected the team’s
solutions. However, additional research would be necessary to determine whether this relationship exists across
other events and organizations.
It should also be noted that the distributional properties of % of Goals Met and Overall Perceived Success may
also have contributed to failure to find significant correlations between the outcome variables. % of Goals Met was
highly skewed, even following a logarithmic transformation. This was due to the fact that so many of the teams (35
out of 51) achieved all of their improvement goals and thus had the same score for % of Goals Met. Meanwhile,
Overall Perceived Success was symmetric, but highly truncated.
Overall, the lack of strong correlation between technical system outcome measures supports the proposition that
a holistic set of technical success measures are needed to fully assess the technical success of a given event, both for
12 The facilitator, in most cases, is an organizational employee who spends a large proportion of his or her time planning and conducting Kaizen events; generally, for the organizations studied, the facilitator had conducted several previous events, providing a broad knowledge basis for comparison.
142
researchers and managers. An event may look successful in terms of % of Goals Met, but might miss receiving buy-
in from critical stakeholders or fail to have an immediate, noticeable positive impact on the target system. In
addition, team member perceptions of event impact do not always coincide with facilitator perceptions of event
success. This could result in a organizational disconnect that must be addressed to prevent Kaizen event team
members from becoming disillusioned with the Kaizen event process if management does not ultimately (fully)
accept and support their solutions (Lawler & Mohrman, 1985, 1987).
Despite the lack of direct relationship, the technical system outcomes did share some common predictors.
Management Support was a common predictor of both Impact on Area (direct) and Overall Perceived Success
(indirect). Meanwhile, Goal Difficulty and Action Orientation were common predictors of both Impact on Area and
% of Goals Met. Goal Difficulty was a direct predictor of % of Goals Met and an indirect predictor of Impact on
Area (through Action Orientation). Action Orientation was a direct predictor of both measures; however, the sign of
the relationship was different for the two measures. Action Orientation had a positive relationship to Impact on
Area and a negative relationship to % of Goals Met. As expected, events with a higher Action Orientation – i.e.,
relatively more time spent in the target work area versus “offline” in meeting rooms – also reported higher team
member perceptions of event Impact on Area. However, increased Action Orientation was not associated with
increased goal achievement (% of Goals Met). Instead, Action Orientation had a significant negative relationship to
% of Goals Met (in the dichotomous form), suggesting that too much focus on “hands on” activities may inhibit goal
achievement. Although these results appear counterintuitive at first, this set of relationships is possible due to the
lack of correlation between the two technical system outcomes.
Finally, there was some support for a relationship between technical system outcomes and social system
outcomes (H4). Impact on Area was highly correlated with both Attitude and Task KSA. Approximately 40% of
the variance is shared between Impact on Area and Attitude, and approximately 47% of the variance is shared
between Task KSA and Attitude. This lends support to the hypotheses in the Kaizen event practitioner literature, as
well as the organizational change literature, that immediately visible results (Impact on Area) are associated with
increased team member motivation to participate in events (Attitude). This relationship is hypothesized to be due, at
least in part, to the fact that participating employees can see immediate return on their investment – i.e., evidence
that the methodology works in producing improvements. However, the direction of causality between Attitude and
Impact on Area is hypothesized only based on related literature and cannot be validated due to the cross-sectional
143
nature of this study. It is possible that a follow-up longitudinal study with multiple measurements on Attitude and
Impact on Area during the event might be used to more directly study this relationship. However, testing effects due
to multiple administrations of the same survey instrument within a very short time window (less than one week)
must be considered in any proposed study design. The relationship between Task KSA and Impact on Area lends
support to the proposition in Kaizen event practitioner literature that Kaizen events are an effective, “hands-on”
training tool for equipping participating employees with knowledge, skills and motivation related to continuous
improvement, by allowing them to immediately apply those new KSAs to the problem at hand. One practitioner
article even refers to Kaizen events a type of “just-in-time” training (Drickhamer, 2004a). It seems likely that the
relationship between Task KSA could be at least somewhat reciprocal. Increased team gains in Task KSA may be
expected to contributed to increased Impact on Area, all else being equal, because teams with greater gains in Task
KSA might be better able to apply the continuous improvement concepts. Similarly, events where teams are able to
achieve a high Impact on Area may result in greater gains in Task KSA, because the meaning and purpose of
problem-solving tools and concepts may be better understood when visibly and effectively applied. Again, the
directionality of this relationship is hypothesized and represents a proposition for future research. It cannot be
verified in this cross-sectional study. It is also interesting to note that one potential mediating variable – Tool
Quality – showed no direct relationship to either Impact on Area or Task KSA.
On additional note in discussion of the relationship between technical and social system outcomes is the overlap
in sets of predictors. Management Support was a significant predictor of both one social system outcome (Attitude)
and two of the technical system outcome (Impact on Area and Overall Perceived Success). Goal Difficulty was also
a significant predictor of one social system outcome (Task KSA) and two technical system outcomes (Impact on
Area, % of Goals Met). However, the sign of the relationship was different for the two types of outcomes. Goal
Difficulty had a positive relationship to Task KSA and a negative relationship to the two technical system outcomes
(Impact on Area, % of Goals Met). The increased challenge from more difficult goals appeared to be beneficial in
terms of team member gains in Task KSA but detrimental in terms of Impact on Area and team goal achievement (%
of Goals Met). Work Area Routineness was also a significant (positive) predictor of one social system outcome
(Task KSA) and one technical system outcome (Impact on Area). Similarly, Team Autonomy was a significant
predictor of one social system outcome (Task KSA) and one technical system outcome (Impact on Area).
Meanwhile, Team Kaizen Experience and Team Leader Experience were common (negative) predictors of one
144
social system outcome (Task KSA) and one technical system outcome (% of Goals Met). The following sections
discussed the relationships observed for each outcome variable in more detail.
5.2 Significant Predictors of Attitude
Figure 2 depicts the overall model of significant relationships between Attitude and the predictor variables that
were identified in this research. Table 54 contains the relative effect sizes – i.e., GEE regression coefficients – for
the variables in the final model. Two words of caution should be inserted here, which also apply to the effect size
tables in the following sections. First, effect sizes must be interpreted with caution due to the differences in scale of
measurement across variables – i.e., a six-point interval scale for Goal Clarity, Internal Processes and Management
Support, and an index from 0-1 for Team Functional Heterogeneity. The GEE regression coefficients are
unstandardized. Second, the indirect effect especially must be interpreted with caution because it represents a raw
(unmoderated) estimate of the mediated effect. Barring suppressor effects, it is likely that this represents an upper
bound on the actual mediated effect However, the effect size table can still be useful for gauging the relative effect
size of the different variables, particularly the variables measured on the same rating scale – i.e., determining which
survey variables have the largest effect sizes.
+ -
+
+Internal Processes
Attitude Team Functional
Heterogeneity Goal
Clarity
Management Support
Figure 2. Overall Model for Significant Predictors of Attitude
Table 54. Effect Size Table for Attitude Predictor Direct Effect Indirect Effect
Team Functional Heterogeneity -.547 Internal Processes .694 Management Support .250 Goal Clarity .414
This research found that the most significant predictors of Attitude toward Kaizen events were Team Functional
Heterogeneity (direct negative), Management Support (direct positive), Internal Processes (direct positive), and
145
Goal Clarity (indirect positive). In addition, as described in Chapter 4, there is some weaker support that
Management Support and Team Autonomy may have positive indirect effects. However, due to the weaker support,
these potential indirect effects are not discussed here.
Most of the variables demonstrated a positive relationship with Attitude; however, Team Functional
Heterogeneity demonstrated a negative relationship with Attitude. More diverse teams were associated with lower
levels of liking for Kaizen activities. This finding is consistent with previous team research suggesting that cross-
functional teams may make better decisions (McGrath, 1984; Jackson, 1992; Jehn et al., 1999; Lovelace et al.,
2001), but also experience lower levels of enjoyment in working together (Baron, 1990; Ancona & Caldwell, 1992;
Amason & Schweiger, 1994). However, this finding is particularly interesting since the use of a cross-functional
team is one of the most common recommendations in the Kaizen event literature (e.g., LeBlanc, 1999; Drickhamer,
Perhaps surprisingly, Team Functional Heterogeneity did not show a significant relationship to team ratings of
Internal Processes (tested during the mediation analysis). Assuming the direction of causality in the research model
is correct, Team Functional Heterogeneity appears to have acted only directly on Attitude toward Kaizen events
versus directly and indirectly through Internal Processes. It may be that, in more homogeneous teams, team
members received more direct enjoyment from working with their peers – i.e., people they work closely with on a
day-to-day basis – than they did in working in more cross-functionally diverse teams, where they were less likely to
know other team members as well. Rather than enjoyment from working with those who are similar, this finding
could instead reflect a lower affect for working with people who are different or less well known – i.e., from
different cross-functional backgrounds. This second proposition is similar to the first proposition above; however,
the first proposition focuses on enjoyment gained from working with “friends” – i.e., people who are well known to
each other – whereas the second proposition focuses on potential discomfort in working with people coming from
different backgrounds and schools of thought. Either effect would not necessarily be reflected in Internal Processes
scores, since Internal Processes measures whether there was any evidence of disharmony (lack of respect and
breakdowns in communication) within the group, rather than the extent to which team members enjoyed working
together. This also agrees with previous research which has found that diverse teams may develop very effective
146
communication mechanisms (Azzi, 1993; Earley & Mosakowi, 2000). Support for either proposition could be
analyzed by including additional measures in future research – i.e., a direct measure of “team spirit,” a scale
measuring comfort in working with those well known to each other, a scale measuring comfort in working with
those from different backgrounds.
The findings of this research with regard to the apparent negative impact of Team Functional Heterogeneity on
Attitude are not at this point interpreted to imply that organizational managers should stop using cross-functional
teams in Kaizen events, since other research (as well as team member and facilitator written comments from the
Kaizen events studied in this research) suggests that using a cross-functional team can improve solution quality. For
problems that cut across different functional boundaries, cross-functional teams are still likely particularly
appropriate, in part to help create open channels of communication across the different functions. Also, as reported
in Appendix S and Section 5.1, despite the negative relationship between Team Functional Heterogeneity and
Attitude, all of the teams studied in this research reported at least somewhat positive Attitude outcomes. What these
findings may imply, if they hold across additional organizations, is that managers should recognize that increasing
team diversity might lower team member enjoyment of Kaizen events, which ultimately could lower employee buy-
in and enthusiasm for Kaizen events, if counter measures are not taken. Thus, in events where a more functionally
diverse team is used, the facilitator may want to pay particular attention to maintaining positive Internal Processes,
Goal Clarity, Team Autonomy and Management Support, in order to counteract the potentially negative impact of
increased functional diversity, provided the hypothesized direction of causality is correct. These countermeasures
would seem particularly important for teams with low average Team Kaizen Experience, since it would seem
particularly important for creating buy-in to the Kaizen event program for employees to enjoy their first experiences
with Kaizen events.
Internal Processes was another significant, direct predictor of Attitude toward Kaizen events. This result has
strong face validity, since Internal Processes measures the harmony of the team with regard to respect for persons
and open communication. Since the Attitude scale references the current Kaizen event, it seems logically difficult to
imagine a situation where team members would report positive Attitude toward Kaizen events, while reporting
negative Internal Processes. Conceptually, positive Internal Processes seem to be a necessary (but not sufficient)
condition for positive Attitude toward events. Internal Processes is a high leverage variable in that this research also
suggests it can be influenced in several ways. Three additional variables that this research suggests can be used to
147
improve team Internal Processes will be discussed presently. It is also noted here that the event facilitator would
appear to play a crucial role in directly enabling positive Internal Processes. The facilitator often has the primary
organizational role in selecting the personnel for events (i.e., a good set of “team players”), establishing ground rules
(such as respect for persons, open communication, etc.) and keeping team discussions “on track” during the event.
This is suggested both by team member written comments from the events studied and by the Kaizen event
practitioner literature (e.g., Mika, 2002).
In addition to his/her direct role in the facilitation process, this research suggests that there is at least one other
variable that the facilitator or other organization personnel can manipulate to impact Internal Processes and,
thereby, Attitude toward Kaizen events, provided the hypothesized direct of causality is correct. The mediation
analysis results suggest that Goal Clarity is a significant, positive indirect predictor of Attitude through Internal
Processes. Goal Clarity and Internal Processes were measured at two distinct points in time – at the Kickoff
meeting and the Report Out meeting, respectively. Thus, there is reduced likelihood of confounding between the
two variables and there is greater support that the hypothesized direction of causality – i.e., Goal Clarity causing
Internal Processes – is correct. Goal Clarity measures the initial team member perceptions of the extent to which
expectations for the event have been well defined, such that they are understood by all team members at the time of
the Kickoff meeting. It appears that Goal Clarity could positively impact Internal Processes in at least two related
ways. First, by clearly defining team goals prior to the start of the event, valuable event time which must otherwise
be spent refining the goals (Letens et al.., 2006) is “freed-up.” Although recommended in some Kaizen event
practitioner resources, Letens, Farris and Van Aken (2006) suggests that attempting to define (or refine) team goals
during the event can be a stressful and frustrating (i.e., non-harmonious) exercise. Second, clearly defining goals
provides focus and a common language of communication for the team – thus likely facilitating open
communication among team members, as well as enabling team members to more fully consider other team
member’s ideas since they would be better able to see how the ideas relate to event objectives. These findings
support the hypothesis that facilitators and others in organizations who plan events should not shortcut the process of
clearly defining (and refining) team objectives prior to the event. These findings also agree with previous research
which has found significant relationships between Goal Clarity and team effectiveness (e.g., Van Aken & Kleiner,
1997; Doolen et al, 2003a). In addition to the standard event charters provided in published Kaizen event
guidebooks (facilitator manuals), there are several specific recommendations for developing clear goals in the
148
Kaizen event practitioner literature (see Table 1). Also, there are several innovative practices in use in
organizations, including the use of pre-event “sensing sessions” (i.e., focus groups) where stakeholder groups
provide feedback used to refine the goals in a pre-event working session (Farris & Van Aken, 2005). Finally, this
finding suggests that some of the suggestions in the Kaizen event practitioner literature, such as having the team
members develop the goals (e.g., Wittenberg, 1994) and even determine the target work area during the event (e.g.,
Kumar & Harms, 2004) may not be advisable.
Finally, Management Support had a positive direct relationship to Attitude. Thus it appears that Management
Support appears to either impact Attitude directly or through some unmeasured process factor. The final set of
questions in the Management Support construct relate to adequacy of materials, equipment and supplies and help
from others in the organization. It seems likely that increased resource support – i.e., the current Management
Support scale – is one method of communicating overall management support, as well as management concern for
the well-being of the team, to the Kaizen event team members. Increased perceptions of being involved in work that
is important to the organization – i.e., events that have high overall management support – could result in more
positive Attitude toward Kaizen events. Again, this link is hypothesized and would need to be tested in future
research. For instance, in future research direct measures of perceived event importance to management could be
used – i.e., event priority, as well as event scope/size. It could also be that increased levels of positive Attitudes are
due not primarily to increased perceptions of event importance to management but, rather, as mentioned above, to
increased employee perceptions that management is concerned for their individual well-being – i.e., the feeling of
being valued by management. To test this proposition, a scale measuring team member perceptions of
management’s concern for their well-being and/or respect for their contributions could be included in future
research. Or, it could be, more directly, that team members tend to enjoy events where they do not experience
resource shortfalls more than events where there are resource problems. Given the importance of Management
Support – the fact that it has a positive relationship to three out of five outcome variables – additional research on
the exact nature of the relationship between Management Support and Attitude is needed. It should also be noted
that none of the three propositions discussed above are mutually exclusive – i.e., all could have some simultaneous
impact on Attitude – although some order of relative importance would be likely to emerge in future research.
149
5.3 Significant Predictors of Task KSA
Figure 3 depicts the overall model of significant relationships between Task KSA and the predictor variables,
which were identified in this research. Table 55 contains the relative effect sizes – i.e., GEE regression coefficients
– for the variables in the final model.
++
-++ -
++Internal
Processes
Team Autonomy
Task KSA Team Kaizen Experience
Goal Clarity
Affective Commitment
to Change Team Leader Experience
Goal Difficulty
Work Area Routineness
Figure 3. Overall Model for Significant Predictors of Task KSA
Table 55. Effect Size Table for Task KSA
Predictor Direct Effect Indirect Effect Goal Difficulty .119 Team Kaizen Experience -.398 Team Leader Experience -.195 Work Area Routineness .094 Affective Commitment to Change .222 Internal Processes .465 Team Autonomy .234 Goal Clarity .316
Of the outcome variables studied in this research, by far the variable with the largest number of significant
predictors was Task KSA, suggesting a large number of ways that Task KSA could potentially be positively
impacted, but also increased complexity of management of this outcome variable, providing the results of this
research hold across additional organizations. This research found that the most significant predictors of team
member gains in Task KSA were Goal Difficulty (direct positive), Team Kaizen Experience (direct negative), Team
Leader Experience (direct negative), Work Area Routineness (direct positive), Team Autonomy (direct positive),
Internal Processes (direct positive), Affective Commitment to Change (direct positive), and Goal Clarity (indirect
positive). In addition, as described in Chapter 4, there is some weaker support that Management Support and Team
150
Autonomy may have positive indirect effects. However, due to the weaker support, these potential indirect effects
are not discussed here. Again, the Task KSA variable measures the perceived extent of team members’ incremental
gains in continuous improvement KSAs as a result of the current event.
Goal Difficulty had a positive relationship to Task KSA. This result has strong face validity. Group and
individual learning theory suggests that, in general, more complex – i.e., less routine – problems are likely to be
associated with increased learning, due to increased stimulation of individual and team creativity processes (e.g.,
Amabile, 1989; Druskat & Pescosolido, 2000; George & Zhou, 2001). In addition, increased goal difficulty has
been found to result in greater effort and performance (Locke & Latham, 1990; Locke & Latham, 2002), as well as
greater learning (Wood & Locke, 1990). However, although this relationship is rarely qualified, it does seem likely
that it may only hold up to a certain point; if a problem becomes too complex, it would seem likely that very little
specific learning would occur due to team inability to effectively respond to the situation (Atkinson, 1958; Erez &
Zidon, 1984). Thus, the finding that, in the current research, more difficult goals are associated with greater team
member gains in Task KSA appears to agree with previous research which associates greater learning with more
challenging problems. From a social system (human resource development and training) perspective, these findings
agree with recommendations in the Kaizen event practitioner literature that Kaizen event goals should be
Rosen, 1999; Edmondson, 2002). Thus, if Kaizen events are intended to be used as a continuous improvement
training tool, this finding would suggest that Team Autonomy should be carefully preserved.
Internal Processes had a significant direct relationship to Task KSA. This was the only direct relationship
shared by the two social system outcome variables (Attitude and Task KSA); however, both social system variables
had a common indirect relationship (i.e., Goal Clarity). While not conceptually a necessary condition, harmonious
internal workings would likely promote gains in Task KSA. In addition, Internal Processes also measures the extent
to which there was discussion of ideas within the team. Discussing ideas and developed shared meanings is a
fundamental process of group learning (Crossan et al., 1999; Edmondson, 2002). One additional variable – Goal
Clarity – acted indirectly on Task KSA through Internal Processes. The relationship of Internal Processes to Goal
Clarity has already been discussed in the previous section.
A second event process variable, Affective Commitment to Change, also had a positive direct relationship to
Task KSA. This finding indicates that events with higher initial commitment (“buy-in”) to the event objectives
(measured at the Kickoff meeting) also had higher gains in Task KSA. These findings are particularly interesting
since Affective Commitment to Change showed no relationship to Impact on Area or either of the other two technical
system measures. Although not differentiated in the research model (Figure 1), it would seem particularly likely that
this variable would be related to implementation (i.e., Impact on Area or % of Goals Met), effects that were not
154
observed in this research. The exact nature of the relationship between Affective Commitment to Change and Task
KSA is not known. Also, as mentioned previously, in any observational study, correlation cannot be assumed to
indicate causation, although the fact that Affective Commitment to Change was measured before Task KSA
strengthens the conceptual argument for causation. It may be that teams with a higher initial buy-in work harder –
i.e., are more dedicated and diligent – at applying the tools (e.g., Keating et al., 1999), thus resulting in greater gains
in Task KSA. Although team effort was not measured in the current research, future research could include
measures of perceived team effort to determine whether team effort appears to mediate the relationship between
Affective Commitment to Change and Task KSA, as proposed above. Another potential explanation for the
relationship between Affective Commitment to Change and Task KSA is that when team members believe the event
itself is worthwhile (i.e., high Affective Commitment to Change), they may be more likely to feel they have gained
worthwhile KSAs from the event.
5.4 Significant Predictors of Impact on Area
Figure 4 depicts the overall model of significant relationships between Impact on Area and the predictor
variables which were identified in this research. Table 56 contains the relative effect sizes – i.e., GEE regression
coefficients – for the variables in the final model.
+-
+
+
++Action
Orientation
Team Autonomy
Impact on Area
Management Support
Work Area Routineness
Goal Difficulty
Figure 4. Overall Model for Significant Predictors of Impact on Area
155
Table 56. Effect Size Table for Impact on Area
Predictor Direct Effect Indirect Effect Action Orientation .243 Team Autonomy .342 .182 Management Support .262 Goal Difficulty -.170 Work Area Routineness .106
This research found that the most significant predictors of team member perceptions of the impact of the given
event on the target system (Impact of Area) were Management Support (direct positive), Action Orientation (direct
positive), Team Autonomy (direct and indirect positive), Goal Difficulty (indirect negative) and Work Area
Routineness (indirect positive). Management Support, Action Orientation and Team Autonomy demonstrated a
positive relationship with Impact on Area, while Goal Difficulty and Work Area Routineness demonstrated a
negative relationship with Impact on Area.
Action Orientation was the only event process variable with a significant relationship to Impact on Area. Action
Orientation describes team member perceptions of the relative amount of time their team spent in the target work
area versus “offline” in meeting rooms. For the events studied in this research, increasing levels of Action
Orientation were associated with increased perceptions of Impact on Area. This lends support to the hypothesis that
increased levels of Action Orientation denote increased focus on implementation – i.e., making changes to the target
work area. This is also supported by analysis of the contextual data provided in the team activities log. Although
none of the reported levels of Impact on Area in this research were low per se in terms of the survey response scale –
it would thus appear that, in non-implementation events, team members likely based their perceptions on the
projected future impact of the event on the target system if their solution were fully implemented – increased Action
Orientation was associated with increased perceptions of Impact on Area. Increased focus on “hands on” activities
(e.g., implementation) has been suggested as one of the main features that differentiate Kaizen events from more
traditional continuous process improvement activities – e.g., quality circles and the continuous process improvement
teams used in Total Quality Management – where the end result of team activities is often an action plan for change
which is then presented to management for approval (Mohr & Mohr, 1983; Cohen & Bailey, 1997; Laraia et al.,
1999). In these traditional activities, there is generally more focus on analysis and less focus on experimentation –
i.e., testing out solutions right away. In addition, in traditional continuous process improvement activities, in many
cases, team solutions may not be implemented until weeks or months after the presentation to management, if they
156
are implemented at all. The lack of immediate, apparent impact of their efforts, as well as the fact that management
could ultimately overrule and fail to implement team solutions, have been suggested as reasons why many
continuous process improvement programs have failed to be sustained. The lack of immediate short-term returns on
investment is hypothesized to have resulted in lower employee buy-in to the programs and ultimate failure to sustain
the programs (e.g., Lawler and Morhman, 1985, 1987; Keating et al., 1999).
Again, the Kaizen event facilitator would seem to play a key role in enabling Action Orientation, both through
managing key input variables – to be discussed more presently – and through his or her role in directly assisting in
the coordination of team activities. By establishing ground rules – e.g., the importance of “hands-on”
experimentation or “trystorming;” “better” vs. “perfect,” etc. (Mika, 2002; Farris & Van Aken, 2005) – and by
encouraging the team to spend its time in the target work area versus the meeting room, the facilitator could directly
influence the extent of team Action Orientation and thereby potentially ultimately increase Impact on Area. This
research suggests that key ways that the facilitator or others in the organization could indirectly influence Impact on
Area through Action Orientation appear to include event planning activities related to event scoping and boundary
control. Developing team objectives of appropriate difficulty (Goal Difficulty), selecting target system of
appropriate complexity (Work Area Routineness), and establishing Team Autonomy.
Goal Difficulty was negatively associated with Action Orientation. Teams with higher levels of Goal Difficulty
believed that they spent relatively more time in their meeting room versus in the target work area (i.e. lower Action
Orientation), compared with teams reporting lower levels of Goal Difficulty. As described above, it is likely,
although as yet untested, that lower levels of Action Orientation are associated with more time spent in analysis
activities – i.e., understanding the problem and the target system and designing a solution – versus implementation
activities – i.e., implementing and testing solutions. The finding that Goal Difficulty appears to have a negative
relationship to Impact on Area through Action Orientation appears to contradict the common recommendation in the
Kaizen event practitioner literature that team goals should be challenging “stretch” goals (e.g.. LeBlanc, 1999;
1997; Melnyk et al., 1998; Sabatini, 2000; Tanner & Roncarti, 1994; Larson, 1998a; Treece, 1993; Taylor &
Ramsey, 1993; Foreman & Vargas, 1999), these results suggest that, at least in some cases, teams might be better
served by spending a substantial portion of time conducting training, establishing ground rules and analyzing the
problem – activities that are generally conducted “offline” in meeting rooms versus on the shop floor – i.e., in the
target work area. There is some evidence from this research that laying more groundwork and allowing more time
to developing, versus implementing, solutions may ultimately lead to increased goal achievement, particularly given
some event designs. As demonstrated by the mediation relationship between Action Orientation and Goal Difficulty
for Impact on Area, Action Orientation and Goal Difficulty are significantly, negatively correlated. The negative
relationship between Goal Difficulty and % of Goals Met has already been discussed. However, the fact that Action
Orientation had an additional, significant negative effect may suggest that, when events with more difficult goals
adopted a relatively high degree of Action Orientation, a further negative effect resulted. Or, similarly to Team
Kaizen Experience and Team Leader Experience, it is possible that Action Orientation is correlated with an
unmeasured predictor variable such as event scope. Thus, future research that includes direct measures of event
scope is also of interest for Action Orientation.
5.7 Limitations of the Present Research
Section 1.8 originally presented some of the limitations of the current research – specifically the limited number
of variables and organizations studied. While these limitations are not discussed in detail here (due to the detailed
treatment given in Chapter 1), it is worth noting here that additional event input, event process and event outcome
variables could have been studied. Thus, the findings of this research only hold for the variables studied in this
169
research and do not rule out significant effects from unstudied variables. Related to this observation, in all the
regression models, a substantial amount of variation (i.e., at least 40%) remained unexplained, thus indicating the
likely presence of other explanatory variables that were not measured. However, the current set of variables were
chosen for theoretical reasons – i.e., the fact that the Kaizen event practitioner literature and literature on related
organizational mechanisms (i.e., projects and teams) suggested that they were the most theoretically likely
predictors. Chapter 6 further describes the opportunity of examining additional variables in future research.
Similarly, the boundary criteria applied to select organizations – i.e., manufacturing organizations that are
relatively experienced in using Kaizen events and hold Kaizen events frequently – as well as the non-random nature
of sampling at the organizational level, mean that the results of this research may not hold for organizations of
markedly different characteristics. Conversely, however, there was quite a bit of variety across organizations in
terms of the types of problems and work areas targeted, including events in non-manufacturing processes. In
addition, the boundary selection criterion of relatively “high” experience in using Kaizen events means that these
organizations are more likely to be “best practice” organizations. They have continued to use Kaizen events,
because presumably, they have found them to be effective in achieving organizational objectives – although all
Kaizen event coordinators in the participating organizations indicated that there was some variation in outcomes
across events, which is also indicating by the negative intraclass correlation values in the GEE regression models.
Finally, as has been mentioned, the sample size at the organizational level was relatively small (i.e., six
organizations), and, as will be discussed in Chapter 6, future research involving more organizations is desirable to
test the robustness of these results and to allow the investigation of organization-level variables.
Another limitation is that this research only studied the initial outcomes of Kaizen events. No indication of the
level of sustainability of these outcomes – or the mechanisms related to sustainability – is therefore provided. As
Chapter 6 indicates, this is an area where future research is needed and is also a focus area within the larger VT-
OSU study of Kaizen events.
One additional limitation of this research was discussed at the beginning of this chapter. As an observational
field study, this research lacks experimental control and the findings are based on methodological and theoretical
arguments for causality – i.e., timing of measurements, nature of measurements, related organizational theory, etc. –
rather than empirical proof of causality through experimental control. This is an issue which has been long
recognized as a limitation of non-experimental field research; however, such theoretical observational research still
170
remains valuable for building and testing theory, particularly in cases of complex real world phenomena and
particularly for exploratory work, such as this research. Controlled laboratory experiments involving complex
business processes often lack generalizability due to the non-random nature of the subject pool – i.e., often college
students – and the artificial and generally overly simplified environment induced in the experimental setting. Quasi-
experiments in the field often have increased validity in these areas but lack precise control. There are always
contextual factors – measured or unmeasured – that can impact results, which is a similar problem to that faced in
observational studies; however, there is a stronger argument for the direction of causality in quasi-experiments
versus observational studies. Using a quasi-experimental design prior to this study did not appear feasible. First,
since before this study, none of the design suggestions in the Kaizen event practitioner literature had been
empirically investigated, there were a large number of potential effects to be tested, which did not prove to be
problematic in the current study design but would have been more problematic in an experimental design due to the
increased resource investment for organizations. This research provides some groundwork for future quasi-
experimentation by narrowing down the hypothesized sets of relations for each outcome variable to parsimonious
sets for further testing. Second, the measures used in this study had not yet been validated – i.e., through factor
analysis, etc. – thus representing an increased risk for organizations in terms of time and resources invested if the
measures proved unreliable. Third, related to the first point, since the effects hypothesized in Kaizen event literature
had not been tested, the risk for participating organizations in adopting these suggestions could have been large –
i.e., in terms of decreased event outcomes. Since these design suggestions have now been analyzed to indicate
which variable demonstrate positive relationships with outcomes, perhaps a quasi-experimental design could be
adopted in future research where a baseline of organizational performance is taken on several events before and after
adopting the design suggestions associated with positive outcomes in this research.
Another limitation, which is related to the small sample size at the organizational level and has also been
discussed in Chapter 4, is that the small sample size at the organizational level precluded the ability to test for
differences in regression slopes across organizations. Aggregate differences – i.e., differences in regression
intercepts – were accounted for through the use of GEE; however, as discussed in Chapter 4, GEE does not allow
the separate modeling of differences in regression slopes across organizations. As discussed in Chapter 6, a larger
sample size at the organizational level would allow the investigation of differences in slopes across organizations as
well as organization-level variables through HLM.
171
The final limitation noted in this section is the exploratory nature of this research. Due to the lack of prior
research to establish the order or importance of the study variables, the regression models in this research were built
through an exploratory variable selection process. Although several different approaches were used to attempt to
establish convergence, there is always a chance that the “best” model – i.e., the one that most appropriately
represents the relationship between the outcome variables and the input variables – was not the final model
selection. This risk is always at least somewhat present in regression analysis, but particularly in exploratory work.
172
CHAPTER 6: CONCLUSIONS
This chapter summarizes the overall findings of this research and describes areas of future research that were
identified as a result of this study. There are four primary areas of future research identified: 1) additional testing
of model robustness with an increased sample size at the organizational level; 2) testing of additional model
parameters; and 3) additional research on the sustainability of event outcomes.
6.1 Summary of Research Findings
Table 60 provides a summary of the research findings, while Figure 8 provides a revised version of the research
model. Table 60 is intended to show which variables are “high-leverage” – i.e., appear to impact multiple outcome
measures – versus those that have more isolated effects – i.e., are only related to one outcome measure. In Table 60,
the overall direction of the relationship between predictors and outcomes is shown, with a “+” denoting a positive
relationships and a “-“ denoting a negative relationship. However, Table 60 does not differentiate between direct
versus indirect relationships (see Chapters 4 and 5).
Table 60. Summary of Relations Found in this Research Attitude Task KSA Impact on
Area Overall
Perceived Success
% of Goals Met (continuous & dichotomous)
Management Support + + + Goal Difficulty + - - Team Autonomy + + Goal Clarity + + Internal Processes + + Work Area Routineness + + Team Kaizen Experience - - Team Leader Experience - - Action Orientation + - Functional Heterogeneity + Affective Commitment to Change + Tool Quality + Event Planning Process + Tool Appropriateness
173
Internal Processes
Affective Commitment to Change
Action Orientation
Tool Quality
Attitude Functional Heterogeneity
Management Support
Goal Clarity
Team Autonomy Task KSA
Impact on Area
% of Goals Met
Overall Perceived Success
Goal Difficulty
Work Area Routineness
Team Kaizen Experience
Team Leader Experience
Event Planning Process
Input Factors Process Factors Outcomes
Figure 8. Revised Research Model
As shown, Management Support and Goal Difficulty have the largest number of common relationships, with
significant relationships to three out of four outcome variables. In addition, several other predictors are significantly
related to two outcome variables. Only four significant predictors (Team Functional Heterogeneity, Affective
Commitment to Change, Tool Quality and Event Planning Process) are only significantly related to one outcome
variable.
Although the direction of causality in this research is inferred based on theory and methods, rather than
definitively established by experimental control, in general, the findings suggest the following guidelines for
organizational personnel who plan and/or facilitate Kaizen events:
• First, particular attention should be paid to the event planning stages. This research suggests that
organizations should not short-change this step in order to hold events more quickly and/or to conduct more
events. This research not only demonstrated a direct relationship between the amount of time spent
planning (Event Planning Process) and % of Goals Met, the research also suggests that several other
variables that are largely determined by the event planning process have a significant impact on outcomes –
174
e.g., Goal Clarity, Team Autonomy, Management Support, Team Functional Heterogeneity, Team Kaizen
Experience, and Team Leader Experience.
Second, organizations should recognize t• he key characteristic of proposed candidate events that are
• ven to establishing favorable Internal
Sev tage,
whi
both Attitude and Task KSA, indirectly
• vent but must also be maintained during the
• lated to Attitude, Impact on Area and
• lanning relate to team composition (i.e., team
significantly related to outcomes – e.g., the difficulty of the specified event objectives (Goal Difficulty) and
the complexity of the target work area (Work Are Routineness).
Finally, during the event process, particular attention should be gi
Processes, an appropriate level of Action Orientation and high tool application quality (Tool Quality).
eral key variables are largely determined – or at least highly influenced – during the event planning s
ch occurs after the candidate event has been selected by management:
• For instance, Goal Clarity had a significant positive relationship to
through Internal Processes. This suggests that care must be taken to ensure that the goals of the event have
been carefully scoped such they are clear to all participating members. This further suggests that perhaps
organizations may benefit from additional time devoted to clarifying event objectives and perhaps
additional tools – such as “sensing sessions” or a formal event charter. This finding also suggests that
recommendations in the Kaizen event literature about allowing team members to develop or substantially
refine the event goals during the event may not be advisable.
Team Autonomy, which can be determined in advance of the e
event through the facilitation process, had a positive relationship to Task KSA and Impact on Area,
suggesting that allowing teams more freedom in the solution process has both positive social system
(human resource) benefits and positive technical system benefits.
In addition, Management Support was significantly positively re
Overall Perceived Success. Several aspects of this variable can be established through the event planning
process – e.g., using a standard Kaizen equipment cart, negotiating availability of “offline” support
resources during the event, and communication with top management to ensure buy-in to the event and to
plan the level of management interaction with the team.
The final findings of this research related to event p
selection), which also occurs as part of the planning process. Team Functional Heterogeneity had a
significant negative relationship to Attitude and this tradeoff should be considered in event design to allow
175
countermeasures to be employed to counteract the potential negative effects. Team Kaizen Experience and
Team Leader Experience had negative relationships to Task KSA and again this apparent tradeoff in social
system outcomes should be considered and countermeasures should be taken. It is noted that Team Kaizen
Experience and Team Leader Experience also had a negative relationship to % of Goals Met and, although
the nature of this counterintuitive relationship is not yet understood, organizations may want to consider
that increasing Team Kaizen Experience or Team Leader Experience may not necessarily increase goal
achievement.
research founThis d that two key characteristics of proposed candidate events are significantly related to
outc
Goal Difficulty had a significant positive relationship to Task KSA but a significant negative relationship to
• pact on
be addressed using another change mechanism – i.e., Six Sigma or TQM/CPI teams.
omes. These characteristics are more strategic in nature and may not be as directly controllable by the
facilitators as other event characteristics, because management often makes the final decisions about what events are
held:
•
goal achievement (% of Goals Met) and Impact on Area. Thus, it appears that organizations face a trade-
off in the social system (human resources) benefits achieved from holding more difficult events and the
likely level of technical system outcomes. However, countermeasures can be employed to reduce the
negative effects of Goal Difficulty on technical system outcomes (see the discussion in Chapter 5).
Work Area Routineness had a significant positive relationship to both Task KSA (direct) and Im
Area (indirect through Action Orientation). Thus, less complex work areas appear to provide favorable
“learning laboratories” in that it appears that team members are better able to directly apply lean tools and
concepts and see immediate results. It should be noted that difficult (“stretch”) goals could be established
even in routine work areas; therefore there is not an interchangeable relationship between Work Area
Routineness and Goal Difficulty. However, organizational personnel should balance the benefits of
selecting less complex work areas with the strategic impact of events. It is possible, even likely, that more
complex work areas – particularly those in knowledge processes, such as engineering – may be the overall
bottlenecks in organizational improvement (Murman et al., 2002). This suggests it may be advisable to
continue to hold events that target these work areas, despite the tradeoffs with Task KSA and Impact on
Area, but to employ countermeasures to compensate for work area complexity. Or, these work areas could
176
Fina
to be sig
a key variable in achieving favorable social system outcomes –i.e.,
•
ecreased % of Goals Met.
•
’s tool use should also
It is
have a s the outcome measures. Conceptually, this would not necessarily
lly, several key characteristics of the event process – i.e., activities occurring during the event – were found
nificantly related to event outcomes:
• Internal Processes, i.e., harmonious team interactions – particularly consisting of open communication and
respect for persons – appears to be
increased Attitude and Task KSA. Internal Processes had a direct relationship to both Attitude and Task
KSA and also appears to mediate the impact of Goal Clarity on the outcomes. As discussed in Chapter 5,
there are several steps facilitators and team leaders can take in enabling Internal Processes, such as
establishing ground rules, selecting team members who are “good team players,” and assisting in keeping
team discussions on track. In addition, as mentioned, Goal Clarity appears to act through Internal
Processes and can therefore be used to increase the level of Internal Processes.
Action Orientation is another variable involved in an apparent tradeoff between outcome measures. Action
Orientation was significantly associated with increased Impact on Area but d
These findings suggest that facilitators and teams may face a delicate balance between allowing enough
“offline” time for training, discussing the problem, brainstorming and otherwise analyzing the problem, and
planning solution implementation, and allowing enough time in the target work area for direct observation
and implementation (in cases where implementation is possible). This suggests that design guidelines in
the Kaizen event practitioner literature that advise the team should spend as much time as possible in the
target work do not appear to be a suitable universal recommendation. Although spending the majority of
event time in the target work area does increase perceptions of Impact on Area, it does not appear to ensure
overall event effectiveness in terms of level of goal achievement (% of Goals Met).
Finally, the overall quality of the team’s use of problem-solving tools (Tool Quality) directly predicted
facilitator perceptions of overall success. Thus, it appears that the quality of the team
be carefully managed during the event. This could likely be impacted by the quality of the initial training
(not measured in this study) and well as directly through the facilitation process. In addition, this research
suggests that Management Support acts to increase Tool Quality and to indirectly influence Overall
Perceived Success through Tool Quality.
also interesting to note here that Tool Appropriateness was the only predictor variable that was not found to
ignificant direct or indirect effect to any of
177
seem
6.2 Additional Testing of Model Robustness
Although the conclusions in this research were based on a relatively large sample of events at the team-level
5 el was relatively small (i.e., six organizations). In addition, the
orga
to imply that Tool Appropriateness is not important to event success. Instead, it seems likely that Tool
Appropriateness is not significant due to relatively low range of variation in the data set. Specifically, out of the 51
events in the data set, only two had a Tool Appropriateness rating less than 5.0 and these two events both had ratings
greater than 4.5. Upon closer consideration, this relative lack of variation makes sense because the event facilitators,
who also provided the Tool Appropriateness ratings, often have at least some role in selecting the tools to be used in
a particular event, either by directly selecting the tools or by assisting the team in the tool selection process. Thus, it
appears unlikely that there would be many events for which the facilitator would rate the average Tool
Appropriateness as particularly low, because the facilitator would likely, although not necessarily, intervene if he or
she perceived the team’s tool selection as inappropriate. This perhaps could be addressed in future research by
collecting a Tool Appropriateness rating from a second data source – e.g., perhaps another facilitator in the
organization or a manager who is experienced in continuous improvement activities. However, this could be
difficult in some cases where there is only one Kaizen event facilitator and would also add to the burdens of both
organizations and researchers in collecting this data. In addition, it is possible that the researchers or other external
experts could make judgments about Tool Appropriateness based on the report out file and Event Information Sheet
results; however, it is not clear that enough information would be provided from these documents to provide solid
groundwork for a consistent rating across organizations, particularly since the report out formats – and associated
level of detail – differ across organizations. Finally, the impact of Tool Appropriateness could perhaps be
investigated in post-hoc analysis using Data Envelopment Analysis (DEA) (Charnes et al., 1978) to determine
whether events with the lowest efficiency scores demonstrate any patterns on Tool Appropriateness – e.g., lower
than average scores or at least one tool with a relatively low appropriateness rating, etc.
(i.e., 1 events), the sample at the organizational lev
nizations are all manufacturing organizations of some type, so no purely service organizations were tested,
although the sample did include several events in non-manufacturing processes. Additional testing of the robustness
of model results can be achieved by sampling additional organizations, including some organizations that only or
primarily conduct knowledge work. This will also increase the relative sample size of non-manufacturing versus
manufacturing events.
178
The primary output of this research has been the identification of the most significant set of predictors for each
outcome measure. However, additional research is needed to further test and further understand the nature of these
app
6.3 Testing of Additional Model Parameters
There were several potential input and process variables that were not tested in the research (see Chapter 2,
me of these variables – e.g.,. actual problem-solving tools used,
train
vent outcomes. These variables include direct measures of event scope, event
prio
research focused on identifying what team-level explanatory
arent relationships. As mentioned in Chapter 5, the potential of conducting field quasi-experiments based on this
research appears promising. A baseline of organizational performance could be taken before introducing one of the
design suggestions indicated in this research as having positive effects and the impact of changes to the
organization’s Kaizen process could then be measured.
especially Table 1). Data were collected on so
ing on lean tools and techniques, diversity in Team Kaizen Experience, etc. – that will enable some additional
post-hoc analyses. However, additional variables of interest could also be introduced into the revised research
model for testing in future research. For instance, even though some data were collected on Kaizen event training
duration and content, future research could explicitly measure team member perceptions of Kaizen event training
adequacy. This could be introduced as an additional question in the Management Support construct – if the primary
interest is in the adequacy of the general support provided to the Kaizen event team – or it could be measured as a
stand-alone construct. However, care must be taken to distinguish questions related to the adequacy of the training
session during the Kaizen event (content, clarity, etc.) from team member perceptions of the impact of the event on
their KSAs. Thus, it would be preferable to measure perceptions of training adequacy prior to measuring event
outcomes and to make sure the questions only reflect overall training adequacy and clearly refer to the training
session at the beginning of the event.
This research revealed several new variables that may be interrelated with the predictor variables studied in this
research and/or may be predictors of e
rity (i.e., importance to top management), team effort, team “spirit,” enjoyment of working with peers, and
comfort in working with people from different functions. In addition, it may be desirable to collect facilitator, as
well as team member perceptions of Goal Difficulty. Furthermore, it is suggested that Overall Perceived Success be
expanded into a multi-item measure in future research.
Finally, this research did not include any explanatory variables that were explicitly measured at the
organizational-level. This was due to the fact that this
179
vari
6.4 Research on Sustainability of Event Outcomes
This research focused on measuring the initial outcomes of Kaizen events and identifying what event input and
t mes. This research did not aim to measure the sustainability
of e
ables predict event outcomes. However in future research, data could be collected on additional organizational-
level variables expected to contribute to positive event outcomes – e.g., organizational commitment to Kaizen
events, organizational trust, etc. In order to build a hierarchical model, a substantially larger sample size at the
organizational level than the original six organizations studied is needed (see the discussion in Chapter 4 and
Chapter 5).
even process factors are most strongly related to outco
vent outcomes or identify factors that support or inhibit sustainability. For organizations to make effective use
of Kaizen events as an improvement vehicle, two things are needed. First, organizations must be able to effectively
execute events in order to consistently generate positive outcomes – both technical system outcomes and social
system outcomes. The outcomes of this research – i.e. the proposed guidelines for organizations – can help
organizations with this objective. Second, organizations must be able to largely sustain outcomes in the long-term.
This research did not address this objective, and additional research is needed to measure the sustainability of event
outcomes in organizations and to identify factors related to sustainability. As has been mentioned, there is an
ongoing research initiative at OSU and VT to study the sustainability of event outcomes. This initiative and the
research described in this document are both part of a three year study which received funding from NSF in 2005.
The first study year (2005-2006) focused on initial outcomes and contained the work described in this document.
The next two study years (2006-2007 and 2007-2008) will focus on the sustainability of event outcomes.
180
REFERENCES Adam, EE., Jr. (1991), “Quality Circle Performance,” Journal of Management, Vol. 17 No. 1, pp. 25-39. Adams, M., Schroer, B.J., & Stewart, S.K. (1997), “QuickstepTM Process Improvement: Time-Compression as a Management Strategy,” Engineering Management Journal, Vol. 9 No. 2, pp. 21-32. Alwin, D.F. & Hauser, R.M. (1975), “The Decomposition of Effects in Path Analysis,” American Sociological Review, Vol. 40, pp. 37-47. Amabile, T.M. (1989), “The Creative Environment Scales: Work Environment Inventory,” Creativity Research Journal, Vol. 2, pp. 231-253. Amason, A.C. & Schweiger, D.M. (1994), “Resolving the Paradox of Conflict, Strategic Decision Making and Organizational Performance,” International Journal of Conflict Management, Vol. 5, pp. 239-253. Ancona, D. & Caldwell, D.F. (1992), “Demography and Design: Predictors of New Product Team Performance,” Organization Science, Vol. 3, pp. 321-341. Anderson, N. & West, M. (1996), “The Team Climate Inventory: The Development of the TCI and its Application in Team Building for Innovativeness,” European Journal of Work and Organizational Psychology, Vol. 5, pp. 53-66. Anderson, N. & West, M. (1998), “Measuring Climate for Work Group Innovation: Development and Validation of the Team Climate Inventory,” Journal of Organizational Behavior, Vol. 19, pp. 235-258. Atkinson, J. (1958), “Toward Experimental Analysis of Human Motivation in Terms of Motives, Expectancies and Incentives.” Motives in Fantasy, Action and Society, Atkinson, J., ed., Princeton, NJ: Van Nostrand, pp. 288-305. Azzi, A.E. (1993), “Implicit and Category-Based Allocations of Decision-Making Power in Majority-Minority Relations,” Journal of Experimental Psychology, Vol. 29, pp. 203-228. Baker, P. (2005), “The Value of Learning” Works Management, Vol. 58 No. 3, pp. 19. Bane, R. (2002), “Leading Edge Quality Approaches in Non-Manufacturing Organizations,” Quality Congress. ASQ’s … Annual Quality Proceedings, pp. 245-249 Baron, R.A. (1990), “Countering the Effects of Destructive Criticism: The Relative Efficacy of Four Interventions,” Journal of Applied Psychology, Vol. 75, pp. 235-245. Baron, R.M. & Kenny, D.A. (1986), “The Moderator-Mediator Variable Distinction in Social Psychological Research: Conceptual, Strategic and Statistical Considerations,” Journal of Personality and Social Psychology, Vol. 51, pp. 1173-1182. Bartko, J.J. (1976), “On Various Intraclass Correlation Reliability Coefficients,” Psychological Bulletin, Vol. 83 No. 5, pp. 762-765. Bassiri, D. (1998), “Large and Small Sample Properties of the Maximum Likelihood Estimates for the Hierarchical Linear Model,” Unpublished Doctoral Dissertation, Michigan State University: East Lansing, MI Bateman, N. (2005), “Sustainability: The Elusive Element in Process Improvement,” International Journal of Operations and Production Management, Vol. 25 No. 3, pp. 261-276. Bateman, N. & David, A. (2002), “Process Improvement Programmes: A Model for Assessing Sustainability,” International Journal of Operations and Production Management, Vol. 22 No. 5, pp. 515-526.
181
Batt, R. & Appelbaum, E. (1995), “Worker Participation in Diverse Settings: Does the Form Affect the Outcome, and If So, Who Benefits?” British Journal of Industrial Relations, Vol. 33 No. 3, pp. 353-378. Beckett, A. J., Wainwright, C. E. R., & Bance D. (2000), “Implementing an Industrial Continuous Improvement System: A Knowledge Management Case Study,” Industrial Management & Data Systems, Vol. 100 No. 7, pp. 330-338. Belassi, W. & Tukel, O.I. (1996), “A New Framework for Determining Critical Success/Failure Factors in Projects,” International Journal of Project Management, Vol. 14 No. 3, pp. 141-151. Bicheno, J. (2001), “Kaizen and Kaikaku.” Manufacturing Operations and Supply Chain Management: The LEAN Approach, Taylor, D, and Brunt, D., eds., London, UK: Thomson Learning, pp. 175-184. Bititci, U.S., Turner, T., & Begemann, C. (2000), “Dynamics of Performance Measurement Systems,” International Journal of Project Management, Vol. 20 No. 6, pp. 692-704. Blalock, H.M., Jr. (1972), Social Statistics, 2nd Edition, New York: McGraw Hill Companies, Inc. Bliese, P.D. (2000), “Within-Group Agreement, Non-Independence, and Reliability: Implications for Data Aggregation and Analysis.” Multilevel Theory, Research and Methods in Organizations, Klein, K. J., and Kozlowski, S.W.J., eds., San Francisco: Jossey-Bass, pp. 349-381. Bliese, P.D. & Halverson, R.R. (1998), “Group Size and Measures of Group-Level Properties: An Examination of Eta-Squared and ICC Values,” Journal of Management, Vol. 24 No. 2, pp. 157-172. Bliese, P.D., Halverson, R.R., & Rothberg, J.M. (1994), “Within-Group Agreement Scores: Using Resampling to Estimate Expected Variance,” Academy of Management Best Paper Proceedings, 303-307. Bliese, P.D. & Hanges, P.J. (2004), “Being Too Liberal and Too Conservative: The Perils of Treating Grouped Data as Though They Were Independent,” Organizational Research Methods, Vol. 7 No. 4, pp. 400-417. Bodek, N. (2002), “Quick and Easy Kaizen,” IIE Solutions, Vol. 34 No. 7, pp. 43-45. Bowen, D.E. & Youngdahl, W.E. (1998), “’Lean’ Service: In Defense of a Production-Line Approach,” International Journal of Service Industry Management, Vol. 9 No. 3, pp. 207-225. Bozzone, V. (2002). Speed to Market: Lean Manufacturing for Job Shops, 2nd ed., Amacom: New York. Bradley, J.R. & Willett, J. (2004), “Cornell Students Participate in Lord Corporation’s Kaizen Projects,” Interfaces, Vol. 34 No. 6, pp. 451-459. Breitkopf, C.R. (2006), “Perceived Consequences of Communicating Organ Donor Wishes: An Analysis of Beliefs about Defending One’s Decision,” Psychology and Health, Vol. 21 No. 4, pp. 481- 497.
Breslow, N. (1990), “Tests of Hypotheses in Overdispersed Poisson Regression and Other Quasi-Likelihood Models,” Journal of the American Statistical Association, Vol. 85 No. 410, pp. 565- 571.
Brunet, A. P. & New, S. (2003), “Kaizen in Japan: An Empirical Study,” International Journal of Operations and Production Management, Vol. 23 No.12, pp. 1426-1446.
Burke, M.J. & Dunlap, M.S. (2002), “Estimating Interrater Agreement with the Average Deviation Index: A User’s Guide,” Organizational Research Methods, Vol. 5 No.2, pp. 159-172. Burke, M.J., Finkelstein, L.M., & Dusig, M.S. (1999), “On Average Deviation Indices for Estimating Interrater Agreement,” Organizational Research Methods, Vol. 2 No.1, pp. 49-68.
182
Butterworth, C. (2001), “From Value Stream Mapping to Shop Floor Improvement: A Case Study of Kaikaku.” Manufacturing Operations and Supply Chain Management: The LEAN Approach, Taylor, D, and Brunt, D., eds., London, UK: Thomson Learning, pp. 185-193. Campion, M.A., Medsker, G.J., & Higgs, A.C. (1993), “Relations between Work Group Characteristics and Effectiveness: Implications for Designing Effective Work Groups,” Personnel Psychology, Vol. 46, pp. 823-850. Chan, D. (1998), “Functional Relationships Among Constructs in the Same Content Domain at Different Levels of Analysis: A Typology of Composition Models,” Journal of Applied Psychology, Vol. 83 No. 2, pp. 234-246. Chang, Y. (2000), “Residual Analysis of the Generalized Linear Models for Longitudinal Data,” Statistics in Medicine, Vol. 19 No. 10, pp. 1277-1293. Charnes, A., Cooper, W. W., & Rhodes, E. (1978), “Measuring the Efficiency of Decision Making Units,” European Journal of Operational Research, Vol. 2, pp. 429-444. Chow-Chua, C. & Goh, M. (2000), “Quality Improvement in the Healthcare Industry: Some Evidence from Singapore,” International Journal of Health Care Quality Assurance, Vol. 13 No. 5, pp. 223-229. Clark, K. (2004), “The Art of Counting,” Chain Store Age, Vol. 80 No. 10, pp. 94-96 (2 pgs). Cohen, S.G. & Bailey, D.E. (1997), “What Makes Team Work: Group Effectiveness Research from the Shop Floor to the Executive Suite,” Journal of Management, Vol. 23 No. 3, pp. 239-290. Cohen, S.G. & Ledford, G.E. (1994), “The Effectiveness of Self-Managing Teams: A Quasi-Experiment,” Human Relations, Vol. 47 No. 1, pp. 13-43. Cohen, S.G., Ledford, G.E., & Spreitzer, G.M. (1996), “A Predictive Model of Self-Managing Work Team Effectiveness,” Human Relations, Vol. 49 No. 5, pp. 643-676. Colonge, J.B., Carter, R.L., Fujita, S., & Ban, S. (1993), “Application of Generalized Estimating Equations to a Study of In Vitro Radiation Sensitivity,” Biometrics, Vol. 49 No. 3, pp. 927-934. Cooney, R. (2002), “Is ‘Lean’ a Universal Production System? Batch Production in the Automotive Industry,” International Journal of Operations & Production Management, Vol. 22 No. 10, pp. 1130-1147. Cordery, J.L., Mueller, W.S., & Smith, L.M. (1991), “Attitudinal and Behavioral Effects of Autonomous Group Working: A Longitudinal Field Setting,” Academy of Management Journal, Vol. 34 No. 2, pp. 464-476. Creswell, J. (2001), “America’s Elite Factories,” Fortune, Vol. 144, No. 4, pp. 206A (6 pgs). Cronbach, L. (1951), “Coefficient Alpha and the Internal Structure of Tests,” Psychiatrika, Vol. 16, pp. 297-334. Cronbach, L. & Meehl, P. (1955), “Construct Validity in Psychological Tests,” Psychological Bulletin, pp. 281-302. Crossan, M.M., Lane, H.W., & White, R.E. (1999), “An Organizational Learning Framework: From Intuition to Institution,” Academy of Management Review, Vol. 24 No. 3, pp. 522-537. Cuscela, K. N. (1998), “Kaizen Blitz Attacks Work Processes at Dana Corp.,” IIE Solutions, Vol. 30 No. 4, pp. 29-31. Dansereau, F., Alutto, J.A., & Yammarino, F.J. (1984), Theory Testing in Organizational Behavior: The Varient Approach, Englewood Cliffs, NJ: Prentice-Hall. David, I. (2000), “Drilled in Kaizen,” Professional Engineering, Vol. 13 No. 9, pp. 30-31.
183
Davison, M.L., Kwak, N., Seo, Y.S., & Choi, J. (2002), “Using Hierarchical Linear Models to Examine Moderator Effects: Person-by-Organization Interactions,” Organizational Research Methods, Vol. 5 No. 3, pp. 231-254. DeCoster, J. (2002), “Using ANOVA to Examine Data from Groups and Dyads,” Available URL: http://www.stat-help.com/notes.html, October 17, 2006. DeGreene, K. (1973), Sociotechnical Systems, Englewood Cliffs, NJ: Prentice-Hall. Demers, J. (2002), “The Lean Philosophy,” CMA Management, Vol. 76 No. 7, pp. 31-33. DeVellis, R. F. (1991), Scale Development: Theory and Application, Newbury Park, CA: Sage Publishing. Doolen, T.L., Hacker, M.E., & Van Aken, E.M. (2003a), “The Impact of Organizational Context on Work Team Effectiveness: A Study of Production Teams,” IEEE Transactions on Engineering Management, Vol. 50 No. 3, pp. 285-296. Doolen, T.L., Worley, J., Van Aken, E. M., and Farris, J. (2003b), “Development of an Assessment Approach for Kaizen Events,” Proceedings of the 2003 Industrial Engineering and Research Conference, Portland, OR, May 18-20, 2003, CD-ROM. Drickhamer, D. (2004a), “Just-In-Time Training,” Industry Week, Vol. 253 No. 7, pp. 69. Drickhamer, D. (2004b), “Braced for the Future,” Industry Week, Vol. 253 No. 10, pp. 51-52. Drum, M. & McCullagh, P. (1993), “[Regression Models for Discrete Longitudinal Responses]: Comment,” Statistical Science, Vol. 8 No. 3, pp. 300-301. Druskat, V.U. & Pescosolido, A.T. (2000), “The Context of Effective Teamwork Mental Models in Self-Managing Teams: Ownership, Learning, and Heedful Interrelating,” Proceedings of the 2000 Academy of Management Annual Meeting, Toronto, August 4-9, 2000. Duncan, G.M. (1972), “Characteristics of Organizational Environments and Perceived Environmental Uncertainty,” Administrative Science Quarterly, Vol. 17, pp. 313-327. Dunlap, M.S., Burke, M.J., & Smith-Crowe, K. (2003), “Accurate Tests of Statistical Significance for rwg and Average Deviation Interrater Agreement Indexes,” Journal of Applied Psychology, Vol. 88 No.2, pp. 356-362. Durham, C.C., Knight, D., & Locke, E.A. (1997), “Effects of Leader Role, Team-Set Goal Difficulty, Efficacy, and Tactics on Team Effectiveness,” Organizational Behavior and Human Decision Processes, Vol. 72 No. 2, pp. 203-231. Earley, P.C., Connolley, T., & Ekegren, G. (1989), “Goals, Strategy Development and Task Performance: Some Limits on the Efficacy of Goal Setting,” Journal of Applied Psychology, Vol. 74 No.1, pp. 24-33. Earley, P.C. & Mosakowski, E. (2000), “Creating Hybrid Team Cultures: An Empirical Test of Transnational Team Functioning,” Academy of Management Journal, Vol. 43 No.1, pp. 26-49. Easton, G. & Jarrell, J.D. (1998), “The Effects of Total Quality Management on Corporate Performance: An Empirical Investigation,” Journal of Business, Vol. 71 No. 2, pp. 253-307. Edmondson, A.C. (2002), “The Local and Variegated Nature of Learning in Organizations: A Group-Level Perspective,” Organization Science, Vol. 13, No. 2. Emery, F.E. & Trist, E.L. (1960), “Sociotechnical Systems.” Management Sciences: Models and Techniques, Churchman, C.W., and Verhulst, M., eds., Oxford, UK: Pergamon, pp. 83-97.
Emrich, L.J. & Piedmonte, M.R. (1992), “On the Small Sample Properties of the Generalized Estimating Equation Estimates for Multivariate Dichotomous Outcomes,” Journal of Statistical Computing and Simulation, Vol. 41, pp. 19-29. Erez, M. & Zidon, I. (1984), “Effects of Goal Acceptance on the Relationship of Goal Setting and Task Performance,” Journal of Applied Psychology, Vol. 69, pp. 69-78. Fabrigar, L.R., Wegener, D.T., MacCallum, R.C., & Strahan, E.J. (1999), “Evaluating the Use of Exploratory Factor Analysis in Psychological Research,” Psychological Methods, Vol. 4 No. 3, pp. 272-299. Farris, J. & Van Aken, E.M. (2005), “Benchmarking Kaizen Event Success: Best Practices Report,” Technical Report 05D-02 (41 pages). Blacksburg, Virginia: Virginia Polytechnic Institute and State University, Department of Industrial and Systems Engineering. Farris, J., Van Aken, E.M., Doolen, T. L., & Worley, J. (2004), “Longitudinal Analysis of Kaizen Event Effectiveness,” Proceedings of the 2004 Industrial Engineering and Research Conference, Houston, TX, May 15-19, 2004, CD-ROM. Farris, J., Van Aken, E. M., Doolen, T. L., and Worley, J. (2006), “Learning from Kaizen Events: A Research Methodology for Determining the Characteristics of More – and Less – Successful Events.” Proceedings of the 2006 American Society for Engineering Management Conference, Huntsville, AL, October 25-28, 2006, CD-ROM. Field, A. (2005), Discovering Statistics Using SPSS. 2nd edition. London: Sage Publications Ltd. Finch, H. (2006), “Comparison of the Performance of Varimax and Promax Rotations: Factor Structure Recovery for Dichotomous Items,” Journal of Educational Measurement, Vol. 43 No. 1, pp. 39-52. Foley, S., Linnehan, F., Greenhaus, J.H., & Weer, C.H. (2006), “The Impact of Gender Similarity, Racial Similarity, and Work Culture on Family-Supportive Supervision,” Group & Organization Management, Vol. 31 No. 4, pp. 420-441. Foreman, C.R. & Vargas, D.H. (1999), “Affecting the Value Chain through Supplier Kaizen,” Hospital Materiel Management Quarterly, Vol. 20 No. 3, pp. 21-27. “Get Smart, Get Lean” (2003), Upholstery Design & Management, Vol. 16 No. 8, pp. 15-19. George, J.M. (1990), “Personality, Affect, and Behavior in Groups,” Journal of Applied Psychology, Vol. 75, pp. 107–116. George, J.M. & Zhou, J. (2001), “When Openness to Experience and Conscientiousness are Related to Creative Behavior,” Journal of Applied Psychology, Vol. 75, pp. 107–116. Gibson, C. & Vermeulen, F. (2003), “A Healthy Divide: Subgroups as a Stimulus for Team Learning Behavior,” Administrative Science Quarterly, Vol. 48 No. 2, pp. 202–239. Gregory, A. (2003), “Haring for Change,” Works Management, Vol. 56 No. 5, pp. 18-21 (3 pgs). Griffin, R.W. (1988), “Consequences of Quality Circles in an Industrial Setting: A Longitudinal Assessment,” Academy of Management Journal, Vol. 31 No. 2, pp. 338-358. Groesbeck, R. (2001), “An Empirical Study of Group Stewardship and Learning: Implications for Work Group Effectiveness,” Unpublished Doctoral Dissertation, Grado Department of Industrial and Systems Engineering, Virginia Tech, Blacksburg: VA. Gulbro, R. D., Shonesy, L. & Dreyfus, P. (2000) “Are Small Manufacturers Failing the Quality Test?” Industrial Management & Data Systems, Vol. 100 No. 2, pp. 76-80.
185
Gunsolley, J.C., Getchell, C., & Chinchilli, V.M.. (1995), “Small Sample Characteristics of Generalized Estimating Equations,” Communications in Statistics -- Simulation, Vol. 24, pp. 869–878. Gupta, P.P., Dirsmith, M.W., & Fogarty, T.J. (1994), “Coordination and Control in a Government Agency: Contingency and Institutional Theory Perspectives on GAO Audits,” Administrative Science Quarterly, Vol. 39, pp. 264-284. Haggard, E.A. (1958), Intraclass Correlation and the Analysis of Variance, New York: The Dryden Press. Hammer, D.P., Mason, H.L., Chalmers, R.K., Popovich, N.G., & Rupp, M.T. (1996), “Development and Testing of an Instrument to Assess Behavioral Professionalism of Pharmacy Students,” Journal of Pharmaceutical Education, Vol. 64, pp. 141–151. Hammersley, G. & Pinnington, A. (1999), “Employee Response to Continuous Improvement Groups,” The TQM Magazine, Vol. 11 No. 1, pp. 29–34. Hanley, J.A., Negassa, A., deB. Edwardes, M.D., & Forrester, J.E. (2003), “Statistical Analysis of Correlated Data Using Generalized Estimating Equations: An Orientation,” American Journal of Epidemiology, Vol. 157 No. 4, pp. 364–375. Hardin, J. W. & Hilbe, J.M. (2003), Generalized Estimating Equations, Boca Raton, FL: Chapman & Hall/CRC. Harrington, J. H. (1998), “Performance Improvement: The Rise and Fall of Reengineering,” The TQM Magazine, Vol. 10 No. 2, pp. 69–71. Hart, S.H., Moncrief, W.C., & Parasuraman, J. (1989), “An Empirical Investigation of Salespeople’s Performance, Effort and Selling Method During a Sales Contest,” Journal of the Academy of Marketing Science, Vol. 17 No. 1, pp. 29–39. Harvey, J. (2004), “Match the Change Vehicle and Method to the Job,” Quality Progress, Vol. 37 No. 1, pp. 41-48. Hasek, G. (2000), “Extraordinary Extrusions,” Industry Week, Vol. 249 No. 17, pp. 79-80. Hayes, B.E. (1994), “How to Measure Empowerment,” Quality Progress, Vol. 27 No. 2, pp. 41–46. Heard, E. (1997), “Rapid-Fire Improvement with Short-Cycle Kaizen,” Proceedings of the American Production and Inventory Control Society, Washington, DC, October 26-29, 1997, pp. 519-523. Heard, E. (1998), “Continuous Improvement: Putting Commitment to Work through Short-Cycle Kaizen,” National Productivity Review, Vol. 17 No. 3, pp. 75–79. Herscovitch, L. & Meyer, J. P. (2002), “Commitment to Organizational Change: Extension of a Three-Component Model,” Journal of Applied Psychology, Vol. 87 No. 3, pp. 474-487. Horton, N.J. & Lipsitz, S.R. (1999) “Review of Software to Fit Generalized Estimating Equation Regression Models,” The American Statistician, Vol. 53 No.2, pp. 160-169. Hox, J.J. (1994), “Hierarchical Regression Models for Interviewer and Respondent Effects,” Sociological Methods and Research, Vol. 17 No. 1, pp. 300–316. Hyatt, D.E. & Ruddy, T.M. (1997), “An Examination of the Relationship between Work Group Characteristics and Performance: Once More into the Breech,” Personnel Psychology, Vol. 50 No. 3, pp. 553-585. Imai, M. (1986), Kaizen: The Key to Japan’s Competitive Success, New York: Random House.
186
Institute of Industrial Engineers, (2006) “Definition of Industrial Engineering,” IIE Bylaws, Article B-II, Purposes Section, Available URL: http://www.iienet2.org/Details.aspx?id=283, December 5, 2006. iSixSigma LLC, (2005) “Kaizen,” Available URL: http://www.isixsigma.com/dictionary/Kaizen-42.htm, April 29, 2005. Ivancevich, J.M. & McMahon, J. T. (1977), “A Study of Task-Goal Attributes, Higher Order Need Strength, and Performance,” Academy of Management Journal, Vol. 20 No. 4, pp. 552-563. Jackson, S. (1992), “Team Composition in Organizations.” Group Process and Productivity, Worchel, S, Wood, W. and Simpson, J., eds., London, UK: Sage, pp. 1-12. James, L.R. (1982), “Aggregation Bias in Estimates of Perceptual Agreement,” Journal of Applied Psychology, 69 (2), pp. 219-229. James, L.R., Demaree, R.G., & Wolf, G. (1984), “Estimating Within-Group Interrater Reliability with and without Response Bias,” Journal of Applied Psychology, 69, pp. 3-32. James, L.R., Demaree, R.G., & Wolf, G. (1993), “rwg: An Assessment of Within-Group Interrater Agreement,” Journal of Applied Psychology, Vol. 78 No. 2, pp. 306-309. James, L.R. & Williams, L.J. (2000), “The Cross-Level Operator in Regression, ANCOVA, and Contextual Analysis.” Multilevel Theory, Research and Methods in Organizations, Klein, K. J., and Kozlowski, S.W.J., eds., San Francisco: Jossey-Bass, pp. 382-424. James-Moore, S.M. & Gibbons, A. (1997) “Is Lean Manufacture Universally Relevant? An Investigative Methodology,” International Journal of Operations & Production Management, Vol. 17 No. 9, pp. 899-911. Jehn, K. & Bezrukova, K. (2004), “A Field Study of Group Diversity, Workgroup Context, and Performance,” Journal of Organizational Behavior, Vol. 25 No. 6, pp. 703-729. Jehn, K., Northcraft, G., & Neale, M. (1999), “Why Differences Make a Difference: A Field Study of Diversity, Conflict, and Performance in Workgroups,” Administrative Science Quarterly, Vol. 44 No. 4, pp. 741-763. Jetten, J., Duck, J., Terry, D.J., & O’Brien, A. (2002), “Being Attuned to Intergroup Differences in Mergers: The Role of Aligned Leaders for Low-Status Groups,” Administrative Science Quarterly, Vol. 28 No. 9, pp. 1194 -1201. Jha, S., Michela, J., & Noori, H. (1999), “Within the Canadian Boundaries: A Close Look at Canadian Industries Implementing Continuous Improvement,” The TQM Magazine, Vol. 11 No. 3, pp. 188–197. Jha, S., Noori, H., & Michela, J. (1996), “The Dynamics of Continuous Improvement: Aligning Organizational Attributes for Quality and Productivity,” International Journal of Quality Science, Vol. 1 No. 1, pp. 19–47. Jina, J., Bhattacharya, A.K., & Walton, A.D. (1997), “Applying Lean Principles for High Product Variety and Low Volumes: Some Issues and Propositions,” Logistics Information Management, Vol. 10 No. 1, pp. 5-13 Johnson, D.E. (1998), Applied Multivariate Methods for Data Analysis. Pacific Grove, CA: Brooks/Cole Publishing Company. Judd, C.M. & Kenny, D.A. (1981), “Process Analysis: Estimating Mediation in Treatment Evaluations,” Evaluation Review, Vol. 5, pp. 602-619. Jusko, J. (2004), “Lonely at the Top,” Industry Week, Vol. 253 No. 10, pp. 58-59. Katz, D. & Kahn, R.L. (1966), The Social Psychology of Organizations, New York: Wiley.
Keating, E.K., Oliva, R., Repenning, N.P., Rockart, S. & Sterman, J.D. (1999), “Overcoming the Improvement Paradox,” European Management Journal, Vol. 17 No. 2, pp. 120-134. Kenny, D.A. (2006), “Mediation,” Available URL: http://davidakenny.net/cm/mediate.htm, November 7, 2006. Kenny, D.A. & Judd, C.M. (1986), “Consequences of Violating the Independence Assumptions in Analysis of Variance,” Psychological Bulletin, Vol. 99 No. 3, pp. 422-431. Kenny, D.A., Kashy, D.A. & Bolger, N. (1998), “Data Analysis in Social Psychology.” The Handbook of Social Psychology, Gilbert, D., Fiske, S.T., and Lindzey, G., eds., Boston: McGraw Hill, Vol. 1, pp. 233-265. Kenny, D.A. & La Voie, L. (1985), “Separating Individual and Group Effects,” Journal of Personality and Social Psychology, Vol. 48 No. 2, pp. 339-348. “Keys to Success” (1997), Industry Week, Vol. 246 No. 16, pp.20-21. Kirby, K. & Greene B. (2003), “How Value Stream Type Affects the Adoption of Lean Production Tools and Techniques,” Proceedings of the 2003 Industrial Engineering and Research Conference, Portland, OR, May 18-20, 2003, CD-ROM.
Kirkman, B.L. & Shapiro, D.L. (1997), “The Impact of Cultural Values on Employee Resistance to Teams: Toward a Model of Globalized Self-Managing Work Team Effectiveness,” Academy of Management Review, Vol. 22, pp. 730-745. Kirkman, B.L. & Rosen, B. (1999), “Beyond Self-Management: Antecedents and Consequences of Team Empowerment,” Academy of Management Journal, Vol. 42 No. 1, pp. 58-74. Klaus, L.A. (1998), “Kaizen Blitz Proves Effective for Dana Corporation,” Quality Progress, Vol. 31 No. 5, pp. 8. Klein, K. J. & Kozlowski, S.W.J. (2000), “From Micro to Meso: Critical Steps in Conceptualizing and Conducting Multilevel Research,” Organizational Research Methods, Vol. 3 No. 3, pp. 211-236. Kleinsasser, J. (2003), “Kaizen Seminar Brings Change to Library, Purchasing Processes,” Inside WSU, Available URL: http://webs.wichita.edu/dt/insidewsu/show/article.asp?270, March 20, 2004. Kline, P. (1994), An Easy Guide to Factor Analysis, London: Routledge. Kosandal, P. & Farris, J. (2004), “The Strategic Role of the Kaizen Event in Driving and Sustaining Organizational Change,” Proceedings of the 2004 American Society for Engineering Management Conference, Alexandria, VA, October 20-23, 2004, pp. 517-526. Kotter, J. (1995), “Leading Change: Why Transformation Efforts Fail,” Harvard Business Review, Vol. 73 No. 2, pp. 59-67. Kozlowski, S.W.J. & Hattrup, K. (1992), “A Disagreement about Within-Group Agreement: Disentangling issues of consistency versus consensus,” Journal of Applied Psychology, Vol. 77 No.2, pp. 161-167. Kozlowski, S.W.J. & Hults, B.M. (1987), “An Exploration of Climates for Technical Updating and Performance,” Personnel Psychology, Vol. 40, pp. 539-563. Kumar, S. & Harms, R. (2004), “Improving Business Processes for Increased Operational Efficiency: A Case Study,” Journal of Manufacturing Technology Management, Vol. 15 No. 7, pp. 662-674. Laraia, A. (1998), “Change it NOW!” Manufacturing Engineering, Vol. 121 No. 4, pp. 152.
188
Laraia, A. C., Moody, P. E., & Hall, R. W. (1999), The Kaizen Blitz: Accelerating Breakthroughs in Productivity and Performance, New York: The Association for Manufacturing Excellence. Larson, M. (1998a), “Five Days to a Better Process: Are You Ready for Kaizen,” Quality, Vol. 37 No. 6, pp. 38. Larson, M. (1998b), “Lantech’s Kaizen Diary: Monday through Friday,” Quality, Vol. 37 No. 6, pp. 40. Lawal, B. (2003), Categorical Data Analysis with SAS and SPSS Applications, London: Lawrence Erlbaum Associates, Inc. Lawler . E.E. and S.A. Mohrman. (1985), “Quality Circles after the Fad,” Harvard Business Review, 85, 1, pp. 64-71. Lawler . E.E. and S.A. Mohrman. (1987), “Quality Circles: After the Honeymoon,” Organizational Dynamics, 19, pp. 15-26 Lawyer, S.R., Resnick, H.S., Galea, S., Ahern, J., Kilpatrick, D.G., & Vlahov, D. (2006), “Predictors of Peritraumatic Reactions and PTSD Following the September 11th Terrorist Attacks,” Psychiatry Vol. 69 No. 2, pp. 130-141. LeBlanc, G. (1999), “Kaizen at Hill-Rom,” Center for Quality of Management Journal, Vol. 8 No. 2, pp. 49-53. Leedy, P.D. & Ormrod, J.E. (2005), Practical Research: Planning and Design, (8th ed.), Upper Saddle River, NJ: Prentice Hall. Letens, G., Farris, J. & Van Aken, E. M. (2006), “Development and Application of a Framework for the Design and Assessment of a Kaizen Event Program.” Proceedings of the 2006 American Society for Engineering Management Conference, Huntsville, AL, October 25-28, 2006, CD-ROM. Lewis, J.P. (2000), The Project Manager’s Desk Reference, New York: McGraw Hill Companies, Inc. Liang, K.Y. & Zeger, S.L. (1986), “Longitudinal Data Analysis using Generalized Linear Models,” Biometrika, Vol. 73, pp. 13-22. Lipsitz, S. (1999), Lecture Notes on the GEE for BMTRY 726. Department of Biometry and Epidemiology, MUSC, Charleston, SC. Locke, E.A. & Latham, G.P. (1990), A Theory of Goal Setting and Task Performance, Englewood Cliffs, NJ: Prentice Hall. Locke, E.A. & Latham, G.P. (2002), “Building a Practically Useful Theory of Goal Setting and Task Motivation: A 35-Year Odyssey,” American Psychologist, Vol. 57 No. 9, pp. 705-717. Lovelace, D., Shapiro, D.L., & Weingart, L.R. (2001), “Maximizing Cross-Functional New Product Teams’ Innovativeness and Constraint Adherence: A Conflict Communications Perspective,” Academy of Management Journal, Vol. 44 No. 4, pp. 779-793. MacKinnon, D.P., Krull, J.L., & Lockwood, C.M. (2000), “Equivalence of the Mediation, Confounding and Suppression Effect,” Prevention Science, Vol. 1 No. 4, pp. 173-181. MacKinnon, D.P., West, G., & Dwyer, J.H. (1995), “A Simulation Study of Mediated Effect Measures,” Multivariate Behavioral Research, Vol. 30 No. 1, pp. 41-62. Marks, M.L., Mirvis, P.H., Hackett, E.J., & Grady, J.F. (1986), “Employee Participation in a Quality Circle Program: Impact on Quality of Work Life, Productivity, and Absenteeism,” Journal of Applied Psychology, Vol. 71, pp. 61-69.
189
Martin, B.A.., Snell, A.F., & Callahan, C.M. (1999), “An Examination of Individual Differences in the Relation of Subjective Goal Difficulty to Performance in a Goal-Setting Model,” Human Performance, Vol. 12 No.2, pp. 115-135. Martin, D.W. (1996), Doing Psychology Experiments, (4th ed.), Pacific Grove, CA: Brooks/Cole Publishing Company. Martin, K. (2004), “Kaizen Events: Achieving Dramatic Improvement through Focused Attention and Team-Based Solutions,” Society for Health Systems Newsletter, August 2004, pp. 6-7. McNichols, T., Hassinger, R., & Bapst, G.W. (1999), “Quick and Continuous Improvement Through Kaizen Blitz,” Hospital Materiel Management Quarterly, Vol. 20 No. 4, pp. 1–7. McGarrie, B. (1998), “Case Study: Production Planning and Control - Selection, Improvement and Implementation,” Logistics Information Management, Vol. 11 No. 1, pp. 44–52. McGrath, J.E. (1984), Groups: Interaction and Performance, Englewood Cliffs, NJ: Prentice-Hall. Melnyk, S. A., Calantone, R. J., Montabon, F. L., & Smith, R. T. (1998), “Short-term Action in Pursuit of Long-Term Improvements: Introducing Kaizen Events,” Production and Inventory Management Journal, Vol. 39 No. 4, pp. 69-76. Mika, G. L. (2002), Kaizen Event Implementation Manual, 2nd Edition, Wake Forest, NC: Kaizen Sensei. Miller, B.D. (2004), “The Role of Cognitive Psychology in Lean Manufacturing Research,” Proceedings of the 2004 Industrial Engineering and Research Conference, Houston, TX, May 15-19, 2004, CD-ROM. Miltenberg, J. (1995), Manufacturing Strategy, Portland, OR: Productivity Press. Minton, E. (1998), “Profile: Luke Faulstick—‘Baron of blitz’ has Boundless Vision of Continuous Improvement,” Industrial Management, Vol. 40 No. 1, pp. 14-21. Mohr, M. L. & Mohr, H. (1983), Quality Circles, Menlo Park, CA: Addison-Wesley Publishing Company. Molleman, E. (2005), “The Multilevel Nature of Team-Based Work Research,” Team Performance Management, Vol. 11 No. 3/4, pp. 113-124. Monden, Y. (1983), Toyota Production System, Norcross, GA: Industrial Engineering and Management Press. Montgomery, D.C., & Runger, G.C. (1999), Applied Statistics and Probability for Engineers (2nd ed.), New York: John Wiley & Sons, Inc. Muchinsky, P.M. (2000), Psychology Applied to Work, (6th ed.), Belmont, CA: Wadsworth/ Thomson Learning. Murman, E., Allen, T., Bozdogan, K., Cutcher-Gershenfeld, J., McManus, H., Nightingale, E., Rebentisch, E., Shields, T., Stahl, F., Walton, M., Warmkessel, J., Weiss, S., and Widnall, S, (2002), Lean Enterprise Value, London: Palgrave. Neter, J., Kutner, M.H., Nachtsheim, C.J., & Wasserman, W. (1996), Applied Linear Statistical Models (4th ed.), New York: McGraw-Hill Companies, Inc. Nicolini, D. (2002), “In Search of ‘Project Chemistry’,” Construction Management and Economics, Vol. 20 No. 2, pp. 167-177. Nunnally, J. D. (1978). Psychometric theory, (2nd ed.), New York: McGraw-Hill.
190
Oakeson, M. (1997), “Kaizen Makes Dollars & Sense for Mercedes-Benz in Brazil,” IIE Solutions, Vol. 29 No. 4, pp. 32-35. Pan, W. (1999), “On the Robust Variance Estimator in Generalized Estimating Equations,” Biometrika, Vol. 88, pp. 901- 906. Pan, W. & Wall, M.M. (2002), “Small Sample Adjustments in Using the Sandwich Variance Estimator in Generalized Estimating Equations,” Statistics in Medicine, Vol. 21, pp. 1429-1441. Papadopoulou, T.C. & Ozbayrak, M. (2005), “Leanness: Experiences from the Journey to Date,” Journal of Manufacturing Technology Management, Vol. 16 No. 7, pp. 784-807. Pasmore, W. & King, D. (1978), “Understanding Organizational Change: A Comparative Study of Multifaceted Interventions,” Journal of Applied Behavioral Sciences, Vol. 14, pp. 455-468. Passos, A.M. & Caetano, A. (2003), “Exploring the Effects of Intragroup Conflict and Past Performance Feedback on Team Effectiveness,” Journal of Managerial Psychology, Vol. 20 No. 3/4, pp. 231-244. Patel, S., Dale, B.G., & Shaw, P. (2003), “Set-up Time Reduction and Mistake Proofing Methods: An Examination in Precision Component Manufacturing,” The TQM Magazine, Vol. 13 No. 3, pp. 175–179. Patil, H. (2003), “A Standard Framework for Sustaining Kaizen Events,” Unpublished Master’s Thesis, Department of Industrial and Manufacturing Engineering, Wichita: KS. Patton, R. (1997), “Two-Day Events: Old Hat at Nissan,” Industry Week, Vol. 246 No. 16, pp.24. Pearson, C.A.L. (1992), “Autonomous Workgroups: An Evaluation at an Industrial Site,” Human Relations, Vol. 49 No.5, pp. 905-936. Pelled, L.H., Eisenhardt, K.M., & Xin, K.R. (1999), “Exploring the Black Box: An Analysis of Work Group Diversity, Conflict and Performance,” Administrative Science Quarterly, Vol. 44 No. 1, pp. 1-28. Perrow, C. (1967), “A Framework for the Comparative Analysis of Organizations,” American Sociological Review, Vol. 32, pp. 194-208. Peugh, J.L. & Enders, C.K. (2005), “Using the SPSS Mixed Procedure to Fit Cross-Sectional and Longitudinal Multilevel Models,” Educational and Psychological Measurement, Vol. 65 No. 5, pp. 717-741. Pickering, J. & Kisangani, E.F. (2005) “Democracy and Diversionary Military Intervention: Reassessing Regime Type and the Diversionary Hypothesis,” International Studies Quarterly, Vol. 49, pp. 23-43. Pinto, J.K. & Mantel, Jr., S.J. (1990), “The Causes of Project Failure,” IEEE Transactions on Engineering Management, Vol. 37 No. 4, pp. 269-275. Pinto, J.K. & Slevin, D.P. (1987), “Critical Factors in Successful Project Implementation,” IEEE Transactions on Engineering Management, Vol. 34 No. 1, pp. 22-27. Pinto, J.K. & Slevin, D.P. (1989), “Critical Success Factors in R&D Projects,” Research Technology Management, Vol. 32 No. 1, pp. 31-35. Poulsen, B.O. (2002), “A Comparison of Bird Richness, Abundance and Trophic Organization in Forests of Ecuador and Demark: Are High-Altitude Andean Forests Temperate or Tropical?,” Journal of Tropical Ecology, Vol. 18, pp. 615-636. Prentice, R.L. (1988), “Correlated Binary Regression with Covariates Specific to Each Binary Observation,” Biometrics, Vol. 44 No. 4, pp.1033-1048.
191
Pritchard, S. (2002), “Brainstorming Teams Boost Productivity,” Works Management, Vol. 55 No. 4, pp.67. Project Management Institute, (2000), A Guide to the Project Management Body of Knowledge (PMBOK® Guide), 2000 Edition, Newtown Square, PA: Project Management Institute. Purdum, T. (2004), “A Force to Reckon With,” Industry Week, Vol. 253 No. 10, pp. 39-40. Raudenbush, A.S. & Byrk, S.W. (2002), Hierarchical Linear Models: Applications and Data Analysis Methods, 2nd Edition, Newbury Park, CA: Sage. Redding, R. (1996), “Lantech ‘Kaizen’ Process Draws 63 Observers from Across the Globe,” Business First of Louisville, Available URL: http://louisville.bizjournals.com/louisville/stories/1996/09/30/story3.html, June 10, 2004. Reed, K.K., Lubatkin, M., & Srinivasan, N. (2006), “Proposing and Testing an Intellectual Capital-Based View of the Firm,” Journal of Management Studies, Vol. 42 No. 4, pp. 867-893. Repenning, N.P. & Sterman, J.D. (2002), “Capability Traps and Self-Confirming Attribution Errors in the Dynamics of Process Improvement,” Administrative Science Quarterly, Vol. 47, pp. 265-295. Roby, D. (1995), “Uncommon Sense: Lean Manufacturing Speeds Cycle Time to Improve Low-Volume Production at Hughes,” National Productivity Review, Vol. 14 No. 2, pp. 79-87. Rockart, J. F. (1979), “Chief Executives Define Their Own Data Needs,” Harvard Business Review, Vol. 57 No. 2, pp.81-93. Roth, P.L. & Switzer, F.S. (1999), “Missing Data: Instrument-Level Heffalumps and Item-Level Woozles,” Academy of Management, Research Methods Division Research Methods Forum, Vol. 4. Available URL: http://division.aomonline.org/rm/1999_RMD_Forum_Missing_Data.htm, October 18, 2006. Roth, P.L., Switzer, F.S., III, & Switzer, D.M. (1999), “Missing Data in Multiple Item Scales: A Monte Carlo Analysis of Missing Data Techniques,” Organizational Research Methods, Vol. 2 No. 3, pp. 211–232. Rusiniak, S. (1996), “Maximizing Your IE Value,” IIE Solutions, Vol. 28 No. 6, pp. 12-16. Sabatini, J. (2000), “Turning Japanese,” Automotive Manufacturing & Production, Vol. 112 No. 10, pp. 66-69. Sarin S. & McDermott, C. (2003), “The Effect of Team Leader Characteristics on Learning, Knowledge Application and Performance of Cross-Functional New Product Development Teams,” Decision Sciences, Vol. 34 No. 4, pp. 707-739. SAS Institute Inc. (2006), “Generalized Linear Models Theory,” SAS/STAT User’s Guide, SAS OnlineDoc® 9.1.3. Available URL: http://support.sas.com/onlinedoc/913/docMainpage.jsp, November 7, 2006. Scheaffer, R. L., Mendenhall, W., III., & Ott, R. L. (1996), Elementary Survey Sampling, 5th Edition, Belmont, CA: Wadsworth Publishing Company. Schneider, B., White, S., & Paul, M.C. (1998), “Linking Service Climate and Customer Perceptions of Service Quality: Test of a Causal Model,” Journal of Applied Psychology, Vol. 83 No.2, pp.150-163. Schneiderman, A.M. (1988), “Setting Quality Goals,” Quality Progress, Vol. 21 No. 4, pp.51-57. Schroeder D.M. & Robinson, A.G. (1991), “America’s Most Successful Export to Japan: Continuous Improvement Programs,” Sloan Management Review, Vol. 32 No. 3, pp. 67-81.
Seers, A., Petty, M.M., & Cashman, J.F. (1995), “Team Member Exchange under Team and Traditional Management,” Group & Organization Management, Vol. 20 No.1, pp.18-38. Shannon, C. (1948), “A Mathematical Theory of Communications,” Bell Systems Technical Journal, Vol. 27, pp. 397-423, 623-656. Shenhar, A.J., Tishler, A., Dvir, D., Lipovetsky, S., & Lechler, T. (2002), “Refining the Search for Project Success Factors: A Multivariate, Typological Approach,” R&D Management, Vol. 32 No.2, pp.111-126. Sheridan, J. H. (1997a), “Guru’s View of the Gemba,” Industry Week, Vol. 246 No. 16, pp. 27-28. Sheridan, J. H. (1997b), “Kaizen Blitz,” Industry Week, Vol. 246 No. 16, pp.18-27. Sheridan, J. H. (2000a), “A New Attitude,” Industry Week, Vol. 249 No. 10, pp. 16. Sheridan, J. H. (2000b), “’Lean Sigma’ Synergy,” Industry Week, Vol. 249 No. 17, pp.81-82. Singer, J.D. (1998), “Using SAS PROC Mixed to Fit Multilevel Models, Hierarchical Models, and Individual Growth Models,” Journal of Educational and Behavioral Statistics, Vol. 23 No. 4, pp.323-355. Slevin, D.P. & Pinto, J.K., (1986), “The Project Implementation Profile: New Tool for Project Managers,” Project Management Journal, Vol. 17 No. 4, pp. 57-70. Smith, B. (2003) “Lean and Six Sigma – A One-Two Punch,” Quality Progress, Vol. 36 No. 4, pp. 37-41. Smith, R.J. (1994) “Degrees of Freedom in Interspecific Allometry: An Adjustment for the Effects of Phylogenetic Constraint,” American Journal of Physical Anthropology, Vol. 93 No. 1, pp. 95-107. Sobel, M.E. (1982), “Asymptotic Confidence Intervals for Indirect Effects in Structural Equation Models,” Sociological Methodology, Vol. 13, pp.290-312. Steel, R.P., Jennings K.R., & Linsey, J.T., (1990), “Quality Circle Problem Solving and Common Cents: Evaluation Study Findings from a United States Mint,” Journal of Applied Behavioral Science, Vol. 26 No. 3, pp. 365-382. Sterman, J.D., Repenning, N.P., & Kofman, F. (1997), “Unanticipated Side Effects of Successful Quality Programs: Exploring a Paradox of Organizational Improvement,” Management Science, Vol. 43, pp. 503-521. Szinovacz M.E. & Davey, A. (2001), “Retirement Effects of Parent-Adult Child Contacts,” The Gerontologist, Vol. 41 No. 2, pp. 191-200. Taninecz, G., (1997), “Cooper Automotive-Wagner Lighting,” Industry Week, Vol. 246 No. 19, pp. 32 (3 pgs). Tanner, C. & Roncarti, R. (1994), “Kaizen Leads to Breakthroughs in Responsiveness – and the Shingo Prize – at Critikon,” National Productivity Review, Vol. 13 No. 4, pp. 517-531. Taylor, D.L. & Ramsey, R.K. (1993), “Empowering Employees to ‘Just Do It’,” Training and Development, Vol. 47 No. 5, pp. 71-76 (5 pgs). Teachman, J.D. (1980), “Analysis of Population Diversity,” Sociological Methods and Research, Vol. 8 No. 3, pp. 341-362. Tilson, B. (2001), “Success and Sustainability in Automotive Supply Chain Improvement Programmes: A Case Study of Collaboration in the Mayflower Cluster,” International Journal of Innovation Management, Vol. 5 No. 4, pp. 427-456.
193
Tinsley, H.E.A. & Tinsley, D.J. (1987), “Uses of Factor Analysis in Counseling Psychology Research,” Journal of Counseling Psychology, Vol. 34, pp. 414-424. Treece, J.B. (1993), “Improving the Soul of an Old Machine,” Business Week Vol. 3342, pp. 134. Trist, E.L. & Bamforth, K.W. (1951), “Some Social and Psychological Consequences of the Long-Wall Method of Coal-Getting,” Human Relations, Vol. 4, pp. 3-38. Trist, E.L., Higgin, G.W., Murray, H., & Pollock, A.B. (1963), Organizational Choice, London, UK: Tavistock. Tukel, O.I. & Rom, W.O. (1998), “Analysis of the Characteristics of Projects in Diverse Industries,” Journal of Operations Management, Vol. 16 No.1, pp. 43-61. Van Aken, E.M. & Kleiner, B.M. (1997), “Determinants of Effectiveness for Cross-Functional Organizational Design Teams,” Quality Management Journal, Vol. 4 No. 2, pp. 51-79. Van den Bree, M.B.M, Schieken, R.M., Moskowitz, W.B., & Eaves, L.J. (1996), “Genetic Regulation of Hemodynamic Variable During Dynamic Exercise,” Circulation, Vol. 94, pp. 1864-1869. Van der Leeden, R. & Busing, F.T.M.A. (1994), “First Iteration versus igls/rgls Estimates in Two-Level Models: A Monte-Carlo Study with ML3,” Psychometrics and Research Methodology, preprint PRM 94-03. Van Mierlo, H., Vermunt, J.K., & Rutte, C.G. (2006) “Composing Group-Level Constructs from Individual-Level Survey Data,” working paper. Available URL: http:// spitswww.uvt.nl/~vermunt/mierlo2006.pdf, October 4, 2006. Vasilash, G.S. (1993), “Walking the Talk of Kaizen at Freudenberg-NOK,” Production, Vol. 105, No. 12, pp. 66-71. Vasilash, G.S. (1997), “Getting Better—Fast,” Automotive Design & Production, Vol. 109, No. 8, pp. 66-68. Vitalo, R. L., Butz, F., & Vitalo, J.P. (2003), Kaizen Desk Reference Standard, Hope, ME: Vital Enterprises. “Waste Reduction Program Slims Fleetwood Down,” (2000), Strategic Direction, Vol. 16 No. 9, pp. 19-21. Watson, L. (2002), “Striving for Continuous Improvement with Fewer Resources? Try Kaizen,” Marshall Star, Nov. 28 2002, pp. 1 (4 pgs). Weisman, C.S., Gordon, D.L., & Cassard, S.D., (1993), “The Effects of Unit Self-Management on Hospital Nurses’ Work Process, Work Satisfaction, and Retention,” Medical Care, Vol. 31 No. 5, pp. 381-393. Wheatley, B. (1998), “Innovation in ISO Registration,” CMA, Vol. 72 No. 5, pp. 23. Whitford, A.B. & Yates, J. (2003) “Policy Signals and Executive Governance: Presidential Rhetoric in the War on Drugs,” The Journal of Politics, Vol. 65 No. 4, pp. 995-1012. Wilson, L., Van Aken, E. M., & Frazier, D. (1998), “Achieving High Performance Work Systems Through Policy Deployment: A Case Application,” Proceedings of the 1998 International Conference on Work Teams. Wilson, R. (2005), “Guard the LINE,” Industrial Engineer, Vol. 37 No. 4, pp. 46-49. “Winning with Kaizen,” (2002), IIE Solutions, Vol. 34 No. 4, pp. 10. Withey, M., Daft, R.L., & Cooper, W.H. (1983) “Measures of Perrow’s Work Unit Technology: An Empirical Assessment and a New Scale” Academy of Management Journal, Vol. 26 No. 1, pp. 45-63. Wittenberg, G. (1994), “Kaizen – The Many Ways of Getting Better,” Assembly Automation, Vol. 14 No. 4, pp. 12+ (6 pgs).
194
Womack, J. & Jones, D. (1996a), “Beyond Toyota: How to Root out Waste and Pursue Perfection,” Harvard Business Review, Vol. 74 No. 5, pp. 140-158. Womack, J. & Jones, D. (1996b), Lean Thinking: Banish Waste and Create Wealth in Your Corporation, New York: Simon & Schuster. Womack, J., Roos, D., & Jones, D. (1990), The Machine that Changed the World, New York: Rawson and Associates. Wood R. & Locke, E.A. (1990), “Goal Setting and Strategy Effects on Complex Tasks.” Research in Organizational Behavior, Staw, B., and Cummings, L., eds., Greenwich, CT: JAI Press, Vol. 12, pp. 73-109. Wright, R. (1936), “Factors Affecting the Cost of Airplanes,” Journal of Aeronautical Sciences, Vol. 3, pp. 122-128.
195
APPENDIX A: UNCATEGORIZED LIST OF FACTORS FROM KAIZEN EVENT LITERATURE Factor Sources
One week or shorter (short duration) LeBlanc, 1999; Oakeson, 1997; Vasilash, 1997; Drickhamer, 2004b; Watson, 2002; Smith, 2003; Cuscela, 1998; McNichols et al., 1999; Martin, 2004; Sheridan, 1997b; Patton, 1997; Bradley & Willett, 2004; Vasilash, 1993; Bicheno, 2001; Adams et al., 1997; Melnyk et al., 1998
Linked to organizational strategy LeBlanc, 1999; “Keys to Success,” 1997; Melnyk et al., 1998 Action orientation LeBlanc, 1999; Redding, 1996; Smith, 2003; Martin, 2004;
Sheridan, 1997b; Patton, 1997; Vasilash, 1993; Bicheno, 2001; Adams et al., 1997; Melnyk et al., 1998
Use cross-functional teams LeBlanc, 1999; Drickhamer, 2004b; Rusiniak, 1996; Demers, 2002; Smith, 2003; Cuscela, 1998; McNichols et al., 1999; Martin, 2004; Sheridan, 1997b; Vasilash, 1993; Vasilash, 1993; Adams et al., 1997; Melnyk et al., 1998
Teams have implementation authority LeBlanc, 1999; Oakeson, 1997; Minton, 1998; Martin, 2004; Sheridan, 1997b; Bradley & Willett, 2004; Bicheno, 2001; Adams et al., 1997; Melnyk et al., 1998
10 – 12 people on Kaizen event team LeBlanc, 1999; Demers, 2002; Watson, 2002; Including “fresh eyes” (people with no prior knowledge of the target area) on the team
Can be held based on employee suggestions for improvement
Jusko, 2004; Watson, 2002
Avoid preconceived solutions Rusiniak, 1996; Bradley & Willett, 2004 Seek improvement, not optimization Rusiniak, 1996; Vasilash, 1993 Requires a well-defined problem statement as input
Rusiniak, 1996; Adams et al., 1997
Avoid problems that are too big and/or emotionally involved
Rusiniak, 1996; Sheridan, 1997b
3 – 5 people on Kaizen event team Rusiniak, 1996 Used to implement lean manufacturing Vasilash, 1997 Focused on waste elimination Watson, 2002; Cuscela, 1998; Martin, 2004; Patton, 1997; Adams
et al., 1997 Questioning the current process – asking why things are done the way they are
Watson, 2002; Minton, 1998
Team members volunteer to participate Watson, 2002; Adams et al., 1997 Each team member has specific knowledge of the process
Watson, 2002
Attack “low hanging” fruit Smith, 2003; Bicheno, 2001 Involve first-hand observation of target area Smith, 2003; Vasilash, 1993 Kaizen events used in non-manufacturing areas (e.g., office Kaizen events)
12-14 members on Kaizen event team Cuscela, 1998 6 – 10 members on Kaizen event team McNichols et al., 1999; Martin, 2004; Vasilash, 1993 Training can be provided before the formal start of the event (e.g., offline)
McNichols et al., 1999; Bicheno, 2001
Including process documentation (VSM, process flowcharts, videotapes of the process, current state data, etc.) as input to Kaizen event
Black Belts assigned to Kaizen event teams (for Lean-Six Sigma programs)
Sheridan, 2000b
Including benchmarking partners or other external non-supply chain parties on the Kaizen event team
McNichols et al., 1999; Sheridan, 1997b; Vasilash, 1993
Team celebration at the end of the event Martin, 2004 Organization-wide communication of Kaizen event results
Martin, 2004
Team controls starting and stopping times of Kaizen event activities (often long days 12-14 hrs)
Sheridan, 1997b; Vasilash, 1993
Well-defined and thorough event planning activities (adequate preparation)
Sheridan, 1997b; Bradley & Willett, 2004
Importance of buy-in from employees in work area
Sheridan, 1997b
Keep line running during Kaizen event (important for team to observe a running line)
Sheridan, 1997b
Including target area supervisor on Kaizen event team
Patton, 1997
Use of a “Kaizen office,” including full-time coordinators/facilitators
“Keys to Success,” 1997; Bicheno, 2001
Total alignment of organizational procedures and policies with Kaizen event program
“Keys to Success,” 1997
Stopping production in target area during the Kaizen event
Bradley & Willett, 2004
Including people from all functions required to implement/sustain results on the Kaizen event team
Bradley & Willett, 2004; Vasilash, 1993; Adams et al., 1997
At least one member of Kaizen event team experienced enough in tool(s) to teach others
Bradley & Willett, 2004
At least one member of Kaizen event team keeps the team “on track” (focused)
Bradley & Willett, 2004; Vasilash, 1993
Team should not be too rigid about sticking to formal methodology
Bradley & Willett, 2004
Avoid including people from competing plants or functions on the Kaizen event team
Bradley & Willett, 2004
198
Preference given to Kaizen events that require simple, well-known tools versus more complex tools
Bradley & Willett, 2004
Cycles of solution refinement during Kaizen event
Bradley & Willett, 2004; Bicheno, 2001; Melnyk et al., 1998
Including people from all production shifts in Kaizen event team
Vasilash, 1993
Teams not punished for failing to meet improvement goals (just asked to understand why)
Vasilash, 1993; Adams et al., 1997; Melnyk et al., 1998
Involving everyone on the Kaizen event team in the solution process
Vasilash, 1993
Including ½ day of training at the start of the event (training in tools, kaizen philosophy, etc.)
Vasilash, 1993; Melnyk et al., 1998
Including ergonomics training as part of Kaizen event training
Wilson, 2005
Combining Kaizen events with other improvement approaches
Bicheno, 2001
Including “team-building” exercises as part of Kaizen event training
Bicheno, 2001
Making sure that each participant has thorough knowledge of the “seven wastes” prior to team activities
Bicheno, 2001
Making each team member responsible for implementing at least one improvement idea
Bicheno, 2001
Kaizen event team members from work area encouraged to discuss event activities and changes with others in the work area during the event (to create buy-in)
Bicheno, 2001
Using a sequence of Kaizen events (e.g., 5S, SMED, Standard Work) to progressively improvement a given work area
Bicheno, 2001; Melnyk et al., 1998
Informal “floating” team structure Adams et al., 1997 Rewards and recognition for team after the event (e.g., celebrations)
Adams et al., 1997; Melnyk et al., 1998
Each team member participates in report-out to management
Adams et al., 1997
Output of given Kaizen event is used to determine the next Kaizen event
Adams et al., 1997
Kaizen events are focused on the needs of the external customer (e.g. improving value) versus internal efficiency
Melnyk et al., 1998
199
APPENDIX B: INITIAL GROUPINGS OF FACTORS FROM KAIZEN EVENT LITERATURE 1. Event Design
a) Duration • One week or shorter (LeBlanc, 1999; Oakeson, 1997; Vasilash, 1997; Drickhamer, 2004b; Watson,
• Two weeks or shorter (Minton, 1998; Demers, 2002) b) Team Composition
• Team size o 3 – 5 people (Rusiniak, 1996) o 6 – 10 people (McNichols et al., 1999; Martin, 2004; Vasilash, 1993) o 10 – 12 people (LeBlanc, 1999; Demers, 2002; Watson, 2002) o 12 – 13 people (Cuscela, 1998)
• Use cross-functional teams (LeBlanc, 1999; Drickhamer, 2004b; Rusiniak, 1996; Demers, 2002; Smith, 2003; Cuscela, 1998; McNichols et al., 1999; Martin, 2004; Sheridan, 1997b; Vasilash, 1993; Vasilash, 1993; Adams et al., 1997; Melnyk et al., 1998) o Informal “floating” team structure (Adams et al., 1997) o Team members volunteer to participate (Watson, 2002; Adams et al., 1997) o Including “fresh eyes” (people with no prior knowledge of the target area) on the team (LeBlanc,
o Including people from the work area on the Kaizen event team (Redding, 1996; Minton, 1998; Womack & Jones, 1996a; Martin, 2004; Sheridan, 1997b; Bradley & Willett, 2004; Vasilash, 1993; Bicheno, 2001; Adams et al., 1997; Melnyk et al., 1998)
o Including outside consultants on the Kaizen event team (Oakeson, 1997; Bicheno, 2001) o Including managers and supervisors on the Kaizen event team (Oakeson, 1997; “Keys to
Success,” 1997; Vasilash, 1993; Bicheno, 2001) o Including customers on the Kaizen event team (Hasek, 2000; Vasilash, 1997; McNichols et al.,
1999; Vasilash, 1993; Adams et al., 1997; Melnyk et al., 1998) o Including suppliers on the Kaizen event team (Vasilash, 1997; McNichols et al., 1999; Vasilash,
1993; Adams et al., 1997; Melnyk et al., 1998) o Including only one employee per department on the Kaizen event team (except for the department
being blitzed), to avoid over-burdening any department (Minton, 1998) o Each team member has specific knowledge of the process (Watson, 2002) o Black Belts assigned to Kaizen event teams (for Lean-Six Sigma programs) (Sheridan, 2000b) o Including benchmarking partners or other external non-supply chain parties on the Kaizen event
team (McNichols et al., 1999; Sheridan, 1997b; Vasilash, 1993) o Including target area supervisor on Kaizen event team (Patton, 1997) o Including people from all functions required to implement/sustain results on the Kaizen event
team (Bradley & Willett, 2004; Vasilash, 1993; Adams et al., 1997) o At least one member of Kaizen event team experienced enough in tool(s) to teach others (Bradley
& Willett, 2004) o Avoid including people from competing plants or functions on the Kaizen event team (Bradley &
Willett, 2004) o Including people from all production shifts in Kaizen event team (Vasilash, 1993)
c) Team Authority • Teams have implementation authority (LeBlanc, 1999; Oakeson, 1997; Minton, 1998; Martin, 2004;
Sheridan, 1997b; Bradley & Willett, 2004; Bicheno, 2001; Adams et al., 1997; Melnyk et al., 1998) • Team controls starting and stopping times of Kaizen event activities (often long days 12-14 hrs)
(Sheridan, 1997b; Vasilash, 1993)
200
d) Problem Scope • Require a standard, reliable target process/work area as input (LeBlanc, 1999; Bradley & Willett,
2004) • Requires a well-defined problem statement as input (Rusiniak, 1996; Adams et al., 1997) • Avoid problems that are too big and/or emotionally involved (Rusiniak, 1996; Sheridan, 1997b) • Preference given to Kaizen events that require simple, well-known tools versus more complex tools
(Bradley & Willett, 2004) e) Event Goals
• Linked to organizational strategy (LeBlanc, 1999; “Keys to Success,” 1997; Melnyk et al., 1998) • Challenging (stretch) goals (LeBlanc, 1999; Minton, 1998; Rusiniak, 1996; Cuscela, 1998; Bradley &
Willett, 2004; Bicheno, 2001) • Focused – on a specific process, product, or problem (Minton, 1998; Drickhamer, 2004b; Martin,
2004; Sheridan, 1997b; Bicheno, 2001; Adams et al., 1997; Melnyk et al., 1998) • Used to implement lean manufacturing (Vasilash, 1997) • Concrete, measurable goals (Martin, 2004; Bradley & Willett, 2004; Vasilash, 1993; Melnyk et al.,
1998) • Kaizen events are focused on the needs of the external customer (e.g. improving value) versus internal
efficiency (Melnyk et al., 1998) 2. Event Planning
• Including process documentation (VSM, process flowcharts, videotapes of the process, current state data, etc.) as input to Kaizen event (Minton, 1998; McNichols et al., 1999; Martin, 2004; Bradley & Willett, 2004; Bicheno, 2001)
• Notifying employees in adjoining work areas before the start of the Kaizen event (McNichols et al., 1999)
b) Resource Support • Team members dedicated only to Kaizen event during its duration (Minton, 1998; McNichols et al.,
1999; Martin, 2004; Bradley & Willett, 2004; Bicheno, 2001; Melnyk et al., 1998) • Having support personnel (maintenance, engineering, etc.) “on call” during the event, to provide
support as needed (e.g., moving equipment overnight) (McNichols et al., 1999; Martin, 2004; Sheridan, 1997b; Bradley & Willett, 2004; Bicheno, 2001; Adams et al., 1997)
• Cost is not a factor (Minton, 1998) • Dedicated room for Kaizen event team meetings (Creswell, 2001) • Snacks provided to team during Kaizen event (Creswell, 2001; Adams et al., 1997) • Use of a “Kaizen office,” including full-time coordinators/facilitators (“Keys to Success,” 1997;
Bicheno, 2001) • Stopping production in target area during the Kaizen event (Bradley & Willett, 2004)
c) Rewards/Recognition • Rewards and recognition for team after the event (e.g., celebrations) (Adams et al., 1997; Melnyk et
al., 1998) • Team celebration at the end of the event (Martin, 2004)
d) Communication • Importance of buy-in from employees in work area (Sheridan, 1997b) • Kaizen event team members from work area encouraged to discuss event activities and changes with
others in the work area during the event (to create buy-in) (Bicheno, 2001)
Womack & Jones, 1996a; “Keys to Success,” 1997; Bradley & Willett, 2004; Melnyk et al., 1998) • Kaizen event team members from work area encouraged to discuss event activities and changes with
others in the work area during the event (to create buy-in) (Bicheno, 2001) • Organization-wide commitment to change (Redding, 1996) • Total alignment of organizational procedures and policies with Kaizen event program (“Keys to
Success,” 1997) 4. Training
• Less than two hours of formal training provided to team (Minton, 1998; McNichols et al., 1999) • Including ½ day of training at the start of the event (training in tools, kaizen philosophy, etc.)
(Vasilash, 1993; Melnyk et al., 1998) • Facilitators provide “short courses” on topics “on the spot” if a team gets stuck (Minton, 1998) • Team members who aren’t from the process get training in the process and may even work in the
production line for a few days before the Kaizen event (Minton, 1998) • Including ergonomics training as part of Kaizen event training (Wilson, 2005) • Including “team-building” exercises as part of Kaizen event training (Bicheno, 2001) • Making sure that each participant has thorough knowledge of the “seven wastes” prior to team
activities (Bicheno, 2001) • Training can be provided before the formal start of the event (e.g., offline) (McNichols et al., 1999;
Bicheno, 2001) 5. Systematic Use of Kaizen Events
• Spacing out events (e.g., only 1 event per quarter) (Taninecz, 1997) • Concurrent Kaizen events (Vasilash, 1997; Watson, 2002; Cuscela, 1998; Bradley & Willett, 2004;
Adams et al., 1997) • Targeted at areas that can provide a “big win” (big impact on organization) (Minton, 1998; Cuscela,
1998; Martin, 2004; Sheridan, 1997b; “Keys to Success,” 1997; Bradley & Willett, 2004; Melnyk et al., 1998)
• Repeat Kaizen events in a given work area (“Winning with Kaizen,” 2002; Purdum, 2004; Womack & Jones, 1996a; McNichols et al., 1999; Sheridan, 1997b; Bradley & Willett, 2004; Bicheno, 2001; Adams et al., 1997; Melnyk et al., 1998)
• Can be held based on employee suggestions for improvement (Jusko, 2004; Watson, 2002) • Kaizen events used in non-manufacturing areas (e.g., office Kaizen events) (Womack & Jones,
1996a; Sheridan, 1997b; Bradley & Willett, 2004; Melnyk et al., 1998) • Combining Kaizen events with other improvement approaches (Bicheno, 2001) • Using a sequence of Kaizen events (e.g., 5S, SMED, Standard Work) to progressively improvement a
given work area (Bicheno, 2001; Melnyk et al., 1998) • Attack “low hanging fruit” (Smith, 2003; Bicheno, 2001) • Output of given Kaizen event is used to determine the next Kaizen event (Adams et al., 1997)
6. Event Process a) Action Orientation (LeBlanc, 1999; Redding, 1996; Smith, 2003; Martin, 2004; Sheridan, 1997b; Patton,
1997; Vasilash, 1993; Bicheno, 2001; Adams et al., 1997; Melnyk et al., 1998) • Involve first-hand observation of target area (Smith, 2003; Vasilash, 1993) • Keep line running during Kaizen event (important for team to observe a running line) (Sheridan,
1997b) • Cycles of solution refinement during Kaizen event (Bradley & Willett, 2004; Bicheno, 2001; Melnyk
et al., 1998) • Training work area in employees in the new process is part of the Kaizen event (Martin, 2004)
b) Problem Solving Tools/Techniques • Videotapes of setups (Minton, 1998; Bradley & Willett, 2004) • Brainstorming (Minton, 1998; Watson, 2002; Martin, 2004; Bradley & Willett, 2004; Vasilash, 1993)
202
• Avoid preconceived solutions (Rusiniak, 1996; Bradley & Willett, 2004) • Seek improvement, not optimization (Rusiniak, 1996; Vasilash, 1993) • Question the current process – ask why things are done the way they are (Watson, 2002; Minton,
1998) • Team should not be too rigid about sticking to formal methodology (Bradley & Willett, 2004)
c) Team Coordination • At least one member of Kaizen event team keeps the team “on track” (focused) (Bradley & Willett,
2004; Vasilash, 1993) • Use of subteams (Minton, 1998; McNichols et al., 1999; Sheridan, 1997b; Bicheno, 2001) • Use of a Kaizen newspaper (“Winning with Kaizen,” 2002; McNichols et al., 1999; Martin, 2004;
Bradley & Willett, 2004; Melnyk et al., 1998) d) Participation
• Involving everyone on the Kaizen event team in the solution process (Vasilash, 1993) • Making each team member responsible for implementing at least one improvement idea (Bicheno,
2001) • Each team member participates in report-out to management (Adams et al., 1997)
203
APPENDIX C: CATEGORIES OF FACTORS FROM KAIZEN EVENT LITERATURE (based on initial 33 sources reviewed)
• One week or shorter (LeBlanc, 1999; Oakeson, 1997; Vasilash, 1997; Drickhamer, 2004b; Watson, 2002; Smith, 2003; Cuscela, 1998; McNichols et al., 1999; Martin, 2004; Sheridan, 1997b; Patton, 1997; Bradley & Willett, 2004; Vasilash, 1993; Bicheno, 2001; Adams et al., 1997; Melnyk et al., 1998)
• Two weeks or shorter (Minton, 1998; Demers, 2002) b) Team Authority
• Teams have implementation authority (LeBlanc, 1999; Oakeson, 1997; Minton, 1998; Martin, 2004; Sheridan, 1997b; Bradley & Willett, 2004; Bicheno, 2001; Adams et al., 1997; Melnyk et al., 1998)
• Team controls starting and stopping times of Kaizen event activities (often long days 12-14 hrs) (Sheridan, 1997b; Vasilash, 1993)
c) Problem Scope • Require a standard, reliable target process/work area as input (LeBlanc, 1999; Bradley & Willett, 2004) • Requires a well-defined problem statement as input (Rusiniak, 1996; Adams et al., 1997) • Avoid problems that are too big and/or emotionally involved (Rusiniak, 1996; Sheridan, 1997b) • Preference given to Kaizen events that require simple, well-known tools versus more complex tools
(Bradley & Willett, 2004) d) Event Goals
• Linked to organizational strategy (LeBlanc, 1999; “Keys to Success,” 1997; Melnyk et al., 1998) • Challenging (stretch) goals (LeBlanc, 1999; Minton, 1998; Rusiniak, 1996; Cuscela, 1998; Bradley &
Willett, 2004; Bicheno, 2001) • Focused – on a specific process, product, or problem (Minton, 1998; Drickhamer, 2004b; Martin,
2004; Sheridan, 1997b; Bicheno, 2001; Adams et al., 1997; Melnyk et al., 1998) • Used to implement lean manufacturing (Vasilash, 1997) • Concrete, measurable goals (Martin, 2004; Bradley & Willett, 2004; Vasilash, 1993; Melnyk et al.,
1998) • Kaizen events are focused on the needs of the external customer (e.g. improving value) versus internal
efficiency (Melnyk et al., 1998) 2. Team -- Group Composition Factors (Cohen & Bailey, 1997); Project Level Antecedents (Nicolini, 2002);
Factors Related to the Project Team (Belassi & Tukel, 1996)
a) Team size • 3 – 5 people (Rusiniak, 1996) • 6 – 10 people (McNichols et al., 1999; Martin, 2004; Vasilash, 1993) • 10 – 12 people (LeBlanc, 1999; Demers, 2002; Watson, 2002) • 12 – 13 people (Cuscela, 1998)
b) Use of Cross-Functional Teams (LeBlanc, 1999; Drickhamer, 2004b; Rusiniak, 1996; Demers, 2002; Smith, 2003; Cuscela, 1998; McNichols et al., 1999; Martin, 2004; Sheridan, 1997b; Vasilash, 1993; Vasilash, 1993; Adams et al., 1997; Melnyk et al., 1998) • Informal “floating” team structure (Adams et al., 1997) • Team members volunteer to participate (Watson, 2002; Adams et al., 1997) • Including “fresh eyes” (people with no prior knowledge of the target area) on the team (LeBlanc, 1999;
• Including people from the work area on the Kaizen event team (Redding, 1996; Minton, 1998; Womack & Jones, 1996a; Martin, 2004; Sheridan, 1997b; Bradley & Willett, 2004; Vasilash, 1993; Bicheno, 2001; Adams et al., 1997; Melnyk et al., 1998)
204
• Including outside consultants on the Kaizen event team (Oakeson, 1997; Bicheno, 2001) • Including managers and supervisors on the Kaizen event team (Oakeson, 1997; “Keys to Success,”
1997; Vasilash, 1993; Bicheno, 2001) • Including customers on the Kaizen event team (Hasek, 2000; Vasilash, 1997; McNichols et al., 1999;
Vasilash, 1993; Adams et al., 1997; Melnyk et al., 1998) • Including suppliers on the Kaizen event team (Vasilash, 1997; McNichols et al., 1999; Vasilash, 1993;
Adams et al., 1997; Melnyk et al., 1998) • Including only one employee per department on the Kaizen event team (except for the department
being blitzed), to avoid over-burdening any department (Minton, 1998) • Each team member has specific knowledge of the process (Watson, 2002) • Black Belts assigned to Kaizen event teams (for Lean-Six Sigma programs) (Sheridan, 2000b) • Including benchmarking partners or other external non-supply chain parties on the Kaizen event team
(McNichols et al., 1999; Sheridan, 1997b; Vasilash, 1993) • Including target area supervisor on Kaizen event team (Patton, 1997) • Including people from all functions required to implement/sustain results on the Kaizen event team
(Bradley & Willett, 2004; Vasilash, 1993; Adams et al., 1997) • At least one member of Kaizen event team experienced enough in tool(s) to teach others (Bradley &
Willett, 2004) • Avoid including people from competing plants or functions on the Kaizen event team (Bradley &
Willett, 2004) • Including people from all production shifts in Kaizen event team (Vasilash, 1993)
3. Organization -- Organizational Context Factors (Cohen & Bailey, 1997); Project Level Antecedents (Nicolini, 2002); Factors Related to the Organization (Belassi & Tukel, 1996)
Martin, 2004; Sheridan, 1997b; “Keys to Success,” 1997; Bradley & Willett, 2004; Vasilash, 1993; Bicheno, 2001; Adams et al., 1997)
b) Resource Support • Team members dedicated only to Kaizen event during its duration (Minton, 1998; McNichols et al.,
1999; Martin, 2004; Bradley & Willett, 2004; Bicheno, 2001; Melnyk et al., 1998) • Having support personnel (maintenance, engineering, etc.) “on call” during the event, to provide
support as needed (e.g., moving equipment overnight) (McNichols et al., 1999; Martin, 2004; Sheridan, 1997b; Bradley & Willett, 2004; Bicheno, 2001; Adams et al., 1997)
• Cost is not a factor (Minton, 1998) • Dedicated room for Kaizen event team meetings (Creswell, 2001) • Snacks provided to team during Kaizen event (Creswell, 2001; Adams et al., 1997) • Use of a “Kaizen office,” including full-time coordinators/facilitators (“Keys to Success,” 1997;
Bicheno, 2001) • Stopping production in target area during the Kaizen event (Bradley & Willett, 2004)
c) Rewards/Recognition • Rewards and recognition for team after the event (e.g., celebrations) (Adams et al., 1997; Melnyk et
al., 1998) • Team celebration at the end of the event (Martin, 2004)
d) Communication • Importance of buy-in from employees in work area (Sheridan, 1997b) • Kaizen event team members from work area encouraged to discuss event activities and changes with
others in the work area during the event (to create buy-in) (Bicheno, 2001) e) Event Planning Process
• Including process documentation (VSM, process flowcharts, videotapes of the process, current state
205
data, etc.) as input to Kaizen event (Minton, 1998; McNichols et al., 1999; Martin, 2004; Bradley & Willett, 2004; Bicheno, 2001)
• Notifying employees in adjoining work areas before the start of the Kaizen event (McNichols et al., 1999)
f) Training • Less than two hours of formal training provided to team (Minton, 1998; McNichols et al., 1999) • Including ½ day of training at the start of the event (training in tools, kaizen philosophy, etc.)
(Vasilash, 1993; Melnyk et al., 1998) • Facilitators provide “short courses” on topics “on the spot” if a team gets stuck (Minton, 1998) • Team members who aren’t from the process get training in the process and may even work in the
production line for a few days before the Kaizen event (Minton, 1998) • Including ergonomics training as part of Kaizen event training (Wilson, 2005) • Including “team-building” exercises as part of Kaizen event training (Bicheno, 2001) • Making sure that each participant has thorough knowledge of the “seven wastes” prior to team
activities (Bicheno, 2001) • Training can be provided before the formal start of the event (e.g., offline) (McNichols et al., 1999;
Bicheno, 2001) 4. Event Process -- Internal Process Factors (Cohen & Bailey, 1997); Processes (Nicolini, 2002); Project
Manager’s Performance on the Job (Belassi & Tukel, 1996)
a) Action Orientation (LeBlanc, 1999; Redding, 1996; Smith, 2003; Martin, 2004; Sheridan, 1997b; Patton, 1997; Vasilash, 1993; Bicheno, 2001; Adams et al., 1997; Melnyk et al., 1998) • Involve first-hand observation of target area (Smith, 2003; Vasilash, 1993) • Keep line running during Kaizen event (important for team to observe a running line) (Sheridan,
1997b) • Cycles of solution refinement during Kaizen event (Bradley & Willett, 2004; Bicheno, 2001; Melnyk et
al., 1998) • Training work area in employees in the new process is part of the Kaizen event (Martin, 2004)
b) Problem Solving Tools/Techniques • Videotapes of setups (Minton, 1998; Bradley & Willett, 2004) • Brainstorming (Minton, 1998; Watson, 2002; Martin, 2004; Bradley & Willett, 2004; Vasilash, 1993) • Avoid preconceived solutions (Rusiniak, 1996; Bradley & Willett, 2004) • Seek improvement, not optimization (Rusiniak, 1996; Vasilash, 1993) • Question the current process – ask why things are done the way they are (Watson, 2002; Minton, 1998) • Team should not be too rigid about sticking to formal methodology (Bradley & Willett, 2004)
c) Team Coordination • At least one member of Kaizen event team keeps the team “on track” (focused) (Bradley & Willett,
2004; Vasilash, 1993) • Use of subteams (Minton, 1998; McNichols et al., 1999; Sheridan, 1997b; Bicheno, 2001) • Use of a Kaizen newspaper (“Winning with Kaizen,” 2002; McNichols et al., 1999; Martin, 2004;
Bradley & Willett, 2004; Melnyk et al., 1998) d) Participation
• Involving everyone on the Kaizen event team in the solution process (Vasilash, 1993) • Making each team member responsible for implementing at least one improvement idea (Bicheno,
2001) • Each team member participates in report-out to management (Adams et al., 1997)
5. Broader Context (Kaizen Event Program Characteristics)
a) Kaizen Event Deployment • Spacing out events (e.g., only 1 event per quarter) (Taninecz, 1997) • Concurrent Kaizen events (Vasilash, 1997; Watson, 2002; Cuscela, 1998; Bradley & Willett, 2004;
Adams et al., 1997)
206
• Targeted at areas that can provide a “big win” (big impact on organization) (Minton, 1998; Cuscela, 1998; Martin, 2004; Sheridan, 1997b; “Keys to Success,” 1997; Bradley & Willett, 2004; Melnyk et al., 1998)
• Repeat Kaizen events in a given work area (“Winning with Kaizen,” 2002; Purdum, 2004; Womack & Jones, 1996a; McNichols et al., 1999; Sheridan, 1997b; Bradley & Willett, 2004; Bicheno, 2001; Adams et al., 1997; Melnyk et al., 1998)
• Can be held based on employee suggestions for improvement (Jusko, 2004; Watson, 2002) • Kaizen events used in non-manufacturing areas (e.g., office Kaizen events) (Womack & Jones, 1996a;
Sheridan, 1997b; Bradley & Willett, 2004; Melnyk et al., 1998) • Combining Kaizen events with other improvement approaches (Bicheno, 2001) • Using a sequence of Kaizen events (e.g., 5S, SMED, Standard Work) to progressively improvement a
given work area (Bicheno, 2001; Melnyk et al., 1998) • Attack “low hanging fruit” (Smith, 2003; Bicheno, 2001) • Output of given Kaizen event is used to determine the next Kaizen event (Adams et al., 1997)
b) Organizational Policies/Procedures • “No layoffs” policy (Redding, 1996; Vasilash, 1997; Creswell, 2001; “Winning with Kaizen,” 2002;
Womack & Jones, 1996a; “Keys to Success,” 1997; Bradley & Willett, 2004; Melnyk et al., 1998) • Kaizen event team members from work area encouraged to discuss event activities and changes with
others in the work area during the event (to create buy-in) (Bicheno, 2001) • Organization-wide commitment to change (Redding, 1996) • Total alignment of organizational procedures and policies with Kaizen event program (“Keys to
Success,” 1997)
207
APPENDIX D: EXAMPLE KAIZEN EVENT ANNOUNCEMENT Kaizen Event Announcement
Standard Work: Cell A October 4th - 8th
TO: Team Member 1, Team Member 2, Team Member 3, Team Member 4, Team Member 5, Team Member 6 FROM: Plant Manager, Kaizen Event Facilitator, Kaizen Event Team Leader SUBJECT: Standard Work: Cell A CC: Company A Ops Staff, Company A Kaizen Event Coordinator, Cell A Supervisor, Cell A DATE: September 1st Congratulations! You have been selected to participate in an upcoming Kaizen event for Cell A. This is a great opportunity to make a major improvement in quality and delivery performance. We will focus on combining the sub-process 1 and sub-process 2 cells to create a complete process cell. MEETING TIME/PLACE: Training for this event will start on Friday, October 1, from 8:00 a.m. to 4:00 p.m. Training will be held in the Training room. Kick-off for this event will start Monday, October 4, at 8:00 a.m. in the Training room. This event will continue at Facility A through Friday, October 8. On Friday, October 8 at 11:00 a.m., we will report out to the management team. For those on CC, please plan to attend the report out. The wrap-up is very important. BUSINESS ISSUE: This cell has consistently > 93% OTD and very low external warranty returns. However, the most significant barrier to further growth is the relatively long lead times (4-6 weeks) for most items. Implementing one-piece flow will improve the flexibility of the cell, enabling us to increase capacity while significantly reducing lead times and reducing the need for cell associates to work overtime. Additionally, this will reduce WIP and inventory. PROPOSAL: Create a high-powered, cross-functional team for a 4 1/2 - day kaizen to implement one-piece flow in Cell A. TEAM GOALS & OBJECTIVES: HOW WILL SUCCESS BE MEASURED: • Implement one piece flow • Increase cell capacity • Improve cell flexibility and responsiveness. • Create Standard Work documents and daily
management process (including metrics) • Achieve a 4S rating and develop a plan for achieving
and maintaining a 5S rating.
• One-piece flow established • Increase throughput by 35%. • Reduce lead-time by 75%. • Documents created and playbooks in place.
Standard WIP calculated & in place. At 90 days, 15% reduction in inventory dollars.
• 4S rating achieved after audit.
OTHER NOTES: Day Meeting Times Meeting Purpose Attendees Location
Friday October 1st
8:00am - 12:00pm Training Kaizen Team Training Room
Monday -Thursday
October 4 – 7
8:00am -???
Working Session
Kaizen Team Training Room
Friday October 8th
8:00am -11:00am
Working Session & Report Out
Kaizen Team; Mgmt. & CC
Training Room
208
APPENDIX E: PILOT VERSION OF KICKOFF SURVEY
Kickoff Survey
Hello Kaizen Team Member, Your help is needed on this important research. This survey is part of a research project sponsored by the National Science Foundation. The research studies the effects of Kaizen events and what makes them successful. Your company is one of the few companies chosen for the research and will get first access to the results. Your company will use the results to design better Kaizen events and better support its Kaizen event teams. This survey asks for your opinions on the goals of your Kaizen event team. The survey is short and should only take about 10 minutes to complete. Participation in this survey is voluntary. You are not asked to provide your name, just the name of your Kaizen event team. The survey confidential and the privacy of your answers will be protected. No one at your company will see your individual answers. If you wish to participate, please answer the questions on the next page (page 2). The questions ask you to describe how much you agree or disagree with statements about the goals of your team. If a question does not seem to be applicable, please answer “disagree” or “strongly disagree.” In the survey, “Kaizen event” refers to your Kaizen event team and not to any other teams working at the same time. “Work area” refers to the manufacturing area that is the focus of your Kaizen event. Thank you for your help in this important research! If you have any questions or comments, please contact [insert name of University contact, e-mail, and phone number].
209
Kaizen Team Name
Stro
ngly
D
isag
ree
Dis
agre
e
Tend
to
Dis
agre
e
Tend
to
Agr
ee
Agr
ee
Stro
ngly
A
gree
1 2 3 4 5 6
Circle the response that BEST describes your opinion. 1. In general, members of our [insert name of Kaizen event] team believe that
this Kaizen event is needed. 1 2 3 4 5 6
2. It will take a lot of skill to achieve our [insert name of Kaizen event] team's improvement goals.
1 2 3 4 5 6
3. Our entire [insert name of Kaizen event] team understands our goals 1 2 3 4 5 6 4. In general, members of our [insert name of Kaizen event] team believe in the
value of this Kaizen event. 1 2 3 4 5 6
5. Our goals clearly define what is expected of our [insert name of Kaizen event] team
1 2 3 4 5 6
6. Meeting our [insert name of Kaizen event] team's improvement goals will be tough
1 2 3 4 5 6
7. Most of our [insert name of Kaizen event] team members think that this Kaizen event is a good strategy for this work area.
1 2 3 4 5 6
8. Most of our [insert name of Kaizen event] team members think that things would be better without this Kaizen event.
1 2 3 4 5 6
9. Our [insert name of Kaizen event] team's improvement goals are difficult 1 2 3 4 5 6 10. Most of our [insert name of Kaizen event] team members that this Kaizen
event will serve an important purpose. 1 2 3 4 5 6
11. It will be hard to improve this work area enough to achieve our [insert name of Kaizen event] team's goals
1 2 3 4 5 6
12. Our [insert name of Kaizen event] team has clearly defined goals 1 2 3 4 5 6 13. In general, members of our [insert name of Kaizen event] team think that it is
a mistake to hold this Kaizen event 1 2 3 4 5 6
14. The performance targets our [insert name of Kaizen event] team must achieve to fulfill our goals are clear
1 2 3 4 5 6
15. How many Kaizen events total have you participated in? (Fill in the blank) _________________________________ 16. Which functional area most closely describes your current job? (Circle one number)
Thank you for your participation! If you have any other comments about your experience with Kaizen events, please include them on the back of this page.
210
APPENDIX F: FINAL VERSION OF KICKOFF SURVEY
Kickoff Survey
Hello [insert name of Kaizen event] Team Member, Your help is needed on this important research. This survey is part of a research project sponsored by the National Science Foundation. The research studies the effects of Kaizen events and what makes them successful. Your company is one of the few companies chosen for the research and will get first access to the results. Your company will use the results to design better Kaizen events and better support its Kaizen event teams. This survey asks for your opinions on the goals of your Kaizen event team (the [insert name of Kaizen event] team). The survey is short and should only take about 10 minutes to complete. The survey asks you to choose a unique survey code that will allow the researchers to perform analysis on the survey results. This code is very important. It will not be used to identify you, since only you will know what your code is. If you have already used a survey code on previous surveys for this research, please use the same code. If you have not completed any previous surveys for this research, please use one of the next three options to choose your survey code: Option 1: The first four letters of your mother’s maiden name [ex. Brown = “brow”] Option 2: The month and day of your birthday [ex. January 1 = “0101”] Option 3: The first four letters of your pet or child’s name [ex. Dolly = “doll”] Write the survey code you select on the top of the next page (page 2), after the words “Survey Code.” Please remember the code you select, since it will be used for future surveys. Do not include your name. The survey is confidential and the privacy of your answers will be protected. No one at your company will see your individual answers. Participation in this survey is voluntary. If you wish to participate, please answer the questions on the next page (page 2) and return the survey to the envelope provided. The questions ask you to describe how much you agree or disagree with statements about the goals of your team. You may decline to answer any question(s) you choose. If a question does not seem to apply to your team, it may be that you “disagree” or “strongly disagree” with the statement. In the survey, “Kaizen event” refers to your Kaizen event team and not to any other teams working at the same time. “Work area” refers to the manufacturing area that is the focus of your Kaizen event. Thank you for your help in this important research! If you have any questions or comments, please contact [insert name of University contact, e-mail, and phone number]. If you have questions about your rights as a research participant, please contact the Virginia Tech Institutional Review Board (IRB) Human Protections Administrator, [insert name, e-mail and phone number of university Institutional Review Board (IRB) Human Protections Administrator].
211
Kaizen Team Name: [insert name of Kaizen event]
Stro
ngly
D
isag
ree
Dis
agre
e
Tend
to
Dis
agre
e
Tend
to
Agr
ee
Agr
ee
Stro
ngly
A
gree
Survey Code: 1 2 3 4 5 6
Circle the response that BEST describes your opinion. 1. Most of our [insert name of Kaizen event] team members think that this
Kaizen event is a good strategy for this work area. 1 2 3 4 5 6
2. It will take a lot of effort to achieve our [insert name of Kaizen event] team's goals.
1 2 3 4 5 6
3. The performance targets our [insert name of Kaizen event] team must achieve to fulfill our goals are clear.
1 2 3 4 5 6
4. In general, members of our [insert name of Kaizen event] team believe in the value of this Kaizen event.
1 2 3 4 5 6
5. Our [insert name of Kaizen event] team has enough time to achieve our goals. 1 2 3 4 5 6 6. Most of our [insert name of Kaizen event] team members think that things
will be better with this Kaizen event. 1 2 3 4 5 6
7. It will be hard to improve this work area enough to achieve our [insert name of Kaizen event] team's goals.
1 2 3 4 5 6
8. It will take a lot of thought to achieve our [insert name of Kaizen event] team's goals.
1 2 3 4 5 6
9. In general, members of our [insert name of Kaizen event] team believe that this Kaizen event is needed.
1 2 3 4 5 6
10. Our [insert name of Kaizen event] team has clearly defined goals. 1 2 3 4 5 6 11. Our [insert name of Kaizen event] team's goals are difficult. 1 2 3 4 5 6 12. Most of our [insert name of Kaizen event] team members believe that this
Kaizen event will serve an important purpose. 1 2 3 4 5 6
13. Our entire [insert name of Kaizen event] team understands our goals. 1 2 3 4 5 6 14. Meeting our [insert name of Kaizen event] team's goals will be tough. 1 2 3 4 5 6 15. Our goals clearly define what is expected of our [insert name of Kaizen
event] team. 1 2 3 4 5 6
16. In general, members of our [insert name of Kaizen event] team think that it is a mistake to hold this Kaizen event.
1 2 3 4 5 6
17. It will take a lot of skill to achieve our [insert name of Kaizen event] team's goals.
1 2 3 4 5 6
18. Not including this event, how many Kaizen events total have you participated in? (Fill in the blank) _________________________________ 19. Which functional area most closely describes your current job? (Circle one number)
Thank you for your participation! If you have any other comments about your experience with Kaizen
events, please include them on the back of this page.
212
213
APPENDIX G: PILOT VERSION OF TEAM ACTIVITIES LOG
Team Activities Log
Hello Kaizen Team Member, Your help is needed on this important research. This form is part of a research project sponsored by the National Science Foundation. The research studies the effects of Kaizen events and what makes them successful. Your company is one of the few companies chosen for the research and will get first access to the results. Your company will use the results to design better Kaizen events and better support its Kaizen event teams. This form asks you to briefly record the daily activities Kaizen event team. The form is short and should only take about 15 minutes total to complete. Participation in this research is voluntary and confidential. You are not asked to provide your name, just the name of your Kaizen event team. If you wish to participate, use the timetable (“Team Activities Log”) on page 3 to briefly describe the daily activities of your team. Please write a brief description of each major activity (ex. setup, videotape review, etc) and indicate where the activity took place (meeting room or target work area). In addition, please indicate the tools your team used for each activity (ex. brainstorming, Pareto analysis). Finally, please indicate whether your team was working as a group or in subgroups. See page 2 for an example of a completed timetable (“Team Activities Log”). At the end of the Kaizen event, please return the completed form to [insert facilitator name] in the envelop provided. Thank you for your help in this important research! If you have any questions or comments, please contact [insert name of University contact, e-mail, and phone number]. .
214
Example of Completed Team Activities Log Kaizen Event Team: Alpha Line Standard Work
215
Team Activities Log – Please Use this Page to Briefly Record Your Team’s Daily Activities Kaizen Event Team: __________________________________________
216
APPENDIX H: FINAL VERSION OF TEAM ACTIVITIES LOG
Team Activities Log
Hello [insert name of Kaizen event] Team Member, Your help is needed on this important research. This form is part of a research project sponsored by the National Science Foundation. The research studies the effects of Kaizen events and what makes them successful. Your company is one of the few companies chosen for the research and will get first access to the results. Your company will use the results to design better Kaizen events and better support its Kaizen event teams. This form asks you to briefly record the daily activities Kaizen event team (the [insert name of Kaizen event] team). The form is short and should only take about 15 minutes total to complete. Participation in this research is voluntary and confidential. You are not asked to provide your name, just the name of your Kaizen event team. If you wish to participate, please use the timetable (“Team Activities Log”) on pages 4 – [insert page number based on length of event] to briefly describe the daily activities of the [insert name of Kaizen event] team. The time labels can refer to either am or pm. Please write “am” or “pm” in your descriptions to indicate the timing of your event (see example Logs). Please write a brief description of each major activity (ex. setup, videotape review, etc) and indicate where the activity took place (meeting room or target work area). In addition, please indicate the tools the [insert name of Kaizen event] team used for each activity (ex. brainstorming, Pareto analysis, etc.). Finally, please indicate whether the [insert name of Kaizen event] team was working as a group or in subgroups. See page 2 for an example of a completed Team Activities Log for a daytime event. See page for an example of a completed Team Activities Log for a nighttime event. At the end of the [insert name of Kaizen event] event, please return the completed form to [insert facilitator name] in the envelope provided. Thank you for your help in this important research! If you have any questions or comments, please contact [insert name of University contact, e-mail, and phone number]. If you have questions about your rights as a research participant, please contact the Virginia Tech Institutional Review Board (IRB) Human Protections Administrator, [insert name, e-mail and phone number of university Institutional Review Board (IRB) Human Protections Administrator].
217
Example of Completed Team Activities Log: Daytime Event (Day 1 – Day 3 of a 5 day event) Kaizen Event Team: Alpha Line Standard Work
Day 1 Day 2 Day 35:00
5:30
6:00
6:30
7:00
7:30
8:00
8:30
9:00
9:30
10:00
10:30
11:00
11:30
12:00 PM. Lunch PM. Lunch PM. Lunch
12:30
1:00
1:30
2:00
2:30
3:00
3:30
4:00
4:30
5:00
5:30
6:00
6:30
7:00
AM. Kickoff to introduce goals and objectives of the event. Members of senior management in attendance. (meeting room)
AM. Standard work training (meeting room)
PM. Standard work training (meeting room)
AM. Observe current state and collect data using time charts & spaghetti charts (work area)
AM. Split into subgroups. Group 1 = working on new cell layout ideas (meeting room) Group 2 = working on improving standard work procedures using takt time calculations and seven wastes of lean (meeting room)
PM. Regroup and present progress (meeting room)
PM. Team leader in meeting with facilitator (meeting room). Rest of the group moving equipment to implement new cell layout (work area)
PM. Team leader rejoins group, continuing hooking up equipment (work area)
AM. Train operators in new standard work procedures (work area)
AM. Test new standard work procedures using time charts and observation (work area)
PM. Split into subgroups. Group 1 = calculating supermarket quantities for cell (meeting room) Group 2 = brainstorming further improvements to standard work using takt time calculations, seven wastes of lean, etc. (meeting room)
PM. Regroup and report progress. Facilitator and member of management responsible for work area in attendance (meeting room)
218
Example of Completed Team Activities Log: Nighttime Event (Day 1 – Day 3 of a 5 day event) Kaizen Event Team: Machine B TPM
Day 1 Day 2 Day 35:00
5:30
6:00
6:30
7:00
7:30
8:00
8:30
9:00
9:30
10:00
10:30
11:00 PM. Dinner
11:30
12:00
12:30
1:00
1:30
2:00 AM. Lunch/Breakfast
2:30 AM. Break
3:00 AM. Training (meeting room) AM. Painting (work area)
3:30 AM. Clean-up (work area)
4:00 AM. Team meeting to talk about progress (meeting room)
4:30 AM. Clean-up (work area)
5:00
5:30
6:00
6:30
7:00
PM. Team meeting to discuss yesterday's progress and plan for today's work. Developed a new list of improvements to work on today. Assigned items to team members (meeting room)
AM. Team members went out to the work area to work on assigned action items (work area)
AM. Developed a list of items to work on and a action plan for working on them. (meeting room)
PM. Team meeting to discuss plans/agenda for the day (meeting room)
PM. Team members went out to the work area to work on assigned action items (work area)
AM. Dinner
AM. Worked as a team on more difficult improvements (work area)
AM. Painting and labeling (work area)
PM. Kickoff meeting (introduction to the goals of the event) (meeting room)
PM. Training (meeting room)
AM. Pre-TPM Evaluation of Machine B (work area)
219
Team Activities Log – Please Use this Page to Briefly Record the [insert name of Kaizen event] Team’s Daily Activities Kaizen Event Team: [insert name of Kaizen event]
Day 1 Day 2 Day 35:00
5:30
6:00
6:30
7:00
7:30
8:00
8:30
9:00
9:30
10:00
10:30
11:00
11:30
12:00
12:30
1:00
1:30
2:00
2:30
3:00
3:30
4:00
4:30
5:00
5:30
6:00
6:30
7:00
Team Activities Log – Please Use this Page to Continue Recording the [insert name of Kaizen event] Team’s Daily Activities
Kaizen Event Team: [insert name of Kaizen event] Day 4 Day 5 Day 6
5:00
5:30
6:00
6:30
7:00
7:30
8:00
8:30
9:00
9:30
10:00
10:30
11:00
11:30
12:00
12:30
1:00
1:30
2:00
2:30
3:00
3:30
4:00
4:30
5:00
5:30
6:00
6:30
7:00
220
APPENDIX I: PILOT VERSION OF REPORT OUT SURVEY
Report Out Survey Hello Kaizen Team Member, Your help is needed on this important research. This survey is part of a research project sponsored by the National Science Foundation. The research studies the effects of Kaizen events and what makes them successful. Your company is one of the few companies chosen for the research and will get first access to the results. Your company will use the results to design better Kaizen events and better support its Kaizen event teams. This survey asks for your opinions on the on the Kaizen event you just completed. The survey should take about 15 minutes to complete. Participation in this survey is voluntary. You are not asked to provide your name, just the name of your Kaizen event team. The survey confidential and the privacy of your answers will be protected. No one at your company will see your individual answers. If you wish to participate, please answer the questions on the next two pages (page 2 and page 3). The questions ask you to describe how much you agree or disagree with statements about the goals of your team. If a question does not seem to be applicable, please answer “disagree” or “strongly disagree.” In the survey, “Kaizen event” refers to your Kaizen event team and not to any other teams working at the same time. “Work area” refers to the manufacturing area that is the focus of your Kaizen event. Thank you for your help in this important research! If you have any questions or comments, please contact [insert name of University contact, e-mail, and phone number].
221
Kaizen Team Name
Stro
ngly
D
isag
ree
Dis
agre
e
Tend
to
Dis
agre
e
Tend
to
Agr
ee
Agr
ee
Stro
ngly
A
gree
1 2 3 4 5 6
Circle the response that BEST describes your opinion. 1. Most members of our [insert name of Kaizen event] team would like to be
part of Kaizen events in the future. 1 2 3 4 5 6
2. Our [insert name of Kaizen event] team spent a lot of time discussing ideas before trying them out in the work area
1 2 3 4 5 6
3. Overall, this Kaizen event increased our [insert name of Kaizen event] team members' interest in our work.
1 2 3 4 5 6
4. Overall, this Kaizen event increased our [insert name of Kaizen event] team members' knowledge of the need for continuous improvement.
1 2 3 4 5 6
5. This Kaizen event has improved the performance of this work area. 1 2 3 4 5 6 6. Our [insert name of Kaizen event] team was free to make changes to the work
area as soon as we thought of them. 1 2 3 4 5 6
7. Most of our [insert name of Kaizen event] team members gained new skills as a result of our participation in this Kaizen event.
1 2 3 4 5 6
8. Our [insert name of Kaizen event] team had enough help from our facilitator to get our work done.
1 2 3 4 5 6
9. Our [insert name of Kaizen event] team spent as much time as possible in the work area
1 2 3 4 5 6
10. Our [insert name of Kaizen event] team had a lot of freedom in determining how to improve this work area.
1 2 3 4 5 6
11. Most of our [insert name of Kaizen event] team members liked being part of this Kaizen event.
1 2 3 4 5 6
12. Our [insert name of Kaizen event] team had enough equipment to get our work done.
1 2 3 4 5 6
13. This Kaizen event increased most of our [insert name of Kaizen event] team members' ability to measure the impact of changes made to this work area.
1 2 3 4 5 6
14. Overall, this Kaizen event increased our [insert name of Kaizen event] team members' knowledge of what continuous improvement is.
1 2 3 4 5 6
15. Our [insert name of Kaizen event] team had a lot of freedom in determining how we spent our time during the event.
1 2 3 4 5 6
16. In general, this Kaizen event increased my team members' knowledge of our role in continuous improvement.
1 2 3 4 5 6
17. Most of our [insert name of Kaizen event] team members can communicate new ideas about improvements as a result of our participation in this Kaizen event.
1 2 3 4 5
6
18. In general, this Kaizen event increased our [insert name of Kaizen event] team members' knowledge of how continuous improvement can be applied.
1 2 3 4 5 6
222
Stro
ngly
D
isag
ree
Dis
agre
e
Tend
to
Dis
agre
e
Tend
to
Agr
ee
Agr
ee
Stro
ngly
A
gree
1 2 3 4 5 6
Circle the response that BEST describes your opinion. 19. Our [insert name of Kaizen event] team had a lot of freedom in determining
what changes to make to this work area. 1 2 3 4 5 6
20. Our [insert name of Kaizen event] team tried out changes to the work area right after we thought of them
1 2 3 4 5 6
21. Overall, this Kaizen event helped people in this area work together to improve performance.
1 2 3 4 5 6
22. This work area improved measurably as a result of this Kaizen event. 1 2 3 4 5 6 23. Our [insert name of Kaizen event] team spent very little time in our meeting
room 1 2 3 4 5 6
24. Our [insert name of Kaizen event] team had enough materials and supplies to get our work done
1 2 3 4 5 6
25. This Kaizen event made most of our [insert name of Kaizen event] team members more comfortable working with others to identify improvements.
1 2 3 4 5 6
26. Our [insert name of Kaizen event] team had enough help from others in our organization to get our work done.
1 2 3 4 5 6
27. In general, this Kaizen event motivated the members of our [insert name of Kaizen event] team to perform better.
1 2 3 4 5 6
28. This Kaizen event had a positive effect on this work area. 1 2 3 4 5
6 29. Our [insert name of Kaizen event] team had enough contact with management
to get our work done. 1 2 3 4 5 6
31. How many Kaizen events total have you participated in? (Fill in the blank) _________________________________ 32. Which functional area most closely describes your current job? (Circle one number)
33. What were the biggest obstacles to the success of the [insert name of Kaizen event] team (what did your team have to work hardest to overcome)? 34. What were the biggest contributors to the success of the [insert name of Kaizen event] team (what most helped your team to complete its work)?
Thank you for your participation! If you have any other comments about your experience with Kaizen events, please include them on the back of this page.
223
APPENDIX J: FINAL VERSION OF REPORT OUT SURVEY
Report Out Survey
Hello [insert name of Kaizen event] Team Member, Your help is needed on this important research. This survey is part of a research project sponsored by the National Science Foundation. The research studies the effects of Kaizen events and what makes them successful. Your company is one of the few companies chosen for the research and will get first access to the results. Your company will use the results to design better Kaizen events and better support its Kaizen event teams. This survey asks for your opinions on the Kaizen event you just completed (the [insert name of Kaizen event] event). The survey should take about 15 minutes to complete. Please use the same survey code you used on the Kickoff Survey. Again, including this code is very important to allow the researchers to analyze survey results, but will not identify who you are, since only you know which code you chose. If you did not participate in the Kickoff Survey, please use one of the next three options to choose your survey code: Option 1: The first four letters of your mother’s maiden name [ex. Brown = “brow”] Option 2: The month and day of your birthday [ex. January 1 = “0101”] Option 3: The first four letters of your pet or child’s name [ex. Dolly = “doll”] Write your survey code on the top of the next page (page 2), after the words “Survey Code.” Do not include your name. The survey is confidential and the privacy of your answers will be protected. No one at your company will see your individual answers. Participation in this survey is voluntary. If you wish to participate, please answer the questions on the next three pages (pages 2 - 4) and return the survey in the envelope provided. The questions ask you to describe how much you agree or disagree with statements about the goals of your team. You may decline to answer any question(s) you choose. If a question does not seem to apply to your team, it may be that you “disagree” or “strongly disagree” with the statement. In the survey, “Kaizen event” refers to your Kaizen event team and not to any other teams working at the same time. “Work area” refers to the manufacturing area that is the focus of your Kaizen event. Thank you for your help in this important research! If you have any questions or comments, please contact [insert name of University contact, e-mail, and phone number]. If you have questions about your rights as a research participant, please contact the Virginia Tech Institutional Review Board (IRB) Human Protections Administrator, [insert name, e-mail and phone number of university Institutional Review Board (IRB) Human Protections Administrator].
224
Kaizen Team Name: [insert name of Kaizen event]
Stro
ngly
D
isag
ree
Dis
agre
e
Tend
to
Dis
agre
e
Tend
to
Agr
ee
Agr
ee
Stro
ngly
A
gree
Survey Code: 1 2 3 4 5 6
Circle the response that BEST describes your opinion.
1. Our [insert name of Kaizen event] team spent a lot of time discussing ideas before trying them out in the work area.
1 2 3 4 5 6
2. Most of our [insert name of Kaizen event] team members liked being part of this Kaizen event.
1 2 3 4 5 6
3. In general, our [insert name of Kaizen event] team members are comfortable working with others to identify improvements in this work area.
1 2 3 4 5 6
4. Our [insert name of Kaizen event] team valued the diversity in our team members.
1 2 3 4 5 6
5. Our [insert name of Kaizen event] team had enough help from others in our organization to get our work done.
1 2 3 4 5 6
6. Our [insert name of Kaizen event] team respected each others' feelings. 1 2 3 4 5 6
7. Most of our [insert name of Kaizen event] team members gained new skills as a result of participation in this Kaizen event.
1 2 3 4 5 6
8. Our [insert name of Kaizen event] team spent very little time in our meeting room.
1 2 3 4 5 6
9. Our [insert name of Kaizen event] team had enough equipment to get our work done.
1 2 3 4 5 6
10. In general, this Kaizen event increased our [insert name of Kaizen event] team members' knowledge of our role in continuous improvement.
1 2 3 4 5 6
11. In general, this Kaizen event motivated the members of our [insert name of Kaizen event] team to perform better.
1 2 3 4 5 6
12. Our [insert name of Kaizen event] team spent as much time as possible in the work area.
1 2 3 4 5 6
13. Our [insert name of Kaizen event] team had a lot of freedom in determining what changes to make to this work area.
1 2 3 4 5 6
14. Our [insert name of Kaizen event] team had enough materials and supplies to get our work done.
1 2 3 4 5 6
15. Most of our [insert name of Kaizen event] team members are able to measure the impact of changes made to this work area.
1 2 3 4 5 6
16. Overall, this Kaizen event increased our [insert name of Kaizen event] team members' interest in work.
1 2 3 4 5 6
17. Our [insert name of Kaizen event] team had enough contact with management to get our work done.
1 2 3 4 5 6
18. Our [insert name of Kaizen event] team valued each member's unique contributions.
1 2 3 4 5 6
19. This Kaizen event has improved the performance of this work area. 1 2 3 4 5 6
225
Stro
ngly
D
isag
ree
Dis
agre
e
Tend
to
Dis
agre
e
Tend
to
Agr
ee
Agr
ee
Stro
ngly
A
gree
1 2 3 4 5 6
Circle the response that BEST describes your opinion.
20. Our [insert name of Kaizen event] team respected each others' opinions. 1 2 3 4 5 6
21. Most members of our [insert name of Kaizen event] team would like to be part of Kaizen events in the future.
1 2 3 4 5 6
22. In general, this Kaizen event increased our [insert name of Kaizen event] team members' knowledge of how continuous improvement can be applied.
1 2 3 4 5 6
23. Most of our [insert name of Kaizen event] team members can communicate new ideas about improvements as a result of participation in this Kaizen event.
1 2 3 4 5 6
24. Overall, this Kaizen event increased our [insert name of Kaizen event] team members' knowledge of what continuous improvement is.
1 2 3 4 5 6
25. Our [insert name of Kaizen event] team had a lot of freedom in determining how we spent our time during the event.
1 2 3 4 5 6
26. Overall, this Kaizen event helped people in this area work together to improve performance.
1 2 3 4 5 6
27. This work area improved measurably as a result of this Kaizen event. 1 2 3 4 5 6
28. Our [insert name of Kaizen event] team had enough help from our facilitator to get our work done.
1 2 3 4 5 6
29. Our [insert name of Kaizen event] team was free to make changes to the work area as soon as we thought of them.
1 2 3 4 5 6
30. Our [insert name of Kaizen event] team communicated openly. 1 2 3 4 5 6
31. Our [insert name of Kaizen event] team tried out changes to the work area right after we thought of them.
1 2 3 4 5 6
32. Our [insert name of Kaizen event] team had a lot of freedom in determining how to improve this work area.
1 2 3 4 5 6
33. Overall, this Kaizen event increased our [insert name of Kaizen event] team members' knowledge of the need for continuous improvement.
1 2 3 4 5 6
34. This Kaizen event had a positive effect on this work area. 1 2 3 4 5 6
35. Overall, this Kaizen event was a success. 1 2 3 4 5
6
36. Including this event, how many Kaizen events total have you participated in? (Fill in the blank) _________________________________ 37. Which functional area most closely describes your current job? (Circle one number)
38. What were the biggest obstacles to the success of the [insert name of Kaizen event] team (what did your team have to work hardest to overcome)? 39. What were the biggest contributors to the success of the [insert name of Kaizen event] team (what most helped your team to complete its work)?
Thank you for your participation! If you have any other comments about your experience with Kaizen events, please include them on the back of this page.
227
APPENDIX K: PILOT VERSION OF EVENT INFORMATION SHEET
Event Information Sheet Hello Kaizen Event Facilitator, Your help is needed on this important research. This questionnaire is part of a research project sponsored by the National Science Foundation. The research studies the effects of Kaizen events and what makes them successful. Your company is one of the few companies chosen for the research and will get first access to the results. You will be able to use the results to design better Kaizen events and better support Kaizen event teams. This questionnaire asks for information about a specific Kaizen event that you facilitated. It should only take about 10 minutes to complete. Participation in this research is voluntary. If you wish to participate, please answer the questions on the next three pages (pages 2 - 4). Thank you for your help in this important research! If you have any questions or comments, please contact [insert name of University contact, e-mail, and phone number].
228
Event Information Sheet
1. Event Name: ____________________________ 2. Dates: _______________________ 3. Team Composition Please fill-in the number of Kaizen event team members in each job category:
4. Team Leader How many Kaizen events total has the team leader led or co-led in the past three years? __________ 5. Work Area Complexity Please answer the following questions about the work area that was the target of this Kaizen event:
Circle the response that BEST describes your opinion. Stro
ngly
D
isag
ree
Dis
agre
e
Tend
to
Dis
agre
e
Tend
to
Agr
ee
Agr
ee
Stro
ngly
A
gree
The work the target work area does is routine. 1 2 3 4 5 6
The target work area produces the same product (SKU) most of the time.
1 2 3 4 5 6
A given product (SKU) requires the same processing steps each time it is produced.
1 2 3 4 5 6
Most of the products (SKUs) produced in the work area follow a very similar production process.
1 2 3 4 5 6
6. Event Planning How many hours total did you and others spend planning this Kaizen event? _____________ Were there any unusual planning activities completed for this event, which are not normally part of the event planning process? If so, what? (Please briefly describe below) Example: “pre-event meetings with work area employees” (if this is not usually part of the event planning process)
229
230
7. Team Goals Please list the goals of the Kaizen event team and the actual team results. Please also indicate which goals describe the main purpose of the event (the “major” or “most important” goals) and which goals were less important (secondary goals). Example Team Goal Result Achieved Main Goal or Secondary Goal? 1. Reduce Cycle Time by 90% 70% reduction in cycle time Main Goal 2. Achieve a 3S rating Achieved a 3S rating Secondary Goal This Kaizen Event Team: Team Goal Result Achieved Main Goal or Secondary Goal? 1.
2.
3.
4.
5.
6.
7.
8.
9.
10.
8. Event Success
Circle the response that BEST describes your opinion. Stro
ngly
D
isag
ree
Dis
agre
e
Tend
to
Dis
agre
e
Tend
to
Agr
ee
Agr
ee
Stro
ngly
A
gree
Overall, this Kaizen event was a success. 1 2 3 4 5 6 9. Management Interaction with the Kaizen Event Team Please briefly describe below the degree of face-to-face interaction members of management had with the Kaizen event team. (Ex. Did members of management attend the kickoff and report out meetings? Did members of management visit the Kaizen team while it was at work?)
231
10. Team Use of Problem Solving Tools During the event, how many hours total did you spend with the team (not including the kickoff meeting, training and the report-out meeting)? ______________ Please list all problem solving tools used by the team in the box below. Then, for each tool, please rate the team’s use of the tool on: 1) appropriateness of using this tool to address the team’s goals; and 2) quality of the team’s use of this tool.
How appropriate was this tool for the team’s objectives? How well did the team use this tool?
Com
plet
ely
Inap
prop
riate
Inap
prop
riate
Som
ewha
t In
appr
opria
te
Som
ewha
t A
ppro
pria
te
App
ropr
iate
Com
plet
ely
App
ropr
iate
Ver
y Po
orly
Poor
ly
Som
ewha
t Po
orly
Som
ewha
t W
ell
Wel
l
Ver
y W
ell
Tool 1: 1 2 3 4 5 6 1 2 3 4 5 6
Tool 2: 1 2 3 4 5 6 1 2 3 4 5 6
Tool 3: 1 2 3 4 5 6 1 2 3 4 5 6
Tool 4: 1 2 3 4 5 6 1 2 3 4 5 6
Tool 5: 1 2 3 4 5 6 1 2 3 4 5 6
Tool 6: 1 2 3 4 5 6 1 2 3 4 5 6
Tool 7: 1 2 3 4 5 6 1 2 3 4 5 6
Tool 8: 1 2 3 4 5 6 1 2 3 4 5 6
Tool 9: 1 2 3 4 5 6 1 2 3 4 5 6
Tool 10: 1 2 3 4 5 6 1 2 3 4 5 6
232
APPENDIX L: FINAL VERSION OF EVENT INFORMATION SHEET
Event Information Sheet Hello [insert name of Kaizen event] Event Facilitator, Your help is needed on this important research. This questionnaire is part of a research project sponsored by the National Science Foundation. The research studies the effects of Kaizen events and what makes them successful. Your company is one of the few companies chosen for the research and will get first access to the results. You will be able to use the results to design better Kaizen events and better support Kaizen event teams. This questionnaire asks for information about a specific Kaizen event that you facilitated (the [insert name of Kaizen event] event). It should only take about 15 minutes to complete. Participation in this research is voluntary. If you wish to participate, please answer the questions on the next five pages (pages 2 – 6). You may decline to answer any question(s) you choose. Thank you for your help in this important research! If you have any questions or comments, please contact [insert name of University contact, e-mail, and phone number]. If you have questions about your rights as a research participant, you should contact the Institutional Review Board (IRB) Human Protections Administrator at [insert name, e-mail and phone number of university Institutional Review Board (IRB) Human Protections Administrator].
233
Event Information Sheet
1. Event Name: [insert name of Kaizen event] 2. Dates: 3. Team Composition Please fill-in the number of [insert name of Kaizen event] team members in each job category. If any team members fall in the “Other” category please briefly describe their job category (e.g., “Marketing”) or role (e.g., “Facilitator”).
4. Team Leader Including the [insert name of Kaizen event], how many Kaizen events total has the team leader led or co-led in the past three years? 5. Work Area Complexity Please answer the following questions about the work area that was the target of the [insert name of Kaizen event] event: Work Area Name: Please provide a very brief description of the major products of the work area, the relative percentage of each produced (of the total work area volume) and the units of cycle time for each (seconds, minutes, hours, days, weeks, or months).
Product Description % of Total Work Area Volume Cycle Time Units 1. 2. 3. 4. 5. 6. 7. 8. 9. 10.
234
Please answer the questions below about the complexity of the target work area’s production processes:
Circle the response that BEST describes your opinion. Stro
ngly
D
isag
ree
Dis
agre
e
Tend
to
Dis
agre
e
Tend
to
Agr
ee
Agr
ee
Stro
ngly
A
gree
The work the target work area does is routine. 1 2 3 4 5 6
The target work area produces the same product (SKU) most of the time.
1 2 3 4 5 6
A given product (SKU) requires the same processing steps each time it is produced.
1 2 3 4 5 6
Most of the products (SKUs) produced in the work area follow a very similar production process.
1 2 3 4 5 6
Have there been other Kaizen events that have targeted this work area (before the [insert name of Kaizen event])? 1
= YES 2 =NO If yes, please indicate the general description and date (MM/YY) of the other events. Also, if you are familiar with the event, please indicate your opinion of its general level of success. If you are not familiar with the event, please select “Don’t Know.”
6. Team Goals Please list the goals of the [insert name of Kaizen event] team and the actual team results. Please also indicate which goals describe the main purpose of the [insert name of Kaizen event] event (the “major” or “most important” goals) and which goals were less important (secondary goals). Example Team Goal Result Achieved Main Goal or Secondary Goal? 1. Reduce Cycle Time by 90% 70% reduction in cycle time Main Goal 2. Achieve a 3S rating Achieved a 3S rating Secondary Goal
235
The [insert name of Kaizen event] Team: Team Goal Result Achieved Main Goal or Secondary Goal? 1. 2. 3. 4. 5. 6. 7. 8. 9. 10. 7. Event Success
Circle the response that BEST describes your opinion. Stro
ngly
D
isag
ree
Dis
agre
e
Tend
to
Dis
agre
e
Tend
to
Agr
ee
Agr
ee
Stro
ngly
A
gree
Overall, the [insert name of Kaizen event] event was a success. 1 2 3 4 5 6
236
8. Team Use of Problem Solving Tools Did the [insert name of Kaizen event] team follow a structured improvement methodology (e.g., SMED, Standard Work, etc.)? 1 = YES 2 =NO If so, which methodology? During the [insert name of Kaizen event] event, how many hours total did you spend with the team (not including the kickoff meeting, training and the report-out meeting)? Please list all problem solving tools used by the [insert name of Kaizen event] team in the box below (e.g., brainstorming, fishbone diagramming, Pareto analysis, SMED, etc.). Then, for each tool, please rate the team’s use of the tool on: 1) appropriateness of using this tool to address the team’s goals; and 2) quality of the team’s use of this tool.
How appropriate was this tool for the team’s objectives?
How do you rate the overall quality of the team’s use of this tool?
Ver
y In
appr
opria
te
Inap
prop
riate
Som
ewha
t In
appr
opria
te
Som
ewha
t A
ppro
pria
te
App
ropr
iate
Ver
y A
ppro
pria
te
Ver
y Po
or
Poor
Fair
Goo
d
Ver
y G
ood
Exce
llent
Tool 1: 1 2 3 4 5 6 1 2 3 4 5 6
Tool 2: 1 2 3 4 5 6 1 2 3 4 5 6
Tool 3: 1 2 3 4 5 6 1 2 3 4 5 6
Tool 4: 1 2 3 4 5 6 1 2 3 4 5 6
Tool 5: 1 2 3 4 5 6 1 2 3 4 5 6
Tool 6: 1 2 3 4 5 6 1 2 3 4 5 6
Tool 7: 1 2 3 4 5 6 1 2 3 4 5 6
Tool 8: 1 2 3 4 5 6 1 2 3 4 5 6
Tool 9: 1 2 3 4 5 6 1 2 3 4 5 6
Tool 10: 1 2 3 4 5 6 1 2 3 4 5 6
9. Team Decision Making Process Please indicate your perceptions of the overall quality of the [insert name of Kaizen event] team’s decision making process.
Circle the response that BEST describes your opinion. Stro
ngly
D
isag
ree
Dis
agre
e
Tend
to
Dis
agre
e
Tend
to
Agr
ee
Agr
ee
Stro
ngly
A
gree
The process the [insert name of Kaizen event] team used to make decisions was sound.
1 2 3 4 5 6
10. Event Pre-Work How many hours total did you and others spend planning and doing other pre-work for the [insert name of Kaizen event] event? (collecting current state data, developing event plan, etc.) Were there any unusual pre-work activities completed for the [insert name of Kaizen event] event, which are not normally part of the event pre-work process? If so, what? (Please briefly describe below) Example: “pre-event meetings with work area employees” (if this is not usually part of the event planning process) 11. Kickoff Meeting Process
Circle the response that BEST describes your opinion. Not
at A
ll
To a
Gre
at
Exte
nt
To what extent did the [insert name of Kaizen event] team interact during the kickoff meeting? (i.e., to what extent was there group discussion of the event goals).
1 2 3 4 5 6
Please briefly describe the kickoff meeting agenda below.
237
12. Team Training What topics were covered in team training? (e.g., group rules/norms, SMED process, seven wastes of lean, etc.) Did everyone on the team receive the same training? 1 = YES 2 =NO If no, please briefly explain below. 13. Management Interaction with the Kaizen Event Team Please briefly describe below the degree of face-to-face interaction members of management had with the [insert name of Kaizen event] team. (Did members of management attend the kickoff and report out meetings? Did members of management visit the Kaizen team while it was at work?) 14. Biggest Obstacles to Team Success In your opinion, what were the biggest obstacles to the success of the [insert name of Kaizen event] team? (That is, what factors – either internal or external to the team – most strongly threatened the success of the team?) 15. Biggest Contributors to Team Success What were the biggest contributors to the success of the [insert name of Kaizen event] team? (That is, what factors – either internal or external to the team – most increased the likelihood of team success?)
238
APPENDIX M: PILOT VERSION OF KAIZEN EVENT PROGRAM INTERVIEW GUIDE
Kaizen Event Program Interview Guide Interviewer: Date: Start time: End time: Organizational Demographics: Name: Location: Industry sector: Major products: Number of employees: Number of local facilities: Introductory Comments This interview is part of a research project sponsored by the National Science Foundation, in which your company his participating. The purpose of the research is to study the effects of Kaizen events and what makes them successful. Your company is one of the few companies chosen for the research and will get first access to the results. Your company will be able to use the research results to design better Kaizen events and better support its Kaizen event teams.
The purpose of this interview is to obtain information about your company’s overall experience with Kaizen events to date. Interview questions will cover a number of different aspects of Kaizen events – planning, the event process, sustainability mechanisms, etc. This information will help researchers understand the context and process of Kaizen events within your company. This will help the researchers better interpret research findings and understand the similarities and differences between participating companies.
This interview should take about 30- 40 minutes. Your participation is voluntary and confidential. You can decide not to participate at any time. In addition, the privacy of your answers will be protected. No one at the organization will see your answers to these interview questions.
Do you wish to continue? Background Questions
1. When was the first kaizen event in your company? 2. How long has the company been sponsoring kaizen events systematically?
3. How many kaizen events have you had in the company?
4. What types of objective benefits/results have you realized from Kaizen events?
5. What types of non-measurable benefits have you realized?
6. To what extent are kaizen events viewed as a success in your organization?
Event Planning
7. In general, how often are Kaizen events conducted in your company?
8. Does your company keep a master schedule of all events planned for some upcoming time window? a. If yes, ask for a copy of the schedule b. If yes, what is the time window of the event schedule
239
9. What have typically been the catalysts for change determining the need for kaizen events? (customer-driven?
Competition-driven? Etc.)
10. How do you select which work areas should be targeted for Kaizen events? (e.g., what is your “filtering”/Kaizen event selection process?)
11. How do you know when not to do a Kaizen event (boundary conditions)?
12. What percent of your organization has experienced kaizen events? (% by production line/cell?)
a. What is the relative percentage of events in non-manufacturing versus manufacturing areas? b. What are the major types of processes (e.g., operations, sales, engineering) in which kaizen events have
been conducted? What is the relative percentage of events that have been conducted in each?
13. What percent have had two or more events?
14. What percent of your workforce has been involved in kaizen events? Event Process
15. What types of events does your company conduct (e.g., SMED, Std Wrk) 16. If your company conducts different types of events, what is the relative percentage of each type?
17. Is there a separate, standardized process for each type of event (e.g. separate training material for SMED versus
Std Wrk), or all are all events conducted using the same general process?
18. For each type of Kaizen event, what is the total time frame (in days)? 19. Does your company conduct shorter (one or two day) versions of Kaizen events that are not considered “formal
events”?
a. If yes, what boundary conditions are used to differentiate “formal” versus “informal” events?
20. What is the typical format for each type of kaizen event and how long is spent on each part of the event? (e.g., kick-off? Training? Analysis? Designing future state?)
21. Do you have a formal report out process?
a. If yes, ask for an example report out file (ideally, one for several different types, types of areas –
manufacturing versus non-manufacturing)
22. What types of performance areas (measures) are typically targeted in each type of kaizen event?
23. For each type of event, how many people typically make up the kaizen team?
24. For each type of event, what is the typical composition of the kaizen team?
25. What are the typical roles within a Kaizen event team?
a. Do all events use the same person as the facilitator, or does this role rotate within the organization or even external to the organization?
26. What mechanisms do you have in place to sustain Kaizen event outcomes?
27. Have there been any issues (problems, difficulties) with sustainability (either of measurable or non-measurable
benefits)?
240
28. Other problem areas with events?
29. How did you develop your event process (external consultant, training from parent company, published literature, etc.)?
30. How have you improved your Kaizen process over the years?
31. What are the resources available for kaizen events? (Budget? Facilitation? Training?) 32. What % of your budget and/or what % of people’s time is devoted to Kaizen events on an ongoing basis?
33. What is your process for capturing “lessons learned”?
a. For a single Kaizen event b. Across multiple Kaizen events
34. Do you see your use of Kaizen events increasing, decreasing or staying the same over the next several years? 35. Polar opposite question: what characterizes your best versus “worst” Kaizen events?
241
APPENDIX N: PILOT VERSION OF KAIZEN EVENT PROGRAM INTERVIEW GUIDE – WRITTEN STATEMENT FOR PARTICIPANTS
Interview for Kaizen Event Research:
Written Statement for Participants Hello, This interview is part of a research project sponsored by the National Science Foundation, in which your company is participating. The purpose of the research is to study the effects of Kaizen events and what makes them successful. Your company is one of the few companies chosen for the research and will get first access to the results. Your company will be able to use the research results to design better Kaizen events and better support its Kaizen event teams. The purpose of this interview is to obtain information about your company’s overall experience with Kaizen events to date. Interview questions will cover a number of different aspects of Kaizen events – planning, the event process, sustainability mechanisms, etc. This information will help researchers understand the context and process of Kaizen events within your company. This will help the researchers better interpret research findings and understand the similarities and differences between participating companies. This interview should take about 30 - 40 minutes. Your participation is voluntary and confidential. You can decide not to participate at any time. In addition, the privacy of your answers will be protected. No one at the organization will see your answers to these interview questions. To participate, please contact [insert name of University contact, e-mail, and phone number]. Thank you for your help in this important research! If you have any questions or comments, please contact [insert name of University] using the information above.
242
APPENDIX O: FINAL VERSION OF KAIZEN EVENT PROGRAM INTERVIEW GUIDE
Kaizen Event Program Interview Guide Interviewer: Date:
Start time:
End time:
Organizational Demographics: Name: Location: Industry sector: Major products: Number of employees: Number of local facilities: Introductory Comments This interview is part of a research project sponsored by the National Science Foundation, in which your company is participating. The purpose of the research is to study the effects of Kaizen events and what makes them successful. Your company is one of the few companies chosen for the research and will get first access to the results. Your company will be able to use the research results to design better Kaizen events and better support its Kaizen event teams. The purpose of this interview is to obtain information about your company’s overall experience with Kaizen events to date. Interview questions will cover a number of different aspects of Kaizen events – planning, the event process, sustainability mechanisms, etc. This information will help researchers understand the context and process of Kaizen events within your company. This will help the researchers better interpret research findings and understand the similarities and differences between participating companies.
Do you wish to continue?
Background Questions
1. When was the first Kaizen event in your company? 2. How long has the company been sponsoring kaizen events systematically?
3. How many Kaizen events have you had in the company?
4. What types of objective benefits/results have you realized from Kaizen events?
5. What types of non-measurable benefits have you realized?
6. To what extent are Kaizen events viewed as a success in your organization?
Event Planning
7. In general, how often are Kaizen events conducted in your company?
8. Does your company keep a master schedule of all events planned for some upcoming time window? a. If yes, ask for a copy of the schedule b. If yes, what is the time window of the event schedule
243
9. What have typically been the catalysts for change determining the need for Kaizen events? (customer-driven?
Competition-driven? Etc.)
10. How do you select which work areas should be targeted for Kaizen events? (e.g., what is your “filtering”/Kaizen event selection process?)
11. How do you know when not to do a Kaizen event (boundary conditions)?
12. What percent of your organization has experienced Kaizen events? (% by production line/cell?)
a. What is the relative percentage of events in non-manufacturing versus manufacturing areas? b. What are the major types of processes (e.g., operations, sales, engineering) in which kaizen events have
been conducted? What is the relative percentage of events that have been conducted in each?
13. What percent have had two or more events?
14. What percent of your workforce has been involved in Kaizen events? Event Process
15. What types of events does your company conduct (e.g., SMED, Std Wrk)? 16. If your company conducts different types of events, what is the relative percentage of each type? 17. Is there a separate, standardized process for each type of event (e.g. separate training material for SMED versus
Std Wrk), or are all events conducted using the same general process?
18. For each type of Kaizen event, what is the total time frame (in days)? 19. Does your company conduct shorter (one or two day) versions of Kaizen events that are not considered “formal
events”?
a. If yes, what boundary conditions are used to differentiate “formal” versus “informal” events?
20. What is the typical format for each type of Kaizen event and how long is spent on each part of the event? (e.g., kick-off? Training? Analysis? Designing future state?)
21. Do you have a formal report out process?
a. If yes, ask for an example report out file (ideally, one for several different types, types of areas –
manufacturing versus non-manufacturing)
22. What types of performance areas (measures) are typically targeted in each type of Kaizen event?
23. For each type of event, how many people typically make up the Kaizen team?
24. For each type of event, what is the typical composition of the Kaizen team?
25. What are the typical roles within a Kaizen event team?
a. Do all events use the same person as the facilitator, or does this role rotate within the organization or even external to the organization?
26. What mechanisms do you have in place to sustain Kaizen event outcomes?
27. Have there been any issues (problems, difficulties) with sustainability (either of measurable or non-measurable
benefits)?
244
28. Other problem areas with events?
29. How did you develop your event process (external consultant, training from parent company, published literature,
etc.)? 30. How have you improved your Kaizen process over the years?
31. What are the resources available for kaizen events? (Budget? Facilitation? Training?) 32. What % of your budget and/or what % of people’s time is devoted to Kaizen events on an ongoing basis?
33. What is your process for capturing “lessons learned”?
a. For a single Kaizen event b. Across multiple Kaizen events
34. Do you see your use of Kaizen events increasing, decreasing or staying the same over the next several years? 35. Polar opposite question: what characterizes your best versus “worst” Kaizen events?
245
APPENDIX P: FINAL VERSION OF KAIZEN EVENT PROGRAM INTERVIEW GUIDE – WRITTEN STATEMENT FOR PARTICIPANTS
Kaizen Event Program Interview: Informed Consent Form
Hello, This interview is part of a research project sponsored by the National Science Foundation, in which your company is participating. This form describes what is involved in this interview, so you can make an informed choice of whether or not to participate. You will be provided with a copy of this form for your records. I. Purpose
The purpose of the research is to study the effects of Kaizen events and what makes them successful. The purpose of this interview is to obtain information about your company’s overall experience with Kaizen events to date. This information will help the researchers better interpret research findings and understand the similarities and differences between participating companies. The research project will consist of 7 – 15 companies in a variety of industries. To participate, the companies must meet the following selection criteria: 1) manufacture products of some type; 2) have conducted Kaizen events for at least one year; 3) use Kaizen events systematically, as part of a formal organizational strategy; and 4) conduct at least one Kaizen event a month. All companies who meet the criteria are eligible to participate. The identity of participating companies will be kept confidential. In any publications, participating companies will be referred to by a code name (ex. “Company A”), which only the researchers will know. II. Procedure
This interview is a one-time event and it should take about 30 - 40 minutes. The interview will occur in your office, either in person or over the phone. Interview questions will cover a number of different aspects of Kaizen events – planning, the event process, sustainability mechanisms, etc. For the questions that you chose to answer, you are asked to answer based on your knowledge of your company’s Kaizen event program. With your permission, the research team will create an audiotape recording of the interview. The audiotape will only be used to enable the researchers to accurately transcribe the interview. The audiotape will not be released to anyone other than the researchers and will be destroyed once the interview has been transcribed (within one week of the interview). III. Risks and Benefits.
The risks from participation in this study are no greater than those encountered in daily life. There are several ways your company can benefit from your participation. Your company is one of the few companies participating in this research project and will get first access to the results. Your company will be able to use the research project results to design better Kaizen events and better support its Kaizen event teams. This description of the risks and benefits has been provided to help you more fully understand what is involved in this interview and in the research project -- it is not offered as compensation (incentive) for your participation.
IV. Confidentiality of Participation
The confidentiality of your participation this study will be preserved. No one at your company will be informed of your decision of whether or not to participate. The audiotape will be stored in a secured location at [insert university name] under the supervision of [insert PI name]. The audiotape will be translated into notes by a member of the research team and then destroyed, within one week of the interview. The notes will contain only the organization name and employee position. Any information published from the interview will contain only a code name for the organization (ex. “Company A”), which only the research team will know; any other identifying information (product names, company terms, etc.) will also be removed. V. Compensation
No compensation (either financial or non-financial) will be provided for participation.
246
VI. Freedom to Withdraw You may choose not to participate or choose not to answer any question at any time without penalty.
I understand that my participation in this study is completely voluntary and that I may choose not to participate or choose not to answer any question at any time without penalty. I voluntarily agree to participate in this study. My only responsibility in this study is to answer all the questions that I chose to answer based on my knowledge of my company’s Kaizen event program. I understand that any questions I have about the research study or specific procedures should be directed to [insert name of university contacts, addresses, e-mails and phone number – investigator, PI, & departmental reviewer]. If I have questions about my rights as a research participant, I should contact the Institutional Review Board (IRB) Human Protections Administrator at [insert e-mail and phone number of university Institutional Review Board]. My signature below indicates that I have read and that I understand the process described above and give my informed and voluntary consent to participate in this study. I understand that I will receive a signed copy of this consent form.
Signature of Participant
Printed Name of Participant
Date Signed
This Informed Consent is valid from ________ to ________.
247
APPENDIX Q: ADMINISTRATION AND TRAINING TOOLS FOR ORGANIZATIONAL FACILITATORS
Kickoff Survey Administration Script
Dear Facilitator: Please read the following statement aloud to the Kaizen event team when you hand out the Kickoff Survey.
“This survey is part of a research project at Virginia Tech and Oregon State University that studies the effects of Kaizen events and what makes them successful. [Insert company name] is one of the few companies chosen for the research. [Insert company name] thinks this research is important, and we’ll use the results to improve our Kaizen events and how we support Kaizen event teams.
This survey asks for your opinions on the goals of your Kaizen event team.
Please take a couple minutes to read over the instructions on the first page of the survey. [Wait until people have finished reading].
The survey asks you to choose a unique survey code that will allow the researchers to perform analysis on the survey results. This code is very important. It will not be used to identify you, since only you will know what your code is. If you have already used a survey code on previous surveys for this research, please use the same code. If you have not completed any previous surveys for this research, please use one of the following three options to choose your survey code:
Option 1: The first four letters of your mother’s maiden name
[ex. Brown = “brow”] Option 2: The month and day of your birthday
[ex. January 1 = “0101”] Option 3: The first four letters of your pet or child’s name
[ex. Dolly = “doll”]
Please remember the code you select, since it will be used for future surveys. Do not include your name. The survey is confidential and the privacy of your answers will be protected. No one at [insert company name] will see your individual answers.
Does anyone have any other questions about the survey instructions? [Answer questions then finish reading script].
I will leave the room to give you time to complete the survey.
Participation in this survey is voluntary. You can choose to stop participating at any time. After I leave, if you wish to participate, please complete the ‘Kickoff Survey’ and return it to this envelope. [Hold up envelope]. You may decline to answer any question(s) you wish.
Thank you!
248
Report-Out Survey Administration Script
Dear Facilitator: Please read the following statement aloud to the Kaizen event team when you hand out the Report-Out Survey.
“Like the Kickoff Survey, this survey is part of the research project at Virginia Tech and Oregon State University that studies Kaizen events. The process for completing the survey is the same as the process for completing the Kickoff Survey. Again, [Insert company name] thinks this research is important, and we’ll use the results to improve our Kaizen events and how we support Kaizen event teams.
This survey asks for your opinions about the Kaizen event you just completed.
Like last time, please take a couple minutes to read over the instructions on the first page of the survey. [Wait until people have finished reading].
Please use the same survey code you used on the Kickoff Survey. Again, including this code is very important to allow the researchers to analyze survey results, but will not identify who you are, since only you know which code you chose. If you did not participate in the Kickoff Survey, please use one of the following three options to choose your survey code:
Option 1: The first four letters of your mother’s maiden name
[ex. Brown = “brow”] Option 2: The month and day of your birthday
[ex. January 1 = “0101”] Option 3: The first four letters of your pet or child’s name
[ex. Dolly = “doll”]
Do not include your name. The survey is confidential and the privacy of your answers will be protected. No one at [insert company name] will see your individual answers.
Does anyone have any other questions about the survey instructions? [Answer questions then finish reading script].
I will leave the room to give you time to complete the survey.
Again, participation in this survey is voluntary. You can choose to stop participating at any time. After I leave, if you wish to participate, please complete the ‘Report-Out Survey’ and return it to this envelope. [Hold up envelope]. You may decline to answer any question(s) you choose.
Thank you!
249
APPENDIX R: TABLE OF EVENTS STUDIED BY COMPANY
Code: TPM = Total Productive Maintenance; PI = (General) Process Improvement; SMED = Setup Reduction; VSM = Value Stream Mapping; 5S = Housekeeping/Work Area Organization; L = Layout
Company A
Event Dates Method(s) Target System
Focus Team Size
Response Kickoff
Response Report Out
1. TPM 1A
(501)
10/23/05 – 10/28/05
TPM One Machine Improving the condition of the
target machine and training operators in
TPM
5 5 (100%) 4 (80%)
2. PI 1A (502)
10/31/05 – 11/04/05
Standard Work Manufacturing Process
Identifying root causes of scrap and
implementing countermeasures
6 6 (100%) 5 (83%)
3. PI 2A (504)
12/05/05 – 12/08/05
Process Flow, SMED
Manufacturing Process
Improving the material flow of small lot sizes
through a bottleneck process
11 10 (91%) 8 (73%)
4. TPM 2A
(505)
12/12/05 – 12/1605
TPM One Machine Improving the condition of the
target machine and training operators in
TPM
4 2 (50%) 4 (100%)
5. TPM 3A
(506)
01/08/06 – 01/1106
TPM Three Machines
Improving the condition of the
target machines and training operators in
TPM
7 7 (100%) 6 (86%)
6. SMED 1A
(509)
01/16/06 – 01/20/06
SMED One Machine Reducing changeover times for machine
8 8 (100%) 6 (75%)
7. SMED 2A
(510)
01/23/06 – 01/27/06
SMED, 5S One Machine Reducing changeover times for machine
5 5 (100%) 4 (80%)
8. PI 3A (512)
02/06/06 – 02/14/06
None
Manufacturing Process
Improving material flow through the manufacturing
process
10 9 (90%) 8 (80%)
9. TPM 4A
(514)
03/13/06 – 03/17/06
TPM Two Machines Improving the condition of the
target machines and training operators in
TPM
7 6 (86%) 6 (86%)
10. PI 4A (517)
03/21/06 – 03/23/06
None/ Brainstorming
Manufacturing Process/
Department
Creating a future state layout for target
department and developing an
implementation plan
4 4 (100%) 4 (100%)
11. PI 5A (520)
03/27/06 – 03/30/06
Six Sigma Manufacturing Process
Creating a future state layout for target
6 6 (100%) 6 (100%)
250
process and developing an
implementation plan 12. TPM
5A (521)
04/24/06 – 04/28/06
TPM Two Machines Improving the condition of the
target machines and training operators in
TPM
5 5 (100%) 4 (80%)
13. PI 6A (523)
05/01/06 – 05/05/06
None Manufacturing Process/
Department
Prepare a designated location for two new pieces of machinery (location decided in advance of event)
6 6 (100%) 4 (67%)
14. PI 7A (532)
05/15/06 – 05/18/06
SMED Family of machines
Establishing standard setup and inspection procedures for target machines, including developing training
aids for setups
5 4 (80%) 3 (60%)
15. PI 8A (530)
05/22/06 – 05/26/06
None Manufacturing Process/Depart
ment
Laying out a cell for a new product line
and installing equipment in cell
6 4 (67%) 4 (67%)
Company B
Event Dates Method(s) Target System
Focus Team Size
Response Kickoff
Response Report Out
1. PI 1B (319)
03/28/06 – 03/30/06
TPI Service process
Improving and standardizing the inquiry to quote
process for standard product lines
12 9 (75%) 11 (92%)
2. VSM 1B
(322)
04/03/06 -04/05/06
VSM Manufacturing process (product repair)
Create a current state map of target process (repair process) and
identify general areas/triggers for
improvement
11 11 (100%) 9 (82%)
3. PI 2B (324)
05/08/06 – 05/12/06
Standard Work Manufacturing process
Reducing cell lead-time
22 14 (64%) 11 (50%)
4. PI 3B (325)
05/08/06 – 05/12/06
Standard Work Manufacturing process
Redesigning cell layout to meet a
specified takt rate
8 6 (75%) 6 (75%)
5. PI 4B (326)
05/08/06 – 05/12/06
Standard Work Manufacturing process
Redesigning cell layout to meet a
specified takt rate
10 9 (90%) 6 (60%)
6. PI 5B (327)
05/08/06 – 05/12/06
Standard Work Manufacturing process
Simplifying the process and reducing
changeover times
11 9 (73%) 6 (55%)
7. PI 6B (328)
05/08/06 – 05/12/06
Standard Work Manufacturing process
Improving material and information flow
within the cell
20 19 (95%) 16 (80%)
8. PI 7B (329)
05/08/06 – 05/12/06
Standard Work Service process
Reducing time for fax filing and distribution
7 7 (100%) 6 (86%)
251
Company C Event Dates Method(s) Target
System Focus Team
Size Response Kickoff
Response Report Out
1. PI C1 (615)
01/09/06 – 01/13/06
None/JIT and Kaizen
Manufacturing process
common across multiple product lines
Balancing the line using a certain
bottleneck machine as pacesetter for takt
time
11 8 (73%) 9 (82%)
2. PI C2 (634)
1/23/06 - 1/27/06
None Manufacturing process
Increasing process flexibility and
reducing batching by replacing two
dedicated machines with a more flexible
model
8 8 (100%) 7 (88%)
3. PI C3 (635)
2/13/06 - 2/20/06
Standard Work Manufacturing process
Determining job standards for cell and training operators to meet standards (task
improvement and allocation)
8 8 (100%) 3 (38%)
4. PI C4 (618)
2/27/06 - 3/3/06
Standard Work Manufacturing process
Determining job standards for cell and training operators to meet standards (task
improvement and allocation)
9 9 (100%) 5 (56%)
5. PI C5 (616)
3/13/06 - 3/17/06
Standard Work Manufacturing process
Determining job standards for cell and training operators to meet standards (task
improvement and allocation)
7 7 (100%) 7 (100%)
6. PI C6 (641)
3/27/06 - 3/31/06
None Manufacturing process
Reducing lead-time variance across
different products
5 5 (100%) 3 (60%)
7. PI C7 (636)
4/10/06 - 4/14/06
Standard Work and DMAIC
Manufacturing process
common across multiple product lines
Reducing defects 4 0 (0%13) 0 (0%)
8. PI C8 (637)
4/24/06 - 4/28/06
None/ continuous
flow
Manufacturing process
Reducing cycle time 5 5 (100%) 2 (40%)
9. 5S 1C (638)
5/8/206 - 5/12/06
5S Manufacturing process/depart
ment
Improving inventory management and reducing defects
4 2 (50%) 3 (60%)
10. PI C9 (639)
5/22/06 - 5/26/06
None/7 wastes and waste
reduction, lean line design and
kanban systems
Manufacturing process
Improving process flow and area staffing
requirements
5 5 (100%) 4 (80%)
13 A response rate of zero percent indicates that none of these surveys were returned by organization
252
253
11. 5S 2C (640)
6/12/06 - 6/16/06
5S Manufacturing process/depart
ment
Improving inventory management and
reducing part retrieval time
5 5 (100%) 0 (0%)
Company D
Event Dates Method(s) Target System
Focus Team Size
Response Kickoff
Response Report Out
1. PI 1D (811)
01/23/06 -01/26/06
DMAIC, Lean Manufacturing process
Improving the condition of the
target machine and training operators in
TPM
13 11 (85%) 11 (85%)
2. PI 2D (813)
02/20/06 – 02/24/06
Lean Manufacturing /supply process
Identifying root causes of scrap and
implementing countermeasures
11 11 (100%) 10 (91%)
3. PI 3D (831)
4/18/06 – 4/20/06
VSM One tool within an
engineering/ quality
assurance process
Improving the material flow of small lot sizes
through a bottleneck process
10 10 (100%) 6 (60%)
4. PI 4D (833)
06/12/06 – 06/14/06
Lean Engineering/ supply process
(part specification
and purchasing)
Improving the condition of the
target machine and training operators in
TPM
8 8 (100%) 6 (88%)
Company E
Event Dates Method(s) Target System
Focus Team Size
Response Kickoff
Response Report Out
1. PI 1E (100)
12/20/05 – 12/22/05
Cellular Design
Manufacturing process/depart
ment
Redesigning cell layout to improve product flow and reduce cycle time
4 3 (75%)
3 (75%)
2. PI 2E (104)
03/14/06 – 03/17/06
Standard Work and Processing
Mapping
Service process
Reducing cycle time of customer quote
process
8 7 (88%)
4 (50%)
3. VSM 1E
(101)
3/14/06 – 3/16/06
VSM Service process
Documenting the current state,
designing a future state and identifying future Kaizen events to implement future
state
4 4 (100%)
4 (100%)
4. SMED 1E
(102)
03/20/06 – 03/22/06
SMED One machine Reducing changeover time for target
machine
5 5 (100%)
5 (100%)
5. PI 3E (106)
03/28/06 - 03/31/06
Standard Work Manufacturing support process
(ordering)
Improving part ordering process to
reduce part shortages
5 5 (100%)
5 (100%)
6. PI 4E 04/03/06 – None Manufacturing Reducing lead-time 4 4 (100%) 4 (100%)
254
(103) 04/05/06 process and implementing one piece flow
7. VSM 2E
(107)
04/17/06 - 04/19/06
VSM Manufacturing/shipping process
Improving shipping (“kitting”) process to eliminate omissions
in orders
5 4 (80%)
4 (80%)
8. PI 5E (105)
04/24/06 - 04/28/06
Standard Work Manufacturing process
Reducing defects 8 7 (88%)
6 (75%)
9. PI 6E
(108) 05/16/06 – 05/18/06
Standard Work Manufacturing process
Reducing cycle time 6 5 (83%)
5 (83%)
10. PI 7E
(109) 06/13/06 – 06/15/06
Process Mapping,
Flow
Manufacturing support process
(ordering)
Reducing cycle time of ordering process
7 6 (86%)
5 (71%)
11. SMED 2E
(111)
6/22/06 – 6/23/06
SMED One machine Reducing changeover time for target
machine
5 5 (100%)
5 (100%)
12. P1 8E (110)
6/26/06 – 6/28/06
Standard Work Service Process
Reduce process complexity (number of steps) and cycle time for the target
process
4 4 (100%)
3 (75%)
Company F
Event Dates Method(s) Target System
Focus Team Size
Response Kickoff
Response Report Out
1. L 1F (400)
01/11/06 – 01/12/06
None Inventory Storage Area
Redesigning the layout of a storage
area
7 7 (100%) 7 (100%)
2. TPM 1F
(401)
03/24/06 – 03/25/06
TPM One Machine Developing an autonomous
maintenance program for the target machine
6 5 (83%) 5 (83%)
3. 5S 1F (402)
03/28/06 – 03/30/06
6S Manufacturing Process/Depart
ment
Raising 5S (6S) score of target cell
4 4 (100%) 4 (100%)
4. 5S 2F (403)
04/17/06 – 04/18/06
6S Manufacturing Process/Depart
ment
Implementing 5S (6S) to improve
organization of target cell
3 3 (100%) 3 (100%)
5. PI 1F (404)
05/10/06 – 05/12/06
None Manufacturing Process
Documenting current state (operation times, etc.) and
improving material flow through the
target process
8 8 (100%) 8 (100%)
6. TPM 2F
(405)
05/12/06 – 05/13/06
TPM One Machine Developing an autonomous
maintenance program for the target machine
6 6 (100%) 6 (100%)
255
Orgder o
Event Plan Proc_o
A mean 11.27median 6.00
max 60.00min 2.00
std dev 14.45B mean 32.25
median 15.50max 120.00min 12.00
std dev 38.31C mean 2.79
median 3.00max 4.00min 0.50
std dev 1.15D mean 5.75
median 4.50max 10.00min 4.00
std dev 2.87E mean 9.18
median 4.00max 40.00min 2.00
std dev 11.50F mean 17.00
median 4.00max 80.00min 3.00
std dev 30.92OVERALL mean 13.19
median 6.00max 0 120.00min 0.50
ANOVA p n/aKruskal-Wallis p
APPENDIX S: SUMMARY OF STUDY VARIABLE RESULTS BY COMPANY
• IP = Internal Processes • Tool Approp. = Tool Appropriateness, average facilitator rating for appropriateness of the problem-solving tools used by
the team • Tool Quality = facilitator rating for quality of the problem-solving tools used by the team % Goals Met_o, Team Mrb KE_o, Team Ldr Exp_o, and Event Plan Proc_o are the original (untransformed) values of these variables The following variables are measured on a scale of 1 = “strong disagree” to 6 = “strongly agree”: AT, Task KSA, Overall Success, IMA, GC, GDF, TA, MS, Work Area Routineness, ACC, AO, IP, Tool Approp., and Tool Quality Full scale values: 1 = “strong disagree” 2 = “disagree” 3 = “tend to disagree” 4 = “tend to agree” 5 = “agree” 6 = “strongly agree”
• AT = Attitude • Task KSA = Task Knowledge Skills and Attitudes • Overall Success = Overall Perceived Success, facilitator rating of overall event success • % of Goals Met = percentage of major improvement goals (log transformed) • IMA = Impact on Area • GC = Goal Clarity • GDF = Goal Difficulty • TA = Team Autonomy • Functional Het. = Functional Heterogeneity; index from 0 – 1 measuring cross functional diversity of team • Team Mbr KE = Team Kaizen Experience; average number of total events participated in per team member (including
current event) (log transformed) • Team Lder Exp = Team Leader Experience; total number of events led (including current event) (log transformed) • MS = Management Support • Event Plan Proc = Event Planning Process, total hours spent planning the event (log transformed) • Work Area Routineness = facilitator rating of the predictability of the target work area in four different dimensions • ACC = Affective Commitment to Change • AO = Action Orientation
APPENDIX T: FULL CORRELATION ANALYSIS RESULTS Response (Predictor) Correlation
Coefficient P-value for GEEβ)
Intraclass Correlation Coefficient (ρ)
Correlation Coefficient_OLS
Attitude (Task KSA)
.710 .0000 -.069 .712*
Task KSA (Attitude)
.711 .0000 .215 .712*
Overall Perceived Success (Attitude)
.122 .3023 -.044 .125
Attitude (Overall Perceived Success)
.123 .4068 .037 .125
Overall Perceived Success (Task KSA)
.166 .1193 -.054 .173
Task KSA (Overall Perceived Success)
.155 .3326 .280 .173
Impact on Area (Attitude)
.632 .0000 -.071 .643*
Attitude (Impact on Area)
.639 .0000 -.052 .643*
Impact on Area (Task KSA)
.690 .0000 .014 .690*
Task KSA (Impact on Area)
.688 .0000 .299 .690*
Impact on Area (Overall Perceived Success)
.224 .1003 .009 .224
Overall Perceived Success (Impact on Area)
.224 .1073 -.036 .224
% of Goals Met (Attitude)
.000 .8569 .107 .035
Attitude (% of Goals Met)
.000 .9937 .044 .035
% of Goals Met (Task KSA)
.000 .3451 .172 .030
Task KSA (% of Goals Met)
.000 .1879 .363 .030
% of Goals Met (Overall Perceived Success)
.170 .2982 .084 .172
Overall Perceived Success (% of Goals Met)
.163 .0767 -.061 .172
% of Goals Met (Impact on Area)
-.019 .4377 .123 -.055
Impact on Area (% of Goals Met)
-.048 .5882 .027 -.055
* = significant at the α = 0.05/10 = 0.005 level using OLS estimates and n = 51