An Empirical Model for Ship-generated Waves – Kriebel & Seelig 2005 2/10/2016 Waves 2005 Conference 1 1 AN EMPIRICAL MODEL FOR SHIP-GENERATED WAVES David Kriebel 1 and William Seelig 2 1 Professor of Ocean Engineering, US Naval Academy, Annapolis, Maryland 2 Senior Engineer, Naval Facilities Engineering Services Center, Washington, DC 2 Objectives Ship-Generated Wave Heights • Develop empirical equation to predict maximum wave heights generated by conventional ships • Improve upon existing predictive equations: – Sorensen and Weggel (1984) & Weggel and Sorensen (1986) – PIANC (1987) • Use existing data published in the literature • Run new lab tests to supplement existing data • Run field trials to verify empirical model – Tests conducted in Chesapeake Bay April 2005
Transcript
An Empirical Model for Ship-generated Waves – Kriebel & Seelig 2005
2/10/2016
Waves 2005 Conference 1
1
AN EMPIRICAL MODEL FOR SHIP-GENERATED WAVES
David Kriebel1 and William Seelig2
1 Professor of Ocean Engineering, US Naval Academy, Annapolis, Maryland 2 Senior Engineer, Naval Facilities Engineering Services Center, Washington, DC
2
ObjectivesShip-Generated Wave Heights
• Develop empirical equation to predict maximum wave heights generated by conventional ships
• Improve upon existing predictive equations:– Sorensen and Weggel (1984) & Weggel and Sorensen (1986)– PIANC (1987)
• Use existing data published in the literature
• Run new lab tests to supplement existing data
• Run field trials to verify empirical model– Tests conducted in Chesapeake Bay April 2005
An Empirical Model for Ship-generated Waves – Kriebel & Seelig 2005
2/10/2016
Waves 2005 Conference 2
3
Definitions
• Two wave systems:– Diverging Waves– Transverse Waves
• Maximum wave heights– Form along “Cusp Line” – Vary with distance from
sailing line, y
19.47o
V
0
DIVERGING WAVETRANSVERSE
CUSP LOCUS LINE
Cd
y
SAILING LINE
WAVE
SAMPLE SHIP-GENERATED WAVE PATTERN
FOR DEEP WATER
(after Sorensen, 1997)
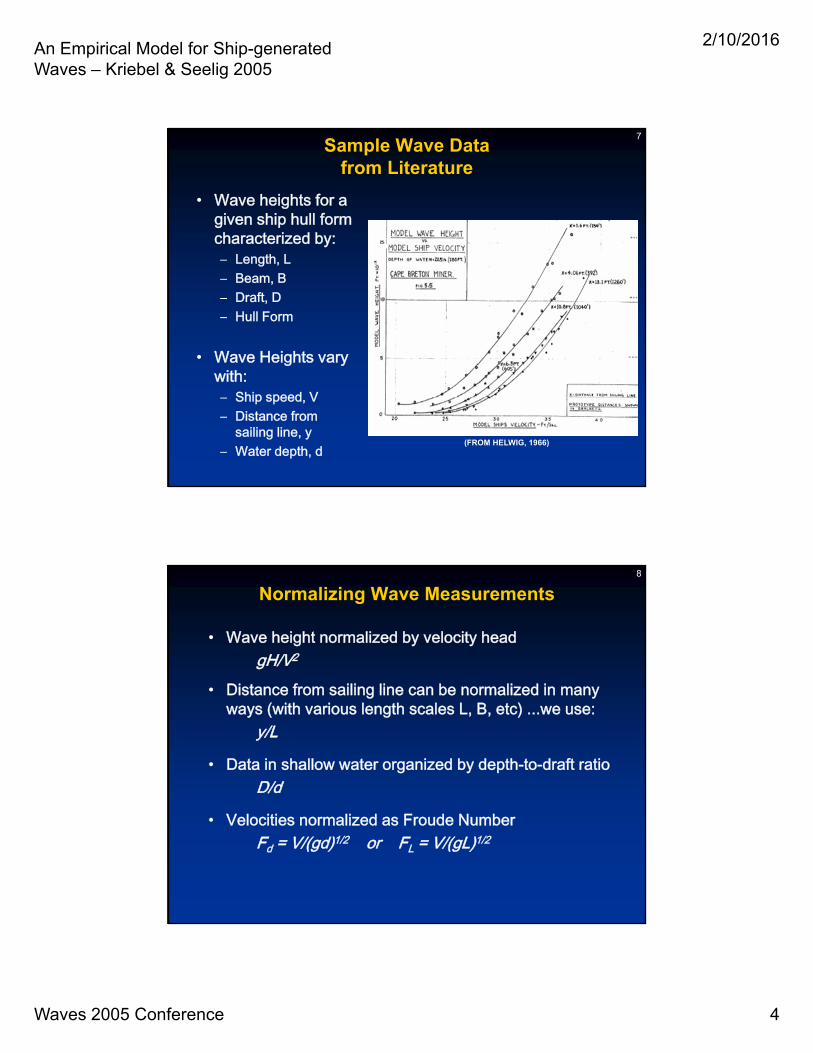
4Sample Wave Records
from LiteratureDeep Water
from Das (1969)
Shallow Water
from Das (1969)
Hmax
Separate “draw down” from diverging waves
An Empirical Model for Ship-generated Waves – Kriebel & Seelig 2005
2/10/2016
Waves 2005 Conference 3
5
1 0 1 2 1 4 1 6 1 8 2 0
-0 .5
0
0 .5G
ag
e
1 (
in)
T im e (s e c )1 0 1 2 1 4 1 6 1 8 2 0
-0 .5
0
0 .5
Ga
ge
2
(in
)
T im e (s e c )
1 0 1 2 1 4 1 6 1 8 2 0
-0 .5
0
0 .5
Ga
ge
3
(in
)
T im e (s e c )1 0 1 2 1 4 1 6 1 8 2 0
-0 .5
0
0 .5
Ga
ge
4
(in
)
T im e (s e c )
1 0 1 2 1 4 1 6 1 8 2 0
-0 .5
0
0 .5
Ga
ge
5
(in
)
T im e (s e c )1 0 1 2 1 4 1 6 1 8 2 0
-0 .5
0
0 .5
Ga
ge
6
(in
)
T im e (s e c )
Examples from Naval Academy TestsWaves measured at 6 distances y off sailing line
An Empirical Model for Ship-generated Waves – Kriebel & Seelig 2005
2/10/2016
Waves 2005 Conference 7
13
Define Modified Froude Number F*
An empirical “Froude number” seems to collapse data from a
given ship:
Single empirical coefficient is dependent on ship hull form
large for slender hulls small for blocky hulls
F FD
dL* exp
Aux Supply Vessel
0.0
0.1
0.2
0.3
0.4
0.5
0.0 0.2 0.4 0.6
Ship17,d/T=1.37
Ship17,d/T=2.5
Ship17,d/T=3.0
M.S. Wearfield
0.0
0.1
0.2
0.3
0.4
0.5
0.0 0.1 0.2 0.3 0.4 0.5 0.6
Ship42,d /T=1.47
Ship42,d /T=2.33
Ship42,d /T=5.53
Mariner and Series 60
0.00
0.10
0.20
0.30
0.40
0.50
0.0 0.1 0.2 0.3 0.4 0.5 0.6
F*
gH
/V2
at
y/L
=1
S hip 15,d / T=1.3 8
S hip 14 ,d / T=1.6 0
S hip 14 ,d / T=1.8 3
S hip 14 ,d / T=2 .0
S hip 15,d / T=2 .0
S hip 14 ,d / T=2 .5
S hip 15,d / T=2 .5
S hip 14 ,d / T=3 .0
S hip 15,d / T=3 .0
14
Variation of with Hull Form
• Investigated dependence of on hull form
• Seems to depend mainly on Block Coefficient
• General trends:– Streamlined hulls have
of 1 or more– Blunt hulls have
of 0.2 to 0.4
F FD
d
C
L
b
* exp
.
with
2 35 1
= 2.35 (1-Cb)
0.0
0.2
0.4
0.6
0.8
1.0
1.2
1.4
0.5 0.6 0.7 0.8 0.9 1.0
Block Coefficient Cb
alp
ha
CL B D
b
* *
An Empirical Model for Ship-generated Waves – Kriebel & Seelig 2005
2/10/2016
Waves 2005 Conference 8
15
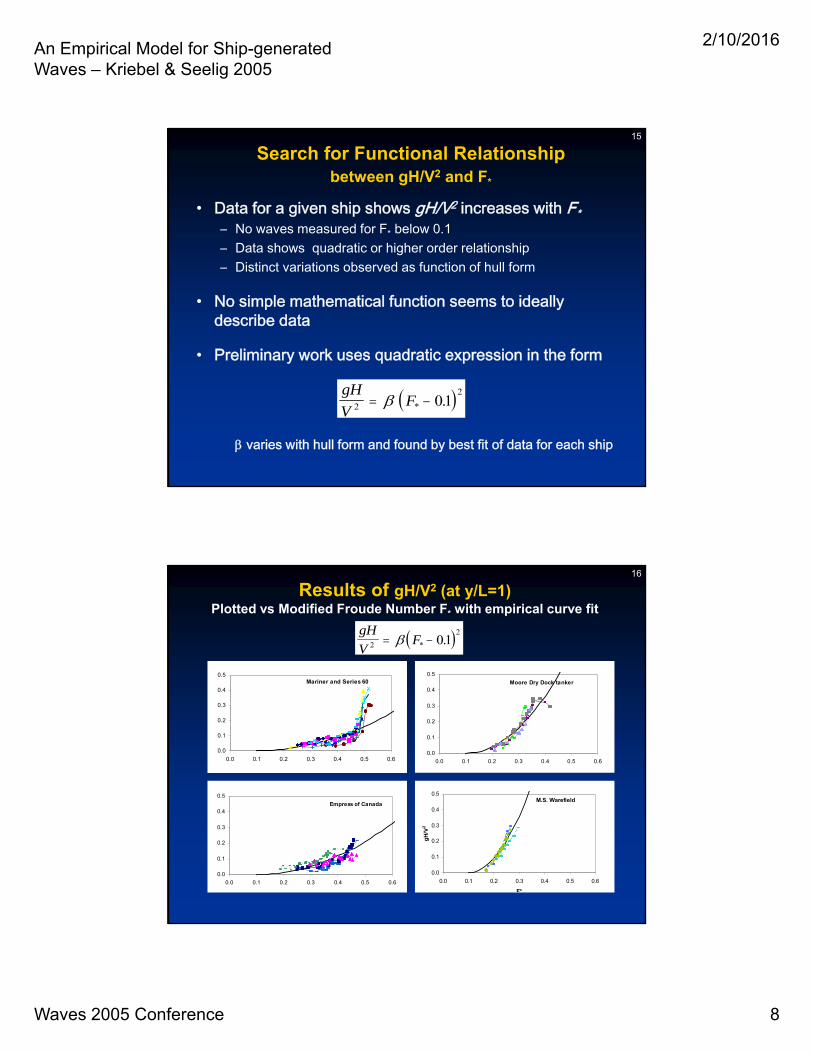
Search for Functional Relationshipbetween gH/V2 and F*
• Data for a given ship shows gH/V2 increases with F*– No waves measured for F* below 0.1– Data shows quadratic or higher order relationship– Distinct variations observed as function of hull form
• No simple mathematical function seems to ideally describe data
• Preliminary work uses quadratic expression in the form
varies with hull form and found by best fit of data for each ship
gH
VF2
201 * .
16
Results of gH/V2 (at y/L=1)Plotted vs Modified Froude Number F* with empirical curve fit
Mariner and Series 60
0.0
0.1
0.2
0.3
0.4
0.5
0.0 0.1 0.2 0.3 0.4 0.5 0.6
Moore Dry Dock tanker
0.0
0.1
0.2
0.3
0.4
0.5
0.0 0.1 0.2 0.3 0.4 0.5 0.6
M.S. Warefield
0.0
0.1
0.2
0.3
0.4
0.5
0.0 0.1 0.2 0.3 0.4 0.5 0.6
F*
gH
/V2
Empress of Canada
0.0
0.1
0.2
0.3
0.4
0.5
0.0 0.1 0.2 0.3 0.4 0.5 0.6
gH
VF2
201 * .
An Empirical Model for Ship-generated Waves – Kriebel & Seelig 2005
2/10/2016
Waves 2005 Conference 9
17
Results of gH/V2 (at y/L=1)Plotted vs Modified Froude Number F* with empirical curve fit
Aux Supply Vessel
0.0
0.1
0.2
0.3
0.4
0.5
0.0 0.1 0.2 0.3 0.4 0.5 0.6
Cape Breton Minershortened
0.0
0.1
0.2
0.3
0.4
0.5
0.0 0.1 0.2 0.3 0.4 0.5 0.6
Cape Breton Miner
0.0
0.1
0.2
0.3
0.4
0.5
0.0 0.1 0.2 0.3 0.4 0.5 0.6
Barges
0.0
0.1
0.2
0.3
0.4
0.5
0.0 0.1 0.2 0.3 0.4 0.5 0.6
F*
gH
/V2
gH
VF2
201 * .
18
47,48,50,51 CAPE BRETON MINER
7, 16 MOORE DRYDOCK TANKER
15, 28 to 31, 32 SERIES 60 Cb=0.6
Coefficient seems to Vary with Entrance Length, Le
• Defined as length from bow to start of parallel middle-body
• Importance noted by Saunders (1957)
• Used in some other predictive models (Gates and Herbich, 1975)
An Empirical Model for Ship-generated Waves – Kriebel & Seelig 2005
2/10/2016
Waves 2005 Conference 10
19
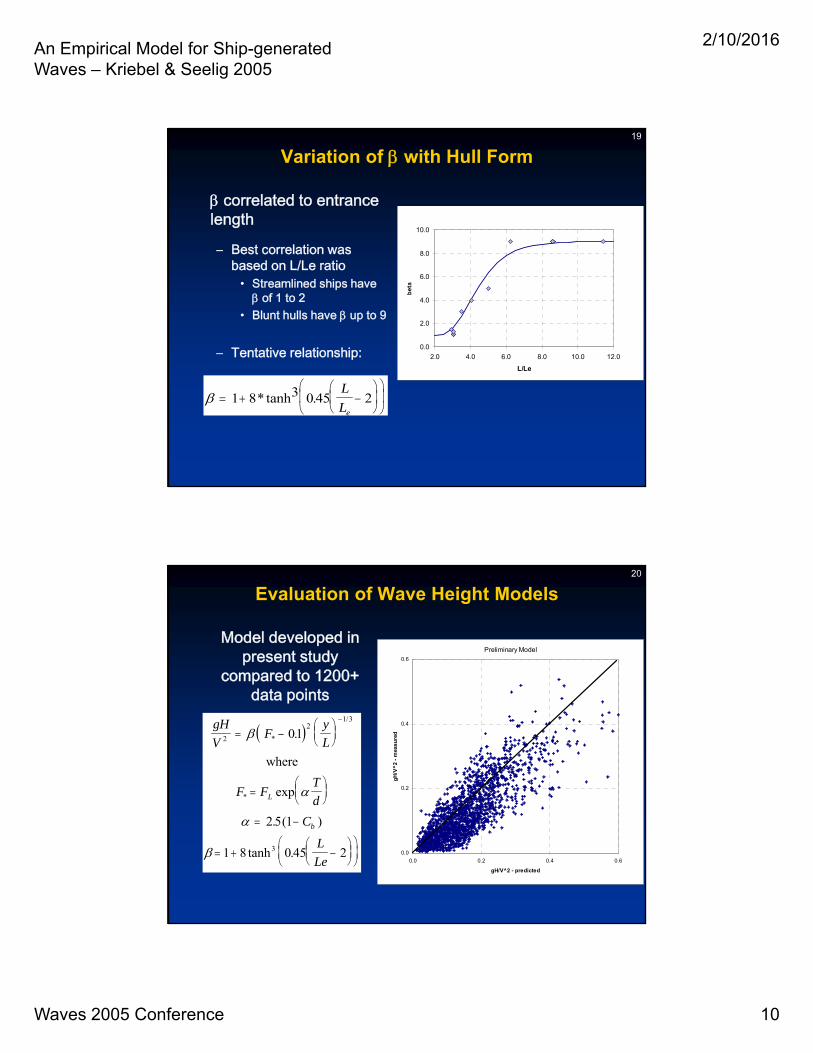
Variation of with Hull Form
correlated to entrance length
– Best correlation was based on L/Le ratio
• Streamlined ships have of 1 to 2
• Blunt hulls have up to 9
– Tentative relationship:
1 8 3 0 45 2*tanh .
L
Le
0.0
2.0
4.0
6.0
8.0
10.0
2.0 4.0 6.0 8.0 10.0 12.0
L/Le
be
ta
20
Evaluation of Wave Height Models
Model developed in present study
compared to 1200+ data points
gH
VF
y
L
F FT
d
C
L
Le
L
b
2
21 3
3
01
2 5 1
1 8 0 45 2
*
/
*
.
exp
. ( )
tanh .
where
Preliminary Model
0.0
0.2
0.4
0.6
0.0 0.2 0.4 0.6
gH/V^2 - predicted
gH
/V^
2 -
mea
sure
d
An Empirical Model for Ship-generated Waves – Kriebel & Seelig 2005
2/10/2016
Waves 2005 Conference 11
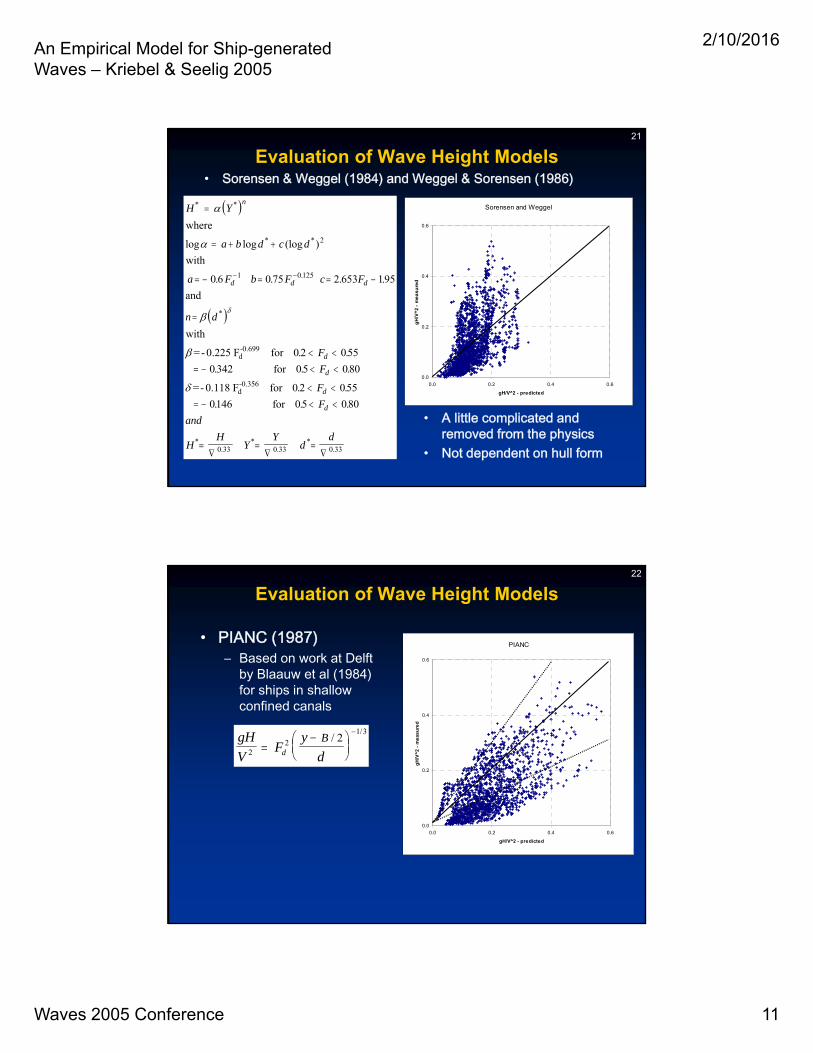
21
Evaluation of Wave Height Models• Sorensen & Weggel (1984) and Weggel & Sorensen (1986)
H Y
a b d c d
a F b F c F
n d
F
F
F
F
and
HH
YY
n
d d d
d
d
d
d
* *
* *
.
*
*.
*.
log log (log )
. . . .
. .
. . .
. .
. . .
where
with
and
with
=- 0.225 F for
for
=- 0.118 F for
for
d-0.699
d-0.356
2
1 0 125
0 33 0 33
0 6 0 75 2 653 195
0 2 055
0 342 05 080
0 2 055
0146 05 080
dd*
. 0 33
Sorensen and Weggel
0.0
0.2
0.4
0.6
0.0 0.2 0.4 0.6
gH/V^2 - predicted
gH
/V^
2 -
me
as
ure
d• A little complicated and
removed from the physics• Not dependent on hull form
22
Evaluation of Wave Height Models
• PIANC (1987)– Based on work at Delft
by Blaauw et al (1984) for ships in shallow confined canals
gH
VF
y
dd
B2
2
1 32
//
PIANC
0.0
0.2
0.4
0.6
0.0 0.2 0.4 0.6
gH/V^2 - predicted
gH
/V^
2 -
me
as
ure
d
An Empirical Model for Ship-generated Waves – Kriebel & Seelig 2005
2/10/2016
Waves 2005 Conference 12
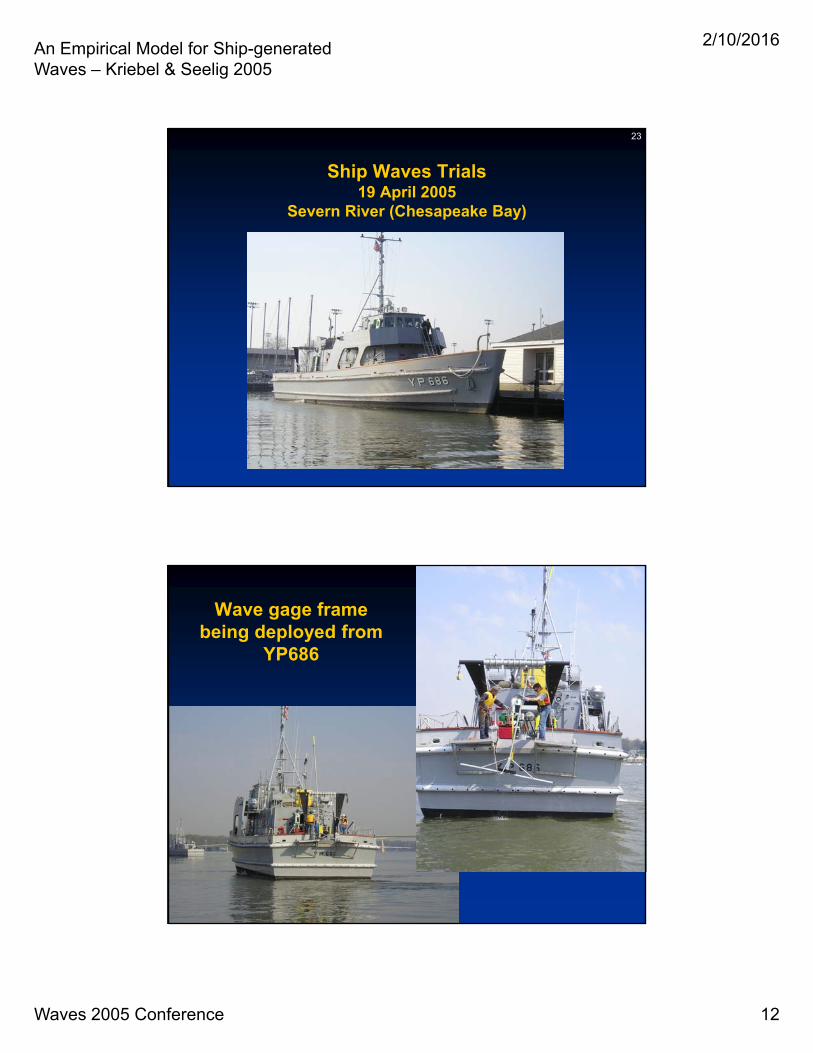
23
Ship Waves Trials19 April 2005
Severn River (Chesapeake Bay)
24
Wave gage frame being deployed from
YP686
An Empirical Model for Ship-generated Waves – Kriebel & Seelig 2005
2/10/2016
Waves 2005 Conference 13
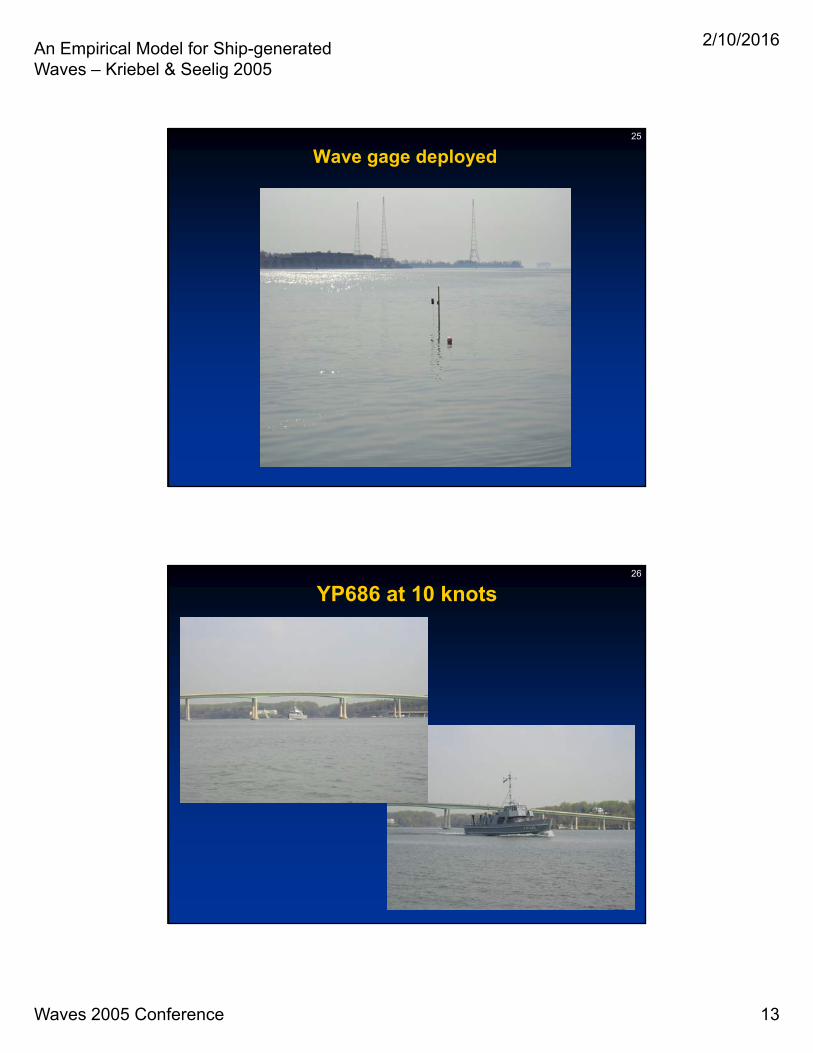
25
Wave gage deployed
26
YP686 at 10 knots
An Empirical Model for Ship-generated Waves – Kriebel & Seelig 2005
2/10/2016
Waves 2005 Conference 14
27YP686 approaching wave gage(gage located 100 ft off sailing line)
28YP686 passing wave gage(gage located 50 ft off sailing line)
An Empirical Model for Ship-generated Waves – Kriebel & Seelig 2005
2/10/2016
Waves 2005 Conference 15
29
30Sample data showing background wind waves and ship-generated waves
An Empirical Model for Ship-generated Waves – Kriebel & Seelig 2005
2/10/2016
Waves 2005 Conference 16
31
3470 3480 3490 3500 3510 35200.4
0.45
0.5
0.55
0.6
0.65
0.7
0.75
time (sec)
elev
(m
)
32
Measured vs PredictedNew Empirical Model
0.00
0.05
0.10
0.15
0.20
0.25
0.0 0.5 1.0 1.5 2.0 2.5 3.0 3.5 4.0
y/L
gH
/V^
2
10 knots pred
10 knots
9 knots pred
9 knots
8 knots pred
8 knots
7 knots pred
7 knots
An Empirical Model for Ship-generated Waves – Kriebel & Seelig 2005
2/10/2016
Waves 2005 Conference 17
33
Measured vs PredictedSorensen and Weggel Model
0.00
0.05
0.10
0.15
0.20
0.25
0.0 0.5 1.0 1.5 2.0 2.5 3.0 3.5 4.0
y/L
gH
/V^2
10 knots S&W
10 knots
9 knots S&W
9 knots
8 knots S&W
8 knots
7 knots S&W
7 knots
34
Measured vs PredictedPIANC Model
0.00
0.05
0.10
0.15
0.20
0.25
0.30
0.35
0.40
0.0 0.5 1.0 1.5 2.0 2.5 3.0 3.5 4.0
y/L
gH
/V^
2
10 knots pred
10 knots
9 knots pred
9 knots
8 knots pred
8 knots
7 knots pred
7 knots
An Empirical Model for Ship-generated Waves – Kriebel & Seelig 2005
2/10/2016
Waves 2005 Conference 18
35
0.0
0.1
0.2
0.3
0.4
0.5
0.0 0.1 0.2 0.3 0.4 0.5
H predicted (m)
H m
easu
red
(m
)
0.0
0.1
0.2
0.3
0.4
0.5
0.0 0.1 0.2 0.3 0.4 0.5
H predicted (m)
H m
easu
red
(m
)
36Summary and Conclusions
Ship-Generated waves
• New model gives improved predictions– exp(T/d) term “unifies” data collected in
various water depths
• Model can be further improved – (y/L)-1/3 can be optimized
• Exponent may depend on hull form– (F*-0.1)2 can be optimized
• Higher power needed for some hull forms – Coefficients and can be improved with
data from more ships
• Need data in shallow water– Lab data for very shallow water T/d <1.3– Field data
gH
VF
y
L
F FT
d
C
L
Le
L
b
2
21 3
3
01
2 35 1
1 8 0 45 2
*
/
*
.
exp
. ( )
tanh .
where
An Empirical Model for Ship-generated Waves – Kriebel & Seelig 2005