Page 1
International Journal of Economics, Commerce and Management United Kingdom Vol. III, Issue 12, December 2015
Licensed under Creative Common Page 27
http://ijecm.co.uk/ ISSN 2348 0386
AN EMPIRICAL STUDY OF THE RELATIONSHIP BETWEEN
PROFITABILITY RATIOS AND MARKET SHARE PRICES
OF PUBLICLY TRADED BANKING FINANCIAL
INSTITUTIONS IN GHANA
Osman Issah
University for Development Studies School of Business and Law, Ghana
Iddrisu Mohammed Ngmenipuo
Wa Polytechnic Business School, Ghana
[email protected]
Abstract
The purpose of the paper was to investigate empirically whether ROA, ROE, and ROI together
explain variations in the market prices per share of publicly traded banking financial institutions
in Ghana for the period 2009 – 2013. We found a significant linear relationship between the
ROA, ROE, and ROI together the market prices per share, with the ROE contributing more than
the ROA. These findings are consistent with both empirical and theoretical literature which posit
a positive linear relationship. The findings have important implications for investors, bank senior
management as well as the banks regulator to improve the quality of reporting by banks quoted
on the exchange.
Keywords: profitability ratios, banking financial institutions, return on assets, return on equity,
return on investment, shareholder wealth, Ghana stock exchange
INTRODUCTION
The overarching goal underlying the managerial policies of a bank, and of course, most other
businesses is to maximize the wealth of the shareholders. This implies that bank managers are
expected to make decisions that will increase shareholder value in the form of an upward-
trending share price for the bank’s stock or shares, and hence their overall wealth. Even though
Page 2
© Osman & Iddrisu
Licensed under Creative Common Page 28
this is the expectation, bank managers may sometimes make decisions that serve their own
goals instead of those of the preferences of shareholders. Bank shareholders might prefer that
bank managers take some risk in order to earn above-average or higher returns, and this may
explain why bank manager compensation is typically tied to a measure of performance such as
earnings (Madura, 2015).
Shareholder-return ratios measure the return that shareholders earn from holding shares
in the company. Since the goal of maximizing shareholders’ wealth, i.e. providing shareholders
with an adequate rate of return is a primary objective of most companies (Hill, Jones; &
Schilling, 2015).
It is, therefore, a major role of the board of directors of a bank to monitor bank managers
to make sure that the managerial decisions they make are targeted at shareholders’ wealth
maximization. The performance of any commercial bank depends on how well and efficiently its
management manages the bank’s assets, liabilities, and capital. Increased competition has
made efficient management essential for profitability and survival (Madura, 2015).
How banks perform can be assessed in various ways. A popular and useful financial
metric used to measure a bank’s overall financial performance is its return on assets (ROA).
The ROA of a bank is partially determined by movements in market interest rates, as many
banks benefit from lower interest rates. In addition, the ROA is highly dependent on economic
conditions, since banks can extend more loans to creditworthy customers and may also
experience a higher demand for their services (Madura, 2015).
Another useful metric used to measure a bank’s overall performance is return on equity
(ROE). A bank can increase its ROE by increasing its financial leverage, although its leverage is
constrained by capital requirements (Madura, 2015). Investors conclude that the possibility of
very high future profits justifies a higher share price. “In July 2008, Lehman reported a $2.8
billion loss for the second quarter of 2008 (the months April–June), precipitating a 54% fall in its
stock price.” (Krugman and Wells, 2015, p. 951).
The Bank of Ghana (BOG) uses the ROA and ROE as key profitability performance
indicators of banks in Ghana. According to the BOG May 2015 Financial Stability Report, for
instance, the banking industry’s return on assets (ROA) increased marginally to 6.3 percent in
March 2015 from 6.2 percent in March 2014, whilst the return on equity (ROE) decreased to
29.3 percent from 30.7 percent for the same period (BOG, 2015).
Because a high ratio is considered as an indicator of a greater return, some
managements will sacrifice the long-term interests of investors in order to achieve an impressive
ROA in the short-term. It is believed that an increasing return on assets usually translates into
increases in stock price, which tells investors that management is doing a good job at
Page 3
International Journal of Economics, Commerce and Management, United Kingdom
Licensed under Creative Common Page 29
generating profits from the resources that are entrusted to by business owners. Therefore, ROA
is considered as an effective way of measuring the efficiency of manufacturers, but can be
suspect when measuring service companies, or companies whose main assets are people
(Bloomsbury, 2009).
Empirical research in accounting exists which indicate the many dimensions of the role
accounting numbers plays in the capital market by documenting that share prices react strongly
to the magnitude of the change in earnings and the persistence of the change in earnings for
future periods and that financial statement ratios are useful for predicting changes in future
earnings (Wahlen, Baginski, & Bradshaw, 2011).
This paper will contribute to a better understanding of the role ROA, ROE, and ROI play
in determining changes in the market price per share of banks by seeking an answer to the
question: ‘to what extent do the ROA, ROE, and ROI together explain variations in the market
prices of shares of banking financial institutions listed on the Ghana Stock Exchange (GSE) for
the period 2009 – 2013.’ To answer this question, data will be extracted from the published
annual financial statements of the sampled financial institutions from 2009-2013.
The rest of the paper is organized as follows: section 2 deals with literature review,
section 3 the theoretical framework and hypotheses development, section 4 is on data analysis
and model specification, section 5 discusses the empirical results, and finally section 6 deals
with the conclusions and recommendations.
LITERATURE REVIEW
Investors, financial economists, and analysts usually are interested in comprehending how the
stock market values a firm’s equity shares. In a sense, is it expected that the value of a firm’s
shares should reflect investors’ expectations of the firm’s future profitability. However, data on
expected future profitability does not normally exist. Rather, empirical financial studies must use
measures such as current income, sales, assets and debt of the firm, or equivalent financial
ratios like ROA, ROE, and ROI as explanatory variables (Koop, 2009).
A number of empirical studies have been done in the area. Provided below is a summary
of the studies that have been carried out: Abu Shanab (2008) who examined the impact of
returns and risks on the share prices for a sample of 38 industrial public companies in Jordan
listed on Amman Security Exchange for the period of 2000 – 2007, found no effect for the
returns, risks and dividends on the market value per share. AL Kurdi (2005) also studied the
ability of the published accounting information to predict share prices and documented a
relationship between the published accounting information of the insurance public companies
and their share price. In a study by AL Qudah (2004) which tested the role of accounting
Page 4
© Osman & Iddrisu
Licensed under Creative Common Page 30
exposure in indicating the real market price of public companies on Amman’s Security
Exchange; the results showed that the financial data of the public firms are sufficient and
appropriate in showing the real share values. A related study by Abu Hasheesh (2003)
examined the role of published accounting information in predicting share prices and found that
there is a significant positive relationship between the market price per share with the ratios of
net profits to equity, net profits to total assets, and dividends to net profits as a total. Kabajeh,
AL Nu’aimat, and Dahmash (2012) examined the relationship between ROA, ROE and ROI
ratios together and separately with Jordanian insurance public companies share prices. They
used four regression models to test the hypotheses of the study; and found that the pooled
analysis of the three ratios of ROA, ROE and ROI together indicated a strong and positive
relationship with share prices, and a strong explanatory power. They also found that the
separated pooled analysis showed a positive but low relationship between each of ROA and
ROI ratios with market share prices. However, they found no relationship between the
separated pooled analysis and the ROE ratio with market share prices. Dehuan and Zhenhu
(2008) explored correlation between firm performance as measured by return on equity, earning
per share, profit margin, return on asset, changes in sales, and total asset turnover) and stock
price of the top performing stocks listed on Shanghai Stock Exchange, and found that all the
variables are significantly correlated with stock price in the year before crisis.
Tondee and Boonmunewai (n.d.), examined the factors affecting the stock price of listed
companies in agricultural industry and the food industry group in the stock Exchange of
Thailand. Their findings showed that, internal factors in the aspect of return on assets (ROA),
return on equity (ROE), and price to book ratio (P/BV) have more positive effect on stock price
of listed companies on agricultural industry and the food industry group.
THEORETICAL FRAMEWORK AND HYPOTHESIS DEVELOPMENT
Profitability Analysis
Profitability analysis looks at the ability of a company to earn profits. Ability of an entity to earn
profit is reflected in the entity’s operating results reported in its income statement. The ability to
earn profits also depends on the assets the entity can deploy in its operations, as reported in its
statement of financial position (balance sheet). Thus, relationships between income statement
and balance sheet are often used in evaluating profitability (Warren, Reeve & Duchac, 2014).
Profitability Ratios
Business growth is based on the ability to make sustainable profits now and in the future.
Profitability ratios measure how efficiently a company uses its resources. The more efficient the
Page 5
International Journal of Economics, Commerce and Management, United Kingdom
Licensed under Creative Common Page 31
company, the greater is its profitability. It is worthwhile to compare a company’s profitability
against that of its major competitors in its industry to determine whether the company is
operating more or less efficiently than its rivals. besides, the change in a company’s profit ratios
over time indicates whether its performance is improving or declining.
A number of different profit ratios can be used, and each of them measures a different
aspect of a company’s performance (Hill, Jones; & Schilling, 2015). In this paper, we discuss 3
of the most commonly used profit ratios (the return on assets (ROA), the return on equity
(ROE), and the return on invested capital (ROI).
A higher profitability ratio indicates that the future share price will also be high, because
the business is positioned to make more money by spending less than its competitors (See
http://wiki.fool.com/Ratios)
Profitability ratios and investor ratios are the most popular ratios usually included in the
annual report. This makes sense because one of the annual report’s major objectives is to
inform stockholders about the performance and prospects of the entity. Included in this category
of ratios are the ROA and ROE (Gibson, 2012).
Effective strategies to grow the business can increase a firm’s profitability and thus its
stock price. Indeed, investors and Wall Street analysts expect continuous growth. A firm’s stock
price generally increases only if the firm’s rate of growth exceeds investors’ expectations. This is
because investors discount into the present value of the firm’s stock price whatever growth rate
they foresee in the future.
Investors acquire shares of common stock in a company because of the return they
expect from such investments. This return includes any dividends received plus the change in
the market price of the shares of stock while the investor holds them. A rational investor will not
be indifferent between two investments that are expected to yield, for example, a 20 percent
return if there are differences in the uncertainty, or risk, of earning that 20 percent return. The
investor will demand a higher expected return from higher-risk investments to compensate for
the additional risk assumed.
It is also important that owners of a bank must know whether their bank is being
managed well or not. To do this, they need good measures of bank profitability. A basic
measure of bank profitability that takes into account the size of the bank is the return on assets
(ROA), which divides the net income of the bank by the amount of its assets. ROA does a good
job as a measure of how well a bank manager is doing because it indicates how well a bank’s
assets are being used to generate profits (Bloomsbury, 2009)
Net profit after taxROA =
Assets
Page 6
© Osman & Iddrisu
Licensed under Creative Common Page 32
The return on assets provides information on how efficiently a bank is being run, because it
indicates how much profits are generated on average by each currency amount of assets.
Acceptable ROAs vary by sector. Banks balance sheets contain massive amounts of assets,
and because of that their ROAs always look small (Tycho Press,2013). In banking, for example,
a ROA of 1% or better is a considered to be the standard benchmark of superior performance
(Choudhry, 2012, Bloomsbury, 2009). “ROA tells us what earnings were generated from
invested capital (assets). It is one of the standards of gauging a bank’s profitability. An excellent
ROA is in the range of 1.2 to 1.4 per cent.” (Goel, 2014, p. 159).
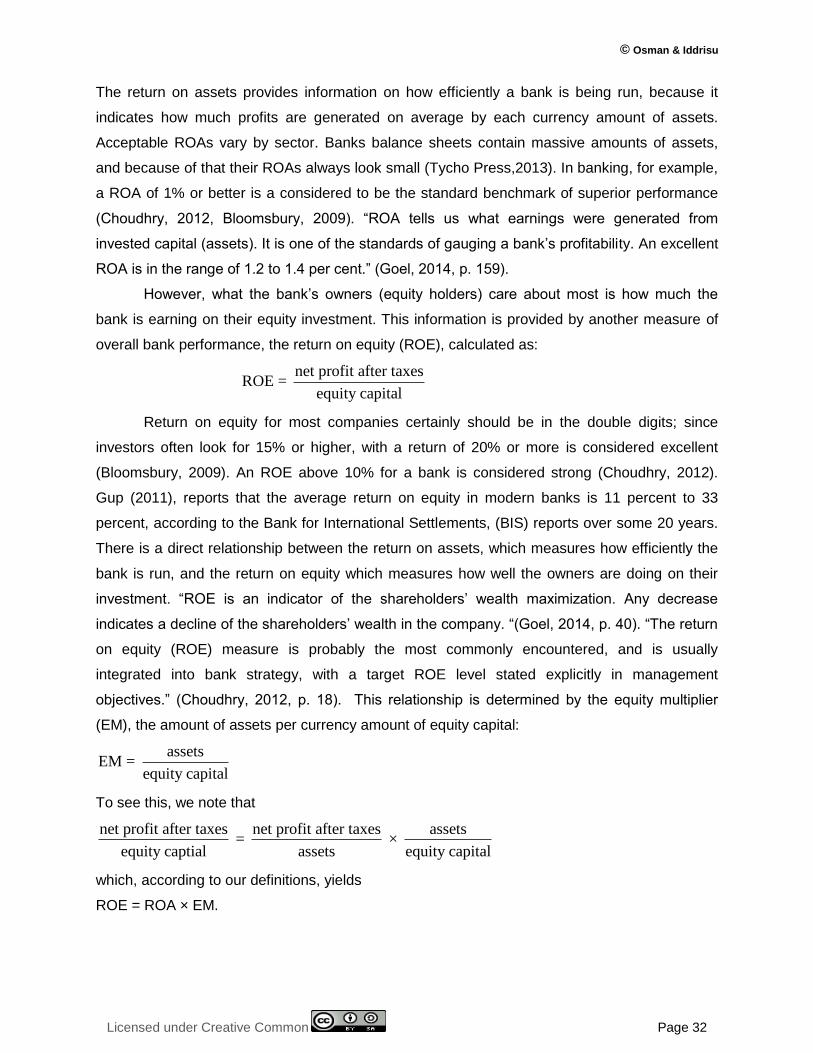
However, what the bank’s owners (equity holders) care about most is how much the
bank is earning on their equity investment. This information is provided by another measure of
overall bank performance, the return on equity (ROE), calculated as:
net profit after taxesROE =
equity capital
Return on equity for most companies certainly should be in the double digits; since
investors often look for 15% or higher, with a return of 20% or more is considered excellent
(Bloomsbury, 2009). An ROE above 10% for a bank is considered strong (Choudhry, 2012).
Gup (2011), reports that the average return on equity in modern banks is 11 percent to 33
percent, according to the Bank for International Settlements, (BIS) reports over some 20 years.
There is a direct relationship between the return on assets, which measures how efficiently the
bank is run, and the return on equity which measures how well the owners are doing on their
investment. “ROE is an indicator of the shareholders’ wealth maximization. Any decrease
indicates a decline of the shareholders’ wealth in the company. “(Goel, 2014, p. 40). “The return
on equity (ROE) measure is probably the most commonly encountered, and is usually
integrated into bank strategy, with a target ROE level stated explicitly in management
objectives.” (Choudhry, 2012, p. 18). This relationship is determined by the equity multiplier
(EM), the amount of assets per currency amount of equity capital:
assetsEM =
equity capital
To see this, we note that
net profit after taxes net profit after taxes assets = ×
equity captial assets equity capital
which, according to our definitions, yields
ROE = ROA × EM.
Page 7
International Journal of Economics, Commerce and Management, United Kingdom
Licensed under Creative Common Page 33
The formula in the Equation above tells us what happens to the return on equity when a bank
holds a smaller amount of capital (equity) for a given amount of assets. ROE is far the most
popular yardstick of financial performance among investors and senior managers. It has been
said that, it is not an exaggeration to say that the careers of many senior executives rise and fall
with their firms’ ROEs. ROE is accorded such importance because it is a measure of the
efficiency with which a company employs owners’ capital (Higgins, 2012). Professional stock
analysts rely more return on equity than either ROA or ROI because it represents the most
direct assessment of profitability from a shareholder’s perspective (Tycho Press,2013)
Although ROA provides useful information about bank profitability, we have already seen
that it is not what the bank’s owners (equity holders) care about most. They are more concerned
about how much the bank is earning on their equity investment, an amount that is measured by
the return on equity (ROE), the net income per currency amount of equity capital (Mishkin, &
Eakins, 2012). A firm must earn both a positive ROE and ROA to grow.
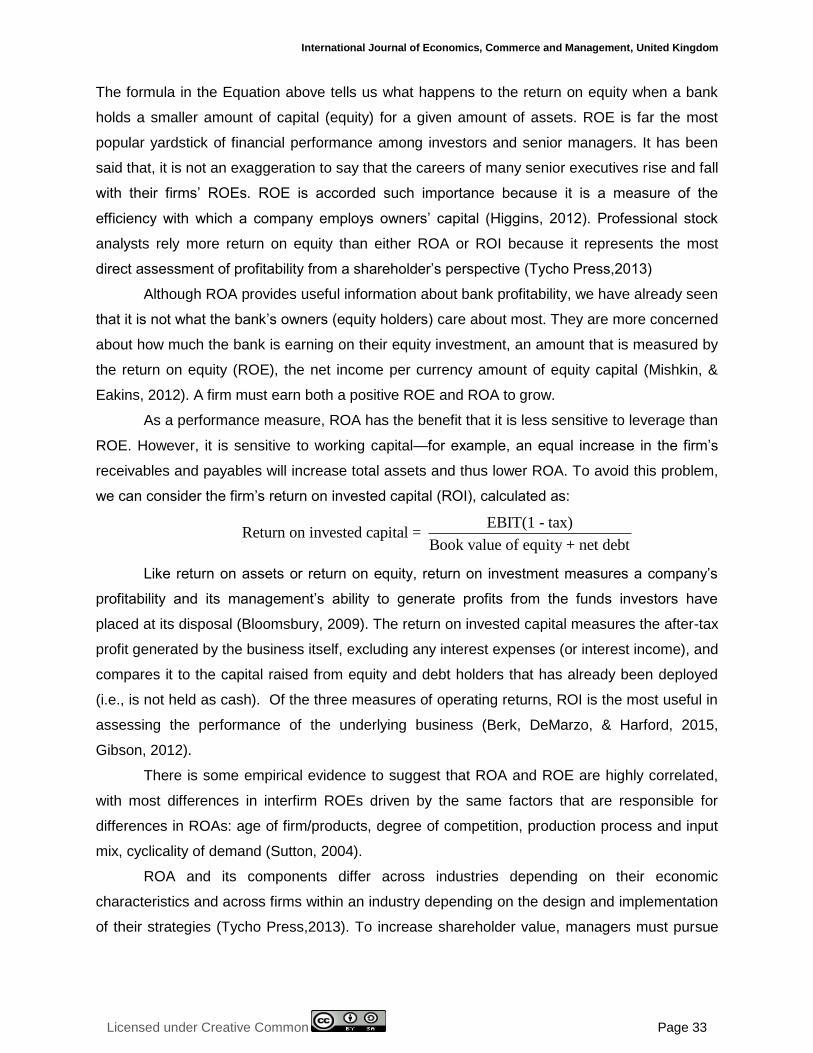
As a performance measure, ROA has the benefit that it is less sensitive to leverage than
ROE. However, it is sensitive to working capital—for example, an equal increase in the firm’s
receivables and payables will increase total assets and thus lower ROA. To avoid this problem,
we can consider the firm’s return on invested capital (ROI), calculated as:
EBIT(1 - tax)Return on invested capital =
Book value of equity + net debt
Like return on assets or return on equity, return on investment measures a company’s
profitability and its management’s ability to generate profits from the funds investors have
placed at its disposal (Bloomsbury, 2009). The return on invested capital measures the after-tax
profit generated by the business itself, excluding any interest expenses (or interest income), and
compares it to the capital raised from equity and debt holders that has already been deployed
(i.e., is not held as cash). Of the three measures of operating returns, ROI is the most useful in
assessing the performance of the underlying business (Berk, DeMarzo, & Harford, 2015,
Gibson, 2012).
There is some empirical evidence to suggest that ROA and ROE are highly correlated,
with most differences in interfirm ROEs driven by the same factors that are responsible for
differences in ROAs: age of firm/products, degree of competition, production process and input
mix, cyclicality of demand (Sutton, 2004).
ROA and its components differ across industries depending on their economic
characteristics and across firms within an industry depending on the design and implementation
of their strategies (Tycho Press,2013). To increase shareholder value, managers must pursue
Page 8
© Osman & Iddrisu
Licensed under Creative Common Page 34
strategies that increase the profitability of the company and ensure that profits grow (Hill, Jones;
& Schilling, 2015).
While shareholders tend to show more interest in ROI and ROE than ROA, many
companies rely on ROA as a means to track the changing efficiency of their asset use over time
(Tycho Press,2013). It is worthy to note that none of the profitability ratios presented mean
much by themselves. Considered together, however, they provide a detailed and
comprehensive picture of not just the focal company, but its position within its industry and
trends in ROA, ROI, and ROE serve as a proxy for the quality of company management (Tycho
Press, 2013).
At present, no regulatory agency such as the SEC or the FASB/IASB accepts
responsibility for determining either the content of financial ratios or the format of presentation
for annual reports, except for the ratio earnings per share. Many practical and theoretical issues
relate to the computation of financial ratios. As long as each firm can exercise its opinion as to
the practical and theoretical issues, there will be a great divergence of opinion on how a
particular ratio should be computed (Gibson, 2012). However, large firms disclose aspects of
their financial performance, including return on assets (Bloomsbury, 2009).
How do earnings affect share prices?
A strong driver of share price is a company’s earnings. As earnings rise and are retained by the
company, the value of the shares to the shareholder rises and so does the price of the shares
as investors, keen to gain access to the higher earnings, become increasingly willing to pay the
higher prices.
Wall Street often distinguishes between “good firms” and “good investments.” A good
firm may be highly profitable, with a correspondingly high ROE. But if its stock price is bid up to
a level commensurate with this ROE, its P/B ratio will also be high, and the stock price may be a
relatively large multiple of earnings, thus reducing its attractiveness as an investment. The high
ROE of the firm does not by itself imply that the stock is a good investment. Conversely,
troubled firms with low ROEs can be good investments if their prices are low enough (Bodie,
Kane & Marcus, 2014).
One strategy that works reasonably well when selection companies to invest in, is to
invest in companies that consistently earn higher rates of return on assets and on equity than
competing firms in the same industry (Lynn, 2012).
According to McGregor (1989) another main role of the stock market is to act as a
barometer of the financial health for the companies that are listed. Thus creditors tend to
favorably consider companies whose shares are performing very well for financing purposes.
Page 9
International Journal of Economics, Commerce and Management, United Kingdom
Licensed under Creative Common Page 35
This preferential treatment is due to the relationship, which exists between a company’s
earnings and its share price. Over the long term, strong earnings are a good indication that the
company will be able to meet its debt requirements. As a result, the company will receive cheap
finance because of the lower risk associated with it (as cited in Sunde & Sanderson, 2009).
According to the empirical literature and theoretical framework, the following hypotheses
can be formulated:
H0: There is no significant linear relationship between the return on assets (ROA), return on
equity (ROE), and the return on investment (ROI) together and market price per share of
Banking financial institutions listed on the Ghana Stock Exchange.
H1: There is a significant statistical relationship between the return on assets (ROA) return on
equity (ROE), and the return on investment (ROI) together and market price per share of
Banking financial institutions listed on Ghana Stock Exchange.
RESEARCH METHODOLOGY
Data
Our data was extracted from the annual published financial statements of banking financial
institutions listed on the Ghana Stock Exchange (GSE) for which consecutive data is available
for the period 2009-2013. All banking financial institutions listed on the GSE for the period 2009-
2013 were sampled. Because variables were calculated over this period, the study only
maintained firms that provided data over the five-year period. This excluded newly listed firms
and firms that did not exist between 2009 and 2013. Firms with missing values were also
excluded from the sample, as well as non-financial firms with capital structures likely to be
significantly different from those included in the sample, and which might constitute serious
outliers. This period was considered important for two reasons: (1) from the table below it is
clear that the Global Financial Crises which ended in 2009 impacted the financial performance
of banks in Ghana, just as it did in many other economies globally. Performance declined during
the period 2006 – 2009 and started to pick up again in 2010.
Table 1. Profitability indicators (%)
Ratio December
2006 2007 2008 2009 2010 2011 2012 2013
Average Profitability ratio 19.0 16.2 13.3 9.8 14.6 17.8 21.5 23.8
Average ROA 4.8 3.7 3.2 2.8 3.8 3.9 4.8 6.2
Average ROE 27.4 25.8 23.7 17.5 20.4 19.7 25.8 31.1
Source: Bank of Ghana Stability Report-February 2014
Page 10
© Osman & Iddrisu
Licensed under Creative Common Page 36
(2) the 2009 and beyond also coincided with a rigorous adoption of IAS 1 (revised) whose
objective is to give greater importance to comprehensive income in order to provide the public
and analysts with more reliable and relevant information on current as well as the future
financial performance of entities.
The sources of data were the annual financial statements of the banks included in the
sample. The income statements and balance sheets data were available at the Securities and
Exchange Commission (SEC) and the Ghana Stock Exchange (GSE) websites. The data
extracted from the income statements and balance sheet was organised into a panel data set.
The panel nature of the data allowed the study to use a panel regression model for testing the
model. A panel data consists of a time-series for each cross-sectional member in the data set.
Hsiao (2003) and Baltagi (1995) look at the advantages of a panel data approach. The data was
organised in excel spreadsheet and processed, and we used the Statistical Package for Social
Sciences (IBM Statistics version 20) to generate the relevant inferential statistics for analysis
and interpretation in the next section.
Model specification
The dependent variable is the market price per share, and the independent variables are return
on assets, return on equity, and return on investments. The general empirical model has the
form:
yi,t = α + βXi,t + ɛi,t ;
with the subscript i denoting the cross-sectional dimension and t representing the time series
dimension.
The left-hand variable yi,t represents the dependent variable in the model, market price
per share for the ith firm at time t, α represent the firm-specific intercepts, β is a 3 × 1 vector of
parameters, Xi,t contains the set of explanatory variables for the ith company in the tth period.
The fixed-effects model, by allowing different company intercepts, serves as a solution for
models, which may not be fully specified, and ɛi,t is a disturbance term defined as ɛit = µi+vit,
where µi denotes the unobservable individual effect, and ɛi,t indicates the remainder of the
disturbance. An obvious way to deal with the fixed-effects of those omitted variables that are
specific to each firm, but remain constant over time is to introduce dummy variables into the
regression model. Because of this, the fixed-effects model is also referred to as the least
squares dummy variable (LSDV) model. It provides a common set of partial regression
coefficients while allowing a different intercept for each of the cross-sectional units. The set of
explanatory variables Xi,t is represented by return on assets, return on equity, and return on
investment.
Page 11
International Journal of Economics, Commerce and Management, United Kingdom
Licensed under Creative Common Page 37
The model is therefore specified as follows:
0 1 2 3it i itit t itROA ROE ROP I
Where:
Pit = closing market price of share for firm i in time t;
ROAit = return on assets for firm i in time t;
ROEit = return on equity for firm i in time t;
ROIit = return on investment for firm i in time t;
ɛ = an error term, normally distributed about a mean of 0 (for purposes of computation, the ɛ is
assumed to be 0.)
Table 2. Definition and Description of Variables in the Model
Definition Variable Description
1. Market price of share Pit
2. Return on Assets ROAit EBIT
Total assets
3. Return on Equity ROEit Profit after tax (PAT)
Shareholders' equity
4. Return on Investment ROIit EBIT
Investment
Analytical Tests
We test the validity of the model and explanatory power of the explanatory variables using the
R2. If R2 = 0 then X does not have any explanatory power for Y. The test of the hypothesis R2 =
0 can therefore be interpreted as a test of whether the regression explains anything at all. The
test of R2 = 0 will be used as a test of whether all of the explanatory variables jointly have any
explanatory power for the dependent variable.
The test is performed according to the following strategy:
1. If p-value is less than 5% (i.e. 0.05), we conclude R2 ≠ 0.
2. If p-value is greater than 5% (i.e. 0.05), we conclude R2 = 0.
Page 12
© Osman & Iddrisu
Licensed under Creative Common Page 38
EMPIRICAL RESULTS
Table 3. Descriptive Statistics
N Minimum Maximum Mean Std. Deviation
MKT SHARE PRICE 45 .1000 45.5000 4.251333 10.3319572
ROA 45 .0098 .0931 .040369 .0209388
ROE 45 .0523 .4998 .226976 .1141659
ROI 45 .0818 .6960 .317698 .1629194
Valid N (listwise) 45
The minimum share price was 0.10 and the maximum share price was 45.50, with the mean
share price being 4.25 cedis meaning that most of the banks are doing well.
The minimum ROA is .0098 and the maximum is .0931 with a mean figure of .0404.
ROAs in the range of 1.2 to 1.4 per cent are considered excellent (Goel, 2014).
The minimum ROE is .0523 and the maximum is 0.4998 with a mean figure of 0.2270.
According to the empirical literature, an ROE above 10% is considered strong (Choudhry,
2012).
Table 4. OLS regression results
Model Unstandardized
Coefficients
Standardized
Coefficients
t Sig. Collinearity
Statistics
B Std. Error Beta VIF
(Constant) -5.133 3.244 -1.582 .121
ROA 36.362 145.738 .074 .250 .804 4.500
ROE 11.487 59.197 .127 .194 .847 22.070
ROI 16.711 36.652 .264 .456 .651 17.230
In our evaluation of a multiple regression equation, an approach to reducing the effects of
multicollinearity is to carefully select the independent variables that are included in the
regression equation. A general rule, if the correlation between two independent variables is
between -0.70 and 0.70, there likely is not a problem using both of the independent variables. A
more precise test is to use the variance inflation factor. It is usually written VIF.
From table 4 above it is apparent that there is a multicollinearity problem as indicated by
VIFs of 22.070 and 17.230 for ROE and ROI respectively. A VIF greater than 10 is considered
unsatisfactory, indicating that the independent variable should be removed from the analysis.
We retained ROE as the variable that best captures what we want to measure and delete the
ROI (Cooper & Schindler, 2014) and rerun the regression and the results are shown in table 6
below.
Page 13
International Journal of Economics, Commerce and Management, United Kingdom
Licensed under Creative Common Page 39
Also, because we gathered these data over consecutive years we anticipated that there might
be problems with autocorrelation. To check this, we examined the Durbin-Watson statistic from
the output. The value of the Durbin-Watson statistic can range from 0 to 4. The value of d is
2.00 when there is no autocorrelation among the residuals. When the value of d gets close to 0,
this indicates positive autocorrelation. Values beyond 2 indicate negative autocorrelation
(Cooper & Schindler, 2014). The d = 2.01 for our data is considered to not present any
significant problem of collinearity and will not affect the validity of our results.
Table 5. ANOVA
Model Sum of Squares df Mean Square F P-value
Regression 944.703 2 472.352 5.287 .009b
Residual 3752.268 42 89.340
Total 4696.971 44
Table 6. OLS regression results
Model Unstandardized
Coefficients
Standardized
Coefficients
t Sig. Collinearity Statistics
B Std. Error Beta Tolerance VIF
(Constant) -5.054 3.208 -1.575 .123
ROA 30.371 143.769 .062 0.211 .834 .224 4.463
ROE 35.594 26.368 .393 1.350 .184 .224 4.463
Table 6 presents results from the OLS regression using the banking industry dataset for the
publicly traded banks in Ghana. Since we are interested in investigating how ROA and ROE of
firms influence their share price, we select closing market price per share as our dependent
variable and ROA and ROE as the explanatory variables.
The column headed “standardized coefficients” or “Beta” gives the regression
coefficients expressed in standardized form. When these are used, the regression Y intercept is
zero. Standardized coefficients are useful when the variables are measured on different scales.
The beta coefficients also show the relative contribution of the three independent variables to
the explanatory power of this equation (Cooper & Schindler, 2014). This table reveals that the
estimated standardized coefficient on ROA is .062 whilst that on ROE is 0.393 suggesting that
both contribute to variations in share price. Using these for explaining the equation, we see that
even though the two coefficients shows a positive linear relationship, the ROE contributes
significantly more than the ROA. In fact, the ROE has about six times the explanatory power of
the ROA.
Page 14
© Osman & Iddrisu
Licensed under Creative Common Page 40
Test of the Coefficients
In Table 6, the coefficient of determination of 0.201, means that the ROA and ROE together
explain about 20.1% of the variation in the share prices.
Testing the null hypothesis can be based on a p-value. In the case of the F-statistic, the
p-value is defined as the probability of observing an F-value as large as or larger than the F test
statistic, assuming the null hypothesis is true. If the p-value is less than our selected
significance level, then we decide to reject the null hypothesis.
From table 5, the ANOVA shows the F-statistic of 5.29 with p-value equal to .009. It is
clearly less than our significance level of .05. This provides provides overwhelming evidence
that our model is well fit and valid. Therefore, we reject the null hypothesis and conclude that at
least one of the regression coefficients is not equal to zero, or the R2 is zero at the 5% level of
significance.
The hypothesis test of whether R2 = 0 yields a p-value of much less than 5%, indicating
that ROA and ROE have statistically significant explanatory power for the dependent variable
(market price per share).
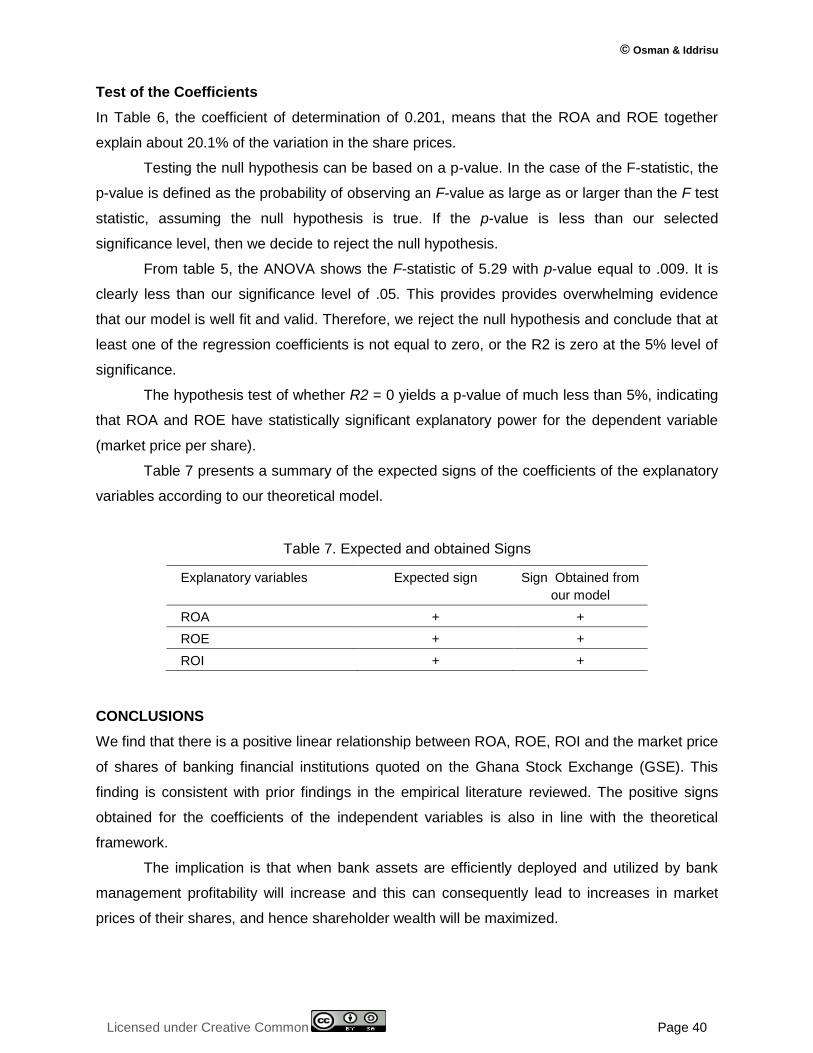
Table 7 presents a summary of the expected signs of the coefficients of the explanatory
variables according to our theoretical model.
Table 7. Expected and obtained Signs
Explanatory variables Expected sign Sign Obtained from
our model
ROA + +
ROE + +
ROI + +
CONCLUSIONS
We find that there is a positive linear relationship between ROA, ROE, ROI and the market price
of shares of banking financial institutions quoted on the Ghana Stock Exchange (GSE). This
finding is consistent with prior findings in the empirical literature reviewed. The positive signs
obtained for the coefficients of the independent variables is also in line with the theoretical
framework.
The implication is that when bank assets are efficiently deployed and utilized by bank
management profitability will increase and this can consequently lead to increases in market
prices of their shares, and hence shareholder wealth will be maximized.
Page 15
International Journal of Economics, Commerce and Management, United Kingdom
Licensed under Creative Common Page 41
RECOMMENDATIONS
At present, neither the SEC nor the Bank of Ghana requires the disclosure of these ratios. The
Securities and Exchange Commission (SEC) as well as the BOG should make it a specific
requirement for banking financial institutions to disclose the ROA and ROE since they are key
performance indicators (KPIs) for banks.
Boards of director could also require management to set targets for these ratios as
benchmarks for comparison and for assessing their performance over across time. Boards
should also ensure that the company issues accurate financial reports and put adequate
financial controls. This actually requires faithful compliance with IFRS.
To managers, they must always bear in mind that for a financial institution to survive, it
must balance the demands of three constituencies: shareholders, creditors (including depositors
for deposit taking financial institutions), and regulators. If financial institution managers do not
generate adequate profits, shareholders may become dissatisfied with management and sell
their stock, driving the stock price lower (Kidwell, Blackwell, Whidbee, & Sias, 2012).
LIMITATIONS AND FURTHER RESEARCH
There are only nine banks listed on the Ghana stock exchange. This number does not give a
large number of observations. This could pose a problem of external validity. Future research
could include all banking financial institutions in Ghana, whether publicly traded or not. The
increase in sample size will improve the validity of the results.
REFERENCES
Abu Hashish, K. (2003). The Role of Published Accounting Information in Predicting of Stock Prices”, An Applied Study on Listed Corporations on Amman Stock Exchange, Al Basa’er Magazine/ Petra University, Amman, issue 2
Abu Shanab, S.A, (2008). The Impact of Returns and Risks on share prices: An Applied Study on Industrial Corporations listed at Amman Stock Exchange, unpublished Doctorate Thesis, Arab Amman University for Higher Studies, Amman, Jordan
AL Kurdi, A. (2005). The Ability Range of Published Accounting Information on Stock Prices Prediction: An Applied Study on Public Shareholding Corporations on Amman Security Exchange, unpublished Doctorate Thesis, Arab Academy for Financial and Banking Sciences, Amman, Jordan
AL Qudah, Y. M. (2005). The role of Accounting Revelation in showing the Real Market Value of Exchanged Corporations’ Stocks in Amman Security Exchange”, unpublished thesis, Arab Amman University for Higher Studies, Amman, Jordan
Baltagi, B.H. (1995), Econometric Analysis of Panel Data. Chichester: Wiley York.
Berk, J., DeMarzo, P. and Harford, J. (2015). Fundamentals of corporate finance (3rd ed.). Pearson Education
Bloomsbury (2009). Qfinance: The ultimate resource. Retrieved from http://www.freebookspot.es/
Bodie, Z, Kane A, and Marcus A. J (2014). Investments (10th ed.). New York, NY: McGraw-Hill
Page 16
© Osman & Iddrisu
Licensed under Creative Common Page 42
BOG (2014). Bank of Ghana Monetary Policy Report, Financial Stability, Vol. 5, No.2/2014, February 2014. Retrieved, 18 October 2015, from http://www. https://bog.gov.gh/index.
BOG (2015). Bank of Ghana Monetary Policy Report, Financial Stability, Vol. 5, No.2/2015, March 2015. Retrieved, 18 October 2015, from http://www. https://bog.gov.gh/index.
Charles W. L. Hill; Gareth R. Jones; and Melissa A. Schilling (2015). Strategic management theory (11th ed.). Retrieved from http://www.freebookspot.es/
Choudhry, M (2012). The principles of banking. Retrieved from http://www.freebookspot.es/
Cooper, D. R. & Schindler, P. S. (2014). Business research methods (12th ed.). Retrieved from http://www.freebookspot.es/
Dehuan, J., & Zhenhu, J. (2008). Firm Performance and Stock Returns: An Empirical Study of the Top Performing Stock Listed on Shanghai Stock Exchange. Academy of Accounting and Financial Studies Journal. Available online at: www.Findarticles.com
Gibson, C. H. (2012). Financial reporting and analysis (13th ed.). Retrieved from http://www.freebookspot.es/
Goel, S. (2014). Financial statements analysis: Cases from corporate India. Retrieved from http://www.freebookspot.es/
Gup, B. E. (2011). Banking and financial institutions: A guide for directors, investors, and counterparties. Retrieved from http://www.freebookspot.es/
Hsiao, C. (2003), Analysis of Panel Data. 2nd ed. Cambridge University Press, Cambridge.
Higgins, R. C. (2012). Analysis for financial management (10th ed.). New York, NY: McGraw-Hill
Kabajeh, AL Nu’aimat, and Dahmash (2012). The Relationship between the ROA, ROE and ROI Ratios with Jordanian Insurance Public Companies Market Share Prices. International Journal of Humanities and Social Science Vol. 2 No. 11; June 2012
Kidwell, D. S., Blackwell, D. W., Whidbee, D. A., and Sias, R. W. (2012). Financial institutions, markets, and money. Retrieved from http://www.freebookspot.es/
Koop, G. (2009). Analysis of economic data (3rd ed.). Retrieved from http://www.freebookspot.es/
Krugman P. and Wells R. (2015). Economics (4th ed.). Madison, New York, NY: Worth Publishers
Lynn S. (2012). The Shareholder Value Myth. Retrieved from http://www.ebook3000.com/
Madura, J (2015). Financial Markets and Institutions (11th ed.) Stanford: Cengage Learning
McGregor, R., (1989). The Mechanics of the Johannesburg Stock Exchange. Juta and Co, Ltd., Cape Town, ISBN: 0-7021-2248-3.
Mishkin, F. S. and Eakins, S. G. (2012). Financial markets and institutions (7th ed.). Retrieved from http://www.freebookspot.es/
Sutton (2004). Corporate Financial Accounting and Reporting. Retrieved from http://www.freebookspot.es/
Tycho Press (2013). Stock marketing investing for beginners: Essentials to start investing successfully [Adobe Digital Editions version]. Retrieved from http://www.freebookspot.es/
Wahlen, J.M. & Baginski, S.P. & Bradshaw, M. (2011). Financial reporting, financial Statement analysis, and valuation: A strategic perspective (7th ed.). Mason, OH: Thompson South Western Publishing.
Warren, C. S., Reeve, J. M., and Duchac, J. E. (2014). Financial and Managerial Accounting (13th ed.). Retrieved from http://www.freebookspot.es/