Page 1
An Empirical Study of the Relationship between Seasonal Precipitation andThermodynamic Environment in Puerto Rico
PAUL W. MILLER
Department of Oceanography and Coastal Sciences, Louisiana State University, Baton Rouge, Louisiana
THOMAS L. MOTE
Department of Geography, The University of Georgia, Athens, Georgia
CRAIG A. RAMSEYER
Department of Geography and Geosciences, Salisbury University, Salisbury, Maryland
(Manuscript received 3 August 2018, in final form 20 December 2018)
ABSTRACT
With limited groundwater reserves and few reservoirs, Caribbean islands such as Puerto Rico are largely
dependent on regular rainfall to meet societal and ecological water needs. Thus, the ability to anticipate
seasonal rainfall shortages, such as the 2015 drought, is particularly important, yet few reliable tools exist for
this purpose. Consequently, interpolated surface precipitation observations from the Daymet archive are
summarized on daily, annual, and seasonal time scales and compared to the host thermodynamic environment
as characterized by the Gálvez–Davison index (GDI), a convective potential parameter designed specifically
for the tropics. Complementing the Daymet precipitation totals, $1.1 million WSR-88D volume scans be-
tween 2002 and 2016 were analyzed for echo tops $ 10 000 ft (;3 km) to establish a radar-inferred pre-
cipitation activity database for Puerto Rico. The 15-yr record reveals that the GDI outperforms several
midlatitude-centric thermodynamic indices, explaining roughly 25% of daily 3-km echo top (ET) activity
during each of Puerto Rico’s primary seasons. In contrast, neither mean-layer CAPE, the K index, nor total
totals explain more than 11% during any season. When aggregated to the seasonal level, the GDI strongly
relates to 3-km ET (R2 5 0.65) and Daymet precipitation totals (R2 5 0.82) during the early rainfall season
(ERS; April–July), with correlations weaker outside of this period. The 4-month ERS explains 51% (41%) of
the variability to Puerto Rico’s annual rainfall during exceptionally wet (dry) years. These findings are
valuable for climate downscaling studies predicting Puerto Rico’s hydroclimate in future atmospheric states,
and they could potentially be adapted for operational seasonal precipitation forecasting.
1. Introduction
Precipitation forecasting in the eastern Caribbean
is a critical task because of the societal and ecologi-
cal implications of below-normal precipitation in this
drought-vulnerable region. With little groundwater
storage and limited reservoir capacity, deviations
from the climatological seasonal precipitation pattern
can pose serious human consequences (Rhiney 2015;
Van Beusekom et al. 2016). Further, the region is home
to 17 tropical montane cloud forests (Aldrich et al.
1997), biologically diverse ecosystems whose endemic
species require regular, abundant rainfall for survival
(Foster 2001). Both the ecological and societal impacts
of below-normal precipitation were poignantly illus-
trated during the 2015 drought in Puerto Rico (Mote
et al. 2017; O’Connell et al. 2018), the most populous
island in the chain. With 3.3 million residents and the
2.3-million-person San Juan metro area, the ability to
forecast and anticipate seasonal precipitation on the
island is vital.
Consequently, the thermodynamic conditions that
support precipitation in tropical environments, often in
the form of convection, remain a source of contempo-
rary research (e.g., Gálvez and Davison 2016). Though
midlatitude convective environments have received
abundant attention during the last several decades (e.g.,
Johns and Doswell 1992; Haklander and Van Delden 2003;Corresponding author: Paul W. Miller, [email protected]
APRIL 2019 M I LLER ET AL . 277
DOI: 10.1175/WAF-D-18-0127.1
� 2019 American Meteorological Society. For information regarding reuse of this content and general copyright information, consult the AMS CopyrightPolicy (www.ametsoc.org/PUBSReuseLicenses).
Page 2
Miller andMote 2018), the transferability of these findings to
tropical climates is dubious. Tropical thermodynamic
environments are characterized by greater low-level
moisture content, trade-wind inversions, weaker ver-
tical wind shear, and a higher melting level and tro-
popause. Taken together, these differences serve to
alter both the dynamical and microphysical processes
active in tropical thunderstorm updrafts compared
to their midlatitude counterparts, and diminish the
transferability of existing, predominantly midlatitude-
centric, convective forecasting techniques to the tropics.
For instance, abundant low-level moisture results
in greater water loading that retards updraft velocity
and enhances negative buoyancy. Thus, outflows
strengthen and larger wind shears are required to
split tropical thunderstorm updrafts compared to
midlatitude storms (Wissmeier and Goler 2009). Ad-
ditionally, James and Markowski (2010) found that
the role of midtropospheric moisture on convective
intensity varied according to the magnitude of the
convective available potential energy (CAPE). For the
CAPEs commonly detected in Puerto Rico, for in-
stance, dry air aloft reduced the vigor of convection
(James and Markowski 2010), contrary to the prevail-
ing belief of midlatitude forecasters.
Recognizing this need, a new thermodynamic in-
dex, the Gálvez–Davison index (GDI), was developed
specifically for the tropics (Gálvez and Davison 2016),
and has already received attention in weather and
climate research (Mote et al. 2017; Donndelinger and
Tseng 2018). However, because the initial validation
efforts undertaken by Gálvez and Davison (2016)
spanned only the 2013 rainy season and compared
the GDI to only remotely sensed cold cloud-top area
(brightness temperature , 2108C), its performance
as a seasonal precipitation analysis tool is less clear.
Given the need to anticipate drought in the particu-
larly vulnerable eastern Caribbean region, this study
will analyze the relationship between the GDI and
seasonal precipitation activity, informed by both radar
observations and surface precipitation data, over a 15-yr
period (2002–16) in Puerto Rico. After presenting the
results, a method for leveraging these findings to pro-
duce seasonal precipitation forecasts for Puerto Rico is
also outlined.
2. Data and methods
Though the goal of this study is to assess the po-
tential of the GDI as a seasonal precipitation analy-
sis tool with the hope it can be eventually leveraged
for seasonal forecasts, the index was originally designed
to forecast convective activity, not necessarily precipitation.
The depth of precipitation occurring over Puerto Rico
is a function of additional factors, such as storm mo-
tion, precipitation efficiency, etc., that are not captured
by the GDI. Thus, the GDI will first be compared to
radar-derived echo tops (ET) as a proxy for convection
on a seasonal scale, a metric more fairly assessing its
stated purpose. ET data are also advantageous for be-
ing spatially continuous over the island and being able
to characterize both the coverage and persistence of
precipitation features at an earlier stage of the hydro-
logical cycle. Subsequent to the GDI–ET comparison,
the index will be correlated against island-wide sea-
sonal precipitation estimates from the Daymet archive
(Thornton et al. 2017).
Gridded radar-derived ET estimates were retrieved
for the Weather Surveillance Radar-1988 Doppler
(WSR-88D) in Puerto Rico (TJUA; Fig. 1a) between
2002 and 2016 from the publicly available National
Centers for Environmental Information (NCEI) ar-
chive. The ET product is a 4-km resolution estimate
of the highest 18.3-dBZ reflectivity height rounded to
the nearest 1.5 km MSL increment (5000 ft), up to a
maximum altitude of 21.3 km (70 000 ft). This specific
radar product was selected because of its skillful fil-
tering of nonprecipitation echoes, a particular ad-
vantage in Puerto Rico’s mountainous terrain where
ground clutter is frequent. The data were processed to
yield the total count of ET grid cells$ 3.0 km (10 000 ft)
in each of the;1.1million volume scans during the 15-yr
study period (Fig. 1b). The 3.0-km threshold was the
lowest ET threshold that showed little visual evidence
of ground clutter contamination. In contrast, the radar
returns from the higher terrain features of the Cordillera
Central and Luquillo Mountains (Fig. 1a) regularly
produced erroneous ET estimates of 1.5 km. Addi-
tionally, ET estimates higher than 3.0 km suffered
from distinct ranging effects, producing areas of poor
ET detection driven by the radar’s scan strategy (OFCM
2017). Though the ranging effects, manifested as concen-
tric rings of greater 3.0-km ET frequency, are still evident
in Fig. 1b, they are subtler than for higher ET thresholds.
The 3.0-km ET threshold is low enough to capture
nearly all convective precipitation in Puerto Rico,
including the 4.5-km ET cells determined by Nesbitt
et al. (2006) to contribute nearly half of the island’s
annual precipitation, though it likely overshoots fron-
tal showers and some trade-wind orographic rainfall
(Scholl and Murphy 2014).
Meanwhile, island-wide mean precipitation totals
were derived from the Daymet archive (Thornton et al.
2017). Daymet is a 1-km gridded climate product for
North America, including Puerto Rico as of version
3 (Fig. 1c). The dataset employs daily precipitation
278 WEATHER AND FORECAST ING VOLUME 34
Page 3
observations from the Global Historical Climatology
Network (GHCN) to interpolate a spatially contin-
uous representation of daily precipitation using a
truncated Gaussian filter. A validation of the Daymet
procedure identified the mean absolute error for pre-
cipitation was 19.3% of the annual total (Thornton
et al. 1997). Daily Daymet products for Puerto Rico
were accessed from 1980 to 2016 to describe daily,
seasonal, and annual precipitation totals for the island.
Figure 1c shows a clear correspondence between the
areas of greatest 3.0-km ET frequency and the re-
gions of greatest annual precipitation accumulation,
suggesting that the ET radar product is accurately
capturing precipitation-producing features in the
atmosphere.
ET frequency and island-mean precipitation totals
are summarized during the dry season (DS; December–
March), early rainfall season (ERS; April–July), and
late rainfall season (LRS; August–November) following
the Puerto Rico seasonal delineations of Van Beusekom
et al. (2015). Table 1 shows the seasonal contributions to
the annual Puerto Rico precipitation and 3-kmET totals
as well as the correlation between them. On an annual
scale, 3-km ET frequency accounts for 76% of the var-
iation in accumulated precipitation (Table 1), indicating
that this radar product is a reasonablemeasure of Puerto
Rico precipitation activity. The seasonal ET frequencies
and island-mean precipitation are subsequently com-
pared to the mean GDI value as calculated from the
0000 UTC San Juan, Puerto Rico radiosonde launch
(TJSJ; Fig. 1). The 0000 UTC launch time corresponds
most closely to the 1900 UTC peak in Puerto Rico di-
urnal rainfall documented by Jury (2012). Radiosonde
observations were retrieved from the publicly accessible
Integrated Global Radiosonde Archive (Durre et al.
2006), version 2, maintained by the NCEI.
TheGDI calculation, described byGálvez andDavison
(2016), utilizes temperature and specific humidity in-
formation at four vertical pressure levels (950, 850,
700, and 500 hPa) to derive three GDI subcomponents:
the column buoyancy index (CBI), inversion index (II),
and midlevel warming index (MWI). The CBI describes
the collocation of heat and moisture in the lower tro-
posphere, which enhances the likelihood of convective
activity. Meanwhile, the II captures the prominence of
the trade-wind inversion layer, which often serves to
extinguish nascent updrafts. Last, the MWI quan-
tifies the destabilizing effect of cool, midlevel troughs
versus the stabilizing effect of warm, midlevel ridges
on potential convection. The three subcomponents
are summed to yield the final GDI, a unitless number
typically between 230 and 50 in Puerto Rico. Values
between 220 and 5 indicate the potential for shallow
convection, with values greater than 5 indicating the
potential for brief thunderstorm activity. As the GDI
increases above 5, the atmosphere becomes increas-
ingly favorable for deep convection. Readers inter-
ested in the full GDI derivation are directed to Gálvezand Davison (2016).
TABLE 1. Seasonal and annual mean 3-km ET counts and total
island-average precipitation as well as the 3-km ET–precipitation
R2 values. The P values determined according to an F test also
shown. Annual values are calculated using aDecember–November
year, and as a result, 2002 was dropped from the DS and annual
calculations because of missing data.
DS ERS LRS Annual
3-km ET (3106) 3.8 9.4 13.6 27.8
Precipitation (mm) 344 633 829 1831
ET–precipitation R2 0.29 0.68 0.69 0.76
ET–precipitation p value 0.05 ,0.01 ,0.01 ,0.01
FIG. 1. (a) Topographic map of Puerto Rico with both data
collection locations marked. The red circle corresponds to the
radiosonde launch site near San Juan, PR (TJSJ), and the red
triangle represents the WSR-88D site serving the island (TJUA).
The Cordillera Central references the entire east–west ori-
ented mountain chain denoted by the corresponding red ar-
row. The dashed black line roughly dissecting the island
represents the 66.58W meridian. (b) Annual frequency of ET
returns $ 3 km for the 15-yr period 2002–16. (c) Annual pre-
cipitation climatology for the 30-yr period 1985–2014 from the
Daymet dataset.
APRIL 2019 M I LLER ET AL . 279
Page 4
3. Results
As previously described, the GDI was originally de-
veloped as a near-term operational forecasting tool.
Thus, before comparing precipitation activity (referring
collectively to both 3-km ET frequency and Daymet
precipitation totals) against theGDI on a seasonal scale,
the GDI will be assessed against both ET and island-
wide precipitation on a daily scale. Figure 2 shows that
on a daily resolution, higher GDI values (as categorized
by standard deviations from normal) are characterized
by both more frequent ET $ 3km (Fig. 2a) and greater
precipitation totals island-wide (Fig. 2b). Additionally,
both 3-km ET and daily precipitation increase smoothly
with increasing GDI, meaning even small increases in
the GDI are associated with greater precipitation
activity near Puerto Rico. However, each GDI bin
is characterized by a large spread about the median
value. Even though GDI increases are associated with
increased daily precipitation activity on average, ad-
ditional factors not explicitly captured by the GDI
can lead to enhanced/diminished 3-km ET and/or
precipitation activity.
Given Puerto Rico’s strongly seasonal climate as
described in section 2, the daily GDI performance is
disaggregated by season to diagnose any intra-annual
trends in performance. Figure 3 shows two sets of linear
regression analyses between daily GDI versus 3-km ET
and GDI versus daily precipitation. Though the GDI
binning comparison in Fig. 2 depicted considerable in-
trabin variability for both 3-km ET and precipitation,
Fig. 3 shows that the 0000 UTC GDI nonetheless ex-
plains ;25% of daily 3-km ET activity during all sea-
sons. In contrast, the correlation betweenGDI and daily
precipitation is weaker. Though the binning analysis in
Fig. 2b indicated even clearer increases in rainfall with
increasing GDI, this is not reflected in the regression
analysis, with GDI explaining only 6%–9% of mean-
island precipitation in any season. Because of the large
number of days contributing to each R2 calculation, the
relationships are statistically significant even though they
are weak and not particularly meaningful.
Figure 4 continues the daily analysis by illustrating the
superiority of the GDI as a thermodynamic forecasting
tool compared to common, midlatitude-centric param-
eters. Though Gálvez and Davison (2016) compared the
GDI to total totals (TT), the K index (K), and CAPE
for a case study, Fig. 4 expands their comparison to a
much larger sample, and clearly indicates the value of
the GDI over other operational forecasting metrics. For
instance, GDI explains 25% of the daily variation in
3-km ET activity during the LRS compared to 1%, 9%,
and 3% for mean-layer CAPE (MLCAPE), K, and
TT, respectively. The same performance patterns are
evident for the ERS; however, during the DS, the
performance improvement of the GDI is more modest.
FIG. 2. (a) Daily ET and (b) precipitation activity stratified by GDI value. The six GDI categories are defined by
standard deviations (s5 18.0) from themean (m5 1.5). In ascending order, the averageGDI values for each of the
categories are236.7 (n5 26),222.5 (n5 795),27.4 (n5 2052), 9.5 (n5 1446), 27.3 (n5 743), and 42.6 (n5 185).
Both ET and precipitation are plotted using log axes to facilitate easier visual comparisons.
280 WEATHER AND FORECAST ING VOLUME 34
Page 5
During this period of the year, the GDI explains 26%
of daily 3-km ET frequency compared to 11% for
each mean-layer CAPE, K, and TT. As with Fig. 3, the
large number of days contributing to the regres-
sion analysis yields statistical significance, even in the
absence of strong correlations.
Though the GDI performs as intended on a daily
basis, the remainder of the results will be discussed
annually and seasonally to assess whether the GDI is a
skillful analysis tool on larger temporal scales. Figure 5
relates annual ET $ 3 km and precipitation totals to
the mean annual GDI, and the correlation between
the GDI and both precipitation metrics is clear and
statistically significant. As with the daily analysis, the
GDI is more strongly related to ET returns (R2ET 5
0.50; p , 0.01) than precipitation. However, on the
annual scale, Fig. 5b shows that the GDI nonetheless
explains more than one-third (R2PRCP 5 0.34; p , 0.05)
of the variability in mean annual Puerto Rico precipi-
tation compared to 6%–9% when assessed on the daily
scale (Fig. 3). Similarly, theGDI explains approximately
25% more of the variation in 3-km ET activity on an
annual level than at the daily level.
Though clear relationships are present on the annual
and daily levels, the goal of this study is to assess the
potential of the GDI as a seasonal precipitation analysis
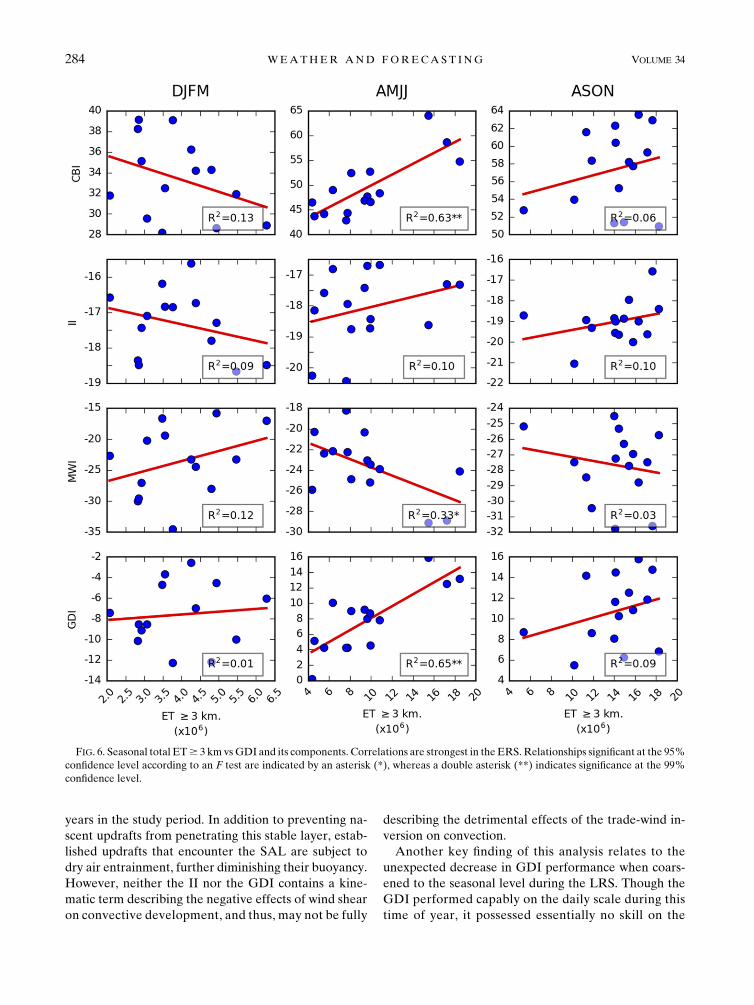
tool. Thus, Fig. 6 first disaggregates the 15-yr 3-km ET
dataset by season in attempt to improve upon the per-
formance gains identified by coarsening the temporal
(Fig. 5) while still allowing for seasonal skill variation at
the coarser interval. The seasonal 3-km ETs are com-
pared against the average GDI for the same period as
well as the mean of its three component terms, the CBI,
II, and MWI. Within the annual cycle, the GDI is most
strongly associated with 3-km ET during the ERS, with
correlations substantially weaker and statistically in-
significant during the DS and LRS. In fact, the GDI
more strongly explains seasonal ERS 3-kmET than both
daily ERS 3-km ET and annual ET. However, the op-
posite pattern is apparent during the LRS. Though the
GDI explained 27% of daily 3-km ET variation dur-
ing the LRS, the relationship is not even statistically
significant on the seasonal level.
Breaking down theGDI by component, ET during the
ERS are strongly related to the CBI (R2ERS5 0.63), with a
coefficient of determination only slightly lower than for
the GDI itself (R2ERS5 0.65). Curiously, the MWI dis-
plays the opposite relationship to convection from the
justification given for its inclusion in the GDI calcula-
tion by Gálvez and Davison (2016). As the MWI be-
comes more negative, 3-km ET frequency increases.
However, more negative MWIs correspond to higher
FIG. 3. Scatterplots of (top) daily GDI vs 3-km ET and (bottom) GDI vs precipitation disaggregated according to the three primary
seasons in Puerto Rico. Relationships significant at the 95% confidence level according to an F test are indicated by an asterisk (*),
whereas a double asterisk (**) indicates significance at the 99% confidence level.
APRIL 2019 M I LLER ET AL . 281
Page 6
500-hPa temperatures, which are reasoned to limit pre-
cipitation by increasing stability as measured by tradi-
tional forecasting parameters such as the lifted index.
Upon further inspection, the coefficient of determina-
tion between the MWI and CBI during the ERS is 0.67
(not shown) with larger CBIs associated with lower
(more negative) MWIs. Thus, the propensity for strongly
negative MWI environments to host more frequent 3-km
ET is likely attributed to the low-level thermodynamic
favorability (i.e., high CBI) for tropical convection in
these settings.
Working toward the goal of a seasonal precipitation
analysis tool, Fig. 7 disaggregates the island-wide-average
precipitation by season and compares against the GDI
and its subcomponents. As with total 3-km ET, the
GDI and precipitation are most strongly correlated
during the ERS, with little to no relationship outside
of this season. Though correlations during the DS are
weak and statistically insignificant, they are still stronger
than the GDI–precipitation relationship during the LRS.
Remarkably, there is no relationship betweenmeanGDI
and total precipitation during the LRS, the wettest period
of the year, despite a statistically significant positive
correlation on the daily scale during the same time of
year (Fig. 3). In contrast, the coefficient of determi-
nation between ERS precipitation and the GDI is
an impressive 0.82, greater than that for 3-km ET.
This is an unexpected, yet encouraging result given
that seasonal precipitation analysis is not an explicitly
stated purpose of the GDI.
Though the poor GDI performance on a seasonal
scale outside of the ERS is undesirable, the ERS is the
most hydrologically critical season, contributing the
most variability to annual precipitation anomalies
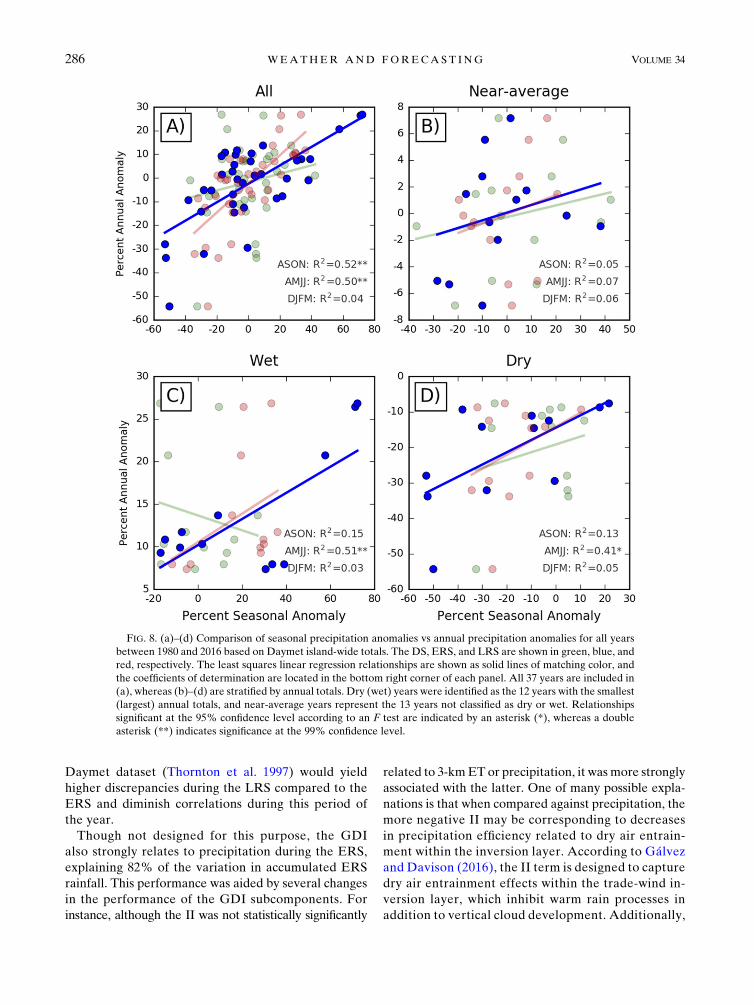
in Puerto Rico. Figure 8 compares the 1980 to 2016
seasonal precipitation anomalies to annual precipitation
FIG. 4. Scatterplots of three traditionalmidlatitude thermodynamic parameters [(top)MLCAPE, (middle)K, and (bottom) TT] vs daily
3-km ET. Relationships significant at the 95% confidence level according to an F test are indicated by an asterisk (*), whereas a double
asterisk (**) indicates significance at the 99% confidence level.
282 WEATHER AND FORECAST ING VOLUME 34
Page 7
anomalies. As expected, variations in the intensity of
the two wet seasons (ERS and LRS) explain the most
variation in the annual anomaly (R2LRS 5 0.52, R2
ERS 50.50, R2
DS 5 0.04; Fig. 8a). However, when the same
relationships are evaluated for only wet years (Fig. 8c)
and dry years (Fig. 8d), the ERS anomaly explains much
more of the annual outcome than the LRS anomaly. In
wet years, the ERS explains 51% of the annual pre-
cipitation anomaly (R2LRS 5 0.15), and in dry years,
it explains 41% of the annual variation (R2LRS 5 0.13).
Thus, the GDI most accurately characterizes precip-
itation during the most important period of the year to
Puerto Rico’s hydroclimate.
4. Discussion
The results presented in section 3 provide ample
evidence that the GDI is an improvement to tropical
convection forecasting tools than existing midlatitude-
oriented thermodynamic indices. During each of the
three primary seasons, the GDI explained approxi-
mately 25% of the daily variation in 3-km ET fre-
quency, a greater proportion that could be achieved
using mean-layer CAPE, TT, or K. The DS, charac-
terized by the most modest GDI performance gains
compared to the three traditional tools, is also the
time of year when the GDI would not be expected to
perform as capably. Scholl et al. (2009) identified that a
larger proportion of DS precipitation in Puerto Rico
is attributable to fronts, troughs, and trade-wind oro-
graphic precipitation that the GDI is not equipped to
capture. Though less frequent in the tropics, these
circumstances are common in the midlatitudes where
convective parameters like mean-layer CAPE, TT,
and K are consulted operationally. Consequently,
these indices likely correlated more strongly with daily
3-km ET during the DS (Fig. 4) because this season
more resembled the midlatitude environments and
associated precipitation mechanisms for which they
were developed.
Though the expanded validation in this study cor-
roborated several aspects of the GDI performance
in Gálvez and Davison (2016), it also identified some
discrepancies. For instance, the CBI term was strong-
ly correlated with both 3-km ET and precipitation,
whereas the II and MWI terms were only weakly
correlated. In particular, the MWI was negatively
correlated with both 3-km ET and total seasonal pre-
cipitation. However, the logic applied by Gálvez and
Davison (2016) suggests the opposite should be true.
The MWI term is a function of 500-hPa temperature
with warmer temperatures yielding more negative MWI
values. Thus, the pattern documented in Figs. 6–7 during
the ERS indicates that precipitation activity increases
as the 500-hPa temperature increases, contrary to tra-
ditional forecasting logic, which reasons that warmer
midlevel temperatures would increase stability (i.e., a
more positive lifted index). As section 3 described, the
MWI and CBI are strongly negatively correlated during
the ERS (R2ERS 5 0.67), meaning that as 500-hPa tem-
peratures increase, so does the concentration of heat
and moisture in the lower troposphere (i.e., larger CBI).
In fact, most shallow convection is likely to be primarily
aided by the thermodynamically conducive lower at-
mosphere, and never penetrate to 500 hPa where the
thermodynamic environment is less favorable.
The weak relationship between II and 3-km ET,
even during the ERS, was surprising given the relative
abundance of literature citing the trade-wind inversion
as a limiting factor of tropical convective development
(e.g., Cao et al. 2007). Additionally, this layer can be
characterized by high dust-aerosol loadings that have
been further shown to constrain convective develop-
ment (e.g., Hosannah et al. 2015; Hosannah et al. 2017).
The Saharan air layer (SAL), a plume of hot, dust-rich
air advected from Africa to the Caribbean, is associated
with larger (i.e., more negative) II values, and was
recently shown to play a key role in the historic 2015
Puerto Rico drought (Mote et al. 2017). Similarly, the
2015 ERS witnessed the least number of 3-km ET of all
FIG. 5. Annual GDI vs the same measures of precipitation ac-
tivity in Fig. 2 (averaged annually). A December–November year
was employed instead of a calendar year so that each dry season
was self-contained to a single annual average, which excluded 2002
(missing December 2001). Relationships significant at the 95%
confidence level according to an F test are indicated by an asterisk
(*), whereas a double asterisk (**) indicates significance at the 99%
confidence level.
APRIL 2019 M I LLER ET AL . 283
Page 8
years in the study period. In addition to preventing na-
scent updrafts from penetrating this stable layer, estab-
lished updrafts that encounter the SAL are subject to
dry air entrainment, further diminishing their buoyancy.
However, neither the II nor the GDI contains a kine-
matic term describing the negative effects of wind shear
on convective development, and thus, may not be fully
describing the detrimental effects of the trade-wind in-
version on convection.
Another key finding of this analysis relates to the
unexpected decrease in GDI performance when coars-
ened to the seasonal level during the LRS. Though the
GDI performed capably on the daily scale during this
time of year, it possessed essentially no skill on the
FIG. 6. Seasonal total ET$ 3 km vsGDI and its components. Correlations are strongest in the ERS.Relationships significant at the 95%
confidence level according to an F test are indicated by an asterisk (*), whereas a double asterisk (**) indicates significance at the 99%
confidence level.
284 WEATHER AND FORECAST ING VOLUME 34
Page 9
seasonal level for the same period. Three possible ex-
planations for this result are as follows: 1) the GDI was
not developed specifically for Puerto Rico, and the de-
teriorating relationship outside of the ERS is a function
of our location of interest; 2) the synoptic- and meso-
scale circulations that favor rainfall in Puerto Rico
(Carter and Elsner 1997) vary throughout the annual
cycle and can enhance 3-km ET beyond the GDI’s ex-
pectations at different times of year. For instance, the
disproportionate 3-km ET contribution from easterly
waves and tropical cyclones on a seasonal level may
cause a LRS with a low GDI to possess high 3-km ET
count and weaken the regression relationship in Fig. 6;
and 3) the 19.3% mean absolute error reported for the
FIG. 7. Seasonal precipitation totals vs GDI and its components. As with convective reflectivities correlations are strongest in the ERS.
Relationships significant at the 95% confidence level according to an F test are indicated by an asterisk (*), whereas a double asterisk (**)
indicates significance at the 99% confidence level.
APRIL 2019 M I LLER ET AL . 285
Page 10
Daymet dataset (Thornton et al. 1997) would yield
higher discrepancies during the LRS compared to the
ERS and diminish correlations during this period of
the year.
Though not designed for this purpose, the GDI
also strongly relates to precipitation during the ERS,
explaining 82% of the variation in accumulated ERS
rainfall. This performance was aided by several changes
in the performance of the GDI subcomponents. For
instance, although the II was not statistically significantly
related to 3-kmET or precipitation, it was more strongly
associated with the latter. One of many possible expla-
nations is that when compared against precipitation, the
more negative II may be corresponding to decreases
in precipitation efficiency related to dry air entrain-
ment within the inversion layer. According to Gálvezand Davison (2016), the II term is designed to capture
dry air entrainment effects within the trade-wind in-
version layer, which inhibit warm rain processes in
addition to vertical cloud development. Additionally,
FIG. 8. (a)–(d) Comparison of seasonal precipitation anomalies vs annual precipitation anomalies for all years
between 1980 and 2016 based on Daymet island-wide totals. The DS, ERS, and LRS are shown in green, blue, and
red, respectively. The least squares linear regression relationships are shown as solid lines of matching color, and
the coefficients of determination are located in the bottom right corner of each panel. All 37 years are included in
(a), whereas (b)–(d) are stratified by annual totals. Dry (wet) years were identified as the 12 years with the smallest
(largest) annual totals, and near-average years represent the 13 years not classified as dry or wet. Relationships
significant at the 95% confidence level according to an F test are indicated by an asterisk (*), whereas a double
asterisk (**) indicates significance at the 99% confidence level.
286 WEATHER AND FORECAST ING VOLUME 34
Page 11
the MWI is less closely associated with ERS pre-
cipitation, further aiding the GDI’s improved perfor-
mance. Though this sounds counterintuitive, because
the MWI is negatively correlated with 3-km ET [in-
stead of positively correlated as Gálvez and Davison
(2016) desired], a weaker relationship actually allows
the sum GDI to function more like it was originally
intended.
By establishing the GDI as a capable ERS precipi-
tation analysis tool and determining the importance
of the ERS to Puerto Rico’s hydroclimate, this study
lays the groundwork for developing the GDI as a sea-
sonal precipitation forecasting aid. Though this study
computed the GDI from 0000 UTC TJSJ soundings,
the methodology could be adapted to calculate the
GDI from proxy soundings extracted from numerical
weather model output. For example, the Weather
Prediction Center (WPC) already produces 168-h GDI
forecasts (https://www.wpc.ncep.noaa.gov/international/gdi/)
from the Global Forecast System (GFS). However, this
forecast period could be extended to the seasonal scale
using simulations from the Climate Forecast System,
version 2 (CFSv2; Saha et al. 2014). The 18 resolutionCFSv2 is initialized operationally four times daily to
produce 9-month global forecasts available at 6-hourly
and month-average output resolution. An ensemble
of CFSv2 operational runs leading up to the forecast
period could be leveraged to produce a probabilistic
GDI forecast, which could then be translated into
ERS precipitation totals and confidence intervals.
Future research should evaluate the ability of the
coarse-resolution CFS to predict ERS GDI with an
operationally meaningful lead time, and subsequently
investigate any necessary bias-correction or calibration
procedures.
5. Conclusions
This study analyzes 15 years of 3-km ET and pre-
cipitation in Puerto Rico to assess the skill of the
Gálvez–Davison index, an operational forecasting
measure of convective potential, as a seasonal precipi-
tation analysis tool. The GDI is shown to significantly
outperform mean-layer CAPE, the K index, and total
totals in corresponding to daily 3-km ET frequencies
over the island. This result alone is valuable for weather
forecasters in the region attempting to understand daily
convective probabilities. Specifically, the GDI explains
;25% of the daily 3-km ET activity during the wettest
two-thirds of the year but only 6%–9% of the daily
precipitation variability. However, correlations are
much stronger on the annual level. The GDI explains
50% of the annual variation in 3-km ET detected by the
Puerto Rico radar station, whereas the relationship with
total precipitation is weaker (R2PRCP 5 0.34; p , 0.05).
Nonetheless, the GDI-precipitation regression rela-
tionship in Fig. 5 suggests a decrease (increase) of one
GDI unit corresponds to a decrease (increase) of 85mm
in annual total precipitation across the island, equivalent
to 765 billion liters of water integrated across the Puerto
Rico land area.
When disaggregated by season, the relatively strong
daily GDI–ET association during the LRS weakens, and
there is essentially no relationship between the GDI and
seasonal 3-kmET activity (R2LRS 5 0.09) or precipitation
(R2LRS 5 0.00). In contrast, the GDI more accurately
characterizes 3-km ET during the ERS (R2ERS 5 0.65)
than any other time of year. The relationship becomes
even stronger when the GDI is compared against total
precipitation during the ERS, explaining 82% of the
variation. Fortunately, the ERS is the most influential
season in regards to the island’s hydroclimate (Fig. 8).
ERS rainfall anomalies during wet and dry years are
more strongly correlated with annual deviations than
any other season. Thus, years with wetter-than-average
ERSs tend to be pluvial years, and years with drier-than-
average ERSs tend to be drought years. Consequently,
the GDI’s strong correlation to precipitation and 3-km
ET during this season is both desirable and beneficial
for future climatological analysis. This finding will aid
future climate change studies by isolating the most
hydrologically critical period of the year, the ERS, for
special attention.
Although the GDI is statistically significantly related
to 3-km ET on the daily, seasonal, and annual levels,
these relationships leave much room for improvement.
For instance, there is essentially no relationship between
the GDI and 3-km ET/precipitation during the LRS.
Further, the GDI contains no kinematic component, but
previous research (Ramseyer and Mote 2018) suggests
that the environment’s kinematic character also exer-
cises an important control on more shallow and isolated
tropical convection. Future research may consider modi-
fying the GDI to include a kinematic component
as well as evaluating the ability of coarse-resolution
model output, such as the CFSv2, to forecast seasonal
GDI values several months in advance. With eastern
Caribbean hydroclimates projected to receive less pre-
cipitation in the coming decades (Karmalkar et al.
2013; Bhardwaj et al. 2018), the ability to accurately
anticipate seasons of below-average precipitation will
only become more pressing.
Acknowledgments. This research was supported by
the NSF Luquillo Long-Term Ecological Research
Program (DEB 1239764) through a subaward from the
APRIL 2019 M I LLER ET AL . 287
Page 12
University of Puerto Rico-Rio Piedras to the Univer-
sity of Georgia.
REFERENCES
Aldrich, M., C. Billington, M. Edwards, and R. Laidlaw, 1997: A
global directory of tropical montane cloud forests. IUCN-
WCMC Rep. 13807, World Conservation Monitoring Centre,
Cambridge, United Kingdom, 312 pp.
Bhardwaj, A., V. Misra, A. Mishra, A. Wootten, R. Boyles, J. H.
Bowden, and A. J. Terando, 2018: Downscaling future climate
change projections over Puerto Rico using a non-hydrostatic
atmospheric model. Climatic Change, 147, 133–147, https://
doi.org/10.1007/s10584-017-2130-x.
Cao, G., T. W. Giambelluca, D. E. Stevens, and T. A. Schroeder,
2007: Inversion variability in the Hawaiian trade wind regime.
J. Climate, 20, 1145–1160, https://doi.org/10.1175/JCLI4033.1.
Carter, M. M., and J. B. Elsner, 1997: A statistical method for
forecasting rainfall over Puerto Rico. Wea. Forecasting,
12, 515–525, https://doi.org/10.1175/1520-0434(1997)012,0515:
ASMFFR.2.0.CO;2.
Donndelinger, G., and R. Tseng, 2018: A new convective index for
Africa. Eighth Conf. on Transition of Research to Operations,
Austin, TX, Amer. Meteor. Soc., 280, https://ams.confex.com/
ams/98Annual/webprogram/Paper328666.html.
Durre, I., R. S. Vose, and D. B. Wuertz, 2006: Overview of the
Integrated Global Radiosonde Archive. J. Climate, 19, 53–68,https://doi.org/10.1175/JCLI3594.1.
Foster, P., 2001: The potential negative impacts of global climate
change on tropical montane cloud forests. Earth Sci. Rev., 55,73–106, https://doi.org/10.1016/S0012-8252(01)00056-3.
Gálvez, J. M., and M. Davison, 2016: The Gálvez–Davison Index
for tropical convection. NOAA, 23 pp., http://www.wpc.ncep.
noaa.gov/international/gdi/GDI_Manuscript_V20161021.pdf.
Haklander, A. J., and A. Van Delden, 2003: Thunderstorm pre-
dictors and their forecast skill for the Netherlands.Atmos. Res.,
67–68, 273–299, https://doi.org/10.1016/S0169-8095(03)00056-5.
Hosannah, N., H. Parsiani, and J. Gonzalez, 2015: The role of aerosols
in convective processes during the midsummer drought in the
Caribbean. Adv. Meteor., 2015, 261239, https://doi.org/10.1155/
2015/261239.
——, and Coauthors, 2017: The Convection, Aerosol, and
Synoptic-Effects in the Tropics (CAST) Experiment: Building
an understanding of multiscale impacts on Caribbean weather
via field campaigns. Bull. Amer. Meteor. Soc., 98, 1593–1600,https://doi.org/10.1175/BAMS-D-16-0192.1.
James, R. P., and P. M. Markowski, 2010: A numerical investigation
of the effects of dry air aloft on deep convection. Mon. Wea.
Rev., 138, 140–161, https://doi.org/10.1175/2009MWR3018.1.
Johns, R. H., and C. A. Doswell, 1992: Severe local storms fore-
casting. Wea. Forecasting, 7, 588–612, https://doi.org/10.1175/
1520-0434(1992)007,0588:SLSF.2.0.CO;2.
Jury, M. R., 2012: Representation of the Caribbean mean diurnal cycle
inobservation, reanalysis, andCMIP3model datasets.Theor.Appl.
Climatol., 107, 313–324, https://doi.org/10.1007/s00704-011-0462-4.
Karmalkar, A. V., M. A. Taylor, J. Campbell, T. Stephenson,
M. New, A. Centella, A. Benzanilla, and J. Charlery, 2013:
A review of observed and projected changes in climate for
the islands in the Caribbean.Atmósfera, 26, 283–309, https://doi.org/10.1016/S0187-6236(13)71076-2.
Miller, P. W., and T. L. Mote, 2018: Characterizing severe wea-
ther potential in synoptically weakly forced thunderstorm
environments. Nat. Hazards Earth Syst. Sci., 18, 1261–1277,
https://doi.org/10.5194/nhess-18-1261-2018.
Mote, T. L., C. A. Ramseyer, and P. W. Miller, 2017: The Saharan
air layer as an early rainfall season suppressant in the Eastern
Caribbean: The 2015 Puerto Rico drought. J. Geophys. Res. At-
mos., 122, 10 966–10 982, https://doi.org/10.1002/2017JD026911.
Nesbitt, S. W., R. Cifelli, and S. A. Rutledge, 2006: Storm mor-
phology and rainfall characteristics of TRMM precipitation
features.Mon.Wea. Rev., 134, 2702–2721, https://doi.org/10.1175/
MWR3200.1.
O’Connell, C. S., L. Ruan, and W. L. Silver, 2018: Drought drives
rapid shifts in tropical rainforest soil biogeochemistry and
greenhouse gas emissions. Nat. Commun., 9, 1348, https://
doi.org/10.1038/s41467-018-03352-3.
OFCM, 2017: WSR-88D meteorological observations. Part C:
WSR-88D products and algorithms. OFCM Federal Me-
teorological Handbook FCM-H11C-2017, 394 pp., https://
www.ofcm.gov/publications/fmh/FMH11/fmh11partC.pdf.
Ramseyer, C. A., and T. L. Mote, 2018: Analysing regional climate
forcing on historical precipitation variability in Northeast
Puerto Rico. Int. J. Climatol., 38, e224–e236, https://doi.org/
10.1002/joc.5364.
Rhiney, K., 2015: Geographies of Caribbean vulnerability in a
changing climate: Issues and trends. Geogr. Compass, 9,
97–114, https://doi.org/10.1111/gec3.12199.
Saha, S., andCoauthors, 2014: TheNCEPClimate Forecast System
version 2. J. Climate, 27, 2185–2208, https://doi.org/10.1175/
JCLI-D-12-00823.1.
Scholl, M. A., and S. F. Murphy, 2014: Precipitation isotopes link
regional climate patterns to water supply in a tropical moun-
tain forest, eastern Puerto Rico.Water Resour. Res., 50, 4305–
4322, https://doi.org/10.1002/2013WR014413.
——, J. B. Shanley, J. P. Zegarra, and T. B. Coplen, 2009:
The stable isotope amount effect: New insights from
NEXRAD echo tops, Luquillo Mountains, Puerto Rico.
Water Resour. Res., 45, W12407, https://doi.org/10.1029/
2008WR007515.
Thornton, P. E., S.W.Running, andM.A.White, 1997:Generating
surfaces of daily meteorological variables over large regions of
complex terrain. J. Hydrol., 190, 214–251, https://doi.org/
10.1016/S0022-1694(96)03128-9.
——, M. M. Thornton, B. W. Mayer, Y. Wei, R. Devarakonda, R. S.
Vose, and R. B. Cook, 2017: Daymet: Daily surface weather data
on a 1-km grid forNorthAmerica, version 3.O.DAAC, accessed
7 March 2018, https://doi.org/10.3334/ORNLDAAC/1328.
VanBeusekom,A. E., G.González, andM.M.Rivera, 2015: Short-
term precipitation and temperature trends along an elevation
gradient in northeastern Puerto Rico. Earth Interact., 19,
https://doi.org/10.1175/EI-D-14-0023.1.
——,W. A. Gould, A. J. Terando, and J. A. Collazo, 2016: Climate
change and water resources in a tropical island system: Prop-
agation of uncertainty from statistically downscaled climate
models to hydrologic models. Int. J. Climatol., 36, 3370–3383,
https://doi.org/10.1002/joc.4560.
Wissmeier, U., and R. Goler, 2009: A comparison of tropical
and midlatitude thunderstorm evolution in response to wind
shear. J. Atmos. Sci., 66, 2385–2401, https://doi.org/10.1175/
2009JAS2963.1.
288 WEATHER AND FORECAST ING VOLUME 34