Page 1
[Chattopadhyay et. al., Vol.7 (Iss.1): January 2019] ISSN- 2350-0530(O), ISSN- 2394-3629(P)
DOI: 10.5281/zenodo.2555291
Http://www.granthaalayah.com ©International Journal of Research - GRANTHAALAYAH [276]
Management
AN EMPIRICAL STUDY ON AWARENESS AND CONSUMPTION
PATTERN OF ORGANIC FOOD IN BENGALURU CITY, THE IT
CAPITAL OF INDIA: AN ANALYSIS WITH RESPECT TO DIFFERENT
DEMOGRAPHIC FACTORS AND AVAILABILITY OF ORGANIC FOOD
PRODUCTS IN BENGALURU
Anwesha Chattopadhyay *1, Priyanka Khanzode *2 *1 Ph.D., Research Scholar, Department of Statistics, University of Calcutta, India
*2 Ph.D., Research Scholar, Department of Commerce and Management, ISBR B School,
University of Mysore, India
Abstract
Last 5 years have seen lots of changes in the consumption pattern of individuals with concerns
rising constantly on the quality of climate conditions, individuals have become aware about change
in climate, increasing pollution, deteriorating air quality, excessive use of chemicals in the farms,
increase of carbon particles in environment and impact on population. Consumers now-a-days are
very particular about the products they are consuming, Thus the concept of organic food product
come into picture. This concept is gaining impetus in society especially after increase in health
problems in individuals. It refers to using such food product which are eco-friendly and safe. The
paper is a humble attempt to understand the level of awareness about organic food products in
Bengaluru. This paper also aims at understanding the consumption pattern of individuals in
Bengaluru. Statistical tools like ANOVA, Regression analysis, Chi-square tests and different
charts are used to analyse the data obtained from a primary survey conducted in Bengaluru. On
the basis of analysis done in the paper, it is concluded that the consumption has increased lately
although more awareness should be created to make the consumption more popular among
consumers.
Keywords: Fertilizers; Green Revolution; Organic Farming; Organic Food Products; Pesticides.
Cite This Article: Anwesha Chattopadhyay, and Priyanka Khanzode. (2019). “AN EMPIRICAL
STUDY ON AWARENESS AND CONSUMPTION PATTERN OF ORGANIC FOOD IN
BENGALURU CITY, THE IT CAPITAL OF INDIA: AN ANALYSIS WITH RESPECT TO
DIFFERENT DEMOGRAPHIC FACTORS AND AVAILABILITY OF ORGANIC FOOD
PRODUCTS IN BENGALURU.” International Journal of Research - Granthaalayah, 7(1), 276-
296. https://doi.org/10.5281/zenodo.2555291.
Page 2
[Chattopadhyay et. al., Vol.7 (Iss.1): January 2019] ISSN- 2350-0530(O), ISSN- 2394-3629(P)
DOI: 10.5281/zenodo.2555291
Http://www.granthaalayah.com ©International Journal of Research - GRANTHAALAYAH [277]
1. Introduction
Organic products are earning lot of impetus in this world now-a-days. Organic products are mainly
organic food, or products of cultivation that avoid the artificial and harmful agriculture enhancers
like fertilizers or pesticides, insecticides etc. Organic farming has been a traditional way of farming
in India. Those traditional ways once made India one of the most prosperous countries in the world.
All the fertilizers and pesticides were made from plant and animal products which were absolutely
non-toxic. But unfortunately, during 1950’s and 1960’s the combined effect of increasing
population and several natural calamities led to scarcity of food and in order to fulfil that ever-
growing needs of human beings, Green Revolution gained importance and took birth after 1963.
As a result, government was forced to import food grains from foreign countries and drastically
increase the food production in India. It has led to massive use of chemicals in the field to enhance
productivity of crops as well as variety of crops in the market. In this regard there has being total
ignorance towards use of natural manures to be used on field. Chemical ones replaced organic and
natural fertilizers and pesticides. Hybrid seeds were introduced. Large amount of fields were
brought under cultivation. As a result more fertilizers were required; factories were set up to fulfil
this requirement. Hence land lost its fertility. As days passed by, pesticides became immune to the
chemical pesticides, so there was a need of manufacturing stronger pesticides that were hazardous
to human health. Green Revolution was a success in terms of gaining food security but it failed to
attain nutritional sustainability.
The excess use of artificial fertilizers, chemical pesticides, food additives etc. has brought immense
loss to human health in India. This is one of the main concerns right now. So, both consumers and
farmers are noticed to shift back to organic farming. More people are moving towards use of
organic products in their day-to-day life. Now a days we can find a range of organic products in
the market like food and beverages, cosmetics, dairy products, electronics, automobiles, FMCG
etc. Range and proximity to range of organic products in every field is increasing and have paved
a way for organic market.
Organic Farming
Sustainable agriculture and organic farming go hand in hand. They both aim towards a healthy
atmosphere for crops to yield. At the same time, it helps to keep health of soil in check. Sustainable
agriculture can also be considered as a part of organic farming. Organic agriculture is “A unique
production management system which promotes and enhances agro ecosystem, health, including
biodiversity, biological cycles and soil biological activity, which is accompanied by using on farm
agronomic, biological and mechanical methods in exclusion of all synthetic off-farm inputs” as
per FAO. It has become very necessary now a days not only to improve public health condition,
but also to reduce the loss incurred due to environmental pollution. It helps to restore food quality
and food safety and also reduces agricultural costs. No wonder why the ancestors had led a healthy
and blissful life.
According to Agricultural and Processed Food Products Export Development Authority
(APEDA), India produced around 1.70 million MT (2017-18) of certified organic products which
includes all varieties of food products namely Oil Seeds, Sugar cane, Cereals & Millets, Cotton,
Pulses, Medicinal Plants, Tea, Fruits, Spices, Dry Fruits, Vegetables, Coffee etc. The production
is not limited to the edible sector but also produces organic cotton fiber, functional food products
etc.
Page 3
[Chattopadhyay et. al., Vol.7 (Iss.1): January 2019] ISSN- 2350-0530(O), ISSN- 2394-3629(P)
DOI: 10.5281/zenodo.2555291
Http://www.granthaalayah.com ©International Journal of Research - GRANTHAALAYAH [278]
Among different states Madhya Pradesh is the largest producer followed by Maharashtra,
Karnataka, Uttar Pradesh and Rajasthan. In terms of commodities Oil seeds are the single largest
category followed by Sugar crops, Cereals and Millets, Fiber crops, Pulses, Medicinal, Herbal and
Aromatic plants and Spices and Condiments.
The total volume of export during 2017-18 was 4.58 lakh MT. The organic food export realization
was around INR 3453.48 crore (515.44 million USD). Organic products are exported to USA,
European Union, Canada, Switzerland, Australia, Israel, South Korea, Vietnam, New Zealand,
Japan etc.
In terms of export value realization Oilseeds (47.6%) lead among the products followed by Cereals
and millets (10.4%), Plantation crop products such as Tea and Coffee (8.96%), Dry fruits (8.88%),
Spices and condiments (7.76%) and others.
Benefits of Organic farming:
• Helps to regulate Pollution: Pesticides, or other substances used to enhance farming
capabilities often constitutes the run off from farms and join drinking water sources causing
various environmental issues such as Bio magnification, Eutrophication etc. Since organic
farming removes these factors from the quotient of agriculture, they also come with a guilt
free conscience.
• Better health of individuals: When these pesticides or fertilizers enter water bodies, they
often start accumulating in fishes, plants etc. When you consume these fishes, the
accumulated toxins are released into ythe body bringing disastrous effects such as lead
poisoning, Minamata Bay Disease etc. So we see indulging in organic farming can secure
a better ticket to health.
• Less exposure to artificial medication: Livestock Rearing comes with injection of
antibiotics to lengthen the lifespan of the animals and increase productivity. Organic
farming does not involve this procedure; hence, we are safe from these kinds of antibiotics,
which otherwise we would be exposed to from consuming meat, eggs or milk.
• Better Taste: Organic food almost always taste better due to their organic and
environment-friendly way of practicing cultivation. Less use of preservatives and
fertilizers go a long way in restoring the natural taste of these food products.
• Availability of Fresh Products: Say goodbye to cold storage food products, by embracing
Organic Food. They do not include preservatives and hence are almost always sold fresh.
This is why farmer’s markets are such a popular phenomenon in different parts of the world
like US, Japan etc.
• Reduction in agricultural cost: Organic farming paves the way to use of locally made
pesticides as they are much cheaper than the factory-made pesticides which require
expensive chemicals. In addition, the fertilizers made in organic manner are much cheaper
than the synthetic ones. This can reduce the cost of farming and bring relief to the farmers.
Ways to Do Organic Farming
There are various ways of organic farming for production of organic food products such
as compost, manure, green manure, and bone meal and places emphasis on techniques such
as crop rotation and companion planting. Biological pest control, mixed cropping and the fostering
of insect predators are enctheaged. In general, organic standards are designed to allow the use of
Page 4
[Chattopadhyay et. al., Vol.7 (Iss.1): January 2019] ISSN- 2350-0530(O), ISSN- 2394-3629(P)
DOI: 10.5281/zenodo.2555291
Http://www.granthaalayah.com ©International Journal of Research - GRANTHAALAYAH [279]
naturally occurring substances while prohibiting or strictly limiting synthetic substances.
Agnihotra Farming is also a part of Organic Farming. Few examples of organic product attained
after applying Agnihotra farming are pulses, lentils, Chana daal, masoor daal, grapes, various
vegetables like cauliflower, groundnuts, turmeric, wheat, tomato, cucumber, garlic, ginger etc. and
positive results had been attained.
Organic Market in India
There are various Companies producing organic products in India. They are Organic Mandya,
Mother earth, Madhav ashram trust, Art of Living, Farm 2 Kitchen, Big Basket, Pro-nature
organic, Originnel Organic Food, Nature’s hub, Nisraga Organic, ISKCON Organic Outlet,
Karnataka Organic Farming centre and others.
2. Literature Review
Priya Soni, a noted researcher has stated in her research paper that, there is a positive attitude
towards of customers towards buying organic food in India and is linked to believing that it is
healthier, tastes better, and is better for the environment. K. Sundaresh & Dr. S. Babu have given
opinion that it is incidental that socio- economic variables are associated with consumer positive
attitude towards organic foods. Family, self-decision and friends play a vital role in the purchase
decision-making process of organic foods. The factors eco-friendly and chemical or pesticides free
factor have a great impact on the decision-making process. According to K. Renugadevi & Dr.
M. Ramya Organic food product is been accepted as a nutritional food and helps to keep human
healthy in spite of busy work schedule, stress and pollution. The short supply and premium price
of organic products may disturb the growth of consumption rate. According to S. Suganya and
Dr. S. Saravinth in their research concluded that it is evident that people’s awareness towards
organic products has increased considerably and they are willing to purchase the organic products
if it is affordable and available. According to Brijesh Sivathanu. Consumers consider health as
an important parameter and then they buy the product, also there are various factors impacting the
preference including demographic characteristics of the consumers. As per study of Konda
Kalyani “The system of organic agriculture, especially the system of organic food production,
becomes more and more important factor of national and international economic system
development. The importance of organic food marketing is conditioned by the fact that it enables
producers for better understanding of customers' needs serving the purpose of better meeting their
needs and it also enables consumers to realize better organic products supply. Today’s society very
excitedly welcomes these concepts and people are in a path to change their lifestyle, food habit.
Still it is pity to know that where one group of people rushing up to change their whole lifestyle to
organic there we can note that there is no pint-sized sift in their food habit for the other group.
People still lack basic knowledge about organic food, clothing and so on. But High pricing for
some organic product is out of reach of common man. Least variety creates dissatisfaction among
the customer. Last but not the least is the lack of awareness of the organic products. So, it is prime
time to buzz the alarm and make everyone alert about the upcoming danger of health issues and
walk forward to create a healthy tomorrow for one & all. According to Sathyendra Kumar AD,
Dr. H. M. Chandrashekar consumer behavithe plays the major role while buying not only
organic product any product. So, the organic food shops and product supply is limited but demand
for it, is more. So, the farmers and also the government are thinking to improve or increase
production of organic product as well as good packaging, quality and market system. It helps to
Page 5
[Chattopadhyay et. al., Vol.7 (Iss.1): January 2019] ISSN- 2350-0530(O), ISSN- 2394-3629(P)
DOI: 10.5281/zenodo.2555291
Http://www.granthaalayah.com ©International Journal of Research - GRANTHAALAYAH [280]
improve the standard of living farmer and all it healthy to environment and all so it helps to
government. The marketers of organic foods need to be innovative and dynamic in order to
complete with the changing purchase behavithe in the Organic food products market among urban
residents. Vishal Kumar Laheri, Purushottam Kumar Arya has stated that, the results of the
survey suggested that there is a need for organizing many awareness programs by the government,
marketers, and environmental agencies to educate consumers for using eco-friendly products,
which are good for their health and at the same time safe for the environment. As per the results
of the survey, the price and availability of the organic products are the prime barriers towards its
purchase, so the marketers need to focus on such barriers for penetrating the market of organic
products in India. Barriers of purchasing organic food products provided by the present study will
offer guidelines to the marketers for understanding the attitude and preferences of consumers
towards organic food products. According to Nayana Sharma and Dr. Ritu Singhvi their study
also revealed the availability of the market can influence consumer’s preferences and choices for
purchasing organic food products. This paper thus provides vital information that there will be
more demand of the organically grown food products in coming future, so it’s high time for
producer, traders, consumer and government itself to focus over the niche market of organic. Singh
et al. studied organic cotton farming which helped in garment manufacture in Madhya Pradesh.
According to his reports, 80% farmers shifted to organic farming due land quality improvement
and at least 36% due to assured market. Sharma explained the factors determining consumer’s
acceptance and preference for food in general. Many factors combine and interact to make buying
a complex process. Price was identified as an important factor; however it had some limitations on
the consumer’s choice. Factors like sensory attributes regional preference, age, sex, interest,
motivation, discrimination and income also influenced food consumption. Shukla et al. conducted
a survey to know the consumer response to green market opportunities. It was found that the
customers were appraising the organic products on safety to nature and human health and that their
brand awareness was generally low. Kubendran and Vanniarajan revealed that the change in
consumption pattern is due to the changes in food habits. If income and urbanization increases
among consumers the percentage of income spent on consumption increases. The urban consumers
prefer mostly branded products compared to rural consumers. The most significant factors
influencing buying decisions are accessibility, quality, regular supply, door delivery and the mode
of payment.
Objectives of the Research
• To study the awareness of organic food in the market among people of Bengaluru.
• To study briefly the consumption pattern of the consumers in Bengaluru.
• To give an idea about factors affecting consumption of organic food by the consumers in
Bengaluru.
3. Research Methodology
Data
Primary data had been collected from different locations of Bengaluru by means of structured
questionnaire. The sample size is 105. Convenient sampling has been conducted.
Page 6
[Chattopadhyay et. al., Vol.7 (Iss.1): January 2019] ISSN- 2350-0530(O), ISSN- 2394-3629(P)
DOI: 10.5281/zenodo.2555291
Http://www.granthaalayah.com ©International Journal of Research - GRANTHAALAYAH [281]
Bengaluru or Bangalore is capital of Karnataka, a southern state in India. It is located in Deccan
Plateau in southeastern Karnataka. It is the third largest city and fifth largest metropolitan city in
India.
Bengaluru is a metropolitan and cosmopolitan city that comprises of people from different
cultures, religions, castes, languages, occupations, income groups and different food preferences.
It is IT hub of India. It is called Silicon Valley of India. It has numerous educational and financial
institutes, also several organic food outlets along with potential buyers who can afford organic
food products. It has also been found that there is an increasing demand for organic food products
here.
Bengaluru is organic hub of India and has the highest sales of organic food product as well as the
largest number of organic outlets growing at the rate of 35-40% per year.
Statistical Tools Used
• Microsoft Excel for the graphs and charts
• R for statistical tests, charts and calculations
Statistical Techniques Used
• Chi-square test.
• Proportion test
• ANOVA
• Descriptive analysis
• Regression analysis
4. Analysis and Findings
When the percentage of awareness of organic food products was calculated from the data, it was
found to be very high. Almost 95% of the respondents had knowledge about organic food products
irrespective of all the demographic factors as well as other factors.
Analysis on Awareness and different demographic factors
Figure 1: Awareness of organic food
Yes95%
No5%
Awareness of Organic Food among respondents
Page 7
[Chattopadhyay et. al., Vol.7 (Iss.1): January 2019] ISSN- 2350-0530(O), ISSN- 2394-3629(P)
DOI: 10.5281/zenodo.2555291
Http://www.granthaalayah.com ©International Journal of Research - GRANTHAALAYAH [282]
Now the demographic factors like age, sex, number of family members, marital status and
educational qualification are considered. Since the data collection is done in Bangalore and there
are many people staying in Bangalore are from different states and cities of India for job purposes,
so another factor has been taken into consideration. That factor is defined as native and hence got
two outcomes viz. Bangalore and outside.
The first demographic factor is Age. The age-group is divided by an interval of 5 years and
observed that the number of respondents distributed throughout all the age-groups is not equal.
Figure 2: Age distribution
The interval 25-35 years has maximum number of respondents, while the number is lesser in the
edges. So the proportion of respondents aware about organic food in all the age groups is taken
into account. The age distribution has a bell-shaped curve and hence is normal. To be more sure a
normality test is done in software and get p-value = 0.053 > 0.05 and conclude that the age
distribution of the population from where the sample is drawn is normal.
Table 1: Proportion of people of different age-groups aware about organic food.
Age-
group
Aware about organic
food
Total no. of
respondents
Proportion of
awareness
20-24 12 13 0.923077
25-29 25 26 0.961538
30-34 37 39 0.948718
35-39 17 17 1
40-44 6 7 0.857143
45-49 2 2 1
>50 1 1 1
Total: 100 105 0.952381
Age distribution of the respondents
Age
No
. of r
esp
on
de
nts
0
5
10
15
20
25
30
20 25 30 35 40 45
Page 8
[Chattopadhyay et. al., Vol.7 (Iss.1): January 2019] ISSN- 2350-0530(O), ISSN- 2394-3629(P)
DOI: 10.5281/zenodo.2555291
Http://www.granthaalayah.com ©International Journal of Research - GRANTHAALAYAH [283]
Next, a proportion test is conducted to find out whether it can be suggested that the proportions of
knowledge of organic food products are equal in all age-groups. Thus, the null hypothesis is H1:
The proportions are equal against H1’: At least one proportion is not equal.
The p-value = 0.8448 > 0.05. Hence the null hypothesis is accepted and hence can be concluded
that the proportions in all the age groups are equal for the population from where the sample has
been drawn. In addition, it has been already found out that the age-distribution is normal.
Mean cannot be calculated here as there is open-end class. So the median is calculated as an
average and it is equal to 31.26 years. It means that the average age of respondents knowing about
organic food in 31.26 years.
Next demographic variable to be considered is Sex. In the sample the number of male and female
respondents are not equal.
Figure 3: Awareness of organic food sex-wise
The diagram reveals that number of female respondents in the data is much more than that of male
respondents. Hence a proportion test I done for the two groups. The null hypothesis is H2: The
proportions of respondents aware about organic food for both male and female are equal against
the alternative hypothesis H2’: The proportions are not equal.
The p-value is very high which is 0.9 > 0.05. Hence null hypothesis is accepted and concluded that
the proportions are equal for the population.
The Table 2 represents the number of aware respondents considered age-wise and sex-wise. Hence
a two-way table is obtained.
Table 2: Awareness of organic food according to age and sex together
Age- group Sex Female Male Total
20-24 7 5 12
25-29 21 4 25
30-34 18 19 37
0
10
20
30
40
50
60
70
80
Female Male
Awareness of organic food among Female and Male
Total number
Aware about organic food
Page 9
[Chattopadhyay et. al., Vol.7 (Iss.1): January 2019] ISSN- 2350-0530(O), ISSN- 2394-3629(P)
DOI: 10.5281/zenodo.2555291
Http://www.granthaalayah.com ©International Journal of Research - GRANTHAALAYAH [284]
35-39 11 6 17
40-44 4 2 6
45-49 2 0 2
>50 1 0 1
Total: 64 36 100
Figure 4: Age-sex distribution according to awareness of organic food
A two-way ANOVA test is conducted where the null hypothesis H3: The means in all age-groups
are equal and means for male and female are equal against the alternative hypothesis H3’: At least
one mean in the age groups are not equal and Means of female and male are not equal.
The ANOVA table thus obtained is Table 3:
Table 3: Two-way ANOVA table for age and sex
ANOVA
Sthece of Variation SS DF MS F P-value F critical
Rows 519.7143 6 86.61905 4.812169 0.038692 4.283866
Columns 56 1 56 3.111111 0.128213 5.987378
Error 108 6 18
Total 683.7143 13
P-value for rows i.e for age is 0.038692 < 0.05 which implies rejection of null hypothesis for the
age-groups. It can be said that at least one mean is not equal to the other means. On the other hand
p-value for columns i.e for sex is 0.128213 > 0.05. This suggests the acceptance of the null
hypothesis for sex. It can be concluded that the means for both male and female respondents are
equal. It means that sex has no effect on the awareness of organic food products but age has.
Next the marital status is taken as the next demographic variable. Two options are there, namely
married and single.
0
5
10
15
20
25
20-24 25-29 30-34 35-39 40-44 45-50 >50
Age-Sex distribution of respondents aware about
organic food
Female
Male
Page 10
[Chattopadhyay et. al., Vol.7 (Iss.1): January 2019] ISSN- 2350-0530(O), ISSN- 2394-3629(P)
DOI: 10.5281/zenodo.2555291
Http://www.granthaalayah.com ©International Journal of Research - GRANTHAALAYAH [285]
Figure 5: Awareness of organic food according to marital status
In the data number of married people is high in numbers, so the proportion test is performed for
the two groups. The null hypothesis is stated as H4: The proportions of respondents aware about
organic food for both married and single are equal against the alternative hypothesis H4’: The
proportions are not equal.
The p-value is very high which is 0.9 > 0.05. Hence null hypothesis is accepted and concluded that
the proportions are equal for the population.
Educational qualification is yet another key factor for awareness of organic food. Five levels are
mentioned here, namely Doctorate, PG, Graduation, Higher Secondary, Secondary but none of the
respondents had been recorded as Higher secondary. So finally, 4 levels are considered.
Figure 6: Awareness of organic food according to educational qualification
Maximum of the respondents are post-graduates. Hence the proportion test is performed. The null
hypothesis is stated as H5: The proportions of respondents aware about organic food for all levels
of education are equal against the alternative hypothesis H5’: The proportions are not equal.
The p-value is very high which is 0.4177 > 0.05. Hence null hypothesis is accepted and concluded
that the proportions are equal for the population.
78
27
74
26
Married
Single
Awareness of organic food among married and single
respondents
Aware about organic food Total
0
20
40
60
80
Doctorate PG Graduation Secondary
Awareness of organic food according to educational qualification
Total number
Aware about organic food
Page 11
[Chattopadhyay et. al., Vol.7 (Iss.1): January 2019] ISSN- 2350-0530(O), ISSN- 2394-3629(P)
DOI: 10.5281/zenodo.2555291
Http://www.granthaalayah.com ©International Journal of Research - GRANTHAALAYAH [286]
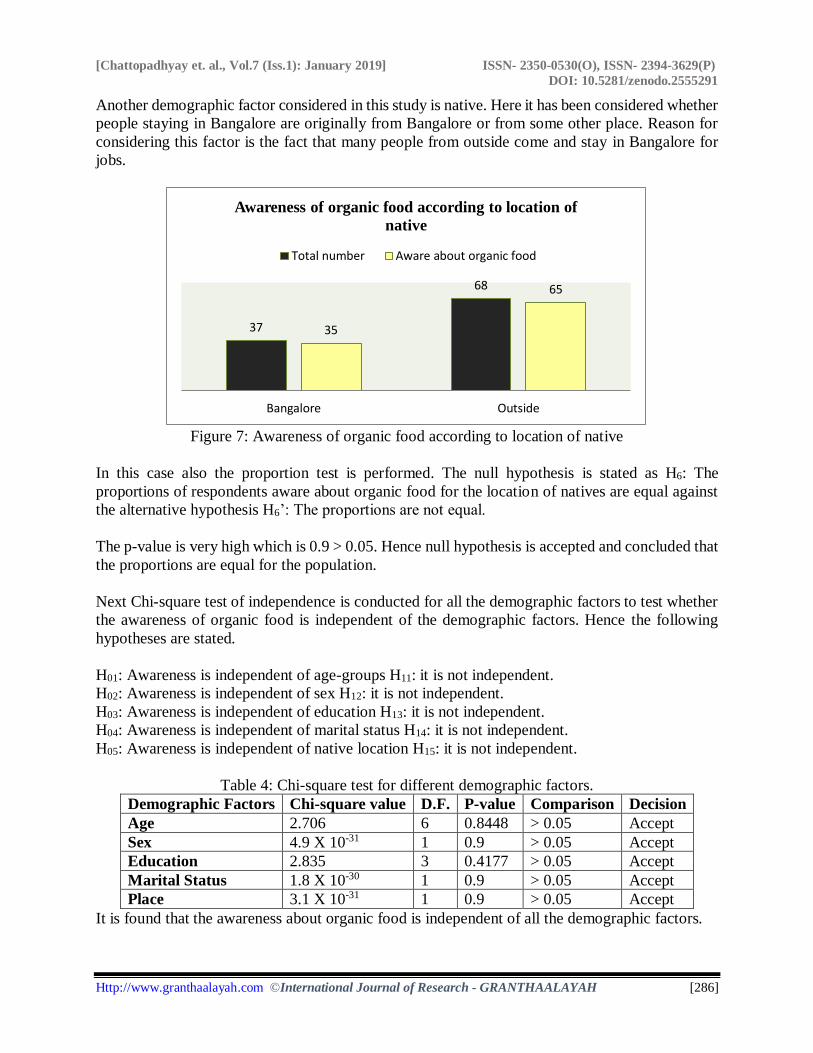
Another demographic factor considered in this study is native. Here it has been considered whether
people staying in Bangalore are originally from Bangalore or from some other place. Reason for
considering this factor is the fact that many people from outside come and stay in Bangalore for
jobs.
Figure 7: Awareness of organic food according to location of native
In this case also the proportion test is performed. The null hypothesis is stated as H6: The
proportions of respondents aware about organic food for the location of natives are equal against
the alternative hypothesis H6’: The proportions are not equal.
The p-value is very high which is 0.9 > 0.05. Hence null hypothesis is accepted and concluded that
the proportions are equal for the population.
Next Chi-square test of independence is conducted for all the demographic factors to test whether
the awareness of organic food is independent of the demographic factors. Hence the following
hypotheses are stated.
H01: Awareness is independent of age-groups H11: it is not independent.
H02: Awareness is independent of sex H12: it is not independent.
H03: Awareness is independent of education H13: it is not independent.
H04: Awareness is independent of marital status H14: it is not independent.
H05: Awareness is independent of native location H15: it is not independent.
Table 4: Chi-square test for different demographic factors.
Demographic Factors Chi-square value D.F. P-value Comparison Decision
Age 2.706 6 0.8448 > 0.05 Accept
Sex 4.9 X 10⁻³¹ 1 0.9 > 0.05 Accept
Education 2.835 3 0.4177 > 0.05 Accept
Marital Status 1.8 X 10⁻³⁰ 1 0.9 > 0.05 Accept
Place 3.1 X 10⁻³¹ 1 0.9 > 0.05 Accept
It is found that the awareness about organic food is independent of all the demographic factors.
37
68
35
65
Bangalore Outside
Awareness of organic food according to location of
native
Total number Aware about organic food
Page 12
[Chattopadhyay et. al., Vol.7 (Iss.1): January 2019] ISSN- 2350-0530(O), ISSN- 2394-3629(P)
DOI: 10.5281/zenodo.2555291
Http://www.granthaalayah.com ©International Journal of Research - GRANTHAALAYAH [287]
People were asked whether they are aware about advantages of organic food, 90% of respondents
gave positive response while only 10% said no.
Analysis on awareness of advantages of organic food
Figure 8: Awareness about advantage of organic food
Next respondents were asked about the advantages, maximum people said it is a great option of a
healthy lifestyle which is very important these days. Also people are aware that pesticides are not
used in such kind of food, so it is less harmful and toxic. Some people are also aware about the
sustainable development of the environment as organic farming reduces environmental pollution.
Figure 9: Advantages of organic food
Figure 10: Number of people having knowledge about organic food and prefering it
90%
10%
Knowledge about advantages of organic food
Yes
No
0 5 10 15 20 25 30 35 40 45
Helps in sustainable development of…
Natural manure or fertilizers used
No pesticides used, thus preserving fertility…
Option of healthy lifestyle
Preserves the quality of soil
Advantages of Organic Food
Advantages of Organic Food
0
20
40
60
80
100
Yes No
Prefer Organic Food
Knows advantage of Organicfood
Page 13
[Chattopadhyay et. al., Vol.7 (Iss.1): January 2019] ISSN- 2350-0530(O), ISSN- 2394-3629(P)
DOI: 10.5281/zenodo.2555291
Http://www.granthaalayah.com ©International Journal of Research - GRANTHAALAYAH [288]
A peculiar pattern is observed when the data regarding number of people having knowledge about
organic food and prefering it has been plotted. It can be assumed that those who have knowledge
of advantage of organic food will prefer to consume it and those who do not have any knowledge
will not prefer. But in this case it was found that only 70.5% of respondents having knowledge,
prefer organic food. A chi-square test of independence is performed between these two factors.
The hypothesis is stated as H06: Knowledge about advantage of organic food and preferance are
independent against the alternative hypothesis H16: They are not independent. The p-value < 0.05
suggests that having knowledge and prefering organic food are not independent of each other.
All previous discussions revolved around the awareness of organic food among the respondents,
also about its advantage and its relation to the choice of food. Next the important point to discuss
is about the consumption and factors affecting consumption of organic food among the consumers.
Analysis on consumption pattern of consumers in accordance to their income and availability
of organic food
Figure 11: Consumption of organic and non-organic food
According to the data, only 11% of the respondents solely consume non-organic food. 17% people
consume only organic food products which is low, while 72% people consume both organic and
non-organic food. So it is very clear that maximum people do not depend solely on organic food
on daily basis.
Figure 12: Histogram showing percentage of total spending on food spent on organic food
11%
17%
72%
Pie-chart showing percentage of consumption of
organic and non-organic food
Non-organic Food
Organic Food
Organic and non-organicboth
Page 14
[Chattopadhyay et. al., Vol.7 (Iss.1): January 2019] ISSN- 2350-0530(O), ISSN- 2394-3629(P)
DOI: 10.5281/zenodo.2555291
Http://www.granthaalayah.com ©International Journal of Research - GRANTHAALAYAH [289]
In figure 12, x-axis denotes the percentage of total spending on food spent on organic food and y
denotes the number of respondents falling in each group. It is observed that maximum number of
respondents spend 0-10% of their total spending on food in buying organic food products while
second highest number of people spend 90-100%. The mean is calculated which is equal to
27.42%, that means people spend average of 27.42% of their total spending on food in consuming
organic food products every month. This figure is very low. The standard deviation is equal to
27.2%. This high value of S.D. suggests that although the mean is less, the variation of the
percentage is not less.
Figure 13: Income distribution of the data
Figure 13 shows that in the data, maximum number of respondents belong to the last group i.e. 8
lakhs and above. The consumption pattern of the consumers depending on the income groups is
testes in Figure 14.
Figure 14: Preferance of organic food in different income groups
Since the income distribution is not unifrormly distributed, chi-square test of independence is
performed stating the null hypothesis H07: Preferance of organic food is independent of the income
groups against the alternative hypothesis H17: They are not independent. The p-value = 0.3055 >
0.05 concludes that the preferance is independent of the income levels.
0
20
40
60
80
2 lakhs- 4 lakhs 4 lakhs - 6 lakhs 6 lakhs - 8 lakhs 8 lakhs and above
Income distribution
Series1
0
10
20
30
40
50
2 lakhs- 4 lakhs 4 lakhs - 6 lakhs 6 lakhs - 8 lakhs 8 lakhs and above
Preferance of organic food in different income groups
Yes
No
Page 15
[Chattopadhyay et. al., Vol.7 (Iss.1): January 2019] ISSN- 2350-0530(O), ISSN- 2394-3629(P)
DOI: 10.5281/zenodo.2555291
Http://www.granthaalayah.com ©International Journal of Research - GRANTHAALAYAH [290]
Figure 15: Consumption of organic and inorganic food for different income groups
A chi-square test of independence is done stating the null hypothesis H08: consumption of different
types of food is independent of the income groups against the alternative hypothesis H18: They are
not independent. The p-value = 0.0777 > 0.05 concludes that the consumption is independent of
the income levels.
A two-way ANOVA test is conducted where the null hypothesis H09: The means in all income-
groups are equal and means for all types of food are equal against the alternative hypothesis H19:
At least one mean in the income-groups are not equal and means of all types of food consumption
are not equal.
The ANOVA table is represented as Table 5:
Table 5: Two-way ANOVA table for income and consumption
ANOVA
Sthece of
Variation
SS df MS F P-value F critical
Rows 710.9167 3 236.9722 2.305053 0.176642 4.757063
Columns 604.5 2 302.25 2.940016 0.128825 5.143253
Error 616.8333 6 102.8056
Total 1932.25 11
P-value for rows i.e for income is 0.176652 > 0.05 which implies that null hypothesis is accepted
for the income-groups. It can be said that means are equal for all income groups. On the other hand
p-value for columns i.e for consumption is 0.128825 > 0.05. This suggests null hypothesis is
accepted for consumption. It can be concluded that the means for different types of consumption
are equal. It means both income and consumption are insignificant for each other.
0
10
20
30
40
50
60
2 lakhs- 4lakhs
4 lakhs - 6lakhs
6 lakhs - 8lakhs
8 lakhs andabove
Consumption of food for different income groups
Non-organic Food
Organic and non-organic both
Organic Food
Page 16
[Chattopadhyay et. al., Vol.7 (Iss.1): January 2019] ISSN- 2350-0530(O), ISSN- 2394-3629(P)
DOI: 10.5281/zenodo.2555291
Http://www.granthaalayah.com ©International Journal of Research - GRANTHAALAYAH [291]
Figure 16: Availability in different stheces and preference of organic food
Table 6: Relation between availability and preference of organic food
Places of availability Availability in
vicinity
Prefer
organic food
Proportion preferring
organic food
In the area in local market 13 12 0.923
In the area in super
markets
49 29 0.591
Online shops like
Bigbasket, Grofers etc
40 24 0.6
Organic food store 1 1 1
Don't know 2 1 0.5
A chi-square test of independence is conducted with the null hypothesis H010: Availability and
preference are independent against alternative hypothesis H110: They are not independent. The p-
value = 0.0198 < 0.05 suggests the rejection of null hypothesis and establishes that availability and
preference are not independent.
Let us define x = Availability of organic food and y = Preference of organic food. Te scatter
diagram of x and y is plotted in graph and then try to fit a linear regression.
Figure 17: Regression of preference on availability
0
10
20
30
40
50
60
In your areain localmarket
In your areain supermarkets
Online shopslike Bigbasket,
Grofers etc
Organic foodstore
Don't know
Availability
Prefer organic food
y = 0.5751x + 1.3223R² = 0.9796
0
5
10
15
20
25
30
35
0 10 20 30 40 50 60
Scatter Diagram and Trend
Page 17
[Chattopadhyay et. al., Vol.7 (Iss.1): January 2019] ISSN- 2350-0530(O), ISSN- 2394-3629(P)
DOI: 10.5281/zenodo.2555291
Http://www.granthaalayah.com ©International Journal of Research - GRANTHAALAYAH [292]
The correlation between availability and preference is 0.9897, which is very high. In addition, the
scatter plot exhibited a positive linear trend. Hence linear regression is fitted and the equation of
the fitted line is y = 0.5451x + 1.3223. R2 = 0.9796 which suggests that the fit is good. Also, p-
value = 0.00124 < 0.05 suggests that the regression coefficient is significant.
Few reasons for which people consume organic food are mentioned in Figure 18. Most of the
people prefer because of its benefits brought to health conditions.
Reasons for consuming and not consuming organic food:
Figure 18: Reasons for consuming organic food
Figure 19: No. of people having organic food for different years
People started to have organic food for about 25 years but most of the people has started very
recently in 0-5 years.
Reasons for not consuming organic food are mentioned in figure 20. Most of the people believe
that it cannot be consumed on daily basis as it is costly.
0 10 20 30 40 50 60 70
Preferable for health
Safe for kids
Safer for soil quality and environment
Reasons for consuming organic food
Page 18
[Chattopadhyay et. al., Vol.7 (Iss.1): January 2019] ISSN- 2350-0530(O), ISSN- 2394-3629(P)
DOI: 10.5281/zenodo.2555291
Http://www.granthaalayah.com ©International Journal of Research - GRANTHAALAYAH [293]
Figure 20: Reasons for not consuming organic food
Since the most popular reason for not consuming organic food is that it is expensive, so the annual
income of those people who had claimed like that were brought under observation and hence the
following results.
Figure 21: Income of those who avoid organic food for its cost
It was found that 3% belonged to the lowest income group considered in the survey while 67%
belonged to the highest income group. Evidently cost is not the actual reason for people belonging
to high income group to avoid consumption of organic food. The reason is something else which
is either not stated by them or they simply ignore the goodness of organic food to save money.
Whatever be the reason, this outcome is unfortunate.
5. Limitations of the Study
• Data on all age-group are not uniformly distributed.
• Data on all occupation are not uniformly distributed.
• Data on all marital status are not uniformly distributed.
• Data on all educational qualification are not uniformly distributed.
• Data on all sex are not uniformly distributed.
• The sample size is small.
0 5 10 15 20 25 30 35
Difficulty in practice
Its costly
Not available easily
Not possible to continue in a long run
Reasons of not consuming organic food
3%
21%
9%67%
Income of respondents who said organic food is costly
2 lakhs- 4 lakhs
4 lakhs - 6 lakhs
6 lakhs - 8 lakhs
8 lakhs and above
Page 19
[Chattopadhyay et. al., Vol.7 (Iss.1): January 2019] ISSN- 2350-0530(O), ISSN- 2394-3629(P)
DOI: 10.5281/zenodo.2555291
Http://www.granthaalayah.com ©International Journal of Research - GRANTHAALAYAH [294]
6. Conclusion
From the above data interpreted it is evident that the consumption of organic food has raised in
last five years, but it should have raised more than what has actually happened. People are well
aware of organic food and the benefits driven from it. Consumption of such products will reduce
health hazards giving a blissful life. In fact, consumers, irrespective of all age-groups, income and
educational qualification have enough knowledge regarding this. But a good number of people are
found to ignore this fact and avoid consuming them (organic products). Most of these people have
given excuse of such products for being expensive although they themselves belong to high
income-group. Consumption also depends on the availability of such products in nearby places.
Since life in Bengaluru is very busy, many people do not get ample time to look for organic
products if they are not easily available, although there is already a solution to this. Such products
can easily be found in the online grocery apps. There are also many people who have included
organic food in their diet but have not given up non-organic products either. They prefer both kind
of food. According to the survey, such people spend 27% of their budget on food on an average
for organic food and rest on non-organic. Only 17% of all consumers were found to depend on
organic food products totally. In fact, very few people are found to be dependent on such products
for more than 10 years.
Advertisements and promotional programs should be conducted to create more awareness about
the positive effects of using organic products and consumers should be deliberately disctheaged to
consume non-organic food items. Commercial advertisements should be made showing health
hazards occurring or may occur due to the harmful manure and chemicals (pesticides, fertilizers,
weedicides etc) used for mass production of vegetables and fruits, just in the way outcomes of
tobacco are being shown to people in movie theatres. This can be an effective way to motivate the
rich and educated part of the society. The products should be made more available to people both
easily and economically. If people compare and find that price of non-organic vegetables cheaper
than organic ones, automatically they will have developed tendency to move towards non-organic
even knowing its bad effects. This is the place where government can play an effective role by
reducing the price of organic food. Government can take various measures to promote production,
consumption and advertisement of organic products.
References
[1] Abhang P., Patil M. and Moghe P. (2015). “BENEFICIAL EFFECTS OF AGNIHOTRA ON
ENVIRONMENT AND AGRICULTURE”, (Book) 5(2).
[2] Basha MB., Shamsudin MF. (2017). “WHAT DRIVES UAE BUYERS TOWARDS ORGANIC
FOOD PRODUCT? AN EXPERIMENTAL STUDY”, Arabian Journal of Business and Management review, 7(3), 312. https://www.omicsonline.org/open-access/what-drives-uae-
buyers-towards-organic-food-product-an-experimental-study-94914.html
[3] Brijesh Sivathanu. (2015). “FACTORS AFFECTING CONSUMER PREFERENCE TOWARDS THE ORGANIC FOOD PURCHASES”, Indian Journal of Science and Technology, Vol 8(33), 1-
6.
[4] Dr. Akankshya Patnaik. (2018). “CONSUMERS PERCEPTION TOWARDS ORGANIC FOOD:
A STUDY”, JETIR, 5(6), 309-313. http://www.jetir.org/papers/JETIRC006054.pdf. [5] Dr. H.M. Chandrashekhar. (2014). “CONSUMERS PERCEPTION TOWARDS ORGANIC
PRODUCTS-MYSORE CITY”, International Journal of Research in Business Studies and
Management, 1(1), 52-67. https://www.ijrbsm.org/pdf/v1-i1/7.pdf.
Page 20
[Chattopadhyay et. al., Vol.7 (Iss.1): January 2019] ISSN- 2350-0530(O), ISSN- 2394-3629(P)
DOI: 10.5281/zenodo.2555291
Http://www.granthaalayah.com ©International Journal of Research - GRANTHAALAYAH [295]
[6] Gauthami H.S. (2008.) “MARKET RESEARCH ON ORGANIC AGRICULTURAL PRODUCE IN BANGALORE CITY”, Department of Food and Nutrition, University of Agricultural
Science,1-95. http://krishikosh.egranth.ac.in/bitstream/1/5810021650/1/Th-9218.pdf.
[7] Jagannath D. (2008). “PROSPECTS OF ORGANIC FARMING IN INDIA”, Journal of Global
Communication, 1(2), 181-193. [8] K. Renugadevi, Dr. M. Ramya. (2017), “A STUDY ON CONSUMERS ATTITUDE TOWARDS
ORGANIC PRODUCTS WITH SPECIAL REFERENCE TO SALEM CITY”, International
Journal of Interdisciplinary Research in Arts and Humanities (IJIRAH), 2(2), 160-162. [9] K. Sundaresh, Dr. S. Babu. (2017), “COIMBATORE COLLEGE STUDENTS’S PERCEPTION
AND BUYING INTENETION TOWARDS ORGANIC FOOD PRODUCTS”, Imperial Journal of
Interdisciplinary Research (IJIR), 3(7), 472-475. https://www.onlinejournal.in/IJIRV3I7/076.pdf [10] Konda Kalyani. (2017). “CONSUMER PERCEPTION TOWARDS ORGANIC FOOD
PRODUCTS IN INDIA”, IJIRT, 4(7), 1-5. http://ijirt.org/Article?manuscript=145018.
[11] M.Shireehsa, Prof.V.Chandra Sekhar Rao. (2018). “A STUDY ON URBAN CONSUMER
PERCEPTION TOWARDS ORGANIC FOOD PRODUCTS”, IOSR Journal of Business and Management (IOSR-JBM), 20(6) (III.), 18-23. http://www.iosrjournals.org/iosr-
jbm/papers/Vol20-issue6/Version-3/D2006031823.pdf.
[12] Mishra R. (2009). “SCIENTIFIC ROLE OF AGNIHOTRA IN ORGANIC FARMING”, 1st Edition, Shri Madhavswami Paryavaran Sanrakshan Samiti, 15-30.
[13] Mr.Pradeep Kumar, Dr.Hema Gulati. (2017). “CUSTOMER’S PERCEPTION TOWARDS
ORGANIC PRODUCTS IN RURAL AREA OF HARYANA”, International Journal of New Technology and Research (IJNTR), 3(5), 15-20.
https://www.ijntr.org/download_data/IJNTR03050074.pdf.
[14] Nayana Sharma, Dr. Ritu Singhvi. (2018). “CONSUMES PERCEPETION AND BEHAVITHE
TOWARDS ORGANIC FOOD: A SYSTEMATIC REVIEW OF LITERATURE”, Journal of Pharmacognosy and Phytochemistry, 7(2), 2152-2155.
http://www.phytojournal.com/archives/2018/vol7issue2/PartAE/7-2-212-272.pdf.
[15] Potdar J. (1988). “Agnihotra Krishi” (Book). [16] Priya Soni. (2015). “INDIAN CONSUMER’S ADOPTION OF A GREEN INNOVATION AND
SOCIAL IDENTITY-THE CASE OF ORGANIC FOOD.” Journal of commerce, economics &
computer science, 1(4), 1-23.
http://shodhganga.inflibnet.ac.in/bitstream/10603/204402/13/17publication%20paper.pdf. [17] S. Suganya, Dr. S. Aravinth. (2014). “ANALYSIS OF CONSUMERS’S PREFRENCE
TOWARDS ORGANIC FOOD PRODUCTS BASED ON PRODUCT PRICE”, Journal of
Business Management & Social Sciences Research, 3(12), 73-76. http://www.borjournals.com/a/index.php/jbmssr/article/viewFile/1907/1237.
[18] Sathyendra Kumar AD, Dr. H. M. Chandrashekar. (2015). “A STUDY ON CONSUMERS
BEHAVIOUR TOWARDS ORGANIC FOOD PRODUCTS IN MYSORE CITY”, International Journal of Management Research and Review, 5(11)(5), 1082-1091.
http://ijmrr.com/admin/upload_data/journal_Satyendra%20%20%205nov15mrr.pdf.
[19] Sofia P.K., Prasad R. and Vijay V.K. (2006). “ORGANIC FARMING-TRADITION
REINVENTED”, Indian journal of traditional knowledge,5(1), 139-142. http://www.niscair.res.in/ScienceCommunication/ResearchJournals/rejour/ijtk/Fulltextsearch/200
6/January%202006/IJTK-Vol%205(1)-January%202006-pp%20139-142.html.
[20] Soumya. K.M. (2015). “ORGANIC FARMING: AN EFFECTIVE WAY TO PROMOTE SUSTAINABLE DEVELOPMENT IN INDIA”, IOSR Journal of Humanities and Social Science
(IOSR-JHSS), 20(6), 31-36. http://www.iosrjournals.org/iosr-jhss/papers/Vol20-issue6/Version-
4/G020643136.pdf. [21] Vishal Kumar Laheri, Purushottam Kumar Arya. (2015). “A STUDY ON CONSUMER
DECISION TOWARDS PURCHASE OF ORGANIC FOOD PRODUCTS: A CASE STUDY OF
DELHI”, Indian Journal of Commerce & Management Studies, 6(2), 84-87.
Page 21
[Chattopadhyay et. al., Vol.7 (Iss.1): January 2019] ISSN- 2350-0530(O), ISSN- 2394-3629(P)
DOI: 10.5281/zenodo.2555291
Http://www.granthaalayah.com ©International Journal of Research - GRANTHAALAYAH [296]
http://www.scholarshub.net/ijcms/vol6/issue2/Paper_13.pdf. [22] www.apeda.gov.in
*Corresponding author.
E-mail address: anisam87@ gmail.com